wisconsin department of natural … · overwinter corn food plot in the spring. 3 . cocks on...
TRANSCRIPT

~ ~ WISCONSIN DEPARTMENT OF NATURAL RESOURCES
RESEARCH REPORT111
Abstract
April1996 ~
Winter Weather and Pheasant Populations and Harvests in Northwestern Wisconsin by James 0. Evrard
Bureau of Research, Grantsburg
A study was conducted during 1982-91 in northwest Wisconsin to examine the effects of winter weather on spring ring-necked pheasant (Phasianus co/chicus) populations and subsequent fall harvests and to determine pheasant harvest characteristics. The 502 mile2 study area was located in St. Croix and southern Polk counties, on the northern limit of pheasant range. Winter weather records were obtained from an Amery weather station, and a winter food availability index was developed by examining a random sample of 1 0% of the study area. Crowing pheasant cocks were censused throughout the study area, including Waterfowl Production Areas (WPAs) and Conservation Reserve Program (CRP) lands. Hunter bag checks were conducted during the first 2 days of the hunting season, while other hunters were asked to maintain season-long hunting diaries. Little food, in the form of standing corn, was available to pheasants in most winters. There was a significant negative relationship between winter severity and spring pheasant indices. Crowing cocks declined following winters with prolonged deep snow and subzero temperatures and increased following mild winters. There was a relationship between winter weather and spring crowing-cock trends and between spring crowing-cock trends and fall pheasant harvests. Trends in hunter bag checks during the first 2 days of the hunting season predicted total season bags. Inexpensive hunter diaries provided accurate trends in pheasant harvests and hunter success.

Cover photo credits: DNR photo archives, top J. Evrard, bottom
Contents Introduction, Study Area, 2
Methods, 3 Winter Severity and Food Availability Indices, 3 Crowing-Cock Counts, 3 Hunter Interviews, 4 Hunter Diaries, 4
Results and Discussion, 4 Winter Weather and Food Availability, 4 Crowing-Cock Counts, 6 Winter Weather and Spring Pheasant Populations, 8 Winter Weather and Fall Pheasant Harvests, 9 Pheasant Releases, 9 Hunter Success, 10
Conclusions and Management Recommendations, 12
Literature Cited, 14

The study area in winter resembles the arctic. (This is private agricultural/and, with no pheasant habitat.)
Introduction
The long-term downward trend in pheasant numbers across North America (Dahlgren 1988, Droege and Sauer 1990) has been caused by habitat losses in agricultural areas despite temporary increases brought about by federal farm programs such as the Conservation Reserve Program (CRP) (Langner 1989). Short-term fluctuations in pheasant populations can be caused by a variety of factors, including weather. Severe winter weather can have deleterious effects on ring-necked pheasants in northern regions. Kozicky et al. (1955) in Iowa and Gates (1971) and Dumke and Pils (1973) in Wisconsin thought short-term, year-to-year pheasant population fluctuations were controlled by direct and indirect effects of winter weather. Long-term population fluctuations, by contrast, were controlled by habitat quantity and quality.
Winters of prolonged snow cover lead to accelerated winter mortality through increased predation (Dumke and Pils 1973, Kenward et al. 1981, Grantham 1986, Petersen et al. 1988). Food shortage caused by persistent deep snow cover possibly causes higher spring mortality (Kabat et al. 1950, Gates 1971, Gates and Hale 1975, Penrod et al. 1986) and also a loss of body condition among surviving hens, which delays egg laying and results in smaller clutches.
Direct mortality from winter storms and starvation appears to be unusual in the Lake States (McCabe et al. 1956), including Wisconsin (Gates and Hale 1974) and Illinois (Labisky et al. 1964), but is more common farther west in Iowa (Green 1938, Scott and Baskett 1941 ), Minnesota (Erickson et al. 1951 ), North Dakota (Miller 1948), and South Dakota (Beed 1938, Kimball 1948, Bue 1949, Nelson and Janson 1949, Kimball et al. 1956, Trautman 1982).
McCabe et al. (1956) and Gates and Hale (1974) found winter food availability rather than winter cover to be the limiting factor for pheasants in Wisconsin. Following severe winters in Illinois, Warner and David (1982) documented drastic declines in crowing pheasants that were not related to winter cover, although they felt woody cover was still important to wintering pheasants.
This study was part of a larger research project to evaluate management techniques for increasing waterfowl and pheasant production in the pothole region of northwest Wisconsin (Evrard and Lillie 1987). Using methods similar to those developed by Wagner and Stokes (1968), I attempted to determine if relationships existed between winter weather and food availability and subsequent spring pheasant indices and fall hunter harvests. Pheasant harvest characteristics were also documented during the study period.

0 Watertowl Production Areas (WPA)
0 Conservation Reserve Program (CRP)
Figure 1. Study area map showing location of WPAs and CRP fields studied.
Study area landscape-wetland, rolling upland and cropland.
2
Study Area
Field research was conducted on a 502 mile2
study area in St. Croix and southern Polk counties, Wisconsin (Figure 1 ). The landscape was formed by a terminal moraine of the Superior lobe of the Wisconsin glaciation (Langton 1978). Up to 100 feet of glacial till overlies sandstone and dolomitic limestone bedrock. Soils are mainly sandy loams of the Santiago-Jewett-Magnor Association with topography level to gently sloping. The study area is about 85% uplands, 14% wetlands, and 1% water.
The area has a continental climate with warm, humid summers and cold, snowy winters (Langton 1978). Mean precipitation is 29.5 inches with 65% falling from May to September, and mean temperature is 44.1 a F. The growing season averages 135 days, with the average last spring frost occurring on 14 May and the average first frost on 26 September.
At the time of settlement, about 58% of St. Croix County was wooded, 27% was in tall grass prairie, and 15% was in wetlands and water (Langton 1978). Since settlement, the prairie and much of the woodland were converted to agriculture. Today, most of the land area is used for agricultural crops and pasture. Corn, oats, and hay are the main crops with emphasis on dairy and livestock production. Only 11% of the county is now wooded, but wetland losses have been minimal and still make up 13% of the area.

Approximately 7,000 acres, or 2.2% of the study area, are in state and federal Wildlife Management Areas (WMAs) and Waterfowl Production Areas (WPAs). Beginning in 1987, private agricultural land, entered in the federal CAP, was converted from cropland to permanent grass and trees. By 1990, nearly 42,000 acres, representing 15% of the cropland in St. Croix County, were in the CAP (Evrard, in prep.). Pheasant populations in the study area were rated as low (1-5 hens/mile2 in spring) in the early 1970s (Dumke and Pils 1973) and in the early 1980s (Dumke et al. 1984).
Methods Winter Severity and Food Availability Indices With weather records obtained from a National Oceanic and Atmospheric Administration weather station at Amery in the northeast corner of the study area, I developed a winter severity index by adding the number of days with snow deeper than 6 inches and the number of days when the temperature dropped below 0° F for the period November through April each winter. Gates and Hale (1974) determined that packed snow depths greater than 6 inches were sufficient to cover waste corn and create food stress among pheasants unless alternative food was available. Weston (1954) found that temperatures near and below 0° F restricted pheasant movements.
I also computed a winter severity index developed by Dumke and Woehler (1986) for bobwhite quail ( Co/inus virginianus) in southwest Wisconsin. They multiplied coded (1-5) average monthly minimum temperatures by the sum of coded (1-6) daily snow depths during the period December through March to obtain their "winter hardness" values.
To develop an availability index to winter food, I searched 1 0% of the study area each winter for the presence of standing overwinter corn. Fifty of the 502 sections in the study area totaling 32,128 acres were chosen for examination using a random numbers table. Locations and dimensions of standing corn fields were recorded on aerial photos to calculate acreages. Availability of corn food patches on WPAs was also recorded.
Crowing-Cock Counts Since crowing cocks are territorial (Wight 1933, Dale 1956, Goransson 1984), triangulation (Burger 1966, Gates 1966, Hutchison 1981 , Petersen et al. 1982) was used to map territories of individual crowing
~ ... ~~ .. '4 ..
lJ w1 H uun<
OPEN TO PUBLIC HUNTING u. 5 DEPAfHMtNT OF THE INTfRIOH
AND WILDliFE SfRVICr
Waterfowl Production Area sign.
Overwinter corn food plot in the spring.
3

cocks on selected WPAs and adjacent private lands during 1982-91 and selected CRP fields and adjacent lands during 1989-91. Since this effort was labor intensive, triangulation was used in the relatively small, discrete WPAs and CRP fields.
In the overall study area, I ran two 15-mile-long crowing-cock transects (Kimball 1949) on a northeast to southwest orientation a minimum of 2 times in late April and early May, 1982-91. The road transects began one-half hour before sunrise on clear, calm mornings. At 1-mile intervals, I would step away from the stopped vehicle and listen for 2 minutes, recording the number of pheasant crows and crowing cocks heard.
Since pheasant crowing rates vary by season, time of day, population density, and presence of hens (Nelson et al. 1962, Burger 1966, Gates 1966, Winterbottom 1992), I used the maximum number of different cocks rather than the number of crows heard at each of the stops during both runs to determine the spring cock index. I assumed I heard all crowing cocks within 0.5 mile of each stop since under ideal conditions crowing cocks can be heard up to 0.9 mile (Trautman 1982). I, in effect, triangulated the crowing cocks along the road transects. I expressed this index as the mean number of cocks heard per mile (stop) of transect or cocks/mile2. This would represent a minimum number since Burger (1966) thought that cocks counted at the 2-minute stops recorded only 71-92% of the territorial cocks present. In addition, not all cocks crow, especially at higher densities-apparently there are nonterritorial, noncrowing cocks (Dale 1956, Burger 1966, Goransson 1984).
Results from crowing-cock transects can be used to estimate total pheasant densities (Kimball et al. 1956, Wagner et al. 1965). Estimates of spring hen densities were determined from crowing-cock densities multiplied by winter sex ratios. Winter (posthunt) sex ratios were determined from pheasants observed during systematic and incidental roadside counts. Summing the cock and hen density estimates yielded the total spring pheasant density estimates.
Hunter Interviews Hunters were interviewed in the study area during the first 2 days of the 1982-91 hunting seasons. WDNR crews drove through the study area beginning at the noon opening of the first day of the season and in the early morning of the second day, counting all vehicles of suspected pheasant hunters on public and private lands. The number of hunters and vehicles involved in the actual interviews was also recorded.
4
Hunters encountered at various times of the day (not strictly after they had completed their hunt) were asked if they had bagged any pheasants and how many hours they had hunted. Any pheasants bagged were checked for the presence of bands, but ages were not determined. Unbanded pheasants were assumed to be wild-produced birds since all pheasants legally stocked in the study area were marked with WDNR aluminum leg bands (Evrard 1989). I was aware of a few pheasants illegally released in the study area but felt their numbers were insignificant.
Hunter numbers were determined by multiplying the number of vehicles counted in the study area by the mean number of hunters per vehicle involved in the interviews. Hunter success during the first 2 days of the season was determined by dividing the total pheasants checked by the number of hunters interviewed. Minimum estimated pheasant harvest for the first 2 days of the season was determined by multiplying hunter success by hunter numbers. Hunter effort was determined by calculating the number of hours hunted to bag a pheasant.
Hunter Diaries During 1983-91, select hunters were asked to maintain season-long diaries in which they recorded the number of banded and unbanded cocks shot in the study area. The hunters were not randomly selected but were obtained from a list of hunters who returned pheasant bands to the WDNR (Evrard 1989) and who offered to maintain diaries when contacted at an annual pheasant benefit banquet in St. Croix County. Season-long hunter success was determined bydividing the number of pheasants bagged by the number of hunters returning diaries. Hunters also volunteered information regarding the number of hunting trips and the number of cock and hen pheasants flushed during the hunting seasons.
I used the Epistat statistical package (Gustafson 1984) to calculate regression-correlation analyses to determine if relationships existed between winter weather, subsequent spring pheasant densities, and hunter harvests, and I used a paired ttest to determine differences between hunter success rates.
Results and Discussion
Winter Weather and Food Availability Winters in the study area were cold and snowy. Subzero temperatures sometimes began in December and continued until March. There was an average of 36 days each winter when temperatures

dropped below 0° F during the period 1982-91 (Table 1 ). Snow depths exceeding 6 inches averaged 59 days each winter during the same period and sometimes began in November and lasted through April. Gates and Hale (1974) found that snow covered the ground in depths exceeding 6 inches for an average of 48 days for 7 winters, December through March, 1958-65, in their Waupun study area in east-central Wisconsin. In my study, the winters of 1981-82, 1983-84, 1985-86, and 1988-89 were severe with deep, persistent snow cover and very cold temperatures. By contrast, the winter of 1986-87 was exceptionally mild with only 2 days when snow depths exceeded 6 inches and 10 days when temperatures dipped below zero.
Pheasant winter food, predominately in the form of overwinter standing corn, was a scarce commodity (Table 2). In most winters, only 0.2 of 1% of the study area was unharvested standing corn. These scattered corn fields were found in 16% of the sections examined. In 6 of the 9 winters, corn planted in WDNR and Pheasants Forever (Wooley et al. 1988) wildlife food patches was encountered in the survey. In those winters, wildlife food patches averaged 8% of the total standing corn acreage found. Fifty years ago in an earlier era of less intensive agriculture, overwinter standing corn was apparently more available. McCann (1939) reported finding standing corn in 2.4% to 10.5% of the land area in counties throughout Pennsylvania pheasant range, and in the same era, Bennett (1945) recommended a minimum of 4% of the land area to be in overwinter standing corn.
When the juxtaposition of the corn to winter cover (Wight 1933, Green 1938, Bue 1949) was examined, it was apparent that little winter food was available near winter concentrations of pheasants during severe winters. Standing corn, unless in large patches, has little value for pheasants if surrounded by bare, snow-covered fields. Locations of overwinter standing corn, other than wildlife food patches, occurred randomly in relation to winter pheasant cover. Gates
Rooster on fence post.
Table 1. Winter weather and severity indices, 1982-91.
Days (November-April)
Snow Temps. Winter Severity Indices
Winter > 6 inches < oo F Evrard" Kohnb Dumkec
1981-82 90 58 148 90 2063 1982-83 62 23 85 24 1139 1983-84 85 54 139 55 1835 1984-85 43 37 80 37 1085 1985-86 115 51 166 55 2166 1986-87 2 10 12 9 511 1987-88 51 32 83 32 1229 1988-89 81 44 125 45 1313 1989-90 12 22 34 22 642 1990-91 53 31 84 31 1185 Mean 59 36 95 40 1317
a Calculated by adding the days that snow depth exceeded 6 inches to the days that temperatures were below 0° F for the months November through April.
b Calculated by adding the days that snow depth exceeded 18 inches to the days that temperatures were below 0° F for the months December through March (Kohn 1976).
c Calculated by adding coded values for days of varying snow depths then multiplying those sums by coded values for the mean monthly minimum temperature (0-4.9° F = 5, 5-9.9° F = 4, 10-14.9° F = 3, 15-19.9° F = 2, 20+° F = 1) for the months of December through March (Dumke and Woehler 1986).
Table 2. Annual survey of 10% (32, 128 acres) of the 502 mi!e2 study area for standing corn, 1983-91.
Mean Field Total Number Winter Size (acres) Acres Sections Index•
1982-83 5.9 70(0.2)b 8 (16) 9 1983-84 9.3 93 (0.3) 9 (18) 10 1984-85 4.5 27 (0.1) 5 (10) 5 1985-86 23.1 1,177(3.7) 34 (68) 35 1986-87 7.3 125 (0.4) 13 (26) 10 1987-88 7.9 95 (0.3) 11 (22) 9 1988-89 3.9 58 (0.2) 10 (20) 6 1989-90 2.3 26 (0.1) 8 (16) 3 1990-91 6.7 88 (0.3) 9 (18) 10
a Determined by dividing the acreage of corn by the number of sections in which it was found.
b Number in ( ) is percentage.
5

and Hale (1974) also found winter food to be in chronically short supply in their east-central Wisconsin study area. They found that in most winters less than 5% of the pheasant population had access to standing corn.
A notable exception in this study was the winter of 1985-86. Extremely wet soils due to heavy fall rains severely reduced the corn harvest. Early deep snows prevented the soils from freezing, and farmers were forced to leave their corn standing over winter (Table 2). Corn was available in nearly 70% of the sections searched, and the acreage was 16 times greater than normal. The mean field size of 23 acres was nearly 4 times larger than in other years. Standing corn in fields of 5-10 acres can function as both winter food and cover (Anon. 1988).
Crowing-Cock Counts Crowing-cock trends on my study area transects were positively correlated (r= +0.746, n = 10, P < 0.01) with crowing-cock trends on WPAs. A correlation with weak statistical significance (r = +0.990, n = 3, P < 0.09) also existed between crowing-cock trends on WPAs and crowing-cock trends on CRP lands. This weak statistical significance was, no doubt, due to comparing crowing-cock trends on WPAs and CRP lands for only 3 years. These results suggest that similar environmental factors were controlling
Pheasant nesting cover.
6
pheasant populations in WPAs, CRP lands, and throughout the study area. Densities of crowing cocks on WPAs were, on the average, 2-3 times higher than in the study area (Figure 2), no doubt due to better habitat existing on WPAs than on private farmland.
Mean spring pheasant densities in the study area were 0.8 cocks and 1.5 hens/mile2 during the 10 years (Table 3). The small number of pheasants used to determine sex ratios during the winters of 1985-86, 1986-87, 1987-88, and 1989-90 increased the variability and decreased the validity of the density estimates for 1986, 1987, 1988, and 1990. The mean hen density, however, falls within the low category (1-5 hens/mile2
in the spring) of Dumke and Pils (1973). On WPAs, probably representing the best
available habitat, spring densities were much higher-9.8/mile2 (3.2 cocks and 6.6 hens). For the 3 years where comparable data were available, densities were very similar for WPAs (11.8/mile2)
and CRP lands (12.8/mile2). While wildlife management lands (including WPAs) may influence local pheasant abundance, numbers over a broader area are related to regional habitat conditions (Edwards 1988). Areas with public wildlife lands had substantially higher spring pheasant densities than areas without public lands in South Dakota (Elliot and Linder 1972) and Minnesota (Hutchison 1981 ).

6 D Study Area
• Waterfowl Production Areas (WPA)
5
4
3
2
1982 83 84 85 86 87 88 89 90 91
Year
Figure 2. Spring cock densities on the study area and WPAs.
Table 3. Spring pheasant indices, 1982-91.
Winter Sex Ratio Study Areaa
Year (Hens/Cock) Cocks Hense Total
1982 1.3(120)d 1.0 1.3 2.3 1983 1.8 (91) 1.3 2.3 3.6 1984 6.2 (58) 0.3 1.9 2.2
1985 3.2 (50) 0.4 1.3 1.7 1986 0.4 (24) 0.5 0.2 0.7
1987 0.5 (6) 0.9 0.4 1.3 1988 2.5 (21) 0.9 2.2 3.1
1989 3.1 (57) 0.6 1.9 2.5
1990 1.2 (22) 1.1 1.3 2.4
1991 1.7 (41) 1.4 2.4 3.8 Mean 2.2(490) 0.8 1.5 2.3 a Crowing cocks censused by road transects. b Crowing cocks censused by triangulation.
Pheasant nest.
Birds/mile2
WPAsb
Cocks Hens Total
2.6 3.4 6.0 3.0 5.4 8.4 2.0 12.4 14.4
2.6 8.3 10.9 2.0 0.8 2.8 3.2 1.6 4.8 4.4 11.0 15.4 2.6 8.1 10.7
4.4 5.3 9.7 5.6 9.5 15.1 3.2 6.6 9.8
c Derived by multiplying the estimated cock density by the winter sex ratio (hens/cock). d Number in () is sample size.
CRPb
Cocks Hens Total
2.7 8.4 11.1 5.1 6.1 11.2 6.0 10.2 16.2 4.6 8.2 12.8
7
>< "' 't:l
.E: ~ ·.::: "' > "' (f) ..... 2 t:
~
140 '
120
100
80
60
40
• •
• • •
•
1.8 2.3 2.8 3.3 3.8 4.3 4.8 5.3 5.8
Crowing Cocks/Mile2
of WPA
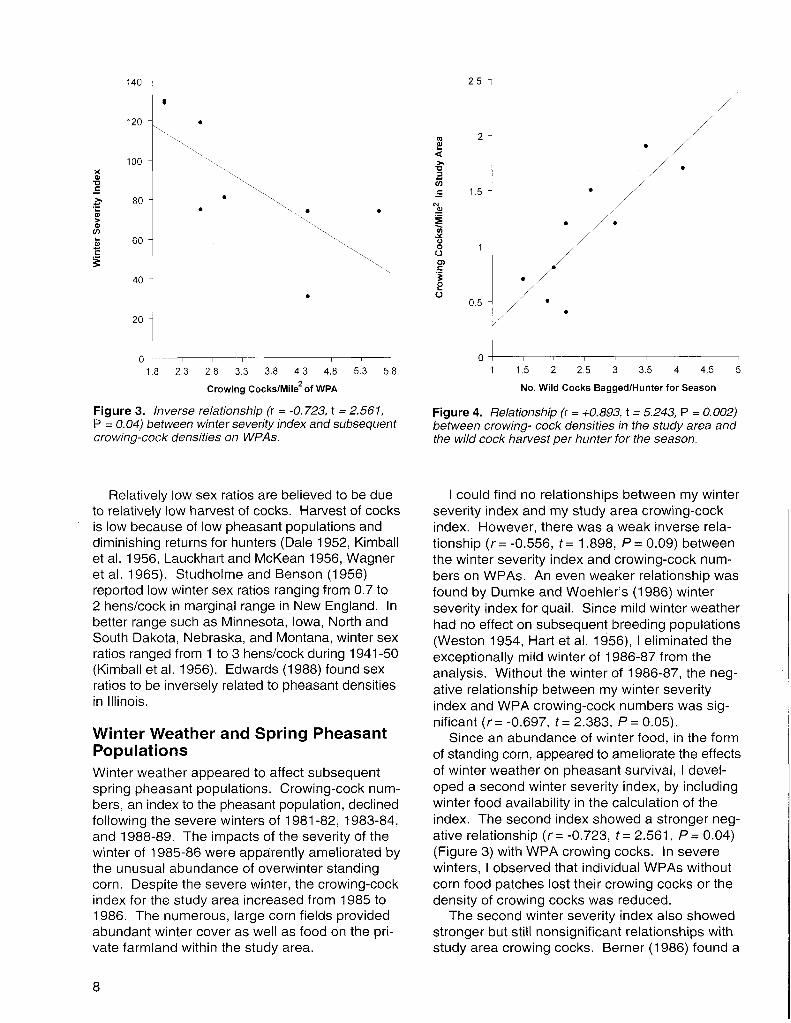
Figure 3. Inverse relationship (r = -0.723, t = 2.561, P = 0.04) between winter severity index and subsequent crowing-cock densities on WPAs.
Relatively low sex ratios are believed to be due to relatively low harvest of cocks. Harvest of cocks is low because of low pheasant populations and diminishing returns for hunters (Dale 1952, Kimball et al. 1956, Lauckhart and McKean 1956, Wagner et al. 1965). Studholme and Benson (1956) reported low winter sex ratios ranging from 0.7 to 2 hens/cock in marginal range in New England. In better range such as Minnesota, Iowa, North and South Dakota, Nebraska, and Montana, winter sex ratios ranged from 1 to 3 hens/cock during 1941-50 (Kimball et al. 1956). Edwards (1988) found sex ratios to be inversely related to pheasant densities in Illinois.
Winter Weather and Spring Pheasant Populations Winter weather appeared to affect subsequent spring pheasant populations. Crowing-cock numbers, an index to the pheasant population, declined following the severe winters of 1981-82, 1983-84, and 1988-89. The impacts of the severity of the winter of 1985-86 were apparently ameliorated by the unusual abundance of overwinter standing corn. Despite the severe winter, the crowing-cock index for the study area increased from 1985 to 1986. The numerous, large corn fields provided abundant winter cover as well as food on the private farmland within the study area.
8
2.5
<0 2 f! < ,., 't:l .a (f)
·= 1.5 • N ..!!! ~ • • (ij -"' <> 0 (.) C) t: ":§ • e (.)
0.5 • •
0+---,---,---,--,---,---,---,---,
1.5 2 2.5 3 3.5 4 4.5 5
No. Wild Cocks Bagged/Hunter for Season
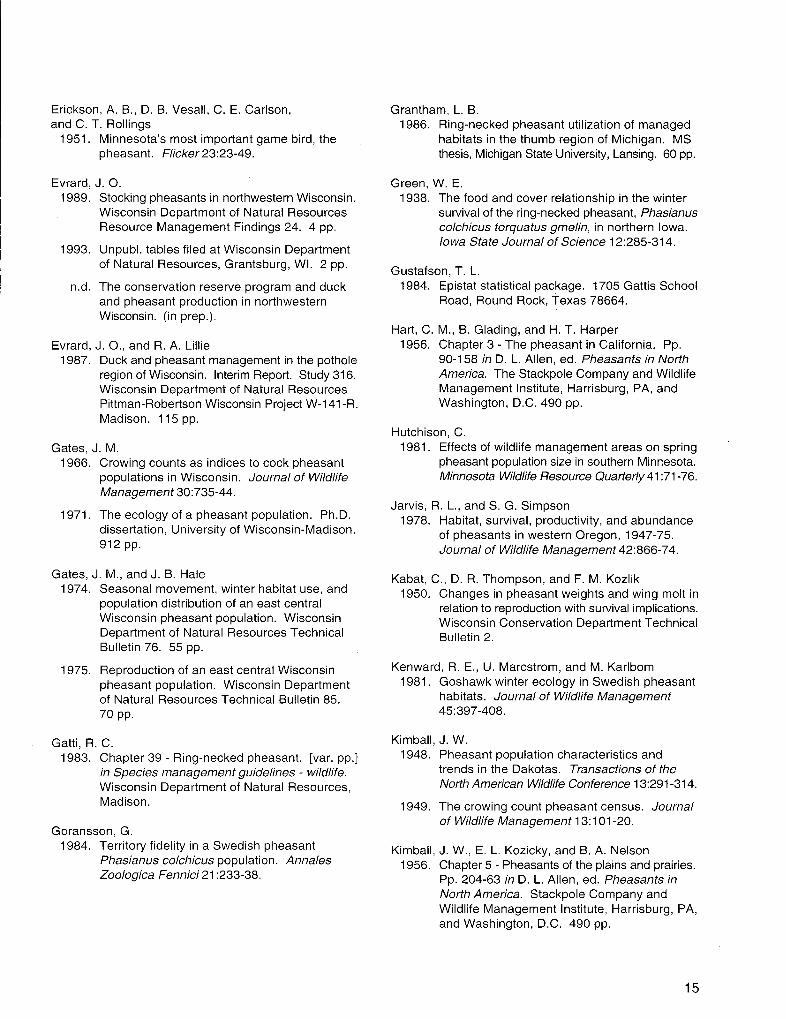
Figure 4. Relationship (r = +0.893, t = 5.243, P = 0.002) between crowing- cock densities in the study area and the wild cock harvest per hunter for the season.
I could find no relationships between my winter severity index and my study area crowing-cock index. However, there was a weak inverse relationship (r = -0.556, t = 1.898, P = 0.09) between the winter severity index and crowing-cock numbers on WPAs. An even weaker relationship was found by Dumke and Woehler's (1986) winter severity index for quail. Since mild winter weather had no effect on subsequent breeding populations (Weston 1954, Hart et al. 1956), I eliminated the exceptionally mild winter of 1986-87 from the analysis. Without the winter of 1986-87, the negative relationship between my winter severity index and WPA crowing-cock numbers was significant (r = -0.697, t = 2.383, P = 0.05).
Since an abundance of winter food, in the form of standing corn, appeared to ameliorate the effects of winter weather on pheasant survival, I developed a second winter severity index, by including winter food availability in the calculation of the index. The second index showed a stronger negative relationship (r = -0.723, t = 2.561, P = 0.04) (Figure 3) with WPA crowing cocks. In severe winters, I observed that individual WPAs without corn food patches lost their crowing cocks or the density of crowing cocks was reduced.
The second winter severity index also showed stronger but still nonsignificant relationships with study area crowing cocks. Berner (1986) found a

significant relationship between a winter severity index based upon the mean maximum snow depth for December through March and a subsequent May cock- population index in the southern third of Minnesota. Jarvis and Simpson (1978) found overwinter survival to be positively correlated with pheasant abundance. However, earlier in Wisconsin, Wagner and Stokes (1968) found that only 28% of the variability in their spring hen index could be attributed to overwinter survival. They concluded that the size of the spring hen index was determined by the previous fall population index.
Winter Weather and Fall Pheasant Harvests 1 could find no relationships between winter weather and pheasant harvests the following fall. Wagner and Stokes (1968) also did not find any relationship between their overwinter survival index and the fall statewide harvest index in Wisconsin. However, 1 did find a very strong positive relationship (r= +0.850, t= 4.272, P= 0.004) between spring crowing-cock indices on study area t_ransects and fall wild cock harvests for the ent1re season (Figure 4). The same was true for wild cock harvests for the first 2 days of the hunting season (r= +0.751, t= 3.220, P= 0.01). Wagner et al. (1965) and Wagner and Stokes (1968) also found significant correlations between spring hen densities and fall cock harvests. Snyder (1985) thought crowing-cock indices were general predictors of fall population levels.
Pheasant Releases During the period 1982-89, a minimum of 16,566 pen-reared pheasant cocks were released in the study area in late summer and early fall prior to the hunting seasons (Table 4). The bulk of the birds were raised by the St. Croix Alliance of Sportsmen's Clubs in cooperation with the . WDNR's Day-Old-Chick Program and released 1n late August and early September. An in-depth analysis of the stocking program was presented in a previous publication (Evrard 1989).
First-year recovery rates have averaged 10% during the period 1982-89 (Table 4). Second-year recovery rates averaged only 0.4%, and only a trace was recovered in the third year following release.
Table 4. Recovery of pen-reared cocks released in study area, 1982-89.
Percent Recovery•
Birds First Second Third Year Released Year Year Year Total
1982 1,380 4.7 0.6 0.1 5.4 1983 1,668 8.0 0.8 0.1 8.9 1984 1,372 12.9 0.5 13.4 1985 1,556 8.2 0.1 8.3 1986 1,642 12.1 0.6 0.1 12.8 1987 1,642 13.9 0.3 0.1 14.3 1988 1,485 10.1 0.1 10.2 1989 1,899 10.2 10.2 Mean 1,580 10.0 0.4 Tr 10.4
a Hunter recoveries (88.5%), roadkills (6.7%) and others (4.8%) including predators, disease, etc.
Banding pen-reared pheasants.
9

Of the recoveries, 88% were shot by hunters, 7% were roadkills, and 5% died from other causes. This indicated that few cocks stocked in late summer survived to potentially become part of the breeding population and therefore did not bias the relationship I found between winter weather and the spring pheasant population. Earlier Wagner et al. ( 1965) concluded that stocking pheasants increased the kill but did not affect wild bird numbers.
Hunter Success Hunter success the first 2 days of the season averaged 0.2 cocks bagged per hunter per hunter day during 1982-91 (Table 5) (Figure 5). The daily bag limit during the 2 days was 1 cock. In a discussion on successful harvest management, Edwards (1988) highlighted a long-term study by Leite (1965), in which only 0.2 cocks/hunter/day were bagged in 1962 on a heavily hunted 6,000-acre public area
Table 5. Hunter success and cock harvests, 1982-91.
First 2 Days: Cocks/hunter/day % cocks banded Hours/cock
Season:
... 2 " :::l :c (;; -" u 0 (.)
Cocks/hunter % Cocks banded
6 :
5
4
3
2
0
D 1st 2 Days
• Season
n I I
1982
0.14 56 50.0
5.1 20
I
1983 1984 1985
0.28 0.23 0.07 30 55 25
8.3 11.1 20.0
4.1 2.9 2.8 47 35 47
I I r I 1982 83 84 85 86 87 88 89 90 91
Year
Figure 5. Hunter success during the first 2 days of the hunting season and the whole season.
10
in Ohio having a total season harvest of 1 cock/ 2 acres. Hunter effort expressed as hours hunted per cock bagged during the first 2 days of the season in my study averaged 19.7 and ranged from a low of 6.7 in 1987 to a high of 50.0 in 1982 and 1989 (Table 5). This compares to 2.6 hours hunted/cock bagged in South Dakota in years with a 2-bird limit (Trautman 1982); 16.0 hours in Ohio in 1962 (Leite 1965); and 24.4 and 32.5 hours in 1984 and 1985 in Michigan (Grantham 1986).
Since the hunters who maintained season-long hunting diaries were not selected at random, one bias associated with mail surveys (Hart et al. 1956, Kimball et al. 1956, Wagner et al. 1965, Edwards 1988), low return rates, was avoided. However, hunters who maintained diaries were significantly (t = 5.969, n = 9, P = 0.0003) more successful during the first 2 days of the season than hunters checked in the field (0.2 vs. 0.4 birds/hunter/day).
1986
0.13 57 16.7
4.7 36
.... " "' ~ "' a.
1987
0.35 57
6.7
3.2 32
10
1988
0.20 38 10.0
3.1 35
~\ ~
1989
0.03 0
50.0
3.2 19
1990 1991 Mean
0.11 0.20 0.17 0 14 33
16.7 7.1 19.7
4.5 3.7 3.7 26 33 33
05. ~
-t---;-1---,--1 ..,-----,-~~~' '*+'-~~~ I 0 2 4 6 8 10 12 14 16 18 20 22 24 26 28 30
Mean Season Cock Harvest
Figure 6. Season cock-harvest distribution among hunters.

The hunters maintaining diaries reported seeing an average of 9.5 cocks and 13.3 hens during 6 hunting trips each season during 1982-91. They reported shooting an average 3.7 cocks each season (Table 5). One quarter of the hunters reported shooting no birds while a few hunters reported shooting as many as 26 birds in a single season (Figure 6). Trautman (1982) reported a mean season kill of 4.8 cocks in South Dakota for seasons with a 2-bird daily bag limit.
In this study, the pen-reared (banded) cocks averaged 33% of the bag during the 10 years for the first 2 days and for the whole season. The percent banded cocks in the harvest increased in years following severe winters when wild pheasant populations declined (Figure 7). Likewise,
Table 6. Season cock harvest distribution, 1983-91.
Unbanded Cocks Week of Percent of Season a Season Harvest No. (%)
32 228 (62) 2 20 145 (64) 3 14 115 (71) 4 10 74 (68) 5 7 56 (68) 6 4 36 (80) 7 6 55 (83) 8 7 64 (83)
Total 100 773 (68)
the percent banded cocks decreased in the bag in years of higher wild pheasant numbers. Thirty years earlier in Wisconsin, Besadny and Wagner (1963) found stocked day-old-chick program birds making up 38% (range 16-64%) of the total kill in poor range, 27% (range 13-38%) in fair range, and 5% in good to very good range. Statewide, they found stocked birds made up 15-20% of the harvest.
As the hunting season progressed, the percentage of the pen-reared harvested cocks declined (Table 6). During the first week of the season, an average of 38% of the cocks bagged were banded (pen-reared). By the last week of the season, only 17% of the cocks shot were banded. In Wisconsin, stocked birds made up a higher percentage
Banded Cocks Total Cocks
No. (%) No. (%)
139 (38) 367 (100) 80 (36) 225 (100) 47 (29) 162 (100) 35 (32) 109 (100) 27 (32) 83 (100)
9 (20) 45 (100) 11 (17) 66 (100) 13 (17) 77 (100)
361 (32) 1 '134 (100)
asaturday to Friday beginning in late October and continuing to early December.
0 o+---~---,---~---,--~--~---,
1983 84 85 86 87 88 89 90 91 2 3 4 5 6 7 8
Year Week of Season
Figure 7. Season pen-reared and wild cock harvest. Figure 8. Cock-harvest distribution by week of season.
11

35 l
30~, ' • -V> 25
"' i': "' I -"' u 20 0 u ~
0
15l ~ 'E "' e
10 I "' 0..
5 ~
o-r---,----,----,---~---,---,
Sat Sun Men Tue Wed Thu Fri
Day
Figure 9. Cock-harvest distribution by day of week.
Voluntary band return box.
12
of the kill early in the season and in poor range (38%) compared to good range (5%) with a mean of 27% (Besadny and Wagner 1963).
In this study, 32% of the total cock harvest was taken during the first week of the season and steadily declined during the next 5 weeks, rebounding during the last 2 weeks of the season when there was usually snow on the ground (Figure 8). Most (59%) of the pheasants were bagged on the weekend (Table 7) (Figure 9). The percent of harvest dropped on Monday, Tuesday, and Wednesday, leveling off on Thursday and Friday. This trend was probably a reflection of the hunting pressure. The same pattern was reported in Ohio by Leedy and Hicks (1945) and in Michigan by Allen (1947).
Results from hunter surveys conducted the first 2 days of the season were indicative of hunter success for the whole hunting season. There was a strong positive relationship ( r = +0.890, t = 5.163, P = 0.001) between wild cock harvest for the first 2 days of the season and for the whole season. The relationship was similar (r = +0.835, t = 4.017, P = 0.005) for the total cock harvest for the first 2 days of the season and for the whole season. Kimball et al. (1956) recommended random mail surveys over hunter checks, due to lower costs associated with mail surveys. Austin and Penrod (1983) also recommended mail surveys to determine hunting success.
Hunting pressure impacted pheasant harvests. There was a significant positive relationship between the number of hunters estimated to be in the study area during the first 2 days of the hunting season and the total season wild cock harvest (r = +0.743, t = 2.940, P = 0.02) and the total season cock harvest (pen-reared and wild) (r= +0.705, t = 2.630, P = 0.03). Apparently, hunter numbers increased in response to perceived higher pheasant populations. Previous research also found higher hunter counts evident during years of high pheasant population and lower hunting pressure during years of low pheasant populations (Edwards 1988, Solberg and Anderson 1990).
Conclusions and Management Recommendations Severe winters with deep snows and cold temperatures negatively impact subsequent breeding pheasant densities. Since winter cover and food are apparently limiting factors in the northern edge

of the pheasant range, provision of winter food should rate high in pheasant management as earlier researchers recommended (Gates and Hale 1974). The best way to ensure a winter food supply is to leave standing corn adjacent to good winter cover, a recommended management technique of an earlier time (McCabe et al. 1956) and still valid today (Gatti 1983). A standing corn plot must be at least 5 acres in size to provide both food and cover value. Smaller plots can be used if adjacent to winter cover. Plots less than 1 acre in size tend to fill with drifting snow in northwestern Wisconsin, making them unusable tor pheasants (Evrard 1993).
Spring cock indices are predictive of wild cock harvests in the fall. Apparently overwinter survival of breeding pheasants has more impact upon tall harvest levels than reproductive success. Petersen et al. (1988), summarizing earlier research, stated that pheasant population fluctuations appeared to be regulated principally by mortality, with reproduction performance being secondary. Stocked cocks contributed to the harvest, especially in years of low wild pheasant numbers, but contributed very little to the wild breeding population.
The cock harvest index during the first 2 days of the hunting season is predictive of the harvest for the whole season. Since the opposite is also true, inexpensive hunter diaries can replace expensive field bag checks to obtain a valid measure of hunter success. The bulk of the harvest takes place early in the season and on weekends. This trend is more pronounced with stocked birds than wild birds.
Table 7. Distribution of cock harvest by day, 1983-91.
Number of Cocks Bagged
Year Sat Sun Mon Tue Wed
1983 23 16 6 3 5 1984 26 16 6 2 3 1985 35 26 14 8 7 1986 23 16 2 9 4 1987 62 37 23 17 8 1988 53 49 12 8 5 1989 37 42 13 5 9 1990 51 51 15 11 12 1991 63 50 18 21 18 Total 373 303 109 84 71 Mean 41 34 12 9 8 Percent 32 27 10 7 6
Thu Fri Total
6 8 67 4 4 61 7 4 101 8 6 68
15 23 185 8 14 149
11 8 125 22 16 178 18 13 201 99 96 1 '135 11 11 126 9 9 100
13

Literature Cited Allen, D. L.
1947. Hunting as a limitation to Michigan pheasants. Journal of Wildlife Management 11:232-43.
Anonymous 1988. Food/cover plots for pheasants and other
wildlife. Pheasants Forever, St. Paul, MN. Leaflet.
Austin, D. E., and B. Penrod 1983. A comparison of techniques used to measure
ring-necked pheasant productivity in western New York. Pp. 104-09 in R. T. Dumke, R. B. Stiehl, and R. B. Kahl, eds. Perdix Ill: Gray partridge and ring-necked pheasant workshop. Wisconsin Department of Natural Resources and University of Wisconsin-Green Bay, 28-30 March 1983, Cambellsport, WI. 203 pp.
Beed, W. E. 1938. Do fur-bearers affect upland game birds in the
winter? Transactions of the North American Wildlife Conference 3:508-10.
Bennett, L. S. 1945. The pheasant in Pennsylvania and New
Jersey. Pp. 11-31 in W. L. McAee, ed. The ringnecked pheasant. American Wildlife Institute, Washington, D.C. 320 pp.
Berner, A. H. 1986. Effects of hunting seasons on pheasant popu
lations. Minnesota Department of Natural Resources Wildlife Report 4. 17 pp.
Besadny, C. D., and F. H. Wagner 1963. An evaluation of pheasant stocking through
the day-old-chick program in Wisconsin. Wisconsin Conservation Department Technical Bulletin 28. 84 pp.
Bue, I. G. 1949. Winter behavior and mortality of pheasants in
relationship to various types of cover, food and predation. Final report of the South Dakota Pittman-Robertson Projects 19-D-2 and 17-R-3. 43 pp.
Burger, G. V. 1966. Observations on aggressive behavior of male
ring-necked pheasants in Wisconsin. Journal of Wildlife Management 30:57-64.
14
Dahlgren, R. B. . 1988. Distribution and abundance of the nng-necked
pheasant in North America. Pp. 29-43 in D. L. Hallet, W. R. Edwards, and G. V. Burger, eds. Pheasants: symptoms of wildlife problems on agricultural lands. Proceedings of the 49th Midwest Wildlife Conference, 8 December 1987, Milwaukee, WI. Northcentral Section of the Wildlife Society. 345 pp.
Dale, F. H. 1952. Sex ratios in pheasant research and manage
ment. Journal of Wildlife Management 16:156-63.
1956. Chapter 1 - Pheasants and pheasant populations. Pp. 1-42 in D. L. Allen, ed. Pheasants in North America. The Stackpole Company and the Wildlife Management Institute, Harrisburg, PA, and Washington, D.C. 490 pp.
Droege, S., and J. R. Sauer 1990. Northern bobwhite, gray partridge, and ring
necked pheasant population trends (1966-1988} from the North American breeding bird survey. Pp. 2-10 inK. E. Church, R. E. Warner, and S. J. Brady, eds Perdix V: Gray partridge and ring-necked pheasant workshop. Minnesota Department of Natural Resources, 31 July-3 August 1989, Mankato, MN. 413 pp.
Dumke, R. T., and C. M. Pils 1973. Mortality of radio-tagged pheasants on the
Waterloo Wildlife Area. Wisconsin Department of Natural Resources Technical Bulletin 72. 52 pp.
Dumke, R. T., and E. E. Woehler 1986. Computation of "winter hardness" values.
Wisconsin Department of Natural Resources, Madison. Mimeographed. 1 p.
Edwards, W. R. 1988. Realities of "population regulation" and harvest
management. Pp. 307-35 in D. L. Hallet, W. R. Edwards, and G. V. Burger, eds. Pheasants: Symptoms of wildlife problems on agricultural lands. Proceedings of the 49th Midwest Wildlife Conference, 8 December 1989, Milwaukee, WI. Northcentral Section of the Wildlife Society. 345 pp.
Elliot, C. R., and R. L. Linder 1972. Use of state and private lands by pheasants
and waterfowl in South Dakota. American Midland Naturalist 88:257-61.
Erickson, A. B., D. B. Vesall, C. E. Carlson, and C. T. Rollings
1951. Minnesota's most important game bird, the pheasant. Flicker 23:23-49.
Evrard, J. 0. 1989. Stocking pheasants in northwestern Wisconsin.
Wisconsin Department of Natural Resources Resource Management Findings 24. 4 pp.
1993. Unpubl. tables filed at Wisconsin Department of Natural Resources, Grantsburg, WI. 2 pp.
n.d. The conservation reserve program and duck and pheasant production in northwestern Wisconsin. (in prep.).
Evrard, J. 0., and R. A. Lillie 1987. Duck and pheasant management in the pothole
region of Wisconsin. Interim Report. Study 316. Wisconsin Department of Natural Resources Pittman-Robertson Wisconsin Project W-141-R. Madison. 115 pp.
Gates, J. M. 1966. Crowing counts as indices to cock pheasant
populations in Wisconsin. Journal of Wildlife Management 30:735-44.
1971. The ecology of a pheasant population. Ph.D. dissertation, University of Wisconsin-Madison. 912 pp.
Gates, J. M., and J. B. Hale 1974. Seasonal movement, winter habitat use, and
population distribution of an east central Wisconsin pheasant population. Wisconsin Department of Natural Resources Technical Bulletin 76. 55 pp.
1975. Reproduction of an east central Wisconsin pheasant population. Wisconsin Department of Natural Resources Technical Bulletin 85. 70 pp.
Gatti, R. C. 1983. Chapter 39 - Ring-necked pheasant. [var. pp.)
in Species management guidelines - wildlife. Wisconsin Department of Natural Resources, Madison.
Goransson, G. 1984. Territory fidelity in a Swedish pheasant
Phasianus colchicus population. Annates Zoo/ogica Fennici 21:233-38.
Grantham, L. B. 1986. Ring-necked pheasant utilization of managed
habitats in the thumb region of Michigan. MS thesis, Michigan State University, Lansing. 60 pp.
Green, W. E. 1938. The food and cover relationship in the winter
survival of the ring-necked pheasant, Phasianus co/chicus torquatus gmelin, in northern Iowa. Iowa State Journal of Science 12:285-314.
Gustafson, T. L. 1984. Epistat statistical package. 1705 Gattis School
Road, Round Rock, Texas 78664.
Hart, C. M., B. Glading, and H. T. Harper 1956. Chapter 3 -The pheasant in California. Pp.
90-158 in D. L. Allen, ed. Pheasants in North America. The Stackpole Company and Wildlife Management Institute, Harrisburg, PA, and Washington, D.C. 490 pp.
Hutchison, C. 1981. Effects of wildlife management areas on spring
pheasant population size in southern Minnesota. Minnesota Wildlife Resource Quarterly 41 :71-76.
Jarvis, R. L., and S. G. Simpson 1978. Habitat, survival, productivity, and abundance
of pheasants in western Oregon, 1947-75. Journal of Wildlife Management 42:866-7 4.
Kabat, C., D. R. Thompson, and F. M. Kozlik 1950. Changes in pheasant weights and wing molt in
relation to reproduction with survival implications. Wisconsin Conservation Department Technical Bulletin 2.
Kenward, R. E., U. Marcstrom, and M. Karlbom 1981 . Goshawk winter ecology in Swedish pheasant
habitats. Journal of Wildlife Management 45:397-408.
Kimball, J. W. 1948. Pheasant population characteristics and
trends in the Dakotas. Transactions of the North American Wildlife Conference 13:291-314.
1949. The crowing count pheasant census. Journal of Wildlife Management 13:101-20.
Kimball, J. W., E. L. Kozicky, and B. A. Nelson 1956. Chapter 5 - Pheasants of the plains and prairies.
Pp. 204-63 in D. L. Allen, ed. Pheasants in North America. Stackpole Company and Wildlife Management Institute, Harrisburg, PA, and Washington, D.C. 490 pp.
15

Kohn, B. E. 1976. Winter severity measurements. Wisconsin
Department of Natural Resources Final Report Pittman-Robertson Project W-141-R-1 0. Madison. Mimeographed. 8 pp.
Kozicky, E. L., G. 0. Hendrickson, P. G. Homeyer, and R. Nomsen
1955. Weather and fall pheasant populations in Iowa. Journal of Wildlife Management 19:136-42.
Labisky, R. F., J. A. Harper, and F. Greely 1964. Influence of land use, calcium, and weather on
the distribution and abundance of pheasants in Illinois. Illinois Natural History Survey Biological Notes 51. 19 pp.
Langner, L. L. 1989. Land-use changes and hunter participation:
The case for the conservation reserve program. Transactions of the North American Wildlife and Natural Resource Conference 54:382-90.
Langton, J. E. 1978. Soil survey of St. Croix County, Wisconsin.
USDA Soil Conservation Service, Washington, D.C. 145 pp.
Lauckhart, J. B., and J. W. McKean 1956. Chapter 2- Chinese pheasants in the northwest.
Pp. 43-89 in D. L. Allen, ed. Pheasants in North America. The Stackpole Company and Wildlife Management Institute, Harrisburg, PA, and Washington, D.C. 490 pp.
Leedy, D. L., and L. E. Hicks 1945. The pheasants in Ohio. Pp. 57-130 in W. L.
McAtee, ed. The ringnecked pheasant. American Wildlife Institute, Washington, D.C. 320 pp.
Leite, E. A. 1965. Farm game hunting pressure and harvest on
the Delaware Wildlife Area. Game Research in Ohio 3:27-37.
McCabe, R. A., R. A. MacMullan, and E. H. Dustman 1956. Chapter 6 - Ringneck pheasants in the great
lakes region. Pp. 264-356 in D. L. Allen, ed. Pheasants in North America. The Stackpole Company and Wildlife Management Institute, Harrisburg, PA, and Washington, D.C. 490 pp.
McCann, L. J. 1939. Studies of the grit requirements of certain upland
game birds. Journal of Wildlife Management 3:31-41.
16
Miller, W. L. 1948. Pheasants killed by blizzard. North Dakota
Outdoors 10:4-10.
Nelson, B. A., and R. G. Janson 1949. Starvation of pheasants in South Dakota.
Journal of Wildlife Management 13:308-09.
Nelson, R. D., I. 0. Buss, and G. A. Baines 1962. Daily and seasonal crowing frequency of ring
necked pheasants. Journal of Wildlife Management 26:269-72.
Petersen, L. R., M. A. Martin, J. M. Cole, J. R. March, and C. M. Pils
1982. Evaluation of waterfowl production areas in Wisconsin. Wisconsin Department of Natural Resources Technical Bulletin 135. 32 pp.
Petersen, L. R., R. T. Dumke, and J. M. Gates 1988. Pheasant survival and the role of predation.
Pp. 165-96 in D. L. Hallet, W. R. Edwards, and G. V. Burger, eds. Pheasants: Symptoms of wildlife problems on agricultural lands. Proceedings of the 49th Midwest Wildlife Conference, 8 December 1987, Milwaukee, WI. Northcentral Section of the Wildlife Society. 345 pp.
Penrod, B. D., D. E. Austin, and J. W. Hill 1986. Mortality, productivity and habitat use of hen
pheasants in western New York. New York Fish and Game 33:67-123.
Scott, T. G., and T. S. Baskett 1941. Some effects of the 1940 Armistice Day storm
on Iowa's wildlife. Iowa Bird Life 11 :23-29.
Snyder, W. D. 1985 Management procedures for ring-necked
pheasants in Colorado. Colorado Division Wildlife Special Report 59. 53 pp.
Solberg, K., and J. Anderson 1990. Pheasant abundance, hunter and harvest
trends on Lac Qui Parle wildlife management area, 1979-88. Pp. 174-81 in K. E. Church, R. E. Warner, and S. J. Brady, eds. Perdix V: Gray partridge and ring-necked pheasant workshop. Minnesota Department of Natural Resources, 31 July-3 August, 1989, Mankato, MN. 413 pp.
Studholme, A. T., and D. Benson 1956. Chapter 8 - The pheasant in the northeastern
states. Pp. 388-430 in D. L. Allen, ed. Pheasants in North America. The Stackpole Company and Wildlife Management Institute, Harrisburg, PA, and Washington, D.C. 490 pp.

Trautman, C. G. 1982. History, ecology and management of the ring
necked pheasant in South Dakota. South Dakota Department of Game, Fish and Parks Wildlife Research Bulletin 7. 118 pp.
Wagner, F. H., C. D. Besadny, and C. Kabat 1965. Population ecology and management of
Wisconsin pheasants. yYisconsin Conservation Department Technical Bulletin 34. 168 pp.
Wagner, F. H., and A. W. Stokes 1968. Indices to overwinter survival and productivity
with implications for population regulation in pheasants. Journal of Wildlife Management 32:32-36.
Warner, R. E., and L. M. David 1982. Woody habitat and severe winter mortality of
ring-necked pheasants in central Illinois. Journal of Wildlife Management 46:923-32.
Weston, H. G. 1954. The winter-spring movements of the ring-necked
pheasant in northern Iowa. Iowa State Journal of Science 29:39-60.
Wight, H. M. 1933. Suggestions for pheasant management in
southern Michigan. Michigan Department of Conservation, Lansing. 25 pp.
Winterbottom, M. 1992. Why do pheasants crow? P. 85 in A. Wrigley,
ed. Game conservancy review of 1992, no. 24. Game Conservancy Trust, Fordingham, Hampshire, United Kingdom.
Wooley, J. B., R. Wells, and W. H. Edwards 1988. Pheasants Forever, Quail Unlimited: The role
of species constituency groups in upland wildlife management. Pp. 241-50 in D. L. Hallet, W. R. Edwards, and G. V. Burger, eds. Pheasants: Symptoms of wildlife problems on agricultural lands. Proceedings of the 49th Midwest Wildlife Conference, 8 December 1987, Milwaukee, WI. Northcentral Section of the Wildlife Society. 345 pp.
Acknowledgments I thank B. Bacon, B. Moss, C. Swanberg, K. Belling, J. Waughdal, and the many seasonal technicians and student interns for field assistance; R. Rolley for statistical assistance; and L. Petersen and G. Bartelt of the WDNR for critical review of the manuscript. Partial funding for this study was provided py the Federal Aid to Wildlife Restoration under PittmanRobertson Wisconsin Project W-141-R.
About the Author James 0. Evrard is a Wildlife Research Biologist with the Wisconsin Department of Natural Resources, Box 367, Grantsburg, WI 54840.
Production Credits Wendy M. McCown, Managing Editor Patricia Allen Duyfhuizen, Editor Michelle E. Jesko, Layout/Production

Printed on recycled paper.
Wisconsin Department of Natural Resources PUBL-RS-571 96