wisconsin coastal management program · wisconsin coastal management program needs assessment and...
TRANSCRIPT

Wisconsin Coastal Management Program
Needs Assessment and Strategy
2016-2020
For Enhancements to the Wisconsin Coastal Management Program
Authorized by Section 309 of the
Coastal Zone Management Act of 1972
Wisconsin Department of Administration Wisconsin Coastal Management Program
December 2015

Wisconsin 2016-2020 Needs Assessment and Strategy Page 2 of 58
2
Wisconsin Coastal Management Program Department of Administration P.O. Box 8944 Madison, WI 53708-8944 Phone: (608) 267-7982 Fax: (608) 267-6917 Email: [email protected] Website: http://coastal.wisconsin.gov

Wisconsin 2016-2020 Needs Assessment and Strategy Page 3 of 58
3
Wisconsin Coastal Management Program
2016-2020
Needs Assessment and Strategy
Table of Contents
I. Introduction ............................................................................................................................. 4
II. Summary of Previous Strategy .............................................................................................. 5
A. Wetlands ..................................................................................................................................................... 5 B. Coastal Hazards .......................................................................................................................................... 7
III. Assessment ............................................................................................................................... 9
Wetlands ............................................................................................................................................................. 9 Coastal Hazards ................................................................................................................................................ 17 Public Access .................................................................................................................................................... 27 Marine Debris ................................................................................................................................................... 31 Cumulative and Secondary Impacts .................................................................................................................. 33 Special Area Management Planning ................................................................................................................. 37 Ocean and Great Lakes Resources .................................................................................................................... 39 Energy and Government Facility Siting ............................................................................................................ 43 Aquaculture ....................................................................................................................................................... 46
IV. Strategy 2016-2020 ............................................................................................................... 48
Wetlands Strategy ............................................................................................................................................. 48 Coastal Hazards Strategy .................................................................................................................................. 54

Wisconsin 2016-2020 Needs Assessment and Strategy Page 4 of 58
4
I. Introduction The Coastal Zone Enhancement Program encourages state and territorial coastal management programs to strengthen and improve their federally approved coastal management programs in one or more of nine areas. These “enhancement areas” include wetlands, coastal hazards, public access, marine debris, cumulative and secondary impacts, special area management plans, ocean and Great Lakes resources, energy and government facility siting, and aquaculture. The enhancement program was established under Section 309 of the Coastal Zone Management Act (CZMA), as amended. Every five years, states and territories are encouraged to conduct self-assessments of their coastal management programs to determine problems and enhancement opportunities within each of the nine enhancement areas—and to assess the effectiveness of existing management efforts to address identified problems. Each coastal management program identifies high priority management issues as well as important needs and information gaps the program must fill to address these issues. This document follows the needs assessment and strategy template provided in the “Coastal Zone Management Act: Section 309 Program Guidance” published by the National Oceanic & Atmospheric Administration (NOAA), Office for Coastal Management. Further requirements of Section 309, including allowable uses of funding, are described in federal regulations (15 C.F.R. sec. 923, subpart K). The needs assessment consists of two parts. A “Phase I (High Level) Assessment” for all nine enhancement areas, and a “Phase II Assessment” for those areas determined to be a “high priority” for the WCMP. The Phase II Assessment is intended to explore potential problems, opportunities for improvement, and specific needs. The Wisconsin Coastal Management Program (WCMP) Needs Assessment includes
Section 309 enhancement objectives resource characterization with qualitative and, when possible, quantitative analyses management characterization priority needs and information gaps enhancement area prioritization
The Strategy includes
proposed program changes needs and gaps addressed benefits to coastal management likelihood of success strategy work plan fiscal and technical needs 5-year budget summary by strategy
In the development process to collect data and perform assessment, the WCMP within the Wisconsin Department of Administration collaborated with its fellow agencies:
Wisconsin Department of Natural Resources (DNR) Wisconsin Department of Transportation (DOT) Wisconsin Department of Agriculture, Trade and Consumer Protection (DATCP) Wisconsin Public Service Commission (PSC) University of Wisconsin (UW) System institutions.

Wisconsin 2016-2020 Needs Assessment and Strategy Page 5 of 58
5
This document is a draft for OCRM input and public comment prior to finalizing the needs assessment and strategy for each enhancement area. WCMP staff will review the process and draft with the Wisconsin Coastal Management Council. The draft will be posted on the WCMP website. Email notifications will be sent to current and past grant recipients and applicants and affiliate organizations inviting comment. WCMP staff will collect, edit and incorporate comments into the final submission document.
II. Summary of Previous Strategy In the last Assessment and Strategy, the Wisconsin Coastal Management Program (WCMP) proposed strategies to improve Wetlands and Coastal Hazards. Here are the major accomplishments under the previous Enhancement Strategy.
A. Wetlands The following projects have been completed to fulfill the 2011-2015 Wetland Strategy:
Project: Improving Local Land Use Policies and Practices for Wetlands Grant Recipient: Wisconsin Wetlands Association Federal Award: NA11NOS4190097 Program Change: “Update local government land use regulation/zoning policies to enhance protection of wetlands” Outcome: Publication of “Land Use and Wetlands: Zoning Opportunities to Improve Wetland Protections”, which recommends how local governments can use zoning and other land use controls to improve wetland policies and practices. (http://www.wisconsinwetlands.org/localgovs.htm#recommendations for several download options) Developed and piloted curriculum for a Basic Wetland Identification workshop. At least three local governments have responded to outreach through this project. Douglas County initiated a watershed scale wetland assessment project including incorporation of wetland training to set the state for plan and policy updates. Iron County is undertaking a comprehensive plan update which will include an assessment of coastal resources, issues, and needs. (Iron County will receive WCMP S.306 funding for this planning project). And, Marinette county staff proposed to expand the county's jurisdiction to include wetlands which fall partially in and partially out of the shoreland zone, but the relevant committee rejected it.
Project: Collaborating to Improve Local Wetland Policies and Practices Grant Recipient: Wisconsin Wetlands Association Federal Award: NA12NOS4190091 Program Change: “Update local government land use regulation/zoning policies to enhance protection of wetlands” Outcomes: Collaboration with the Center for Land Use Education at the University of Wisconsin-Stevens Point (CLUE) to produce a dedicated wetland edition of their “Land Use Tracker”, which has a circulation of 1,200. The publication summarized recent major advances in wetland

Wisconsin 2016-2020 Needs Assessment and Strategy Page 6 of 58
6
planning approaches and the substantial increase in the tools and support available to local governments. (http://www.uwsp.edu/cnr-ap/clue/Documents/Tracker/TrackerSummer2013.pdf) Developed a wetland training scenario for local Plan Commissions, which receive regular training through CLUE workshops. Held three Basic Wetland Identification Workshops to train local government staff and officials. Collaboration with Lake Superior National Estuarine Research Reserve to secure a NOAA Science Collaborative grant for a watershed-scale wetland assessment. Project: A Model Ordinance and Advisory Committee for Strengthening Local Wetland Protections Grant Recipient: Wisconsin Wetlands Association Federal Award: NA14NOS4190113 Program Change: “Update local government land use regulation/zoning policies to enhance protection of wetlands” Outcomes: A model wetland ordinance for use by local governments in the coastal counties of Wisconsin. The ordinance will be developed with assistance by University of Wisconsin Extension and University of Wisconsin-Madison, along with an advisory committee. This project is currently underway.
WCMP staff supported these grant projects through participation in events and meetings with the Wisconsin County Code Administrators Association, the state Wetland Team, and providing guidance and advice to Wisconsin Wetland Association staff and other partners as they developed tools and projects to enhance wetland protection in Wisconsin’s coastal counties. Highlights of training and policy outcomes of this Strategy include:
The publication Zoning Opportunities to Improve Wetland Protections was endorsed by the Wisconsin County Code Administrators and promoted by them as a valuable ordinance development resource for their members.
Following release of Zoning Opportunities to Improve Wetland Protection, the Wisconsin Department of Natural Resources modified implementation of its “Model Shoreland Wetland Zoning Ordinance” to require local governments to regulate shoreland wetlands based on field conditions rather than only maps. The administrative rule was updated in 2010 to include a note emphasizing the ordinance’s requirement to reconcile discrepancies between mapped wetlands and field conditions. Through the WWA’s efforts the WDNR and the statewide county code administrators association have coordinated the implementation of this procedure to reconcile wetland differences under the Shoreland Wetland Zoning law.
47 local government staff representing 12 of Wisconsin’s 15 Counties participated in Basic Wetland Identification workshops.
The Wisconsin County Code Administrators, Center for Land Use Education (UW-Stevens Point), Lake Superior National Estuaring Research Reserve, Wisconsin Environmental Education Board, and the Environmental Protection Agency Region 5 all made substantial financial and programmatic commitments to collaborate on and expand the scope of this work.
For a full descriptions of grant-related activities, outputs, and outcomes, see Collaborating to Enhance Wetland Protection in Wisconsin’s Coastal Counties and Beyond: A Case Study in Strategic Investments of Section 309 Enhancement Program Funds 2009 – 2014. http://wisconsinwetlands.org/CMPexecsummary_web.pdf

Wisconsin 2016-2020 Needs Assessment and Strategy Page 7 of 58
7
B. Coastal Hazards For the 2011-2015 Needs Assessment and Strategy, the Coastal Hazards Strategy focused on local policy development to address coastal hazards. WCMP identified Public Outreach and Training, Development of Policy Language, and Development of New Tools to Address Coastal Hazards as areas of focus to address the overarching goal of improving policies regulating coastal hazards. WCMP worked towards developing effective policies through the following efforts: WCMP staff organized and chaired Coastal Natural Hazards Work Group meetings. Work group
members come from diverse organizations – including UW Sea Grant, Wisconsin Emergency Management, University of Wisconsin-Madison Departments of Engineering and Geology, Association of State Floodplain Managers, Ozaukee County, and Wisconsin Department of Natural Resources. The Work Group meets several times a year to discuss current and emerging issues, share information, and collaborate on projects.
WCMP staff organized a series of outreach meetings, titled “Great Lakes Coastal Processes and Best Management Practices.” WCMP staff and Coastal Hazards Work Group members presented at the workshops.
WCMP hosted a Coastal Management Fellow, Kathy Johnson. Kathy worked closely with WCMP and UW-Sea Grant to create “Wisconsin’s Coasts in Transition,” an online tool that allows users to examine land cover changes at the municipal level within Wisconsin’s Coastal Zone.
Section 309 funding was used to determine appropriate setbacks for two counties on Lake Superior. Northwest Regional Planning Commission worked with Iron County and Douglas County to complete the shoreline analysis and calculate setbacks.
Enhancement funds were used for an examination of high bluffs and the effect of stabilization at Concordia University in Mequon, Wisconsin.
The City of Milwaukee utilized enhancements funding to develop and adopt “Green Streets,” a green infrastructure policy for the city’s streetscapes.
The City of Oak Creek used enhancement funding to conduct a bluff stabilization study as part of its redevelopment efforts for the city’s lakefront. The study helped the city to make decisions on what to do with an eroding bluff as it developed a larger plan for the site. Coastal Hazards Work Group members helped review the plans.
The University of Wisconsin collaborated with the City of Port Washington to address failing bluffs by updating recession rates and developing guidelines. The efforts included well-attended public outreach sessions.
The University of Wisconsin-Superior used enhancement funding to develop a map and analysis of landslides caused by the June 2012 flood within the Red River, Pokegama River, and Nemadji River watersheds and create a landslide hazard risk map for the Red River breaks watershed. The project resulted in improved understanding of the effect of upland management on water quality and property.
In an ongoing project, the Association of State Floodplain Managers is using enhancement funding to analyze “hot spots,” unstable bluffs on Lake Michigan. Recently mapped photos have shown that, since 1976, some previously unstable bluffs have since stabilized. Identifying the areas that are active and understanding why some areas have and some have not stabilized may help locals and landowners to determine where and whether to build. Enhancement funds were used to classify and map oblique photographs from the 1970s and 2007 into a GIS database for a previous stage of this project.
In another current effort that has received enhancement funding, University of Wisconsin Engineering staff are examining the effects that coastal structures in the Great Lakes have on shoreline evolution.

Wisconsin 2016-2020 Needs Assessment and Strategy Page 8 of 58
8
Anecdotal evidence suggests that coastal structures may significantly affect neighboring properties. More data in this area may help to make better regulating decisions.

Wisconsin 2016-2020 Needs Assessment and Strategy Page 9 of 58
9
III. Assessment
Wetlands
Section 309 Enhancement Objective: Protection, restoration, or enhancement of the existing coastal wetlands base, or creation of new coastal wetlands. §309(a)(1)
Note: For the purposes of the Wetlands Assessment, wetlands are “those areas that are inundated or saturated at a frequency and duration sufficient to support, and that under normal circumstances do support, a prevalence of vegetation typically adapted for life in saturated soil conditions.” [33 CFR 328.3(b)]. See also pg. 17 of the CZMA Performance Measurement Guidance1 for a more in-depth discussion of what should be considered a wetland.
PHASE I (HIGH-LEVEL) ASSESSMENT: Purpose: To quickly determine whether the enhancement area is a high priority enhancement objective for the CMP that warrants a more in-depth assessment. The more in-depth assessments of Phase II will help the CMP understand key problems and opportunities that exist for program enhancement and determine the effectiveness of existing management efforts to address those problems. Resource Characterization: 1. Using provided reports from NOAA’s Land Cover Atlas2, please indicate the extent, status, and
trends of wetlands in the state’s coastal counties. [Note: While the data from the Land Cover Atlas may allow for better comparison at a national scale, this characterization is not necessarily accurate due to the scale of the source data.]
Coastal Wetlands Status and Trends
Current state of wetlands in 2011 (acres) 1,454,447.9
Percent net change in total wetlands (acres gained or lost)
from 1996-2011 from 2006-2011
3496.3 -722.8
How Wetlands Are Changing
Land Cover Type Area of Wetlands Transformed to Another Type of Land Cover
between 1996-2011 (Acres)
Area of Wetlands Transformed to Another Type of Land Cover
between 2006-2011 (Acres) Development -2153.7 -1132.7 Agriculture 791.1 604.5 Barren Land -188.8 -66.7
Water 5254.5 -127.9
1 http://coastalmanagement.noaa.gov/backmatter/media/czmapmsguide11.pdf 2 http://www.csc.noaa.gov/ccapatlas/. Summary reports compiling each state’s coastal county data are provided on the ftp site.

Wisconsin 2016-2020 Needs Assessment and Strategy Page 10 of 58
10
2. If available, briefly list and summarize the results of any additional state- or territory-specific data or
reports on the status and trends of coastal wetlands since the last assessment to augment the national data sets. None.
Management Characterization: 1. Indicate if there have been any significant changes at the state or territory level (positive or negative)
that could impact the future protection, restoration, enhancement, or creation of coastal wetlands since the last assessment.
Management Category Significant Changes Since Last Assessment
(Y or N) Statutes, regulations, policies, or case law interpreting these
Y
Wetlands programs (e.g., regulatory, mitigation, restoration, acquisition)
Y
2. For any management categories with significant changes, briefly provide the information below. If
this information is provided under another enhancement area or section of the document, please provide a reference to the other section rather than duplicate the information:
a. Describe the significance of the changes; b. Specify if they were 309 or other CZM-driven changes; and c. Characterize the outcomes or likely future outcomes of the changes.
Changes:
Develop and implement Wetland Identification Program per 2009 Wisconsin Act 373 a. Significance: The establishment of this program is part of a Department of Natural Resources (DNR)
strategy to reduce regulatory conflicts and reduce the burden of regulatory compliance on private landowners. The 2009 law required local governments to notify people about wetland regulatory requirements when local zoning and building permits are issued. This measure is needed because landowners have difficulty recognizing wetlands and may not know that state and federal laws prohibit building in wetlands without a permit. The bill also required the Department of Natural Resources (WDNR) to establish a fee for service program to help landowners evaluate whether their property contains wetlands. Among other things,
b. Section 309/CZM: None c. Outcomes: The program is helping landowners avoid and minimize wetland impacts as required under
wetland laws and providing a service to local governments who do not typically have wetland identification experts on staff. The bill authorized 4 full-time positions but thus far only 2 LTE's have been hired.
2011 Act 118 wetland permitting program changes a. Significance:
2011 Wisconsin Act 118 (the Act) changed the way that activities that impact wetlands are permitted by the Department of Natural Resources (DNR). The Act eliminated water quality certification for wetlands and replaced this approval with wetland general permits and wetland individual permits. A general permit is a permit that does not apply to a specific project. Instead, it applies statewide to any person authorized to engage in the activity covered by the permit. An individual permit is issued for an individual activity at a specific

Wisconsin 2016-2020 Needs Assessment and Strategy Page 11 of 58
11
place. Under the Act, a wetland individual permit, general permit, or exemption is required for a person to discharge dredged material or fill material into any wetland. The Act also established a mitigation requirement with minimum mitigation ratios for all individual permits, and authorized establishment of an In Lieu Fee mitigation program. The In Lieu Fee program was approved by the U.S. Army Corps of Engineers in December 2014. Federal mitigation rules require a watershed approach to mitigation, particularly for In Lieu Fee projects, thus creating an opportunity for development and implementation of watershed-scale wetland planning in Wisconsin’s Coastal Zone. Relevant to WCMP, as part of a wetland general permit, DNR may prohibit fill into any of the following: - Great Lakes ridge and swale complexes - Interdunal wetlands - Coastal plain marshes
b. Section 309/CZM: None c. Outcomes: DNR has published General Permits, updated and implemented Guidelines for
Wetland Compensatory Mitigation, and developed an In-Lieu Fee Program.
2013 Wisconsin Act 1 related to Ferrous Mining a. Significance – The Wisconsin legislature enacted new regulations governing the review and approval of ferrous mining projects. The majority of the state’s remaining iron ore deposits are located in the headwaters of the Bad River Watershed which is contained within Wisconsin’s Lake Superior Watershed. The Kakagon and Bad River Sloughs, a 16,000 acre wetland complex, resides at the base of the Bad River. These wetlands were designated as a Ramsar Wetland of International Importance in 2012 and may be vulnerable to changes in water levels and chemistry associated with future mining activity. http://www.wisconsinwetlands.org/Gems/SU4_Kakagon-Bad_River_Sloughs.pdf
Wisconsin DNR’s Wetland Team:
a. For many years, WCMP has been an active participant on WDNR’s Wetland Team. The Team provided a quarterly forum for WDNR staff and external partners to exchange information, knowledge and ideas about how to improve wetland protection and restoration policies and practices. Team activities have traditionally been led by a WDNR staff person, but that position became vacant in 2012 and has not been filled. The number of Team meetings subsequently dwindled and it has been more than a year since the Team has met. These changes increase the burden on WCMP and other partners to create new forums for information exchange and collaboration.
Enhancement Area Prioritization: 1. What level of priority is the enhancement area for the coastal management program?
High __X___ Medium _____ Low _____
2. Briefly explain the reason for this level of priority. Include input from stakeholder engagement,
including the types of stakeholders engaged. Wetland protection in Wisconsin will continue to benefit from a mult-level, and multi-sector approach. The state regulatory program is vulnerable to systematic and long-term budget reductions,

Wisconsin 2016-2020 Needs Assessment and Strategy Page 12 of 58
12
as well as regular attempts to weaken legal protections of wetlands. At the very least, new wetland regulations and programs are focused on streamlining approvals for permits to fill or otherwise impact wetlands. There is a significantunmet demand for more information and technical support for local governments which still are the primary level of land use regulation, and have an interest in maintaining high-quality local water resources. Further, there is an increasing appreciation for and understanding of the functional values of wetlands that make them important in discussions of resiliency planning. WCMP will continue to support the enhancement of local wetland protection, as well as state wetland programs where appropriate.
PHASE II ASSESSMENT: In-Depth Resource Characterization: Purpose: To determine key problems and opportunities to improve the CMP’s ability to protect, restore, and enhance wetlands. 1. What are the three most significant existing or emerging physical stressors or threats to wetlands
within the coastal zone? Indicate the geographic scope of the stressor, i.e., is it prevalent throughout the coastal zone or specific areas that are most threatened? Stressors can be development/fill; hydrological alteration/channelization; erosion; pollution; invasive species; freshwater input; sea level rise/Great Lake level change; or other (please specify). When selecting significant stressors, also consider how climate change may exacerbate each stressor. Stressor/Threat Geographic Scope
(throughout coastal zone or specific areas most threatened)
Stressor 1 Invasive Species Lake Michigan – very high; Lake Superior – medium Stressor 2 Development of
wetlands Lake Michigan – very high; Lake Superior – medium
Stressor 3 Hydrologic alterations Southeast Lake Michigan – very high; Northeast Lake Michigan – high; Lake Superior – medium
2. Briefly explain why these are currently the most significant stressors or threats to wetlands within the coastal zone. Cite stakeholder input and/or existing reports or studies to support this assessment. Existing reports such as Wisconsin Department of Natural Resources’ wetland strategy, “Reversing the Loss”; and studies such as Wisconsin Wetlands Association’s wetlands threats analysis (unpublished) consistently list these as the primary stressors on coastal wetlands for the following reasons: 1. Hydrologic alterations – Fundamental and ongoing changes in how water moves across the landscape have significantly impacted watershed health, including degrading wetland quality and function. Contributing activities are widespread in the coastal zone including agricultural drainage, forestry practices, floodplain and stormwater management and more. Little guidance is available to help producers and practitioners reduce the impacts of these activities on wetlands. 2. Wetland development – Outright destruction and also conversion of wetland types have altered the character and capacities of wetlands in the coastal zone. Significant sources of stress include development, transportation projects, and pipelines. An absence of wetland planning results in wetland development decisions being made on a case-by-case basis rather than with consideration of watershed problems and needs.

Wisconsin 2016-2020 Needs Assessment and Strategy Page 13 of 58
13
3. Invasive species – Proliferation of invasive species pose a direct threat to the quality and function of existing wetlands, particularly coastal shoreland wetlands. In many cases they are also an indicator of underlying stressors such as hydrologic alterations and adjacent development. Of these, invasive species is most likely to be directly exacerbated by impacts of climate change due to the impacts on native vegetation and biological diversity. Wetland development and hydrologic alterations reduce community resilience to climate-induced increases in severe weather. Hydrologic alteration will also be greatly exacerbated by climate change – bigger and more frequent severe weather events will further degrade watershed flow paths with direct wetland implications.
3. Are there emerging issues of concern but which lack sufficient information to evaluate the level of the potential threat? If so, please list. Include additional lines if needed.
Emerging Issue Information Needed Climate change Wetland-specific impacts from the range of
climate scenarios currently modeled
In-Depth Management Characterization: Purpose: To determine the effectiveness of management efforts to address identified problems related to the wetlands enhancement objective. 1. For each additional wetland management category below that was not already discussed as part of the
Phase I assessment, indicate if the approach is employed by the state or territory and if significant state- or territory-level changes (positive or negative) have occurred since the last assessment.
Management Category Employed By State
or Territory (Y or N)
CMP Provides Assistance to Locals
that Employ (Y or N)
Significant Changes Since Last Assessment
(Y or N)
Wetland assessment methodologies
Y Y Y
Wetland mapping and GIS Y Y Y Watershed or special area management plans addressing wetlands
Y Y Y
Wetland technical assistance, education, and outreach
Y Y Y
Other (please specify) 2. For management categories with significant changes since the last assessment, briefly provide the
information below. If this information is provided under another enhancement area or section of the document, please provide a reference to the other section rather than duplicate the information.
a. Describe significant changes since the last assessment; b. Specify if they were 309 or other CZM-driven changes; and c. Characterize the outcomes or likely future outcomes of the changes.
1. Wetland Assessment Methodologies: WDNR developed and released a new Wetland Rapid Assessment Methodology (http://dnr.wi.gov/topic/wetlands/documents/WRAMUserGuide.pdf). This was not a CZM-

Wisconsin 2016-2020 Needs Assessment and Strategy Page 14 of 58
14
driven activity. The new methodology is designed to improve wetland regulatory decision making. 2. Wetland mapping & GIS: WDNR, TNC, WWA, LSNERR, Stockbridge Munsee Tribe, and others have collaborated on the development and testing of new methods to use spatial data to assess wetland functions at a watershed scale. WDNR developed methods to identify and map potentially restorable wetlands and released findings in a new spatial layer. WCMP staff participated in and helped support the LSNERR project and has supported WWA’s efforts to participate in and help promote these projects, planning approaches, and associated new data sets. The availability of new methods to enhance wetland maps and new data sets is enhancing communities’ ability to investigate wetland issues and prioritize wetland needs and projects. 3. Watershed or special area management plans addressing wetlands: LSNERR conducted a watershed scale assessment of wetland functions in the Lake Superior portion of Douglas County. TNC conducted a watershed scale assessment of wetland functions in the Duck-Pensaukee Watershed of Brown County. These projects are improving wetland decision making in these two coastal communities and serving as models to help other communities engage in wetland planning. 4. Wetland technical assistance, education, outreach: Wisconsin Wetlands Association produced training materials to promote watershed scale wetland planning and hosted a Summit on Wetlands and Watershed Planning to advance the statewide dialogue on the availability and use of enhanced wetland mapping data in planning. WCMP participated in and provided funding for several of these activities. Combined these activities are creating an increased demand for improved wetland data and maps and are increasing agency and local government interest in wetland planning. Long-term we expect to see more and better watershed-scale wetland planning in Coastal Counties. WCMP and WWA collaborated on a series of wetland outreach and training activities for local governments. For a full description of past activities and recent outcomes see: http://wisconsinwetlands.org/CMPexecsummary_web.pdf These activities have, and will continue to result in positive changes in wetland policies and practices in Wisconsin’s coastal counties. 3. Identify and describe the conclusions of any studies that have been done that illustrate the
effectiveness of the state’s or territory’s management efforts in protecting, restoring, and enhancing coastal wetlands since the last assessment. If none, is there any information that you are lacking to assess the effectiveness of the state’s or territory’s management efforts?
The last assessment of the state’s wetland management program was a Legislative Audit Bureau report on the state’s wetland regulatory program in 2007.

Wisconsin 2016-2020 Needs Assessment and Strategy Page 15 of 58
15
Participants at a recent Summit on Wetlands and Watershed Planning identified deficiencies in existing wetland spatial data and difficulties obtaining and using this data as barriers to local and statewide efforts to evaluate and improve wetland management efforts. There is broad interest among state and federal agencies, tribes, regional planning commissions, local governments, GIS specialists and others to collaborate to evaluate and address these issues.
Identification of Priorities: 1. Considering changes in wetlands and wetland management since the last assessment and stakeholder
input, identify and briefly describe the top one to three management priorities where there is the greatest opportunity for the CMP to improve its ability to more effectively respond to significant wetlands stressors. (Approximately 1-3 sentences per management priority.) Management Priority 1: _____Local government wetland program enhancement____________ Description: Local government units (counties, municipalities, towns) utilize land use planning and zoning to regulate development, including its impacts on water and wetland resources. There are opportunities to support local governments that have prioritized wetland protection and restoration, including planned wetland mitigation, and would like to update their plans and ordinances. Management Priority 2: ___ Wetland technical assistance, education, and outreach ____________ Description: Wetland protection will continue to benefit from targeted outreach and technical assistance. Both public and private agencies/organizations have roles and responsibilties in this management area. Management Priority 3: _____Watershed based wetland planning and management____ Description: Watershed based planning and assessment has been tested and refined over the past few years and there is strong interest from local, regional, tribal, state, and even federalagencies to use these approaches to better integrate wetlands into water resource management initiatives . To be successful, there is a need for better wetland data (inventory and functions), better access to data, and decision-support tools to facilitate the public planning process. Policy changes at the local and state level may also be needed to support this management goal.
2. Identify and briefly explain priority needs and information gaps the CMP has to help it address the management priorities identified above. The needs and gaps identified here do not need to be limited to those items that will be addressed through a Section 309 strategy but should include any items that will be part of a strategy.
Priority Needs Need? (Y or N) Brief Explanation of Need/Gap
Research Y Research quantifying functional values of wetlands, especially at a watershed scale.
Mapping/GIS Y The Wisconsin Wetland Inventory has limited functionality, access, and usefulness for addressing watershed health and for local planning needs.
Data and information management
Y Existing data is difficult for local government staff to access and utilize.
Training/capacity building
Y Non-wetland specialists need targeted training to understand the role and value of wetlands across other disciplines and in areas of

Wisconsin 2016-2020 Needs Assessment and Strategy Page 16 of 58
16
importance to local communities.
Decision-support tools
Y Effective decision-support tools are vital to effectively communicating the role of wetlands within watersheds, and to help communities make informed decisions when developing and implementing land use plans.
Communication and outreach
Y Elected officials and local government staff are always in need of outreach about wetlands and available technical assistance.
Other (Specify)
Enhancement Area Strategy Development: 1. Will the CMP develop one or more strategies for this enhancement area?
Yes ___X___ No ______
2. Briefly explain why a strategy will or will not be developed for this enhancement area.
Wetland protection in Wisconsin will continue to benefit from a mult-level, and multi-sector approach. The state regulatory program is vulnerable to systematic and long-term budget reductions, as well as regular attempts to weaken legal protections of wetlands. At the very least, new wetland regulations and programs are focused on streamlining approvals for permits to fill or otherwise impact wetlands. Yet, there is an unmet demand for more information from local governments, which still are the primary level of land use regulation, and have an interest in maintaining high-quality local water resources. Further, there is an increasing appreciation for and understanding of the functional values of wetlands that make them important in discussions of resiliency planning. WCMP will continue to support the enhancement of local wetland protection, as well as state wetland programs where appropriate.
****************************************************

Wisconsin 2016-2020 Needs Assessment and Strategy Page 17 of 58
17
Coastal Hazards Section 309 Enhancement Objective: Prevent or significantly reduce threats to life and property by eliminating development and redevelopment in high-hazard areas, managing development in other hazard areas, and anticipating and managing the effects of potential sea level rise and Great Lakes level change. §309(a)(2)
Note: For purposes of the Hazards Assessment, coastal hazards include the following traditional hazards and those identified in the CZMA: flooding; coastal storms (including associated storm surge); geological hazards (e.g., tsunamis, earthquakes); shoreline erosion (including bluff and dune erosion); sea level rise; Great Lake level change; land subsidence; and saltwater intrusion.
PHASE I (HIGH-LEVEL) ASSESSMENT: Resource Characterization:
1. Flooding: Using data from NOAA’s State of the Coast “Population in the Floodplain” viewer3 and summarized by coastal county through NOAA’s Coastal County Snapshots for Flood Exposure,4 indicate how many people were located within the state’s coastal floodplain as of 2010 and how that has changed since 2000. You may to use other information or graphs or other visuals to help illustrate.
Population in the Coastal Floodplain 2000 2010 Percent Change from 2000-2010
No. of people in coastal floodplain5
116,258 125,277 7.75
No. of people in coastal counties6 1,992,393 2,049,934 2.89
Percentage of people in coastal counties in coastal floodplain
5.84 6.11 0.27
2. Shoreline Erosion (for all states other than Great Lakes and islands; for Great Lakes and islands,
see Question 5): Using data from NOAA’s State of the Coast “Coastal Vulnerability Index,”7 indicate the vulnerability of the state’s shoreline to erosion. You may use other information or graphs or other visuals to help illustrate or replace the table entirely if better data is available. Note: For New York and Pennsylvania that have both Atlantic and Great Lakes shorelines, fill out the table below for the Atlantic shoreline only.
3 http://stateofthecoast.noaa.gov/pop100yr/welcome.html. Note FEMA is in the process of updating the floodplain data. This viewer reflects floodplains as of 2010. If you know the floodplain for your state has been revised since 2010, you can either use data for your new boundary, if available, or include a short narrative acknowledging the floodplain has changed and generally characterizing how it has changed. 4 www.csc.noaa.gov/digitalcoast/tools/snapshots 5 To obtain exact population numbers for the coastal floodplain, download the Excel data file on the State of the Coast “Population in the Floodplain” viewer: http://stateofthecoast.noaa.gov/pop100yr/welcome.html. Summary population data for each coastal state is available on the ftp site. 6 To obtain population numbers for coastal counties, see spreadsheet of coastal population and critical facilities data provided or download directly from http://www.csc.noaa.gov/digitalcoast/data/stics. Summary population data for each coastal state is available on the ftp site. 7 http://stateofthecoast.noaa.gov/vulnerability/welcome.html (see specifically “Erosion Rate” drop‐down on map). The State of the Coast visually displays the data from USGS’s Coastal Vulnerability Index.

Wisconsin 2016-2020 Needs Assessment and Strategy Page 18 of 58
18
Vulnerability to Shoreline Erosion
Vulnerability Ranking
Miles of Shoreline Vulnerable11 Percent of Coastline8
Very low (>2.0m/yr) accretion
Low (1.0-2.0 m/yr) accretion)
Moderate (-1.0 to 1.0 m/yr) stable
High (-1.1 to -2.0 m/yr) erosion
Very high (<-2.0 m/yr) erosion
3. Sea Level Rise (for all states other than Great Lakes and islands; for Great Lakes and islands, see
Question 5): Using data from NOAA’s State of the Coast “Coastal Vulnerability Index”,9 indicate the vulnerability of the state’s shoreline to sea level rise. You may provide other information or use graphs or other visuals to help illustrate or replace table entirely if better data is available. Note: For New York and Pennsylvania that have both Atlantic and Great Lakes shorelines, fill out the table below for your Atlantic shoreline only.
Coastal Vulnerability to Historic Sea Level Rise
Vulnerability Ranking Miles of Shoreline Vulnerable11 Percent of Coastline
Very low
Low Moderate
High
Very high
4. Other Coastal Hazards: In the table below, indicate the general level of risk in the coastal zone
for each of the coastal hazards. The state’s multi-hazard mitigation plan is a good additional resource to support these responses.
Type of Hazard General Level of Risk10 (H, M, L) Flooding (riverine, stormwater) H Coastal storms (including storm surge)11 M/H Geological hazards (e.g., tsunamis, earthquakes) L Shoreline erosion12 H Sea level rise13,14,15 L Great Lake level change14 M Land subsidence M
8 To obtain exact shoreline miles and percent of coastline, mouse over the colored bar for each level of risk or download the Excel data file. 9 http://stateofthecoast.noaa.gov/vulnerability/welcome.html (see “Vulnerability Index Rating” drop‐down on map). The State of the Coast visually displays the data from USGS’s Coastal Vulnerability Index. 10 Risk is defined as “the estimated impact that a hazard would have on people, services, facilities and structures in a community; the likelihood
of a hazard event resulting in an adverse condition that causes injury or damage.” Understanding Your Risks: Identifying Hazards and Estimating Losses. FEMA 386‐2. August 2001 11 In addition to any state‐ or territory‐specific information that may help respond to this question, the U.S. Global Change Research Program
has an interactive website that provides key findings from the 2014 National Climate Assessment for each region of the country, including regions for the coasts and oceans, and various sectors. The report includes findings related to coastal storms and sea level rise that may be helpful in determining the general level of risk. See http://nca2014.globalchange.gov/. 12 See NOAA State of the Coastal Vulnerability to Sea Level Rise Tool (select “Erosion Rate” from drop‐down box)
http://stateofthecoast.noaa.gov/vulnerability/welcome.html. The State of the Coast visually displays the data from USGS’s Coastal Vulnerability Index.

Wisconsin 2016-2020 Needs Assessment and Strategy Page 19 of 58
19
Type of Hazard General Level of Risk10 (H, M, L) Saltwater intrusion L Other (please specify)
5. If available, briefly list and summarize the results of any additional data or reports on the level of
risk and vulnerability to coastal hazards within your state since the last assessment. The state’s multi-hazard mitigation plan or climate change risk assessment or plan may be a good resource to help respond to this question. State of Wisconsin Hazard Mitigation Plan – The State of Wisconsin Hazard Mitigation Plan assesses
Wisconsin’s vulnerability to natural hazards. It outlines roles for state agencies and details a strategy to reduce vulnerability.
Wisconsin Coastal Atlas – This web-based tool is a resource for sharing diverse coastal data and resources to encourage informed decision-making. It has sections for maps, tools, geospatial data, and tools related to Wisconsin’s Great Lakes.
Wisconsin Shoreline Inventory and Oblique Photo Viewer – This online tool allows users to examine photos from 1976-78 and compare them to corresponding photos from 2007-2008 to assess changes to the shoreline. GIS layers for shore structures, beach protection, and bluff conditions for each timeframe allow for more detailed analysis of shoreline and bluff changes. Recent analysis of the data has evaluated “hotspots,” areas of active bluff erosion.
Great Lakes Coastal Resilience Planning Guide – Another online resource, this tool provides in-depth case studies on hazards and climate change.
Wisconsin Initiative on Climate Change Impacts – The Wisconsin Initiative on Climate Change Impacts released its first comprehensive report in 2011. The report includes sections on Coastal Resources and Water Resources.
NOAA Great Lakes Coastal Storms Program: Great Lakes Planning and Mitigation Needs Assessment of Coastal Storm Hazards – A survey of planners and other stakeholders on coastal storm hazards. Of 186 respondents, 42% were from Wisconsin. Bluff and shoreline erosion was identified as the top coastal storm hazard.
NOAA Coastal Services Center/Coastal Storms Program: 2013 Shoreline Change Workshop: Perspectives on the Great Lakes – A report on the results of this workshop explores priority gaps an needs related to the Great Lakes shoreline. Visualization tools, bathymetry/topography data, and observational data and monitoring stations were identified as gaps for future lake levels. Demonstration projects for alternatives to shoreline armoring, bathy/topo data, and policies were identified as gaps for bluff erosion/failure. Key takeaway included the need for visualization projects, need for translating science to policy and outreach, and need for baty/topo data.
FEMA flood mapping – The Federal Emergency Management Agency (FEMA) is undergoing coastal analyses and mapping studies to provide updated Digital Flood Insurance Rate Maps for coastal counties in the Great Lakes Region. The effort is not complete, but development standards in the region may be affected in the near future.
Management Characterization:
1. Indicate if the approach is employed by the state or territory and if significant state- or territory-level changes (positive or negative) have occurred that could impact the CMP’s ability to prevent or significantly reduce coastal hazards risk since the last assessment.
Management Category Employed by State
or Territory (Y or N)
CMP Provides Assistance to
Locals that Employ (Y or N)
Significant Changes Since Last Assessment
(Y or N)
Statutes, regulations, policies, or case law interpreting these that address:

Wisconsin 2016-2020 Needs Assessment and Strategy Page 20 of 58
20
elimination of development/redevelopment in high-hazard areas13
Y Y Y
management of development/redevelopment
in other hazard areas
N N N
climate change impacts, including sea level rise or Great Lake level change
N N N
Hazards planning programs or initiatives that address: hazard mitigation Y Y Y
climate change impacts, including sea level rise or Great Lake level change
Y Y Y
Hazards mapping or modeling programs or initiatives for: sea level rise or Great Lake level change Y Y Y
other hazards
2. Briefly state how “high-hazard areas” are defined in your coastal zone. For purposes of this document, high-hazard areas are areas within 75-feet of the ordinary high water mark or areas with actively eroding bluffs as well as areas likely to be affected by flooding within Wisconsin’s Coastal Zone. (Wisconsin does not currently have V-Zones.)
3. For any management categories with significant changes, briefly provide the information below. If this information is provided under another enhancement area or section of the document, please provide a reference to the other section rather than duplicate the information: a. Describe the significance of the changes; b. Specify if they were 309 or other CZM-driven changes; and c. Characterize the outcomes or likely future outcomes of the changes.
Statutes and Regulations: In July of 2015, Wisconsin passed its biannual budget. One of the provisions of the budget will change shoreland zoning on a county level. Counties will no longer be allowed to create shoreland zoning ordinances that are more restrictive than state standards. This is a significant change that affects more than hazards-related areas, but in a hazards context, in the past, WCMP encouraged counties to adopt shoreland zoning ordinances as a way to enact more restrictive setbacks on erodible shorelines, especially in high bluff areas. Presumably, existing county standards will immediately be void where they are more restrictive than state standards. Counties won’t be able to use shorleland zoning to enact setback standards: the state standard is 75-feet from the ordinary high water mark. Counties will be unable to use shoreland zoning for a more restrictive standard (such as 75 feet from the bluff edge). The budget provision was unexpected. There may be room for counties to enact bluff setbacks through their Land Use Ordinances or other means. Other future outcomes are unclear. Hazard Mitigation: Flooding impacted communities in the Lake Superior region, leading to hazard mitigation efforts. Some of the efforts in the area were funded by Wisconsin Coastal Management Program. Section 309 funds were used in mapping landslides and other failures in watersheds in the area. The results of the funding will hopefully be used in land-use planning efforts in the region. Section 309 funding was also been used in the City of Milwaukee to develop green infrastructure policies to reduce flooding impacts. The guidelines are being used by the City in development decisions. In addition, WCMP 306 funding is being used in a project to review several Southeastern Wisconsin communities’
13 Use state’s definition of high‐hazard areas.

Wisconsin 2016-2020 Needs Assessment and Strategy Page 21 of 58
21
existing ordinances and local codes that need to be revised to better address coastal flooding through green infrastructure. WCMP organized and presented at a series of outreach meetings titled, “Great Lakes Coastal Processes and Best Management Practices” workshops. Section 309 funding was used for the workshops. Climate Change Impacts: The Wisconsin Initiative on Climate Change Impacts (WICCI) produced a report titled “Wisconsin’s Changing Climate: Impacts and Adaptation.” The report provides broad recommendations for decision makers, including a section on coastal impacts. The effort was led by the University of Wisconsin-Madison. Great Lake Level Change: WCMP co-mentored a Coastal Management Fellow who developed “Wisconsin’s Coasts in Transition,” an online tool that allows users to examine land cover changes at the municipal level. WCMP partnered with University of Wisconsin Sea Grant in hosting a series of public forums on low lake levels. One of the workshops was directed to the Wisconsin Legislature, and the others were public-outreach workshops. Enhancement Area Prioritization: 1. What level of priority is the enhancement area for the coastal management program?
High __X__ Medium _____ Low _____
2. Briefly explain the reason for this level of priority. Include input from stakeholder engagement,
including the types of stakeholders engaged.
Coastal Hazards continue to be an area of high importance to Wisconsin. There are significant development pressures on Wisconsin’s coastal shoreline. Coastal flooding has impacted areas in the Lake Superior region as well as the southeast region of the state in recent years. Communities are concerned about the effects of fluctuating lake levels. Discussions with planners, local decision-makers, Wisconsin Emergency Management staff, and members of the Wisconsin Coastal Natural Hazards Work Group (with participants from University of Wisconsin-Madison Geology and Engineering, Association of State Floodplain Managers, Wisconsin Emergency Management UW-Sea Grant, Wisconsin Department of Natural Resources, NOAA Coastal Storms Program, and community planners) have made it clear that WCMP should pursue opportunities to address coastal hazards.
PHASE II ASSESSMENT: In-Depth Resource Characterization: Purpose: To determine key problems and opportunities to improve the CMP’s ability to prevent or significantly reduce coastal hazard risks by eliminating development and redevelopment in high-hazard areas and managing the effects of potential sea level rise and Great Lakes level change.

Wisconsin 2016-2020 Needs Assessment and Strategy Page 22 of 58
22
1a. Flooding In-depth (for all states besides territories): Using data from NOAA’s State of the Coast “Population in the Floodplain” viewer14 and summarized by coastal county through NOAA’s Coastal County Snapshots for Flood Exposure,15 indicate how many people at potentially elevated risk were located within the state’s coastal floodplain as of 2010. These data only reflect two types of vulnerable populations. You can provide additional or alternative information or use graphs or other visuals to help illustrate or replace the table entirely if better data are available. Note: National data are not available for territories. Territories can omit this question unless they have similar alternative data or include a brief qualitative narrative description as a substitute.
2010 Populations in Coastal Counties at Potentially Elevated Risk to Coastal Flooding16
Under 5 and Over 65 years old In Poverty # of people % Under 5/Over
65 # of people % in Poverty
Inside Floodplain 23,807 19.9 12,702 10.6 Outside Floodplain 1,353,659 70 271,502 14.6
1b. Flooding In-depth (for all states besides territories): Using summary data provided for critical
facilities, derived from FEMA’s HAZUS17 and displayed by coastal county through NOAA’s Coastal County Snapshots for Flood Exposure,18 indicate how many different establishments (businesses or employers) and critical facilities are located in the FEMA floodplain. You can provide more information or use graphs or other visuals to help illustrate or replace the table entirely if better information is available.
Critical Facilities in the FEMA Floodplain44
Schools Police
Stations Fire Stations
Emergency Centers
Medical Facilities
Communication Towers
Inside Floodplain
165 30 60 0 15 180
Coastal Counties
1116 132 194 7 43 113
2. Based on the characterization of coastal hazard risk, what are the three most significant coastal
hazards19 within the coastal zone? Also indicate the geographic scope of the hazard, i.e., is it prevalent throughout the coastal zone or are specific areas most at risk?
Type of Hazard Geographic Scope (throughout coastal zone or specific areas most threatened)
Hazard 1 Erosion (shoreline erosion, bluff erosion, etc.)
Coast-wide, especially Counties of Kenosha, Racine, Milwaukee, Ozaukee, Sheboygan, Manitowoc, Kewaunee, Door, Brown and Douglas
Hazard 2 Flooding Coast-wide, especially southern Kenosha County, from the City of Green Bay to the state line of Michigan, City of Superior, Bark Bay,
14 http://stateofthecoast.noaa.gov/pop100yr/welcome.html
15 http://www.csc.noaa.gov/digitalcoast/tools/snapshots
16 To obtain exact population numbers for the coastal floodplain, download the excel data file from the State of the Coast’s “Population in
Floodplain” viewer. 17 http://www.fema.gov/hazus; can also download data from NOAA STICS http://www.csc.noaa.gov/digitalcoast/data/stics. Summary data on
critical facilities for each coastal state is available on the ftp site. 18 http://www.csc.noaa.gov/digitalcoast/tools/snapshots
19 See list of coastal hazards at the beginning of this assessment template.

Wisconsin 2016-2020 Needs Assessment and Strategy Page 23 of 58
23
Chequamegon Bay. Hazard 3 Coastal storms,
including storm surge Coast-wide
3. Briefly explain why these are currently the most significant coastal hazards within the coastal zone. Cite stakeholder input and/or existing reports or studies to support this assessment. Coastal erosion, flooding, and coastal storms present significant risks to public safety and property. The Wisconsin Coastal Hazards Work Group has identified these areas (along with changing lake levels) as the most significant coastal hazards. The 2011-2015 Needs Assessment and Strategy for Enhancements to the Wisconsin Coastal Management Program identified flooding and shoreline erosion as having a high general level of risk and Coastal storms as having a medium/high level. NOAA Great Lakes Coastal Storms Program’s “Great Lakes Planning and Mitigation Needs Assessment of Coastal Storm Hazards” asked respondents to rate coastal storm hazards; Bluff and shoreline erosion rated as number one with overflow of combined systems as number four and stormwater flooding of residential and commercial developments as numbers four and five. Coastal Erosion and flooding (with associated storm affects) are discussed in the State of Wisconsin Hazard Mitigation Plan.
4. Are there emerging issues of concern, but which lack sufficient information to evaluate the level of
the potential threat? If so, please list. Include additional lines if needed.
Emerging Issue Information Needed Near-shore processes (sediment transport) Near-shore processes; basic sediment
transport/littoral drift in the Great Lakes; near-shore habitat evaluation needs
Coastal structures Questions of how coastal structures affect neighboring properties and cumulative effects of armoring; how sediment transport systems are affected by coastal structures; evaluation of existing coastal structures; identification of existing and historical permits for coastal structures
Climate change and associated lake level changes How the levels of Lake Superior and Lake Michigan will be affected by climate change; modeling needs
Changes in development patterns Houses being built on the shoreline are getting bigger and bigger – question of how this impacts bluffs and shoreline; questions on whether there are increased development pressures along Lake Superior; questions of whether lower lake levels have resulted in building closer to shoreline
Contaminated sediment Some locations are dealing with contaminated sediment on eroding bluffs; questions on how to best address
Flood elevation mapping The Federal Emergency Management Administration is coming out with Coastal Flood Study maps. The results of the study will likely affect development in Wisconsin’s Coastal Zone.

Wisconsin 2016-2020 Needs Assessment and Strategy Page 24 of 58
24
In-Depth Management Characterization: Purpose: To determine the effectiveness of management efforts to address identified problems related to the coastal hazards enhancement objective. 1. For each coastal hazard management category below, indicate if the approach is employed by the
state or territory and if there has been a significant change since the last assessment.
Management Category Employed by
State/Territory(Y or N)
CMP Provides Assistance to
Locals that Employ (Y or N)
Significant Change Since
the Last Assessment
(Y or N)
Statutes, Regulations, and Policies: Shorefront setbacks/no build areas Y Y Y
Rolling easements N N N Repair/rebuilding restrictions Y Y Y
Hard shoreline protection structure restrictions Y Y N Promotion of alternative shoreline stabilization
methodologies (i.e., living shorelines/green infrastructure)
N N N
Repair/replacement of shore protection structure restrictions
Y Y N
Inlet management N N N Protection of important natural resources for
hazard mitigation benefits (e.g., dunes, wetlands, barrier islands, coral reefs) (other than setbacks/no
build areas)
Y Y N
Repetitive flood loss policies (e.g., relocation, buyouts)
Y Y N
Freeboard requirements N N N Real estate sales disclosure requirements N N N
Restrictions on publicly funded infrastructure N N N Infrastructure protection (e.g., considering hazards
in siting and design) Y Y N
Other (please specify) Management Planning Programs or Initiatives:
Hazard mitigation plans Y Y Y Sea level rise/Great Lake level change or climate
change adaptation plans Y Y Y
Statewide requirement for local post-disaster recovery planning
Y N N
Sediment management plans N N N Beach nourishment plans N N N
Special Area Management Plans (that address hazards issues)
N N N
Managed retreat plans N N N Other (please specify)
Research, Mapping, and Education Programs or Initiatives: General hazards mapping or modeling Y Y Y
Sea level rise mapping or modeling Y Y Y Hazards monitoring (e.g., erosion rate, shoreline
change, high-water marks) Y Y Y
Hazards education and outreach Y Y Y

Wisconsin 2016-2020 Needs Assessment and Strategy Page 25 of 58
25
Other (please specify) 2. Identify and describe the conclusions of any studies that have been done that illustrate the
effectiveness of the state’s management efforts in addressing coastal hazards since the last assessment. If none, is there any information that you are lacking to assess the effectiveness of the state’s management efforts? There have not been any studies specifically looking at the effectiveness of the state’s management efforts in addressing coastal hazards. Anecdotal evidence and discussions with local and state decision-makers and coastal hazards specialists indicate that more effective regulations are needed to address coastal hazards.
Identification of Priorities: 1. Considering changes in coastal hazard risk and coastal hazard management since the last assessment
and stakeholder input, identify and briefly describe the top one to three management priorities where there is the greatest opportunity for the CMP to improve its ability to more effectively address the most significant hazard risks. (Approximately 1-3 sentences per management priority.) Management Priority 1: _________Policy refinement/development__________________ Description: Development of local regulations addressing coastal hazards. Recent changes to shoreland zoning necessitate review of existing ordinances and, potentially, development of new policies to address setbacks on eroding shorelines. This management priority includes reviewing existing ordinances, zoning, and other regulations to incorporate new information and data as well as development of new regulations. This management priority also includes refining and developing guidance documents for addressing coastal hazards, such as (where appropriate) living shorelines. Management Priority 2: ____Mapping/research__________________ Description: Mapping of shoreline erosion and predictions, modeling for changing lake levels, and research on nearshore processes are all areas where WCMP can assist. Enhancement funding has assisted in these areas in the last few years; WCMP has an opportunity to continue developing models and tools for coastal hazard management. Management Priority 3: __ Targeted outreach ___________________________ Description: There is a need for outreach to homeowners, local planners, and permitting staff (state and local). WCMP is in a good position to coordinate outreach efforts between researchers and other hazards professionals and local decision makers and landowners.
2. Identify and briefly explain priority needs and information gaps the CMP has for addressing the management priorities identified above. The needs and gaps identified here should not be limited to those items that will be addressed through a Section 309 strategy but should include any items that will be part of a strategy.
Priority Needs Need? (Y or N) Brief Explanation of Need/Gap
Research Y Need for more research on sediment transport, nearshore
habitat, potential effects of climate change. Need research on

Wisconsin 2016-2020 Needs Assessment and Strategy Page 26 of 58
26
potential effects of the recent changes to shoreline zoning: what counties rely on shoreland zoning to establish setbacks and what counties are interested in developing other means of protecting their shorelines as well as what the options are (if any) for counties that want to adopt regulations.
Mapping/GIS/modeling Y Need for improved modeling (eg, HAZUS modeling is by Census block and may not reflect actual losses/risks); modeling on effects of climate change; mapping of nearshore habitat, sediment transport
Data and information management
Y Need to make data available to managers; need to make data and other information available to land owners; data gaps on historic permits – difficulty in tracking this information down and need to digitize; need more data on impacts of coastal structures, particularly on Lake Michigan Shoreline
Training/Capacity building Y Training/education of consultants and local decision-makers for identifying hazardous areas, ensuring appropriate setbacks, and use of non-structural shoreline stabilization methodologies (where appropriate); training of permitting staff; training of homeowners in best-management practices and in evaluating consultants and proposed development plans
Decision-support tools
Y Technical tools to help communities address development and plan for hazards; new and improved visualization tools needed for planning efforts; need to integrate existing technology into useful tools (eg, LIDAR of bluffs and bathymetric LIDAR could be used to make profiles fixed in space on a region-by-region basis); improvement needs for existing tools (eg missing data for Oconto County)
Communication and outreach
Y Education of elected officials; education of landowners especially new homeowners; making information available to locals
Other (Specify)
Enhancement Area Strategy Development: 1. Will the CMP develop one or more strategies for this enhancement area?
Yes __X___ No ______
2. Briefly explain why a strategy will or will not be developed for this enhancement area. Coastal erosion, flooding, and coastal storms present significant risks to property safety and property. Existing policies and tools for addressing coastal hazards are insufficient. WCMP has an opportunity to improve management of coastal hazards in Wisconsin.
****************************************************

Wisconsin 2016-2020 Needs Assessment and Strategy Page 27 of 58
27
Public Access Section 309 Enhancement Objective: Attain increased opportunities for public access, taking into account current and future public access needs, to coastal areas of recreational, historical, aesthetic, ecological, or cultural value. §309(a)(3) PHASE I (HIGH-LEVEL) ASSESSMENT: (Must be completed by all states.) Purpose: To quickly determine whether the enhancement area is a high priority enhancement objective for the CMP that warrants a more in-depth assessment. The more in-depth assessments of Phase II will help the CMP understand key problems and opportunities that exist for program enhancement and determine the effectiveness of existing management efforts to address those problems. Resource Characterization: 1. Use the table below to provide data on public access availability within the coastal zone.
Public Access Status and Trends
Type of Access Current
number20 Changes or Trends Since Last Assessment21
(���������unkwn) Cite data source
Beach access sites
191
No change
WDNR Great Lakes Beach Monitoring & Notification Program Annual Report-2012
Shoreline (other than beach) access
sites
204
unknown
Lake Michigan Water Trail Inventory; Lake Superior Water Trail
Recreational boat (power or
nonmotorized) access sites
275
unknown
Lake Michigan Water Trail Inventory; South Shore Lake Superior Public Access Study
Number of designated scenic vistas or overlook
points
unknown
Number of fishing access points (i.e.
piers, jetties)
175
_
Previous needs assessment. No further
data available.
Coastal trails/ boardwalks
No. of Trails/ boardwalks
unknown
Miles of Trails/boardwalks
unknown
http://dnr.wi.gov/topic/Beaches/documents/BeachReport2012.pdf 20 Be as specific as possible. For example, if you have data on many access sites but know it is not an exhaustive list, note “more than” before
the number. If information is unknown, note that and use the narrative section below to provide a brief qualitative description based on the best information available. 21 If you know specific numbers, please provide. However, if specific numbers are unknown but you know that the general trend was increasing
or decreasing or relatively stable or unchanged since the last assessment, note that with a (increased)(decreased)(unchanged). If the trend is completely unknown, simply put “unkwn.”

Wisconsin 2016-2020 Needs Assessment and Strategy Page 28 of 58
28
Public Access Status and Trends
Type of Access Current
number20 Changes or Trends Since Last Assessment21
(���������unkwn) Cite data source
Number of acres parkland/open
space
Total sites
Sites per miles of shoreline
Other (please specify)
Public Lands – Coastal Counties
County BCPL DNR County
Federal - Fish and Wildlife
Federal - Forest Service
Total Public
Ashland 2,089 15,233 43,041 182,192 242,555Bayfield 286 27409 169,353 341 273848 471,237Brown 0 3620 5,807 330 0 9,757Door 79 17672 1,281 27 0 19,059Douglas 360 99905 270,813 0 371,078Iron 4,294 87153 182,015 0 273,462Kenosha 0 7268 2,700 0 9,968Kewaunee 0 3251 273 0 3,524Manitowoc 0 11189 1,052 0 12,241Marinette 3,400 52773 238,730 0 294,903Milwaukee 0 547 16,359 0 16,906Oconto 80 7498 44,974 141744 194,296Ozaukee 0 4040 1,243 0 5,283Racine 0 4155 5,484 0 9,639Sheboygan 0 22781 8,688 0 31,469Total Coastal 10,588 364,494 991,813 698 597,784 1,965,377
2009 2013 2009 2015 2013
2009 Wisconsin Taxpayer Alliance 2013 Wisconsin Blue Book
2015 U.S. Fish and Wildlife Service
2. Briefly characterize the demand for coastal public access and the process for periodically assessing
demand. Include a statement on the projected population increase for your coastal counties.22 There are several additional sources of statewide information that may help inform this response, such as the
22 See NOAA’s Coastal Population Report: 1970‐2020 (Table 5, pg. 9): http://stateofthecoast.noaa.gov/coastal‐population‐report.pdf

Wisconsin 2016-2020 Needs Assessment and Strategy Page 29 of 58
29
Statewide Comprehensive Outdoor Recreation Plan,23 the National Survey on Fishing, Hunting, and Wildlife Associated Recreation,24 and your state’s tourism office.
According to the 2011-2016 Wisconsin Statewide Comprehensive Outdoor Recreation Plan, “more water/boating access is needed in certain portions of the state. In many cases, however, public access to recreation resources does exist, but the public is simply not aware of it. Improved and easily accessible maps and signage would aid the public in locating these access points.” The population within the state’s coastal shoreline counties is projected to increase by 3 percent between 2010 and 2020.
3. If available, briefly list and summarize the results of any additional data or reports on the status or
trends for coastal public access since the last assessment.
Management Characterization: 1. Indicate if the approach is employed by the state or territory and if there have been any significant
state- or territory-level management changes (positive or negative) that could impact the future provision of public access to coastal areas of recreational, historical, aesthetic, ecological, or cultural value.
Management Category Employed by State
or Territory (Y or N)
CMP Provides Assistance to
Locals that Employ(Y or N)
Significant Changes Since Last Assessment
(Y or N)
Statutes, regulations, policies, or case law interpreting these
Y Y N
Operation/maintenance of existing facilities
Y Y N
Acquisition/enhancement programs Y Y N 2. For any management categories with significant changes, briefly provide the information below. If
this information is provided under another enhancement area or section of the document, please provide a reference to the other section rather than duplicate the information:
a. Describe the significance of the changes; b. Specify if they were 309 or other CZM-driven changes; and c. Characterize the outcomes or likely future outcomes of the changes.
3. Indicate if your state or territory has a publically available public access guide. How current is the
publication and how frequently it is updated?25
Public Access Guide Printed Online Mobile App State or territory has? Y Y N
23 Most states routinely develop “Statewide Comprehensive Outdoor Recreation Plans”, or SCROPs, that include an assessment of demand for
public recreational opportunities. Although not focused on coastal public access, SCORPs could be useful to get some sense of public outdoor recreation preferences and demand. Download state SCROPs at www.recpro.org/scorps. 24 The National Survey on Fishing, Hunting, and Wildlife Associated Recreation produces state‐specific reports on fishing, hunting, and wildlife
associated recreational use for each state. While not focused on coastal areas, the reports do include information on saltwater and Great Lakes fishing, and some coastal wildlife viewing that may be informative and compares 2011 data to 2006 and 2001 information to understand how usage has changed. See www.census.gov/prod/www/fishing.html. 25 Note some states may have regional or local guides in addition to state public access guides. Unless you want to list all local guides as well,
there is no need to list additional guides beyond the state access guide. However, you may choose to note that the local guides do exist and may provide additional information that expands upon the state guides.

Wisconsin 2016-2020 Needs Assessment and Strategy Page 30 of 58
30
(Y or N) Web address (if applicable)
http://wisconsinharbortowns.net/
Date of last update 2013 2013 Frequency of update 5 years (approximately)
Enhancement Area Prioritization: 1. What level of priority is the enhancement area for the coastal management program?
High _____ Medium __X___ Low _____
2. Briefly explain the reason for this level of priority. Include input from stakeholder engagement,
including the types of stakeholders engaged. Promoting and enhancing public access to the Great Lakes continues to be a core principle of WCMP’s section 306/306A activities. There is a steady need for incorporating public access into waterfront redevelopment projects, and for enhancing existing access facilities to accommodate diverse populations, including people with physical limitations. The state’s SCORP acknowledges that there are targeted needs for greater public access to water resources, but the larger need is for better information about existing access facilities. WCMP has supported promoting existing access through projects such as water trail mapping, and marina facility guidebooks.
****************************************************

Wisconsin 2016-2020 Needs Assessment and Strategy Page 31 of 58
31
Marine Debris Section 309 Enhancement Objective: Reducing marine debris entering the nation’s coastal and ocean environment by managing uses and activities that contribute to the entry of such debris. §309(a)(4) PHASE I (HIGH-LEVEL) ASSESSMENT: Resource Characterization: 1. In the table below, characterize the existing status and trends of marine debris in the state’s coastal
zone based on the best available data.
Source of Marine Debris
Existing Status and Trends of Marine Debris in Coastal Zone
Significance of Source (H, M, L, unknwn)
Type of Impact26 (aesthetic, resource damage, user
conflicts, other)
Change Since Last Assessment (unkwn)
Land-based Beach/shore litter L aesthetic -
Dumping L Aesthetic - Storm drains and runoff L Aesthetic -
Fishing (e.g., fishing line, gear)
L Aesthetic/resource damage
-
Other (please specify) Ocean or Great Lake-based
Fishing (e.g., derelict fishing gear)
L Resource damage -
Derelict vessels N/A - - Vessel-based (e.g.,
cruise ship, cargo ship, general vessel)
N/A - -
Hurricane/Storm L Aesthetic/resource damage
-
Tsunami N/A - - Other (please specify)
2. If available, briefly list and summarize the results of any additional state- or territory-specific data or
reports on the status and trends or potential impacts from marine debris in the coastal zone since the last assessment.
The Alliance for the Great Lakes reports the following data from Wisconsin coastal beach clean up events from 2011-2014: Average amount of litter collected: 2020.5 pounds Total amount of litter collected: 8082 pounds
26 You can select more than one, if applicable.

Wisconsin 2016-2020 Needs Assessment and Strategy Page 32 of 58
32
Management Characterization: 1. Indicate if the approach is employed by the state or territory and if there have been any significant
state- or territory-level management changes (positive or negative) for how marine debris is managed in the coastal zone.
Management Category Employed by
State/Territory (Y or N)
CMP Provides Assistance to Locals
that Employ (Y or N)
Significant Changes Since Last Assessment
(Y or N)
Marine debris statutes, regulations, policies, or case law interpreting these
N N N
Marine debris removal programs
N N N
2. For any management categories with significant changes, briefly provide the information below. If
this information is provided under another enhancement area or section of the document, please provide a reference to the other section rather than duplicate the information:
a. Describe the significance of the changes; b. Specify if they were 309 or other CZM-driven changes; and c. Characterize the outcomes and likely future outcomes of the changes.
Enhancement Area Prioritization: 1. What level of priority is the enhancement area for the coastal management program?
High _____ Medium _____ Low __X___
2. Briefly explain the reason for this level of priority. Include input from stakeholder engagement,
including the types of stakeholders engaged.
The category of Marine Debris is one of historically low priority in the Great Lakes. However, a new NOAA iniative, the “Great Lakes Land-Based Marine Debris Action Plan” provides an opportunity to assess the nature of this issue. The five-year (2014-2019) action plan will develop a comprehensive framework for strategic action to ensure that the Great Lakes, its coasts, people, and wildlife are free from the impacts of marine debris. The Wisconsin Coastal Management Program is a member of the action plan working group. Further work is being undertaken by the University of Wisconsin Sea Grant Institute, with funding from NOAA’s Marine Debris Program, to promote best management practices for commercial and tribal anglers with the goal of reducing the incidence of lost fishing nets (ghost nets).
*********************************************

Wisconsin 2016-2020 Needs Assessment and Strategy Page 33 of 58
33
Cumulative and Secondary Impacts Section 309 Enhancement Objective: Development and adoption of procedures to assess, consider, and control cumulative and secondary impacts of coastal growth and development, including the collective effect on various individual uses or activities on coastal resources, such as coastal wetlands and fishery resources. §309(a)(5) PHASE I (HIGH-LEVEL) ASSESSMENT Resource Characterization: 1. Using National Ocean Economics Program Data on population and housing,27 please indicate the
change in population and housing units in the state’s coastal counties between 2012 and 2007. You may wish to add additional trend comparisons to look at longer time horizons as well (data available back to 1970), but at a minimum, please show change over the most recent five year period (2012-2007) to approximate current assessment period.
Trends in Coastal Population and Housing Units
Year Population Housing Total
(# of people) % Change
(compared to 2007)Total
(# of housing units) % Change
(compared to 2007)
2007 2,043,182 0.91% 916,730 2.31% 2012 2,061,729 937,925
2. Using provided reports from NOAA’s Land Cover Atlas28 or high-resolution C-CAP data29 (Pacific
and Caribbean Islands only), please indicate the status and trends for various land uses in the state’s coastal counties between 2006 and 2011. You may use other information and include graphs and figures, as appropriate, to help illustrate the information. Note that the data available for the islands may be for a different time frame than the time periods reflected below. In that case, please specify the time period the data represents. Also note that Puerto Rico and the Commonwealth of the Northern Mariana Islands (CNMI) currently only have data for one time point so will not be able to report trend data. Instead, Puerto Rico and CNMI should just report current land use cover for developed areas and impervious surfaces.
Distribution of Land Cover Types in Coastal Counties Land Cover Type Land Area Coverage in 2011
(Acres) Gain/Loss Since 2006
(Acres) Developed, High Intensity 163286.8 5197.8Developed, Low Intensity 272200.0 5533.0Developed, Open Space 75582.9 7375.9
Grassland 126867.2 21719.5Scrub/Shrub 336915.8 -8063.6Barren Land 18637.6 181.5
27 www.oceaneconomics.org/. Enter “Population and Housing” section. From drop‐down boxes, select your state, and “all counties.” Select the
year (2012) and the year to compare it to (2007). Then select “coastal zone counties.” Finally, be sure to check the “include density” box under the “Other Options” section. 28 www.csc.noaa.gov/ccapatlas/. Summary data on land use trends for each coastal state is available on the ftp site.
29 www.csc.noaa.gov/digitalcoast/data/ccaphighres. Summary data on land use trends for each coastal state is available on the ftp site.

Wisconsin 2016-2020 Needs Assessment and Strategy Page 34 of 58
34
Distribution of Land Cover Types in Coastal Counties Land Cover Type Land Area Coverage in 2011
(Acres) Gain/Loss Since 2006
(Acres) Open Water 1263120.0 642.7Agriculture 1694620.8 -6971.2
Forested 2591488.4 -24906.2Wetlands 1447250.1 -718.6
3. Using provided reports from NOAA’s Land Cover Atlas30 or high-resolution C-CAP data31 (Pacific
and Caribbean Islands only), please indicate the status and trends for developed areas in the state’s coastal counties between 2006 and 2011 in the two tables below. You may use other information and include graphs and figures, as appropriate, to help illustrate the information. Note that the data available for the islands may be for a different time frame than the time periods reflected below. In that case, please specify the time period the data represents. Also note that Puerto Rico and CNMI currently only have data for one time point so will not be able to report trend data. Unless Puerto Rico and CNMI have similar trend data to report on changes in land use type, they should just report current land use cover for developed areas and impervious surfaces.
Development Status and Trends for Coastal Counties
2006 2011 Percent Net Change
Percent land area developed 492963.0 (6.2%) 511069.7 (6.4%) 18106.7 (3.7%) Percent impervious surface area 188433.8 (2.4%) 194212.0 (2.4%) 5778.2 (3.1%) * Note: Islands likely have data for another time period and may only have one time interval to report. If so, only report the change in development and impervious surface area for the time period for which high-resolution C-CAP data are available. Puerto Rico and CNMI do not need to report trend data.
How Land Use Is Changing in Coastal Counties
Land Cover Type Areas Lost to Development Between 2006-2011 (Acres) Barren Land 1372.4
Wetland 1139.6 Open Water 103.9 Agriculture 12017.8 Scrub/Shrub 495.7 Grassland 1867.9 Forested 1627.7
* Note: Islands likely have data for another time period and may only have one time interval to report. If so, only report the change in land use for the time period for which high-resolution C-CAP data are available. Puerto Rico and CNMI do not report.
4. Using data from NOAA’s State of the Coast “Shoreline Type” viewer,32 indicate the percent of shoreline that falls into each shoreline type.33 You may provide other information or use graphs or other visuals to help illustrate.
30 www.csc.noaa.gov/ccapatlas/. Summary data on land use trends for each coastal state is available on the ftp site.
31 www.csc.noaa.gov/digitalcoast/data/ccaphighres. Summary data on land use trends for each coastal state is available on the ftp site.
32 http://stateofthecoast.noaa.gov/shoreline/welcome.html
33 Note: Data are from NOAA’s Environmental Sensitivity Index (ESI) Maps. Data from each state was collected in different years and some data
may be over ten years old now. However, it can still provide a useful reference point absent more recent statewide data. Feel free to use more recent state data, if available, in place of ESI map data. Use a footnote to convey data’s age and source (if other than ESI maps).

Wisconsin 2016-2020 Needs Assessment and Strategy Page 35 of 58
35
Shoreline Types Surveyed Shoreline Type Percent of Shoreline
Armored 19.1 Beaches 34.3
Flats 0.1 Rocky 24
Vegetated 22.5 Sources: FEMA Discovery Report - USACE shoreline feature dataset (Great Lakes Coastal Flood Study, 2013); Lake Superior Visual Quality, Northest Regional Planning Commission, 2007
5. If available, briefly list and summarize the results of any additional state- or territory-specific data or reports on the cumulative and secondary impacts of coastal growth and development, such as water quality and habitat fragmentation, since the last assessment to augment the national data sets. None
Management Characterization: 1. Indicate if the approach is employed by the state or territory and if there have been any significant
state-level changes (positive or negative) in the development and adoption of procedures to assess, consider, and control cumulative and secondary impacts of coastal growth and development, including the collective effect on various individual uses or activities on coastal resources, such as coastal wetlands and fishery resources, since the last assessment.
Management Category Employed by State or
Territory (Y or N)
CMP Provides Assistance to Locals
that Employ (Y or N)
Significant Changes Since Last Assessment
(Y or N)
Statutes, regulations, policies, or case law interpreting these
Y Y N
Guidance documents Y N N Management plans (including SAMPs)
Y N N
2. For any management categories with significant changes, briefly provide the information below. If
this information is provided under another enhancement area or section of the document, please provide a reference to the other section rather than duplicate the information:
a. Describe the significance of the changes; b. Specify if they were 309 or other CZM-driven changes; and c. Characterize the outcomes or likely future outcomes of the changes.
Enhancement Area Prioritization: 1. What level of priority is the enhancement area for the coastal management program?
High _____ Medium ___X__ Low _____

Wisconsin 2016-2020 Needs Assessment and Strategy Page 36 of 58
36
2. Briefly explain the reason for this level of priority. Include input from stakeholder engagement, including the types of stakeholders engaged.
The level of priority given is due to the significant and diverse problems associated with cumulative and secondary impacts in Wisconsin and the driving forces of development and population growth. These impacts, even if insignificant by themselves, when combined can cause significant impacts to water quality, habitat, navigation, public access, etc. and severely threaten the state’s coastal resources. It is the conclusion of the WCMP that existing rules, policies, programs, and research are adequate to address the issues and challenges currently faced in Wisconsin’s coastal zone. Although funding of existing programs, etc., is not adequate, there is not a need for new policies to be supported by Section 309 funding. There has been significant investment from federal and state agencies, local governments and many stakeholders in Wisconsin to address cumulative and secondary impacts. WCMP, as a networked program in the Department of Administration, has been able to work collaboratively with these stakeholders and efficiently leverage financial and technical assistance when involved. No Section 309 funding is proposed. Funding will continue to be provided through Section 306.
*********************************************

Wisconsin 2016-2020 Needs Assessment and Strategy Page 37 of 58
37
Special Area Management Planning Section 309 Enhancement Objective: Preparing and implementing special area management plans for important coastal areas. §309(a)(6) The Coastal Zone Management Act defines a Special Area Management Plan (SAMP) as “a comprehensive plan providing for natural resource protection and reasonable coastal-dependent economic growth containing a detailed and comprehensive statement of policies; standards and criteria to guide public and private uses of lands and waters; and mechanisms for timely implementation in specific geographic areas within the coastal zone. In addition, SAMPs provide for increased specificity in protecting natural resources, reasonable coastal-dependent economic growth, improved protection of life and property in hazardous areas, including those areas likely to be affected by land subsidence, sea level rise, or fluctuating water levels of the Great Lakes, and improved predictability in governmental decision making.” PHASE I (HIGH-LEVEL) ASSESSMENT: Resource Characterization: 1. In the table below, identify geographic areas in the coastal zone subject to use conflicts that may be
able to be addressed through a special area management plan (SAMP). This can include areas that are already covered by a SAMP but where new issues or conflicts have emerged that are not addressed through the current SAMP.
Geographic Area Opportunities for New or Updated Special Area Management PlansMajor conflicts/issues
2. If available, briefly list and summarize the results of any additional state- or territory-specific data or reports on the status and trends of SAMPs since the last assessment. None
Management Characterization: 1. Indicate if the approach is employed by the state or territory and if there have been any significant
state- or territory-level management changes (positive or negative) that could help prepare and implement SAMPs in the coastal zone.
Management Category Employed by State or
Territory (Y or N)
CMP Provides Assistance to Locals
that Employ (Y or N)
Significant Changes Since Last Assessment
(Y or N)
SAMP policies, or case law interpreting these
Y N N
SAMP plans Y N N

Wisconsin 2016-2020 Needs Assessment and Strategy Page 38 of 58
38
2. For any management categories with significant changes, briefly provide the information below. If this information is provided under another enhancement area or section of the document, please provide a reference to the other section rather than duplicate the information:
a. Describe the significance of the changes; b. Specify if they were 309 or other CZM-driven changes; and c. Characterize the outcomes or likely future outcomes of the changes.
Enhancement Area Prioritization: 1. What level of priority is the enhancement area for the coastal management program?
High _____ Medium _____ Low __X___
2. Briefly explain the reason for this level of priority. Include input from stakeholder engagement,
including the types of stakeholders engaged.
SAMPs are not a high priority issue in Wisconsin. The local community must take the initiative to begin the planning process, or fully support a regional, state, or federal agency’s coordination of the SAMP. Prior experience with the SAMP process and outcome has been uneven and demonstrates a limited applicability of the process for Wisconsin communities. For example, a SAMP-like process in Kenosha County to identify development and protection areas in the Chiwaukee Prairie development was not renewed after the state-federal agreement expired in the 1990s. Likewise, the City of Superior SAMP has resulted in sprawling highway-style development at the cost of redeveloping the downtown core. It also failed to link permitted development within the city with planning for mitigation sites outside the city limits. This has caused conflicts with surrounding towns and the county, as well as poorly sited mitigation sites. Also, current policies of the U.S. Army Corps of Engineers make it difficult to follow a predictable SAMP process. Coastal communities have other policy and regulatory tools which better address the objectives of this enhancement area.
*********************************************

Wisconsin 2016-2020 Needs Assessment and Strategy Page 39 of 58
39
Ocean and Great Lakes Resources Section 309 Enhancement Objective: Planning for the use of ocean [and Great Lakes] resources. §309(a)(7) PHASE I (HIGH-LEVEL) ASSESSMENT:. Resource Characterization: 1. Understanding the ocean and Great Lakes economy can help improve management of the resources it
depends on. Using Economics: National Ocean Watch (ENOW),34 indicate the status of the ocean and Great Lakes economy as of 2010, as well as the change since 2005, in the tables below. Include graphs and figures, as appropriate, to help illustrate the information. Note ENOW data are not available for the territories. The territories can provide alternative data, if available, or a general narrative, to capture the value of their ocean economy.
Status of Ocean and Great Lakes Economy for Coastal Counties (2011) Establishments
(# of Establishments) Employment
(# of Jobs)Wages
(Millions of Dollars) GDP
(Millions of Dollars)
Living Resources 32 300 $6,891,000.00 $27,611,000.00 Marine Construction
30 619 $54,780,000.00 $93,610,000.00
Marine Transportation
142 4,156 $168,524,000.00 $311,761,000.00
Offshore Mineral Extraction
26 138 $6,556,000.00 $20,355,000.00
Ship and Boat Building
28 2,346 $107,946,000.00 $290,131,000.00
Tourism & Recreation
1,770 30,747 $422,504,000.00 $965,247,000.00
All Ocean Sectors
2,028 38,309 $767,200,000.00 $1,708,715,000.00
Change in Ocean and Great Lakes Economy for Coastal Counties (2005-2011)
Establishments (% change)
Employment (% change)
Wages (% change)
GDP (% change)
Living Resources -11.11% 14.07% 27.61% 42.97% Marine Construction
-23.08% 141.80% 324.09% 307.28%
Marine Transportation
7.58% 16.45% 5.49% -24.07%
Offshore Mineral Extraction
-18.75% -37.56% -29.66% -5.44%
Ship and Boat Building
-9.68% -41.32% -25.86% 7.69%
Tourism & Recreation
8.39% 3.66% 19.42% 20.72%
All Ocean Sectors
6.57% 0.89% 11.71% 10.71%
34 www.csc.noaa.gov/enow/explorer/. If you select any coastal county for your state, you receive a table comparing county data to state
coastal county, regional, and national information. Use the state column for your responses.

Wisconsin 2016-2020 Needs Assessment and Strategy Page 40 of 58
40
2. In the table below, characterize how the threats to and use conflicts over ocean and Great Lakes resources in the state’s or territory’s coastal zone have changed since the last assessment.
Significant Changes to Ocean and Great Lakes Resources and Uses
Resource/Use Change in the Threat to the Resource or Use Conflict
Since Last Assessment (unkwn)
Resource Benthic habitat (including coral reefs) -
Living marine resources (fish, shellfish, marine mammals, birds, etc.)
-
Sand/gravel - Cultural/historic -
Other (please specify) Use
Transportation/navigation - Offshore development35 -
Energy production - Fishing (commercial and recreational) -
Recreation/tourism - Sand/gravel extraction -
Dredge disposal - Aquaculture -
Other (please specify) 3. For the ocean and Great Lakes resources and uses in Table 2 (above) that had an increase in threat to
the resource or increased use conflict in the state’s or territory’s coastal zone since the last assessment, characterize the major contributors to that increase.
Major Contributors to an Increase in Threat or Use Conflict to Ocean and Great Lakes Resources
Resource
Major Reasons Contributing to Increased Resource Threat or Use Conflict
(Note All that Apply with “X”)
Lan
d-ba
sed
deve
lopm
ent
Off
shor
e de
velo
pmen
t
Pol
lute
d ru
noff
Inva
sive
sp
ecie
s
Fis
hing
(C
omm
& R
ec)
Aqu
acul
ture
Rec
reat
ion
Mar
ine
Tra
nspo
rtat
ion
Dre
dgin
g
San
d/M
iner
al
Ext
ract
ion
Oce
an
Aci
difi
cati
on
Oth
er
(Spe
cify
)
Example: Living marine resources X X X X X X X Benthic habitat X Dredge disposal X X 4. If available, briefly list and summarize the results of any additional state- or territory-specific data or
reports on the status and trends of ocean and Great Lakes resources or threats to those resources since
35 Offshore development includes underwater cables and pipelines, although any infrastructure specifically associated with the energy industry
should be captured under the “energy production” category.

Wisconsin 2016-2020 Needs Assessment and Strategy Page 41 of 58
41
the last assessment to augment the national data sets.
Management Characterization: 1. Indicate if the approach is employed by the state or territory and if any significant state- or territory-
level changes (positive or negative) in the management of ocean and Great Lakes resources have occurred since the last assessment?
Management Category Employed by State
or Territory (Y or N)
CMP Provides Assistance to Locals
that Employ (Y or N)
Significant Changes Since Last Assessment
(Y or N)
Statutes, regulations, policies, or case law interpreting these
Y N N
Regional comprehensive ocean/Great Lakes management plans
Y N Y
State comprehensive ocean/Great Lakes management plans
N N N
Single-sector management plans
N N N
2. For any management categories with significant changes, briefly provide the information below. If
this information is provided under another enhancement area or section of the document, please provide a reference to the other section rather than duplicate the information:
a. Describe the significance of the changes; b. Specify if they were 309 or other CZM-driven changes; and c. Characterize the outcomes or likely future outcomes of the changes.
A. Lakewide Management Plans (LaMPs) are complete for Lake Superior and Lake Michigan, and have been updated for both lakes since the last assessment. The updates are significant, but not major, changes.
B. LaMPs are not funded by, or driven by, section 309 or other CZM funding. These are coordinated by US EPA, and the state’s primary contact is through the Wisconsin Department of Natural Resources.
C. The LaMPs have served as useful guides to development of the Great Lakes Restoration Initiative Strategy, and for coordinating regional resource management issues.
A. Wisconsin has nominated an area of central Lake Michigan within the state boundary as a National Marine Sanctuary with a focus on cultural and historic resources (shipwrecks).
B. This was driven by CZM 306 funding and coordination by WCMP staff. C. The nomination has received support from NOAA and will be evaluated for future designation.
3. Indicate if your state or territory has a comprehensive ocean or Great Lakes management plan.
Comprehensive Ocean/Great Lakes Management Plan
State Plan Regional Plan
Completed plan (Y/N) (If yes, specify year completed)
N N
Under development (Y/N) N N Web address (if available) Area covered by plan

Wisconsin 2016-2020 Needs Assessment and Strategy Page 42 of 58
42
Enhancement Area Prioritization: 1. What level of priority is the enhancement area for the coastal management program?
High _____ Medium _____ Low __X___
2. Briefly explain the reason for this level of priority. Include input from stakeholder engagement,
including the types of stakeholders engaged. Great Lakes resources will continue to be a priority for the Wisconsin Coastal Management Program (WCMP), as evidenced by the recent adoption of the Great Lakes Compact and the state’s support for regional restoration strategies. Gaps remain in the coordination and dissemination of mapping data for Great Lakes resources, although efforts to address these gaps are ongoing through consultation with the Regional Ocean Planning body (U.S. Coast Guard). Finally, there is a moderate need for research, assessment and monitoring of Great Lakes resources, especially habitat and fisheries.
*********************************************

Wisconsin 2016-2020 Needs Assessment and Strategy Page 43 of 58
43
Energy and Government Facility Siting Section 309 Enhancement Objective: Adoption of procedures and enforceable policies to help facilitate the siting of energy facilities and Government facilities and energy-related activities and Government activities which may be of greater than local significance. §309(a)(8)36
PHASE I (HIGH-LEVEL) ASSESSMENT: Resource Characterization: 1. In the table below, characterize the status and trends of different types of energy facilities and
activities in the state’s or territory’s coastal zone based on best available data. If available, identify the approximate number of facilities by type. The MarineCadastre.gov may be helpful in locating many types of energy facilities in the coastal zone.
Status and Trends in Energy Facilities and Activities in the Coastal Zone
Type of Energy Facility/Activity
Exists in CZ Proposed in CZ
(# or Y/N)
Change Since Last Assessment (unkwn) (# or Y/N)
Change Since Last Assessment (unkwn)
Energy Transport
Pipelines37 Y Y
Electrical grid (transmission cables)
Y Y
Ports 26 - N -
Liquid natural gas (LNG)38
N - N -
Other (please specify)
Energy Facilities
Oil and gas Y - N -
Coal Y N - Nuclear39 N N -
Wind Y N -
Wave40 N - N -
Tidal36 N - N - Current (ocean, lake,
river) 36 N - N -
Hydropower Y - N -
Ocean thermal energy conversion
N - N
-
36 CZMA § 309(a)(8) is derived from program approval requirements in CZMA § 306(d)(8), which states:
“The management program provides for adequate consideration of the national interest involved in planning for, and managing the coastal zone, including the siting of facilities such as energy facilities which are of greater than local significance. In the case of energy facilities, the Secretary shall find that the State has given consideration to any applicable national or interstate energy plan or program.”
NOAA regulations at 15 C.F.R. § 923.52 further describe what states need to do regarding national interest and consideration of interests that are greater than local interests. 37 For approved pipelines (1997‐present): www.ferc.gov/industries/gas/indus‐act/pipelines/approved‐projects.asp
38 For approved FERC jurisdictional LNG import/export terminals: www.ferc.gov/industries/gas/indus‐act/lng/exist‐term.asp
39 The Nuclear Regulatory Commission provides a coarse national map of where nuclear power reactors are located as well as a list that reflects
there general locations: www.nrc.gov/reactors/operating/map‐power‐reactors.html 40 For FERC hydrokinetic projects: www.ferc.gov/industries/hydropower/gen‐info/licensing/hydrokinetics.asp

Wisconsin 2016-2020 Needs Assessment and Strategy Page 44 of 58
44
Status and Trends in Energy Facilities and Activities in the Coastal Zone
Type of Energy Facility/Activity
Exists in CZ Proposed in CZ
(# or Y/N)
Change Since Last Assessment (unkwn) (# or Y/N)
Change Since Last Assessment (unkwn)
Solar N - N -
Biomass Y - N -
Other (please specify)
2. If available, briefly list and summarize the results of any additional state- or territory-specific
information, data, or reports on the status and trends for energy facilities and activities of greater than local significance in the coastal zone since the last assessment. The Wisconsin Public Service Commission conducts a biennial Strategic Energy Assessment which evaluates the adequacy and reliability of the state’s current and future electrical supply. The Wisconsin Public Service Commission asks Wisconsin’s electric utilities to look seven years into the future and project: 1) anticipated growth in energy demand; 2) planned new construction of generation and major transmission lines; 3) need to purchase power from outside sources; and 4) types of fuels they plan to use. Based on this information and other research, the Wisconsin Public Service Commission writes a draft report assessing the adequacy and reliability of the state’s electrical supply. The draft report is distributed for comments to the utilities, advocacy and interest groups, and the general public. The Wisconsin Public Service Commission prepares a final report reflecting these comments and submits it to the Legislature and the public. The Wisconsin Public Service Commission also conducts a yearly review of the natural gas needs of the state’s gas utilities. The gas supply plans forecasts the gas needs of the utility’s customers for a three year period. The plans then evaluate the capacity contracts the utility has with the interstate gas pipeline companies, along with the contracted sources of the gas commodity. The available capacity and commodity levels are compared with the forecasted gas needs to demonstrate that the gas utilities have the ability to provide reliable gas service to their customers at a reasonable cost.
3. Briefly characterize the existing status and trends for federal government facilities and activities of greater than local significance41 in the state’s coastal zone since the last assessment.
There ar no federal government facilities or activities of greater than local significance in the coastal zone since the last assessment.
Management Characterization: 1. Indicate if the approach is employed by the state or territory and if significant state- or territory-level
changes (positive or negative) that could facilitate or impede energy and government facility siting and activities have occurred since the last assessment.
41 The CMP should make its own assessment of what Government facilities may be considered “greater than local significance” in its coastal
zone, but these facilities could include military installations or a significant federal government complex. An individual federal building may not rise to a level worthy of discussion here beyond a very cursory (if any at all) mention).
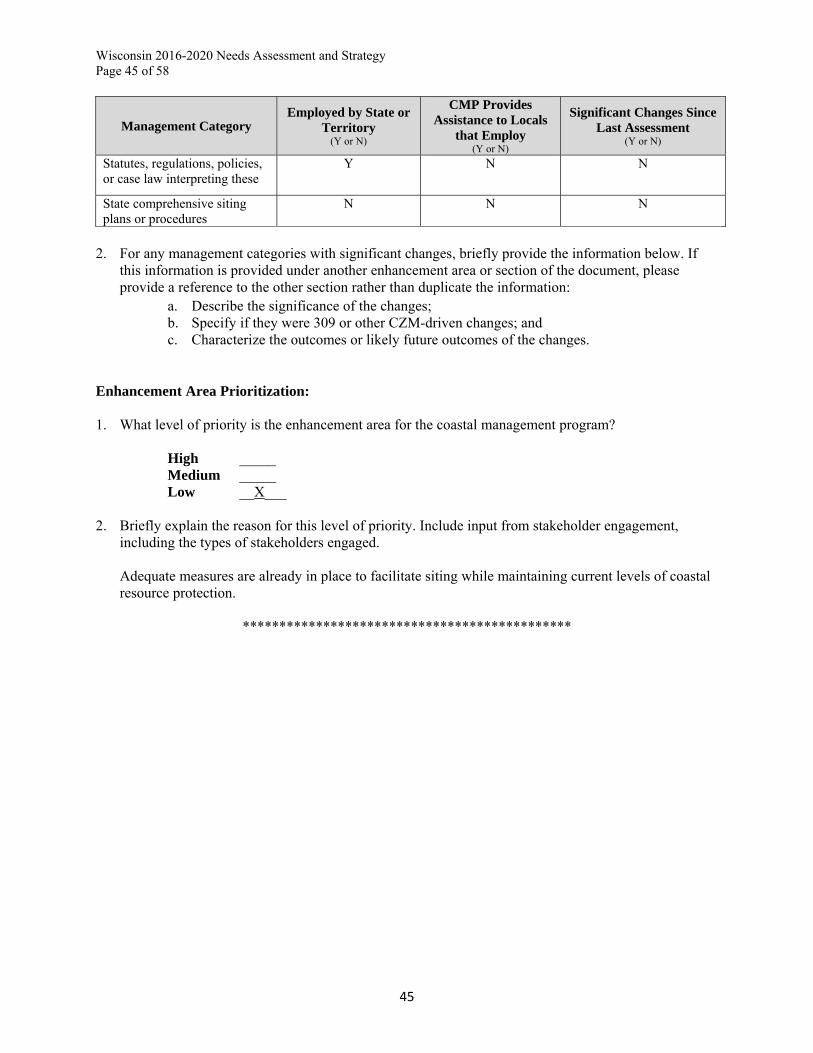
Wisconsin 2016-2020 Needs Assessment and Strategy Page 45 of 58
45
Management Category Employed by State or
Territory (Y or N)
CMP Provides Assistance to Locals
that Employ (Y or N)
Significant Changes Since Last Assessment
(Y or N)
Statutes, regulations, policies, or case law interpreting these
Y N N
State comprehensive siting plans or procedures
N N N
2. For any management categories with significant changes, briefly provide the information below. If
this information is provided under another enhancement area or section of the document, please provide a reference to the other section rather than duplicate the information:
a. Describe the significance of the changes; b. Specify if they were 309 or other CZM-driven changes; and c. Characterize the outcomes or likely future outcomes of the changes.
Enhancement Area Prioritization: 1. What level of priority is the enhancement area for the coastal management program?
High _____ Medium _____ Low __X___
2. Briefly explain the reason for this level of priority. Include input from stakeholder engagement,
including the types of stakeholders engaged.
Adequate measures are already in place to facilitate siting while maintaining current levels of coastal resource protection.
*********************************************

Wisconsin 2016-2020 Needs Assessment and Strategy Page 46 of 58
46
Aquaculture Section 309 Enhancement Objective: Adoption of procedures and policies to evaluate and facilitate the siting of public and private aquaculture facilities in the coastal zone, which will enable states to formulate, administer, and implement strategic plans for marine aquaculture. §309(a)(9) PHASE I (HIGH-LEVEL) ASSESSMENT: Resource Characterization: 1. In the table below, characterize the existing status and trends of aquaculture facilities in the state’s
coastal zone based on the best available data. Your state Sea Grant Program may have information to help with this assessment.42
Type of Facility/Activity
Status and Trends of Aquaculture Facilities and Activities
# of Facilities43 Approximate
Economic Value Change Since Last Assessment
(unkwn) 2. If available, briefly list and summarize the results of any additional state- or territory-specific data or
reports on the status and trends or potential impacts from aquaculture activities in the coastal zone since the last assessment.
Data on aquaculture facilities is inadequate to characterize for this assessment, as it is not possible to accurately count facilities. Much of the data is sensitive due to the small number of facilities and the need to protect proprietary sales data. There are no facilities within either of the Great Lakes. Instead most facilities are inland and focused on raising bait fish.
Management Characterization: 1. Indicate if the approach is employed by the state or territory and if there have been any state- or
territory-level changes (positive or negative) that could facilitate or impede the siting of public or private aquaculture facilities in the coastal zone.
Management Category Employed by State
or Territory (Y or N)
CMP Provides Assistance to Locals
that Employ (Y or N)
Significant Changes Since Last Assessment
(Y or N)
Aquaculture comprehensive siting plans or procedures
N N N
Other aquaculture statutes, Y N N
42 While focused on statewide aquaculture data rather than just within the coastal zone, the Census of Aquaculture
(www.agcensus.usda.gov/Publications/2002/Aquaculture/) may help in developing your aquaculture assessment. The 2002 report, updated in 2005, provides a variety of state‐specific aquaculture data for 2005 and 1998 to understand current status and recent trends. The next census is scheduled to come out late 2014 and will provide 2013 data. 43 Be as specific as possible. For example, if you have specific information of the number of each type of facility or activity, note that. If you only have approximate figures, note “more than” or “approximately” before the number. If information is unknown, note that and use the narrative section below to provide a brief qualitative description based on the best information available.

Wisconsin 2016-2020 Needs Assessment and Strategy Page 47 of 58
47
regulations, policies, or case law interpreting these
2. For any management categories with significant changes, briefly provide the information below. If
this information is provided under another enhancement area or section of the document, please provide a reference to the other section rather than duplicate the information:
a. Describe the significance of the changes; b. Specify if they were 309 or other CZM-driven changes; and c. Characterize the outcomes or likely future outcomes of the changes.
Enhancement Area Prioritization:
1. What level of priority is the enhancement area for the coastal management program? High _____ Medium _____ Low __X___
2. Briefly explain the reason for this level of priority. Include input from stakeholder engagement,
including the types of stakeholders engaged.
The current status and condition of aquaculture in Wisconsin and its coastal zone is relatively static. The two state regulatory agencies, the Wisconsin Department of Natural Resources and Wisconsin Department of Agriculture, Trade and Consumer Protection, are already working collaboratively with the aquaculture industry, tribal governments, the University of Wisconsin, University of Wisconsin Sea Grant Institute, and the Wisconsin Aquaculture Association on best management practices, monitoring and assessment, and outreach and education. And, University of Wisconsin Sea Grant Advisory Services has provided aquaculture technical assistance since 1985. In addition, Wisconsin Department of Agriculture, Trade and Consumer Protection is advised by the Wisconsin Aquaculture Industry Advisory Council, which is comprised of industry, state agency and university representatives. The Council works to identify and address critical issues facing Wisconsin's aquaculture industry. And the Wisconsin Department of Natural Resources established the Aquaculture Industry Working Group, which focuses more specifically on resource protection issues. Both groups have contributed to maintaining communication between Wisconsin’s aquaculture stakeholders in pursuing common objectives and identifying challenges.
****************************************************

Wisconsin 2016-2020 Needs Assessment and Strategy Page 48 of 58
48
IV. Strategy 2016-2020
Wetlands Strategy
I. Issue Area(s)
The proposed strategy or implementation activities will support the following high-priority enhancement areas (check all that apply):
Aquaculture Cumulative and Secondary Impacts Energy & Government Facility Siting x Wetlands Coastal Hazards Marine Debris Ocean/Great Lakes Resources Public Access Special Area Management Planning
II. Strategy Description I. The proposed strategy will lead to, or implement, the following types of program changes (check all
that apply): A change to coastal zone boundaries; New or revised authorities, including statutes, regulations, enforceable policies,
administrative decisions, executive orders, and memoranda of agreement/understanding; x New or revised local coastal programs and implementing ordinances;
New or revised coastal land acquisition, management, and restoration programs; New or revised special area management plans (SAMP) or plans for areas of
particular concern (APC) including enforceable policies and other necessary implementation mechanisms or criteria and procedures for designating and managing APCs; and,
New or revised guidelines, procedures, and policy documents which are formally adopted by a state or territory and provide specific interpretations of enforceable CZM program policies to applicants, local government, and other agencies that will result in meaningful improvements in coastal resource management.
II. Strategy Goal: _Develop or enhance local government wetland policies through targeted outreach & technical assistance. Program changes that may result directly or indirectly from this strategy include:
Adoption of a model local wetland ordinance currently being developed with Section 309 funding
Incorporation of wetland protection language into existing county/local plans, policies, or ordinances.
Consideration of wetland functions in local hazard mitigation or resilience planning Modifications to the laws or administrative rules governing the Wisconsin Wetland
Inventory that improve wetland spatial data usability and accessibility. State the goal of the strategy for the five-year assessment period. The goal should be the specific program change to be achieved or be a statement describing the results of the project with the expectation that achieving the goal would eventually lead to a program change. For strategies that implement an existing program change, the goal should be a specific implementation milestone. For example, work with three communities to develop revised draft comprehensive plans that consider future sea level rise or, based on research and policy analysis, present proposed legislation on

Wisconsin 2016-2020 Needs Assessment and Strategy Page 49 of 58
49
wetland buffers to state legislature or consideration. Rather than a lofty statement, the goal should be achievable within the time frame of the strategy.
III. Describe the proposed strategy and how the strategy will lead to and/or implement the program
changes selected above. If the strategy will only involve implementation activities, briefly describe the program change that has already been adopted, and how the proposed activities will further that program change. (Note that implementation strategies are not to exceed two years.)
Wisconsin Coastal Management Program (WCMP) will work with partner agencies/organizations and local governments to identify opportunities for local wetland protection through existing authorities. WCMP will coordinate with nonprofit organizations, University of Wisconsin, and Wisconsin County Code Administrators Association to review existing regulations – including zoning ordinances and comprehensive plans – to evaluate the effectiveness of existing local regulations and identify and pursue opportunities to better address prevention of wetland loss through development, mitigation of coastal and riverine flooding, and potential impacts of climate change. WCMP will help to develop and expand technical tools, including mapping and visualization tools, and to assist in development of local policies. WCMP will promote and support implementation of a model ordinance under development through the current Section 309 Strategy. WCMP and its partners will conduct public outreach effort to provide technical assistance to decision-makers, zoning staff, and others who provide policy development support to local governments (i.e., planners). These efforts will lead to revisions of locally-adopted plans and ordinances as well as better implementation of existing regulations.
III. Needs and Gaps Addressed
Identify what priority needs and gaps the strategy addresses and explain why the proposed program change or implementation activities are the most appropriate means to address the priority needs and gaps. This discussion should reference the key findings of the assessment and explain how the strategy addresses those findings. The following priority needs/gaps will be addressed through this strategy: Decision-support tools – the strategy will support development and expansion of decision-support tools
to help communities understand, evaluate, and integrate wetlands into community programs and plans. Training/Capacity Building – WCMP will work with its networked agencies, NGOs, and local
communities to provide information on the the role and value of wetlands across other disciplines and in areas of importance to local communities. Communication and Outreach – WCMP will work with partner organizations to develop communication and outreach tools to encourage and support local wetland planning and policy development.
The strategy directly addresses identified management priorities: Management Priority 1, Local government wetland program enhancements?: WCMP will support local
governments that have prioritized wetland protection would like to update their plans and ordinances. Management Priority 2, Wetland technical assistance, education, and outreach: WCMP will work with
local governments to inform elected officials about the role of wetlands in their communities, and to promote integration of wetlands into plans and ordinances.
Management Priority 3, Watershed based wetland planning and management: WCMP will work with local, state and tribal agencies/organizations to implement watershed based planning and assessment. WCMP will also support efforts to develop or refine wetland data and decision-support tools, to remove barriers to wetland data use, andto facilitate the public wetland planning process.
The current enhancement strategy has identified gaps in local wetland policies and programs, which could begin to be addressed by this new strategy. Further, there is also a need to better integrate

Wisconsin 2016-2020 Needs Assessment and Strategy Page 50 of 58
50
wetlands into broader water resource management policies or plans. Watershed-based wetland planning is a highly favored approach, but it would benefit from improved wetland data and decision-support tools. Local governments have an ongoing need for outreach to inform elected officials about the role of wetlands in their communities. This strategy will focus on local wetland policies and programs through targeted outreach and technical assistance to address these needs.
IV. Benefits to Coastal Management
Discuss the anticipated effect of the strategy, including the scope and value of the strategy, in advancing improvements in the CMP and coastal management, in general. This strategy will benefit coastal management in Wisconsin by increasing awareness and appreciation of wetlands in the coastal zone. Increased awareness will facilitate policy changes as local officials see the benefits to their local communities. Targeted assistance to local communities will also advance WCMP’s goal of improving coordination among government agencies and levels of government, and valuing public participation in coastal management.
V. Likelihood of Success Discuss the likelihood of attaining the strategy goal and program change (if not part of the strategy goal) during the five-year assessment cycle or at a later date. Address the nature and degree of support for pursuing the strategy and the proposed program change and the specific actions the state or territory will undertake to maintain or build future support for achieving and implementing the program change, including education and outreach activities. Much of the groundwork for this strategy will be completed with the current section 309 strategy. The current strategy has resulted in a vast improvement of our understanding of local government wetland programs and policies, and a growing partnership among public and private agencies that support improving wetlands protection in the coastal zone. Partners who are already participating, and can be anticipated to continue their involvement include: Wisconsin Wetlands Association, Wisconsin County Code Administrators, University of Wisconsin-Extension, University of Wisconsin-Stevens Point (Center for Land Use Education), University of Wisconsin-Madison, University of Wisconsin Sea Grant Institute, and Wisconsin Counties Association. The mapping/data management and watershed planning aspects of the strategy also has support from The Nature Conservancy, University of Wisconsin Sea Grant Institute (for decision-support tools), US Army Corps of Engineers (coordinating with regulatory programs), and Wisconsin Department of Natural Resources, U.S. Fish and Wildlife Service, Natural Resources Conservation Service, Tribal Governments, Regional Planning Commissions, and the Wisconsin Land Information Associationas well as partners already mentioned).
VI. Strategy Work Plan
Using the template below, provide a general work plan that includes the major steps that will lead toward or achieve a program change or implement a previously achieved program change. If the state intends to fund implementation activities for the proposed program change, describe those in the plan as well. The plan should identify a schedule for completing the strategy and include major projected milestones (key products, deliverables, activities, and decisions) and budget estimates. If an activity will span two or more years, it can be combined into one entry (i.e., Years 2-3 rather than Year 2 and then Year 3). While the annual milestones are a useful guide to ensure the strategy remains on track, OCRM recognizes that they may change somewhat over the course of the five-year strategy unforeseen circumstances. The same holds true for the annual budget estimates. Further detailing and

Wisconsin 2016-2020 Needs Assessment and Strategy Page 51 of 58
51
adjustment of annual activities, milestones, and budgets will be determined through the annual cooperative agreement negotiation process. Strategy Goal: Develop or enhance local government wetland policies through targeted outreach Total Years: 5 Total Budget: $280,000
Year(s): 1 Description of activities: Promote and distribute Model Wetland Conservation Ordinance (MWCO) to local governments and support organizations/agencies through existing partnerships with University of Wisconsin-Extension, Wisconsin Wetlands Association, and Wisconsin County Code Administrators Major Milestone(s): Distribute print and electronic documents; present MWCO at conferences, meetings, and local committees/workshops Budget: $30,000 Year(s): 1-2 Description of activities: Local implementation of MWCO components Major Milestone(s): Identify counties committed to implementation and target next tier of receptive counties and communities for future implementation; test implementation to identify issues for future updates of MWCO Budget: $50,000 Year(s): 3-5 Description of activities: Enhance MWCO with supplemental information such as scenarios and adapt to changes in state laws affecting wetland or local land use regulation Major Milestone(s): Develop project scenarios to illustrate application of MWCO to review of: conditional use/variance; subdivision applications; stormwater management plans; wetland restoration activities Budget: $75,000 Year(s): 2 Description of activities: Assess technical resources needed to improve wetlands management Major Milestone(s): Needs assessement of decision support tools and capacity of WDNR and other agencies to develop or assist with development of tools/data Budget: $25,000 Year(s): 3-5 Description of activities: Develop technical resources to improve wetland management Major Milestone(s): Support development of improved decision-support tools and address mapping and data information management barriers, including access to Wisconsin Wetland Inventory data. Budget: $50,000 Year(s): 3-5 Description of activities: Targeted outreach and technical assistance based on experience with initial rollout of MWCO and needs of local governments Major Milestone(s): Workshops, training sessions, meetings with local officials Budget: $50,000
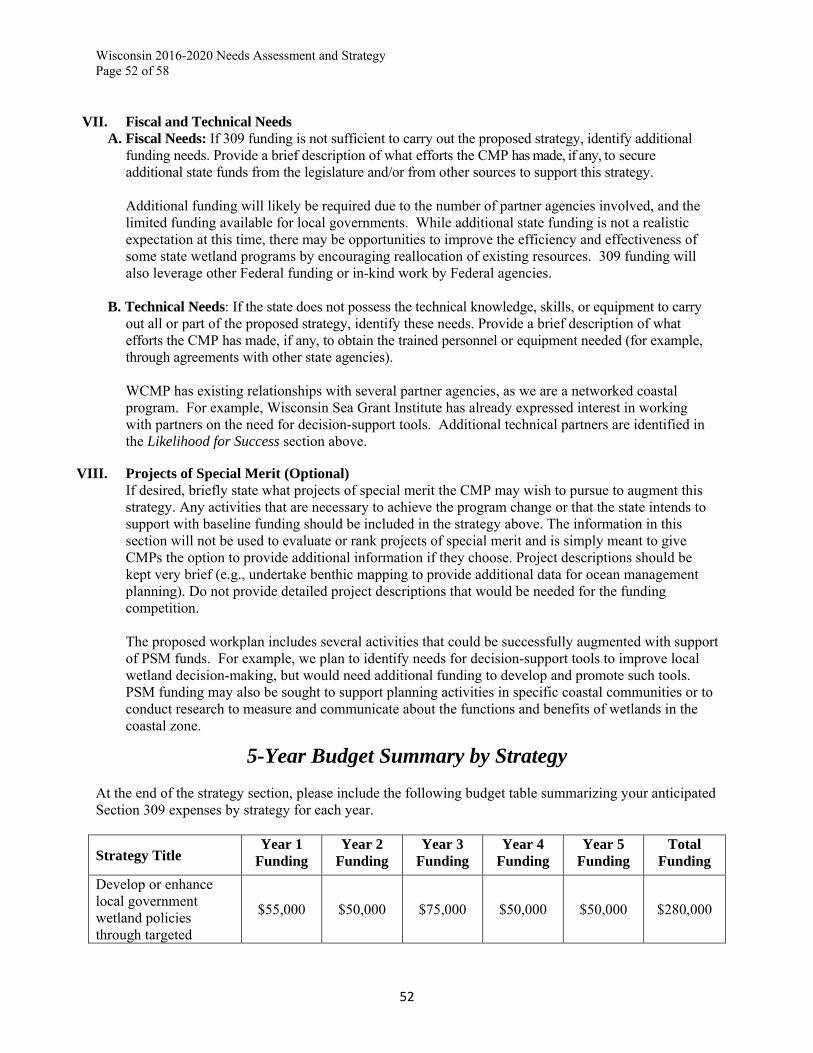
Wisconsin 2016-2020 Needs Assessment and Strategy Page 52 of 58
52
VII. Fiscal and Technical Needs
A. Fiscal Needs: If 309 funding is not sufficient to carry out the proposed strategy, identify additional funding needs. Provide a brief description of what efforts the CMP has made, if any, to secure additional state funds from the legislature and/or from other sources to support this strategy.
Additional funding will likely be required due to the number of partner agencies involved, and the
limited funding available for local governments. While additional state funding is not a realistic expectation at this time, there may be opportunities to improve the efficiency and effectiveness of some state wetland programs by encouraging reallocation of existing resources. 309 funding will also leverage other Federal funding or in-kind work by Federal agencies.
B. Technical Needs: If the state does not possess the technical knowledge, skills, or equipment to carry
out all or part of the proposed strategy, identify these needs. Provide a brief description of what efforts the CMP has made, if any, to obtain the trained personnel or equipment needed (for example, through agreements with other state agencies).
WCMP has existing relationships with several partner agencies, as we are a networked coastal
program. For example, Wisconsin Sea Grant Institute has already expressed interest in working with partners on the need for decision-support tools. Additional technical partners are identified in the Likelihood for Success section above.
VIII. Projects of Special Merit (Optional)
If desired, briefly state what projects of special merit the CMP may wish to pursue to augment this strategy. Any activities that are necessary to achieve the program change or that the state intends to support with baseline funding should be included in the strategy above. The information in this section will not be used to evaluate or rank projects of special merit and is simply meant to give CMPs the option to provide additional information if they choose. Project descriptions should be kept very brief (e.g., undertake benthic mapping to provide additional data for ocean management planning). Do not provide detailed project descriptions that would be needed for the funding competition. The proposed workplan includes several activities that could be successfully augmented with support of PSM funds. For example, we plan to identify needs for decision-support tools to improve local wetland decision-making, but would need additional funding to develop and promote such tools. PSM funding may also be sought to support planning activities in specific coastal communities or to conduct research to measure and communicate about the functions and benefits of wetlands in the coastal zone.
5-Year Budget Summary by Strategy At the end of the strategy section, please include the following budget table summarizing your anticipated Section 309 expenses by strategy for each year.
Strategy Title Year 1
Funding Year 2
Funding Year 3
Funding Year 4
Funding Year 5
Funding Total
Funding
Develop or enhance local government wetland policies through targeted
$55,000 $50,000 $75,000 $50,000 $50,000 $280,000

Wisconsin 2016-2020 Needs Assessment and Strategy Page 53 of 58
53
outreach
Total Funding $50,000 $50,000 $50,000 $50,000 $50,000 $250,000

Wisconsin 2016-2020 Needs Assessment and Strategy Page 54 of 58
54
Coastal Hazards Strategy
I. Issue Area(s) The proposed strategy or implementation activities will support the following high-priority enhancement areas (check all that apply):
Aquaculture Cumulative and Secondary Impacts Energy & Government Facility Siting Wetlands Coastal Hazards Marine Debris Ocean/Great Lakes Resources Public Access Special Area Management Planning
II. Strategy Description
IV. The proposed strategy will lead to, or implement, the following types of program changes (check all that apply):
A change to coastal zone boundaries; New or revised authorities, including statutes, regulations, enforceable policies,
administrative decisions, executive orders, and memoranda of agreement/understanding; New or revised local coastal programs and implementing ordinances; New or revised coastal land acquisition, management, and restoration programs; New or revised special area management plans (SAMP) or plans for areas of
particular concern (APC) including enforceable policies and other necessary implementation mechanisms or criteria and procedures for designating and managing APCs; and,
New or revised guidelines, procedures, and policy documents which are formally adopted by a state or territory and provide specific interpretations of enforceable CZM program policies to applicants, local government, and other agencies that will result in meaningful improvements in coastal resource management.
V. Strategy Goal: Develop or enhance government hazard policies through targeted outreach & technical assistance. Program changes that may result directly or indirectly from this strategy include:
Development of new local regulations. Revisions of locally-adopted plans, maps, and ordinances Develop and refine guidance documents for policy makers and homeowners Possible revision of state regulations and/or enforceable policies within the WCMP Program
Document. VI.
State the goal of the strategy for the five-year assessment period. The goal should be the specific program change to be achieved or be a statement describing the results of the project with the expectation that achieving the goal would eventually lead to a program change. For strategies that implement an existing program change, the goal should be a specific implementation milestone. For example, work with three communities to develop revised draft comprehensive plans that consider future sea level rise or, based on research and policy analysis, present proposed legislation on wetland buffers to state legislature or consideration. Rather than a lofty statement, the goal should be achievable within the time frame of the strategy.

Wisconsin 2016-2020 Needs Assessment and Strategy Page 55 of 58
55
VII. Describe the proposed strategy and how the strategy will lead to and/or implement the program changes selected above. If the strategy will only involve implementation activities, briefly describe the program change that has already been adopted, and how the proposed activities will further that program change. (Note that implementation strategies are not to exceed two years.)
Wisconsin Coastal Management Program (WCMP) will work with partner agencies and local governments through the Coastal Natural Hazards Work Group to review and revise regulations and guidance relevant to natural hazards. WCMP will coordinate with local and regional planning staff to review existing regulations – including zoning ordinances and comprehensive plans – to evaluate the effectiveness of existing local regulations and identify opportunities to better address coastal flooding, shoreline erosion, and potential impacts of climate change. WCMP will coordinate with other state agencies and organizations to assess the potential effects of recent changes to shoreland zoning and the possibility of developing new state regulations to better address land use on erodible, coastal shorelines. WCMP will work with its partners to identify local communities that are affected by the regulatory changes and to develop new, local regulations where possible. In addition, WCMP will review its enforceable policies to determine if new language should be drafted for the WCMP’s Program Document. WCMP will help to develop and expand technical tools, including mapping and visualization tools, to assist in development of local policies. WCMP staff has been informed that new tools and improved data make it easier for communities to communicate the need for new policies, as well as to create new maps and regulations. WCMP will identify opportunities to develop and refine guidance documents for policy makers and homeowners, and WCMP will conduct public outreach effort to provide technical assistance to decision-makers and landowners. These efforts will lead to revisions of locally-adopted plans, maps, and ordinances,and, potentially, state regulations, as well as implementation of existing regulations.
III. Needs and Gaps Addressed
Identify what priority needs and gaps the strategy addresses and explain why the proposed program change or implementation activities are the most appropriate means to address the priority needs and gaps. This discussion should reference the key findings of the assessment and explain how the strategy addresses those findings. This strategy will address coastal erosion and flooding by assisting local communities to develop effective regulations. Coastal erosion and flooding have been identified as two of the most significant hazards within Wisconsin’s Coastal Zone. Discussions with stakeholders and past experiences with coastal hazards issues have indicated that coastal hazard issues can be most effectively addressed through local regulations. The strategy will examine local responses to the hazards and provide support and guidance on developing responses. Additionally, there has been significant interest from homeowners, consultants, and permitting staff on coastal hazards and coastal processes. Through this strategy, WCMP will revise and promote guidance and other outreach efforts for those stakeholders. The following priority needs/gaps will be addressed through this strategy:
Research/Modeling/GIS – the strategy will address modeling needs by expanding GIS and mapping tools where they will be useful to local decision-makers.
Decision-support tools – the strategy will support development and expansion of decision-support tools to help communities understand, evaluate, and explain coastal hazards.
Training/Capacity Building – WCMP will work with its networked agencies and local communities to provide information on evaluating hazards.

Wisconsin 2016-2020 Needs Assessment and Strategy Page 56 of 58
56
Communication and Outreach – WCMP will work with the Wisconsin Coastal Hazards Work Group to identify opportunities to promote best management practices, educate new landowners, and promote guidance and case studies for addressing coastal natural hazards.
The strategy directly addresses identified management priorities:
Management Priority 1, Policy refinement/development: WCMP will assist interested communities in reviewing their existing ordinances and other regulations. Additionally, the strategy will look for opportunities to develop and refine guidance documents related to coastal hazards.
Management Priority 2, Mapping/research: WCMP will work with communities and the Coastal Hazards Work Group to develop research and mapping.
Management Priority 3, Targeted outreach: WCMP will work with the Coastal Hazards Work Group to develop guidance documents and other efforts to educate and provide policy choices for local decision-makers, permitting staff, developers, consultants, and homeowners.
IV. Benefits to Coastal Management
Discuss the anticipated effect of the strategy, including the scope and value of the strategy, in advancing improvements in the CMP and coastal management, in general. The strategy will result in better local regulations for addressing coastal hazards, supporting WCMP’s overarching goal, “To preserve, protect, develop and where possible, to restore or enhance the resources of Wisconsin’s coastal area…” (Wisconsin Coastal Management Program: A Strategic Vision for the Great Lakes, 1999.) The strategy will support public safety and public and property. The strategy will result in improved coordination between government agencies and between agencies and the public.
V. Likelihood of Success Discuss the likelihood of attaining the strategy goal and program change (if not part of the strategy goal) during the five-year assessment cycle or at a later date. Address the nature and degree of support for pursuing the strategy and the proposed program change and the specific actions the state or territory will undertake to maintain or build future support for achieving and implementing the program change, including education and outreach activities. There is a high likelihood of success. As a networked agency, WCMP works closely with other state agencies. Member agencies of the Wisconsin Coastal Hazards Work Group, including Wisconsin Emergency Management, Wisconsin Department of Natural Resources, University of Wisconsin-Madison Dept. of Engineering, and UW Sea Grant Institute have informed development of the strategy and have had an opportunity to review it. WCMP will continue to coordinate regular meetings of the group. WCMP and work group members have worked with communities throughout the coastal zone and have found that some are very interested in improving their responses to coastal hazards. The WCMP and work group members are committed to assisting local communities and helping to improve understanding of and responses to coastal hazards.
VI. Strategy Work Plan
Using the template below, provide a general work plan that includes the major steps that will lead toward or achieve a program change or implement a previously achieved program change. If the state intends to fund implementation activities for the proposed program change, describe those in the plan as well. The plan should identify a schedule for completing the strategy and include major projected milestones (key products, deliverables, activities, and decisions) and budget estimates. If an activity will span two or more years, it can be combined into one entry (i.e., Years 2-3 rather than Year 2 and then Year 3). While the annual milestones are a useful guide to ensure the strategy remains on track,

Wisconsin 2016-2020 Needs Assessment and Strategy Page 57 of 58
57
OCRM recognizes that they may change somewhat over the course of the five-year strategy unforeseen circumstances. The same holds true for the annual budget estimates. Further detailing and adjustment of annual activities, milestones, and budgets will be determined through the annual cooperative agreement negotiation process. Strategy Goal: Local and Regional Guidance/Policy Development and Targeted Outreach Total Years: 5 Total Budget: $250,000
Year(s): 1-5 Description of activities: Research and development of technical tools: WCMP will assist in developing visualization and other tools to assess the impact of coastal hazards and to aid communities in decision-making and planning. Major Milestone(s): Visualization, modeling and other tools that are produced in a format that can be used by decision-makers. Budget: $100,000 Year(s): 1-3 Description of activities: Guidance Development: WCMP will review and revise previously developed model ordinance language to assess whether the model ordinance can be used by communities in addressing recent changes to shoreland zoning rules. If necessary, WCMP will develop additional guidance documents. Major Milestone(s): Revisions to existing and creation of new guidance documents related to coastal natural hazards. Budget:$50,000 Year(s): 2-5 Description of activities: Policy revisions; WCMP will assist communities in developing language to better address hazards in their plans and ordinances. Major Milestone(s): Changes to local land use plans and ordinances Budget: $50,000 Year(s): 1-5 Description of activities: Outreach and technical assistance: WCMP will work with the Coastal Hazards Work Group, communities, and other stakeholders to provide them with assistance relevant to coastal erosion and flooding. Major Milestone(s): Interactions with communities and other stakeholders interested in regulating coastal hazards Budget: $50,000
VII. Fiscal and Technical Needs
5-Year Budget Summary
Strategy Title Year 1
FundingYear 2
Funding Year 3
Funding Year 4
Funding Year 5
Funding Total
Funding
Local and Regional Guidance/Policy
$50,000 $50,000 $50,000 $50,000 $50,000 $250,000

Wisconsin 2016-2020 Needs Assessment and Strategy Page 58 of 58
58
Development and Targeted Outreach
Total Funding $50,000 $50,000 $50,000 $50,000 $50,000 $250,000