wireless priority service for national security...
TRANSCRIPT

1
Wireless Priority Service for National Security / Emergency Preparedness: Algorithms for Public Use
Reservation and Network Performance
Prepared for:
DynCorp 15000 Conference Center Drive
Chantilly, VA
Prepared by:
Nyquetek Inc 8397 Piping Rock Millersville, MD
August 30, 2002
Version 0.9

2
Table of Contents 1. Summary ..................................................................................................................... 5
1.1 Purpose................................................................................................................ 9 1.2 Scope................................................................................................................... 9 1.3 Organization of Paper ......................................................................................... 9
2. Problem Description ................................................................................................. 11 2.1 Severe Congestion ............................................................................................ 12 2.2 NS/EP Leadership and Key Staff Traffic.......................................................... 12 2.3 Network Architecture........................................................................................ 14 2.4 WPS Queuing Features ..................................................................................... 16
3. Public Use Reservation Algorithms.......................................................................... 17 3.1 PURQ-AC Performance.................................................................................... 21 3.2 Public Use Reservation by Channel Allocation (PURCA)............................... 24 3.3 Public Use Reservation by Preference and Limitation (PURPL) ..................... 24 3.4 Public Use Reservation by Departure Allocation (PURDA)............................ 25 3.5 Public Use Reservation with Queuing (PURQ)................................................ 26 3.6 Public Use Reservation with Queuing – All Calls (PURQ-AC)....................... 26 3.7 Allocation Percentage ....................................................................................... 27 3.8 Busy Period and Super Count ........................................................................... 28 3.9 Time Preference Algorithms (TPA).................................................................. 28 3.10 PURAA (and PURQA) ..................................................................................... 29
4. Network Modeling and Benefits............................................................................... 30 4.1 Network Performance in “Hot Spot” Scenario ................................................. 30 4.2 Network Performance in Wide Scenario .......................................................... 31 4.3 End-to-End Performance .................................................................................. 32
5. Sensitivities ............................................................................................................... 33 5.1 Priorities............................................................................................................ 33 5.2 Queue Attributes ............................................................................................... 35
5.2.1 Maximum Number Calls Allowed in Queue ............................................ 35 5.2.2 Maximum Allowed Time in Queue .......................................................... 36 5.2.3 Combination Size and Time...................................................................... 37
5.3 Cell Size ............................................................................................................ 38 5.4 Random Access Control Channel ..................................................................... 40 5.5 GSM SDCCH.................................................................................................... 42 5.6 Directed Retry................................................................................................... 45 5.7 Handovers ......................................................................................................... 47 5.8 Traffic Routing Mix.......................................................................................... 48 5.9 Emergency (911) Traffic................................................................................... 49
6. Public Use Reservation Event (PURE) Simulation .................................................. 51 6.1 Designated Cell Calibration.............................................................................. 57 6.2 Network Calibration.......................................................................................... 59
7. Conclusion ................................................................................................................ 63

3
List of Figures
Figure 1-1: General Benefit Over Broad Range of Congestion Conditions ...................... 6 Figure 1-2: Public Use and NS/EP Benefit for Conventional Overload Range ................ 6 Figure 1-3: Pigeon Language Version of Queuing Algorithm (PURQ-AC) ..................... 7 Figure 2-1: Basic Cellular Network Architecture as Used in Modeling.......................... 15 Figure 3-1: Performance Comparison of PURDA, PURQ, and PURQ-AC.................... 18 Figure 3-2: NS/EP Algorithms with NS/EP Traffic at Allocation Limit......................... 19 Figure 3-3: NS/EP Algorithms with NS/EP Traffic at Cell Saturation ........................... 20 Figure 3-4: Performance versus NS/EP Share of Traffic.................................................. 21 Figure 3-5: PURQ-AC Average Delay for Various NS/EP Traffic Shares ...................... 22 Figure 3-6: PURQ-AC Channel Utilization for Various NS/EP Traffic Shares.............. 22 Figure 3-7: PURQ-AC Share of Call Capacity................................................................ 23 Figure 3-8: Simplified Pigeon Language Expression and Flow Chart of PURDA ......... 25 Figure 3-9: Simplified Pigeon Language Expression and Flow Chart of PURQ ............ 26 Figure 3-10: Simplified Pigeon Language Expression and Flow Chart of PURQ-AC ... 27 Figure 3-11: Pigeon Language Expression and Flow Chart for Super Count .................. 28 Figure 4-1: Hot Spot Scenario Sources of Blocking........................................................ 31 Figure 4-2: Wide Scenario Sources of Blocking ............................................................. 32 Figure 5-1: Performance Sensitivity to Priority Distribution .......................................... 34 Figure 5-2: Performance Sensitivity to Priority Distribution - Saturated ........................ 34 Figure 5-3: Sensitivity to Maximum Number Public Use Calls Allowed to Queue........ 36 Figure 5-4: Sensitivity to Maximum Allowed Public Use Call Time in Queue.............. 37 Figure 5-5: Sensitivity to Allowed Queue Length and Time in Queue ........................... 38 Figure 5-6: Benefit of Super Count for Small Cells ........................................................ 39 Figure 5-7: Sensitivity to Cell Size with Super Count...................................................... 39 Figure 5-8: Sensitivity to RACCH Congestion (50 Traffic Channel Cell)...................... 41 Figure 5-9: Sensitivity to RACCH Congestion (100 Traffic Channel Cell).................... 41 Figure 5-10: GSM NS/EP Sensitivity to SDCCH............................................................ 43 Figure 5-11: Sensitivity to SDCCH Holding Time.......................................................... 43 Figure 5-12: Sensitivity to Number SDCCH and Queue Slots......................................... 44 Figure 5-13: Directed Retry Benefits Public Use in Hot Spot Scenario.......................... 45 Figure 5-14: Directed Retry has Minimal Application in Wide Overload Scenario ........ 46 Figure 5-15: Sensitivity to Handovers ............................................................................. 48 Figure 5-16: Sensitivity to Routing Mix.......................................................................... 49 Figure 5-17: Sensitivity to Extension to 911 Priority Queuing ....................................... 50 Figure 6-1: Designated Cell Input – Part 1 ...................................................................... 53 Figure 6-2: Designated Cell Input – Part 2 ....................................................................... 54 Figure 6-3: Network Design Input................................................................................... 55 Figure 6-4: Simulation Input for Designated Cell ........................................................... 56 Figure 6-5: Summary of Inputs and Outputs ................................................................... 57 Figure 6-6: Erlang B Calibration ..................................................................................... 58 Figure 6-7: Network Calibration....................................................................................... 60

4
List of Tables
Table 2-1: Emergency Preparedness Demographics and WPS User Estimate................ 13 Table 2-2: Rationale for 5.6 Calls per Hour per NS/EP User.......................................... 14

5
1. Summary The Wireless Priority Service (WPS) feature set provides National Security / Emergency Preparedness (NS/EP) calls the benefit of queuing for radio and trunk resources while also ensuring reasonable capacity for Public Use calls. The feature set has the following additional benefits when compared to wireless performance without the feature set:
• Improves Public Use performance (and overall throughput, i.e., carrier resource utilization) during both normal times and congested times when there are no NS/EP calls
• Improves overall throughput during congested times when there are NS/EP calls
• Improves Public Use performance during congested times if NS/EP calling
become excessive (NS/EP benefit suffers when NS/EP calling becomes excessive)
• If NS/EP calling is excessive and there is no Public Use calling, throughput will
remain high and WPS priorities will be applied to assure the highest priority calls are successful, although the overall WPS benefit will be greatly reduced
Over the broad operating range where the feature set delivers its best improvement for NS/EP call access to radio resources (i.e., from 2X to 9X overloads with NS/EP calls at a volume of up to 10% of a cell’s nominal engineered capacity), the feature set has minimal impact on Public Use performance, generally causing about a 2% reduction in Public Use network access success when at the greatest level of NS/EP calling volume. Over a more conventional range of overload (e.g., 1X to 2X where 1.3X is Mothers’ Day) the feature set provides a net improvement to both NS/EP and Public Use calls. The feature set is based on queuing all calls for access to radio traffic channel resources, with NS/EP calls having a higher priority, a larger queue capacity, and a longer maximum time allowed in queue than Public Use calls, and with only NS/EP calls allowed to queue for access to trunk resources. The overall benefit of the feature set is portrayed in Figure 1-1 for NS/EP calls at their expected maximum and the overload range of normal engineered load (1X) to worst case overload (10X), and in Figure 1-2 for the more conventional overload range of 1X to 2X. The benefit of the feature set is expressed in most general terms as the improved likelihood of NS/EP calls accessing the Public Switched Telephone Network (backbone). The PSTN already provides NS/EP calls priority treatments through the Government Emergency Telecommunications Service (GETS) for a high end-to-end likelihood of call completions during congestion conditions causing most conventional (i.e., Public Use) calls to be blocked. A “pigeon language” expression of the basic radio access queuing algorithm is given in Figure 1-3.

6
Figure 1-1: General Benefit Over Broad Range of Congestion Conditions
Figure 1-2: Public Use and NS/EP Benefit for Conventional Overload Range
WPS NS/EP Performance Comparison at Maximum: Overload at 1X-2X
(50 Chs, 13 NS/EP MS @ 10%)
0%
10%
20%
30%
40%
50%
60%
70%
80%
90%
100%
Overload (X Times Engineered Load)
Perc
ent S
ucce
ssB
ackb
one
Net
wor
k A
cces
s
NS/EP Wide 1.000 1.000 1.000 1.000 1.000 1.000 1.000 .999 1.000 .999NS/EP Hot Spot 1.000 1.000 1.000 .999 .999 .999 .999 .998 .998 .998Public Hot Spot .967 .950 .927 .902 .874 .843 .819 .783 .755 .727Hot Spot Analytical Model .947 .930 .907 .881 .851 .821 .791 .762 .734 .707Public Wide .966 .926 .872 .822 .771 .726 .686 .650 .618 .584Wide Analytical Model .947 .901 .852 .808 .768 .732 .699 .669 .641 .615
1.0 1.1 1.2 1.3 1.4 1.5 1.6 1.7 1.8 1.9
Average of 6 x 10,000 Calls (min 1 hr) Event Simulations.02 Engineered GOS, 35% nominal Terminating TrafficOverload applied equally between nbr MS and traffic / MSTerminating traffic goes from 1X to 2X when orig at 10X
Public Use performance better in Hot Spot Scenario
WPS NS/EP Performance Comparison at Maximum: Overload at 1X-10X
(50 Chs, 13 NS/EP MS @ 10%)
0%
10%
20%
30%
40%
50%
60%
70%
80%
90%
100%
Overload (X Times Engineered Load)
Perc
ent S
ucce
ssB
ackb
one
Net
wor
k A
cces
s
NS/EP Wide 1.000 1.000 1.000 .999 1.000 .998 1.000 .998 1.000 .997NS/EP Hot Spot 1.000 .997 .994 .990 .987 .986 .980 .983 .976 .977Public Hot Spot .965 .704 .504 .397 .323 .276 .236 .211 .188 .173Hot Spot Analytical Model .947 .682 .496 .388 .318 .269 .233 .206 .184 .167Public Wide .966 .558 .387 .294 .236 .201 .171 .153 .133 .121Wide Analytical Model .947 .591 .424 .330 .270 .228 .198 .174 .156 .141
1 2 3 4 5 6 7 8 9 10
Average of 6 x 10,000 Calls (min 1 hr) Event Simulations.02 Engineered GOS, 35% nominal Terminating TrafficOverload applied equally between nbr MS and traffic / MSTerminating traffic goes from 1X to 2X when orig at 10X
NS/EP performance Excellent over wide range of scenarios

7
Figure 1-3: Pigeon Language Version of Queuing Algorithm (PURQ-AC)
ARRIVALS 1. When a New Call arrives: (originating or terminating)
a. If radio traffic channel resources available then assign to New Call b. Else: (insufficient radio resources available for assignment, i.e., “no channel
available”) i. If the New Call is an NS/EP call entitled to priority treatment then
1. If NS/EP Queue is Not Full then New Call joins the NS/EP Queue with position determined by priority and time (i.e., FIFO by Priority)
2. Else: (NS/EP Queue is full) a. If NS/EP Queue has call of lesser priority then
i. New Call displaces call of least priority, latest arrival in NS/EP Queue
ii. Displaced call is blocked b. Else New Call is blocked
ii. Else: (the New Call is a Public Use (non-NS/EP) call) 1. If Public Queue is not full then New Call joins the Public
Queue 2. Else New Call is blocked
DEPARTURES 2. When an established call releases: (originating or
i i )
a. Increment Allocation_Counter i. If A llocation_Counter greater than ALLOC_MAX (e.g., 4) set
Allocation_Counter to one (i.e., cylical counter) ii. If Allocation_Counter less than or equal to NS/EP_ALLOC (e.g., 1) then
Set Allocation_Flag to TRUE iii. Else set Allocation_Flag to FALSE
b. If released radio resources enable a new call to be setup then i. If Allocation_Flag is true then
1. If NS/EP Queue is Not Empty then serve NS/EP Queue 2. Else: (NS/EP Queue is empty)
a. If Public Queue is Not Empty serve Public Queue b. Else (Public Queue also empty) Radio Traffic Channel
Resources become available for next arriving call ii. Else: (Allocation_Flag is false)
1. If Public Queue is Not Empty then serve Public Queue 2. Else: (Public Queue is empty)
a. If NS/EP Queue is Not Empty serve NS/EP Queue b. Else (NS/EP Queue also empty) Radio Traffic Channel
becomes available for next arriving call

8
Conclusions drawn in the report are:
1. PURQ-AC is the preferred algorithm providing the best balance of NS/EP likelihood of call completion, Public Use protection, and ease of implementation.
2. PURQ-AC performance in terms of delay, utilization, and convergence to
allocated call capacity share is acceptable.
3. PURQ-AC coupled with trunk queuing gives a high likelihood of success in accessing the PSTN backbone during Hot Spot scenarios where most of the PSTN access blocking is in the radio access.
4. PURQ-AC combined with trunk queuing gives a high likelihood of NS/EP call
success in accessing the PSTN during Wide overload scenarios where most of the blocking is in the trunk groups.
5. Both radio access queuing and trunk queuing are needed to ensure a high end-to-
end likelihood of NS/EP call completion over a wide range of congestion scenarios.
6. The highest priority should be assigned to the smallest group of NS/EP users, and
progressively lower priorities to larger groups.
7. The larger the maximum number of NS/EP calls allowed in the NS/EP queue the better will be NS/EP blocking performance, but the maximum can be set as low as five with acceptable performance.
8. The larger the maximum number of calls allowed in the Public Use queue the
better will be Public Use blocking performance, although a maximum of one call is adequate to ensure reasonable origination capacity is reserved for Public Use and to make Public Use performance better than the nominal (without WPS) Public Use performance.
9. For both NS/EP queues and Public Use queues, blocking performance is better
when the maximum allowed number in queue and maximum allowed time in queue is greater; for practical purposes, NS/EP queues can be set with attributes of maximum number equal to 5 and maximum time equal to 28 seconds, and Public Use queues with maximum number equal to 1 and maximum time equal to 5 seconds.
10. NS/EP performance is very sensitive to small cell size and much less sensitive to
large cell size; addition of Super Count can mitigate the small cell size sensitivity.
11. The Random Access Control Channel can become congested in large cells at high overloads, and NS/EP users’ MSs must be assigned an Access Load Control class
9
which can be exempt from normal Access Load Control restriction when applied to control congestion.
12. It is important to ensure the additive maximum allowed total number of queued
calls (i.e., the sum of the maximums for each queue type) is less than the provisioned number of GSM SDCCH channels.
13. Directed Retry considerably improves Public Use performance during Hot Spot
scenarios, with minimal impact on NS/EP performance; GSM systems must account for Directed Retry use of SDCCH to ensure adequate provisioning for WPS.
14. Handover priority treatment does increase Handover success and has little affect
on NS/EP performance, but does have a small, but statistically significant, negative affect on other Public Use performance.
15. NS/EP performance is insensitive to traffic routing mix (although a change in mix
can vary the blocking sources of Public Use calls).
16. Emergency 911 calls can be given priority queuing at a lower priority than NS/EP calls with significant improvement in the 911 call likelihood of access to a radio traffic channel with minimal impact on NS/EP performance, but does place additional demands on SDCCH provisioning in GSM systems.
1.1 Purpose The purpose of this paper is to document the results of performance modeling to date of the NS/EP Wireless Priority Service (WPS).
1.2 Scope The scope of this paper includes both originating and terminating wireless calls and their access to and from the PSTN. The scope does not include priority treatment within the PSTN except for NS/EP calls leaving the PSTN for termination on a wireless switch; such calls are assumed queued by the PSTN switch as part of GETS. The scope includes the major modeling assumptions and discussion of results from a number of event simulation experiments. The scope does not include a detailed discussion of the simulation package, although a brief discussion is provided. The scope does not include discussion of corresponding analytical models, although a brief description of some primitive models is provided for comparison purposes.
1.3 Organization of Paper The paper is organized as follows:

10
• Section 1: Summary – presents an overview of the results and a description of the purpose, scope, and organization of the paper.
• Section 2: Problem Description – gives a brief description of the need for an
NS/EP WPS, the technical challenges in providing such a service, and the major assumptions used in modeling performance of the feature set to be used in providing such a service.
• Section 3: Public Use Reservation Algorithms – describes basic radio traffic
channel priority access algorithms considered to date, with comparison of the PURQ-AC algorithm with its evolutionary predecessors.
• Section 4: Network Modeling and Bottlenecks – describes the performance of the
feature set as a function of overall network congestion scenarios.
• Section 5: Sensitivities – provides a digest of sensitivity results from examining performance.
• Section 6: Public Use Reservation Event (PURE) Simulation – gives a brief
description of the simulation tool used in conducting the experiments.
• Section 7: Conclusion – concludes the paper.

11
2. Problem Description During major disasters, either man made such as the 9/11 terrorist attack, or natural such as earthquakes and hurricanes, the Public Switched Telephone Network (PSTN) experiences severe congestion. NS/EP leadership and key staff responding to the situation often need to make PSTN calls during such severe congestion. The problem is to enhance the PSTN so that such calls can be recognized and given priority treatment as needed to ensure a high likelihood of call completion even though most other calls are being blocked. The Government Emergency Telecommunications Service (GETS) provides priority treatment of NS/EP calls within the landline segments of the PSTN. However, GETS does not address the wireless segments of the PSTN. Prior to 9/11, the National Communications System (NCS), the White House agency of the Federal government responsible for GETS, had been charged to achieve wireless priority access for NS/EP calls. The NCS petitioned the Federal Communications Commission (FCC) for an affirmative rulemaking on a set of consistent operating principles for such a service, including that it be voluntary on the part of Commercial Mobile Radio Service (CMRS) providers. After a prolonged rulemaking period, the NCS petition was granted, but the lack of a conventional business case for such a service precluded industry from its offering. The events of 9/11 substantially changed the situation in two respects: the Government escalated the urgency for a WPS and allocated the money needed to develop and deploy the required technology, and industry acknowledged the urgency and agreed to work with the Government on an accelerated basis to develop and deploy the technology. The changed situation has lead to a joint Industry Requirements (IR) specification of software enhancements needed for the wireless call processing infrastructures to recognize and authenticate NS/EP calls and provide them effective priority treatment. The feature set has been focused on allowing recognized NS/EP calls to queue for access to radio traffic channels and landline trunks when they encounter blocking due to all resources being used. GETS has proven that queuing is an effective priority treatment mechanism so long as the priority share of the traffic is relatively small and the resource set is reasonably large. However, the FCC rulemaking required that, in addition to providing NS/EP calls priority treatment, CMRS providers ensure a reasonable capacity was maintained at all times to also serve Public Use calls. This requirement has driven the industry to look at algorithms by which Public Use could be protected during events giving rise to NS/EP calling activity. This paper demonstrates how one set of such algorithms has been investigated by simulation and found to give high likelihoods of NS/EP call completion while having a minimal impact on Public Use.

12
2.1 Severe Congestion A network is normally engineered in terms of its blocking Grade Of Service (GOS) for a specified traffic level. In the wireless segments of the PSTN, such GOS engineering is typically a probability of blocking (Pb) for radio traffic channel access equal to two percent (Pb = .020) for the Average Busy Season Busy Hour (ABSBH) traffic. This is also expressed for our purposes as a probability of completion of 98 percent (Pc = .980). For the corresponding cell size, expressed in terms of the engineered number of channels, the ABSBH traffic is considered here to be the nominal engineered load, expressed as 1X. On Mothers’ Day (and other high usage days) the network may experience congestion with overloads of 1.2X to 1.4X. A severe local congestion problem may drive the congestion level in a cell to 1.6X to 2.0X. Networks are designed to sustain their throughputs under such circumstances, but anything over 1X results in a degradation of the GOS, with 2.0X for a 50 channel cell causing the probability of completion to reduce to about 60 percent. For purposes of modeling, it is assumed that the increase in traffic is equally distributed between an increase in the number of users making calls, and the number of calls a user makes, e.g., an overload of 2X is reflected in √2 more than normal users making √2 more than normal calls (2X = √2*√2X) NS/EP events may experience overloads of up to 10X. Under these circumstances, the GOS deteriorates dramatically, with a 50 channel cell having a 12% probability of completion. The probability of completion approaches the relationship
Pc = 1 / Overload
as the overload becomes severe. The challenge for WPS is to achieve a probability of completion for NS/EP calls of better than 90% under such circumstances, and to do so with minimum impact to the Public Use probability of completion.
2.2 NS/EP Leadership and Key Staff Traffic The estimated number of NS/EP Leadership and Key Staff to be served nationwide by the combination of all WPS providers is approximately 50,000. There are a variety of estimates for such a figure; the one applied here is a combination of the demographic estimate of Emergency Preparedness users given in Table 1 with NCS National Security estimates, and tempered by GETS experience. The Cellular Telecommunications and Internet Association (CTIA) tracks the wireless industry infrastructure development. CTIA reports that there are now over 100,000 cell sites in the country. This suggests that an average cell would have less than .5 NS/EP users in it at a random time in which a spontaneous NS/EP event occurred (e.g., an earthquake). A more “typical” estimate applied for modeling purposes is an 80/20 estimate in which 80% of the NS/EP users are in 20% of the cells, giving a “typical” situation of approximately 2 NS/EP users per cell.

13
Table 2-1: Emergency Preparedness Demographics and WPS User Estimate Using the 2 NS/EP users per cell estimate and recognizing that there are now over 100,000,000 wireless subscribers (an average of over 1,000 per cell), the NS/EP user population is conservatively assumed to be typically less than .2% of the user population in a cell at the time of a spontaneous incident. Not all incidents are spontaneous and most incidents result in attraction to the incident of NS/EP users. Similarly, the “typical” has a distribution and a proper design must account for the tails of such a distribution. For purposes of this paper, the maximum concentration of NS/EP users in a cell that must be effectively accommodated by the feature set is assumed to be .8% of the cell’s normally engineered population, or approximately four times the “typical” 80/20 distribution number. If indeed there is an underlying probabilistic distribution of NS/EP users with a probability of .002 (i.e., .2%) likelihood of a random user being an NS/EP user, then the likelihood that in an “average” cell of 1,000 random users the probability of the number of NS/EP users being 8 or less is
Emergency Preparedness Category Total Number
Percent NS/EP Leadership and
Key StaffNumber
WPS
Firefighters 239,000 1.00% 2,390Firefighter Volunteers 1,500,000 .25% 3,750Police Officers 704,000 1.40% 9,856911 operators (landline) 50,000 .00% 0EMTS 150,000 .00% 0Physicians 560,000 .10% 560Physicians Assistants 64,000 .00% 0Registered Nurses 1,970,000 .00% 0Licensed Practial Nurses 699,000 .00% 0Nures's aides 1,310,000 .00% 0Ambulance Dirvers 18,000 .00% 0Water/Waste Personnel 98,000 .10% 98Electric Power Presonnel 47,000 .10% 47Rail Transportation Personnel 83,000 .10% 83Critical Infrastructure Managers 156,000 4.00% 6,240
SubTotal 7,648,000 .30% 23,024
Federal Government Civilian 2,800,000 0.20% 5,600 Active Military 1,370,000 0.25% 3,425 Military Reserve 1,370,000 0.05% 685 SubTotal 5,540,000 0.18% 9,710
Total State Government 4,040,000 0.15% 6,060Total Local Government 10,670,000 0.10% 10,670
GRAND TOTAL 49,464

14
better than .999 (i.e., 99.9%). Thus the design assumption of a maximum NS/EP population of .8% of the cell’s normally engineered population is considered conservative. Congestion, as noted in Section 2.1, is assumed to be a combination of increase in the number of users and in the call attempts per user. The number of NS/EP users is noted above. The CTIA reports that the average cellular user makes an average .44 calls per hour (assumed here to be the ABSBH hour). However, NS/EP users are expected to be more intense users than average. An independent analysis team jointly lead by the CTIA and Telcordia estimated that the average NS/EP user would produce 5.6 calls per hour. A rationale for such an estimate is given in Table 2-2. This is about 13 times the average (non-NS/EP) user.
Table 2-2: Rationale for 5.6 Calls per Hour per NS/EP User Finally, the CTIA reported that the average cellular call holding time is approximately 150 seconds. Government studies of the GETS traffic indicate that NS/EP calls during the 9/11 incident had essentially the same average holding time as other calls, with the same exponential distribution. Thus the 150 second average call holding time was applied to NS/EP calls as well, with an assumed exponential distribution.
2.3 Network Architecture A cellular network consists of:
• Mobile Sets (MS) – the instruments (mobile phones, handsets) used to make and receive the mobile calls.
• Base Transceiver Station (BTS) – the radios and antennas located at what is
commonly referred to as the cell site.
• Base Station Controller (BSC) – the radio resource management assembly used to allocate resources in response to call requests, with one BSC serving multiple BTSs.
• Base Station Subsystem (BSS) – the combination of BSCs and BTSss
NS/EP Users Calls per HourPercent
Population
Weighted Calls per
HourVery Heavy 20 15% 3.0Heavy 6 25% 1.5Medium 2 50% 1.0Light 1 10% 0.1
Total 100% 5.6

15
• Mobile Switching Center (MSC) – the main call processing and switching system
performing the MS authentication, digits analysis and routing of called numbers, switching of call paths, and trunks to outside networks, including SS7 signaling; one MSC typically controls multiple BSCs.
There are various other components in the network, but the above are the essential ones to understand the basics of the approach of using queuing to provide priority treatment for NS/EP calls. These components connect calls to the MSC where they are interconnected to the PSTN Local Exchange Carriers (LECs), Interexchange Carriers (IXCs), the 911 Public Safety Access Points (PSAPs), and other provider and third-party networks. A view of the network as used for modeling is shown in Figure 2-1.
Figure 2-1: Basic Cellular Network Architecture as Used in Modeling The MS and BTS interconnect to each other via the (radio) air interface. The other components are interconnected to each other via “trunks”. The air interface is (generally) provisioned to provide a fixed number of voice-capable traffic channels per cell, as discussed in Section 2.2. The trunk interface from the BTS to the BSC is generally non-blocking. However, the other trunk interfaces are generally concentrated and can be a source of blocking. For modeling purposes, the BSC/MSC interface is assumed to be engineered to a .5% blocking (i.e., Pb = .005), and the MSC to IXC and MSC to LEC interface is assumed to be engineered to a 1% blocking (i.e., Pb = .010). The MSC to PSAP interface is assumed to be engineered to a .5% blocking (i.e., Pb = .005).
7-Cell NetworkTrunks Between
BSC-MSCMSC-IXCMSC-LECMSC-PSAP
Queuing at Designated Interfaces
Base Station
Base StationController (BSC)
Mobile SwitchingCenter (MSC)
IXC
LEC
911 PSAP
1
2a2b
34
5
7-Cell NetworkTrunks Between
BSC-MSCMSC-IXCMSC-LECMSC-PSAP
Queuing at Designated Interfaces
Base Station
7-Cell NetworkTrunks Between
BSC-MSCMSC-IXCMSC-LECMSC-PSAP
Queuing at Designated Interfaces
Base Station
Base StationController (BSC)
Mobile SwitchingCenter (MSC)
IXC
LEC
911 PSAP
11
2a2a2b2b
3344
55

16
2.4 WPS Queuing Features Because the air interface and network interfaces are GOS engineered for specific traffic, they are possible candidates for much worse blocking during severe congestion conditions. The general approach of WPS is to enable NS/EP calls to queue for the next available resource when all resources are busy due to congestion. When cell congestion is of a “Hot Spot” nature, i.e., a single cell or a small set of cells is congested, the radio channels are the bottleneck for service. Such Hot Spot congestion is perhaps the most common experience of congestion in wireless networks. It is due to the lack of spectrum reflected in the limited number of cell radio traffic channels (“channels”) coupled with the mobility of the user herd. The assignment of channels is carried out by the BSC at the request of the MSC. Normally, if no channels are available when a call arrives then the call is blocked and the user is given a busy indication. WPS allows NS/EP calls to queue for the next available radio channel instead of being blocked. The NS/EP user experiences additional delay, but in return receives a greater likelihood that the call will be completed successfully. When cell congestion is network “Wide”, i.e., almost all of the cells are experiencing congestion concurrently, the bottleneck generally moves from the radio channels to the trunks. The assignment of trunks is carried out by the MSC. Normally, if no trunks are available when a call is to be routed then the call is blocked and the user given a busy indication in much the same way as if there had been no radio channel available. Here WPS allows NS/EP calls to queue for the next available trunk instead of being blocked. Again the NS/EP user experiences additional delay, but in return receives the greater likelihood that the call will be completed successfully. The FCC requires that CMRS providers of WPS ensure that a reasonable amount of the spectrum always be available for Public Use. How to provide such assurance when WPS queues calls for the next available channel is discussed in the next section.

17
3. Public Use Reservation Algorithms To ensure that a reasonable amount of spectrum is always available for Public Use, the queuing algorithm for NS/EP calls must be modified to include some form of limit. The algorithm must balance the need to limit NS/EP spectrum use with the general objective of maximizing cell throughput (i.e., total number of successful calls). Several algorithms have been considered, with key algorithms and variations described below. It should be noted that in all the cases there is no reservation of resources for NS/EP calls. Nothing is set aside; no spectrum is allocated for only NS/EP calls. Rather, NS/EP calls are simply allowed to queue for the next available resource when all resources are busy, and then the queue is limited by how often it is served to ensure reasonable spectrum is reserved for Public Use. The three main algorithms compared for performance are:
• Public Use Reservation by Departure Allocation (PURDA) – the NS/EP queue is served once every “n” times a channel becomes available (giving a 1/n allocation to the NS/EP queue).
• Public Use Reservation with Queuing (PURQ) – the PURDA algorithm is
extended by addition of a one-call buffer for Public Use calls which is served first during the Public Use allocation in order to give Public Use calls a greater likelihood of being served in the Public Use allocation.
• Public Use Reservation with Queuing – All Calls (PURQ-AC) – the PURQ
algorithm is extended by making the Public Use buffer a normal queue. The above three algorithms have been event simulated for comparison using the following parameter settings:
a. 50 channel cell, i.e., a typical size for a contemporary metropolitan cell according to the independent analysis team.
b. 13 NS/EP MS with exponentially distributed call holding times of 150 seconds,
and a random (Poisson) call generation process with an average MS rate of 5.6 calls per hour (as discussed in Section 2.2); this level of traffic intensity corresponds roughly to 10% of the normal engineered load for a 50 channel cell and is considered the maximum NS/EP traffic for design purposes.
c. Terminating traffic equal to 35% of the originating traffic at 1X overload, but
growing from 1X to 2X as the originating overload grows from 1X to 10X (reflecting the filtering of the overload done by the network before the traffic reaches the terminating MSC).

18
d. Public (and 911) traffic generated with an increasing number of MS and increasing calling rate combining to give overloads of 1X to 10X when added to the constant NS/EP traffic, and using the same 150 second call holding time with exponential distribution and random (Poisson) arrivals as used for NS/EP calls, but with a lower intensity per MS (.44 calls per hour given as the industry average).
e. Slotted Aloha control channel protocol with a .24 second access time and a
background utilization of 20%.
f. An allocation of 25% for NS/EP and 75% for Public Use.
g. Simulated time of 2 hours or 20,000 originated calls, which comes last, with initialization of the cell to the tested overload and an initial one hour stabilization period before the 2 hour simulated time run.
The probability of successful NS/EP radio channel access for the three different algorithms is over 90% under even the worst congestion, and very much the same for the three algorithms, as shown in Figure 3-1. Notice that the impact on Public Use performance is minimal, with a typical reduction of less than 2% in the probability of success compared to a conventional Erlang B model of performance.
Figure 3-1: Performance Comparison of PURDA, PURQ, and PURQ-AC
WPS Public Use Reservation Algorithms Comparison at Maximum Anticipated NS/EP Use
(50 Chs, 13 NS/EP MS @ 10%)
0%10%20%30%40%50%60%70%80%90%
100%
Overload
Perc
ent S
ucce
ss R
adio
Tr
affic
Cha
nnel
Acc
ess
NS/EP with NS/EP Queue 1.000 .990 .989 .977 .982 .976 .979 .957 .979 .963NS/EP w NS/EP Q, Public Buff .999 .985 .971 .972 .958 .974 .963 .959 .965 .953NS/EP w NS/EP and Public Q .998 .961 .969 .960 .963 .961 .967 .966 .958 .968Public w NS/EP and Public Q .995 .723 .526 .403 .329 .279 .241 .208 .185 .167Public w NS/EP Q, Pub Buff .982 .706 .513 .399 .321 .276 .236 .211 .186 .171Public with NS/EP Queue .979 .700 .512 .389 .324 .274 .239 .205 .185 .165Erlang B Model - All .980 .719 .529 .415 .341 .290 .252 .223 .199 .181
1 2 3 4 5 6 7 8 9 10
”
PURDA, PURQ, and PURQ-AC all excellent NS/EP performance, minimal
Public impact at design “Max”

19
The excellent NS/EP performance with minimal Public Use impact is as expected with NS/EP maximum traffic at 10% of a cell’s nominal engineered traffic capacity. But what happens if NS/EP traffic is underestimated and instead approaches the assigned allocation? As shown in Figure 3-2, in the situation of NS/EP traffic at its allocation limit, NS/EP performance is still very good, although not as good as when the traffic is at its engineered maximum, and Public Use impact is still minimal, although now at a 3% reduction versus the previous 2% reduction.
Figure 3-2: NS/EP Algorithms with NS/EP Traffic at Allocation Limit
Also note that the PURQ and PURQ-AC algorithms close to their limits at much lower overloads than does the PURDA algorithm. They are considered more protective of the Public Use than PURDA. Finally, the question is asked as to what happens if NS/EP users swamp a cell? This case is reflected in a scenario of NS/EP traffic being 160% of a cell’s engineered traffic capacity. At 2X overload, this means that Public Use traffic is only about 40% of a cell’s engineered traffic capacity, although the Public Use allocation is 75% of a cell’s channel capacity. The result is that the average Public Use calls actually perform better than the average NS/EP calls at 2X, and continue to do so until the Public Use traffic grows to a proportional overload for its capacity (at about 6X), as shown in Figure 3-3. Also note that the PURQ-AC algorithm provides the Public Use the greatest protection in this
WPS Public Use Reservation Algorithms Comparison with NS/EP at Allocation Limit
(50 Chs, 36 NS/EP MS @ 30%)
0%10%20%30%40%50%60%70%80%90%
100%
Overload
Perc
ent S
ucce
ss R
adio
Tr
affic
Cha
nnel
Acc
ess
NS/EP with NS/EP Queue .999 .969 .934 .913 .893 .879 .883 .871 .861 .832NS/EP w NS/EP Q, Pub Buff .993 .819 .779 .775 .784 .776 .776 .773 .778 .770NS/EP w NS/EP and Public Q .993 .824 .777 .781 .767 .769 .788 .767 .766 .769Public w NS/EP and Public Q .996 .730 .504 .378 .305 .251 .220 .192 .169 .154Public with NS/EP Q, Pub Buff .996 .730 .501 .379 .308 .256 .220 .193 .171 .156Public with NS/EP Queue .976 .671 .469 .359 .289 .242 .215 .188 .164 .147Erlang B Model - All .980 .719 .529 .415 .341 .290 .252 .223 .199 .181
1 2 3 4 5 6 7 8 9 10
At Allocation Limit, PURQ and PURQ-AC more quickly yield to Public than PURDA
PURDA
PURQ, PURQ-AC

20
circumstance and converges to its allocation at the lowest overload, as shown in Figure 3-4.
Figure 3-3: NS/EP Algorithms with NS/EP Traffic at Cell Saturation Because all the algorithms provide excellent NS/EP performance with minimal Public Use impact at the NS/EP maximum design traffic, but PURQ-AC provides the best protection to the Public Use if NS/EP traffic exceeds its estimated maximum, the PURQ-AC algorithm is selected as the preferred choice and is the basis for further examination in the remainder of this paper. This conclusion is formally stated below:
CONCLUSION: PURQ-AC is the preferred algorithm providing the best balance of NS/EP likelihood of call completion, Public Use protection, and ease of implementation.
A performance summary of PURQ-AC in terms of delay, priorities, and channel utilization, and share of spectrum is given in the first subsection below. The PURDA, PURQ, and PURQ-AC algorithms evolved through a range of considerations. The evolution of the algorithms and additional details on their operation and variations are provided in the additional subsections below.
WPS Public Use Reservation Algorithms Comparison with NS/EP Over Saturation
(50 Chs, 182 NS/EP MS @ 160%)
0%10%20%30%40%50%60%70%80%90%
100%
Overload
Perc
ent S
ucce
ss R
adio
Tr
affic
Cha
nnel
Acc
ess
Public w NS/EP and Public Q .999 .866 .602 .433 .329 .268 .227 .196 .172 .157Public with NS/EP Q, Pub Buff .841 .623 .474 .368 .302 .252 .215 .188 .169 .150Public with NS/EP Queue .544 .387 .306 .253 .216 .189 .167 .146 .135 .124NS/EP with NS/EP Queue .748 .615 .527 .482 .443 .415 .387 .369 .349 .349NS/EP w NS/EP Q, Pub Buff .703 .477 .366 .313 .287 .265 .254 .240 .240 .237NS/EP w NS/EP and Public Q .684 .328 .234 .226 .218 .220 .219 .217 .214 .222Erlang B Model - All .719 .528 .415 .342 .290 .252 .223 .199 .181 .165
2 3 4 5 6 7 8 9 10 11
At NS/EP over saturation, Public does best; PURQ-AC
yields most rapidly

21
Figure 3-4: Performance versus NS/EP Share of Traffic
3.1 PURQ-AC Performance The delay performance of PURQ-AC across the range of loading conditions shows an average delay of 10-15 seconds when operating within its maximum expected traffic. If the traffic exceeds its expected maximum and approaches the allocation, the delay grows accordingly to about 25 seconds. As the traffic passes its allocation, a growing share of calls are blocked, causing the average delay to again decrease. The delay behavior for priority 5 (worst average delay) is shown in Figure 3-5. A good algorithm maximizes resource utilization (i.e., traffic channel utilization) during overload situations. PURQ-AC achieves near full utilization under overload situations, as shown in Figure 3-6.
WPS NS/EP and Public Queuing (PURQ-AC) Versus NS/EP Share of Traffic
(50 Chs "PURQAC")
0%
10%
20%
30%
40%
50%
60%
70%
80%
90%
100%
Overload
Perc
ent S
ucce
ss R
adio
Tr
affic
Cha
nnel
Acc
ess
Typical - 6 MS @ 2.5% .999 .988 .990 .985 .991 .978 .992 .994 .989 .987Max -13 MS @ 10% .998 .961 .969 .960 .963 .961 .967 .966 .958 .968At Limit - 36 MS @ 30% .993 .824 .777 .781 .767 .769 .788 .767 .766 .769Over Limit - 48 MS @ 40% .991 .736 .670 .664 .661 .655 .657 .658 .670 .655Over Saturation - 182 MS @160%
.684 .328 .234 .226 .218 .220 .219 .217 .214
1 2 3 4 5 6 7 8 9 10
PURQ-AC performs well when NS/EP loading less than 10% normal cell load,
as expected even in worst case
Fall off when NS/EP load exceeds anticipated max is rapidly to allocated share

22
Figure 3-5: PURQ-AC Average Delay for Various NS/EP Traffic Shares
Figure 3-6: PURQ-AC Channel Utilization for Various NS/EP Traffic Shares
WPS NS/EP and Public Queuing Delay Versus NS/EP Loading Share
(50 Chs "PURQAC")
0
5
10
15
20
25
30
Overload
Prio
rity
5 R
adio
Tra
ffic
Cha
nnel
A
vera
ge A
cces
s D
elay
(sec
s)
Typical - 6 MS @ 2.5% 4.0 10.9 12.2 12.0 12.3 12.0 11.4 12.6 11.6 13.8Max -13 MS @ 10% 4.2 13.0 13.4 14.1 14.5 13.9 14.7 14.9 14.9 15.2At Limit - 36 MS @ 30% 4.5 19.1 22.2 22.1 22.5 23.0 23.1 23.1 23.0 23.5Over Limit - 48 MS @ 40% 4.5 20.8 24.0 24.3 24.9 24.7 24.5 24.7 25.0 24.9Over Saturation - 182 MS @160%
11.0 9.9 8.9 9.1 8.6 9.2 9.4 9.4 9.3
1 2 3 4 5 6 7 8 9 10
WPS NS/EP and Public Queuing Utilization Versus NS/EP Loading Share
(50 Chs "PURQAC")
0%
10%
20%
30%
40%
50%
60%
70%
80%
90%
100%
Overload
Traf
fic C
hann
el U
tiliz
atio
n %
Typical - 6 MS @ 2.5% 80.5% 98.2% 99.9% 99.9% 100.0% 100.0% 100.0% 100.0% 100.0% 100.0%Max -13 MS @ 10% 80.3% 99.5% 99.9% 99.9% 100.0% 100.0% 100.0% 100.0% 100.0% 100.0%At Limit - 36 MS @ 30% 84.0% 96.8% 99.9% 99.9% 100.0% 100.0% 100.0% 100.0% 100.0% 100.0%Over Limit - 48 MS @ 40% 80.6% 99.4% 99.9% 99.9% 100.0% 100.0% 100.0% 100.0% 100.0% 100.0%Over Saturation - 182 MS @160%
99.6% 100.0% 100.0% 100.0% 100.0% 99.9% 100.0% 100.0% 100.0%
1 2 3 4 5 6 7 8 9 10
Efficient resource use

23
The PURQ-AC rapidly converges to its allocation as the Public Use traffic builds, as shown in Figure 3-7. Note that because there is a minimum of one MS allocated to each priority, the nominal 2.5 percent NS/EP traffic actually produces closer to 3.4 percent of the cell’s saturated capacity. Also note that because a cell’s saturated capacity at overload is more than its normal engineered load, the NS/EP percentage of traffic served during overload is less than the percentage of normal engineered load. Finally, note that as NS/EP traffic approaches its allocation limit, the limit functions like a conventional channel group and NS/EP blocking begins; only when NS/EP traffic is well over the limit does the NS/EP throughput (i.e., completed calls) approach the limit (except when there are insufficient public calls to fully utilize the public allocation). The conclusion from the performance assessment of PURQ-AC is:
CONCLUSION: PURQ-AC performance in terms of delay, utilization, and convergence to allocated call capacity share is acceptable.
Figure 3-7: PURQ-AC Share of Call Capacity
WPS NS/EP and Public Queuing Use ShareVersus NS/EP Loading Share
(50 Chs "PURQAC")
0%
10%
20%
30%
40%
50%
60%
70%
80%
90%
100%
Overload
Shar
e of
Cal
l Cap
acity
Typical - 6 MS @ 2.5% 4.3% 3.5% 3.6% 3.4% 3.3% 3.4% 3.4% 3.5% 3.4% 3.4%Max -13 MS @ 10% 11.1% 9.0% 8.5% 8.4% 8.5% 8.7% 8.4% 8.6% 8.8% 8.6%At Limit - 36 MS @ 30% 31.4% 21.1% 19.9% 19.7% 19.6% 19.6% 19.7% 19.7% 19.9% 19.3%Over Limit - 48 MS @ 40% 41.8% 25.1% 22.5% 22.6% 22.6% 22.4% 22.5% 22.4% 22.6% 22.3%Over Saturation - 182 MS @160%
80.1% 37.6% 26.7% 25.3% 25.1% 25.0% 25.0% 25.0% 25.0%
1 2 3 4 5 6 7 8 9 10
Rapid convergence to allocation as public traffic builds

24
3.2 Public Use Reservation by Channel Allocation (PURCA) Initially it was envisioned to simply limit the number of channels used for NS/EP calls to a set percentage of a cell’s channel capacity, i.e., a Public Use Reservation by Channel Allocation (PURCA) algorithm. In this approach, NS/EP calls that arrive to find all channels busy join the NS/EP queue. When a channel becomes available, if the number of NS/EP calls currently established is less than the allocation, then the NS/EP queue is served. Otherwise, the available channel is reserved for Public Use. This approach quickly ran into two difficulties. First, the vendor community felt it would be hard to implement in a timely and economical manner. The implementation difficulty was largely in the complexity of an up / down counter (with associated audits) and the need for counter actions at both the beginning and end of a call based on the call being an NS/EP call. Second, the carrier and Government communities felt that the approach risked reducing overall throughput (i.e., total number of calls handled), where sustaining maximum throughput is always a key objective during congestion periods. Throughput would be reduced because the counter would impose too hard a limit on NS/EP calls, i.e., suppose the NS/EP traffic were much greater than its allocated share (it should not be, but suppose it were) and the Public Use traffic were much less than its allocated share; then the fixed allocation boundary would not optimize the channel use.
3.3 Public Use Reservation by Preference and Limitation (PURPL)
The Public Use Reservation by Preference and Limitation (PURPL) algorithm was the first of the considered algorithms to adequately address the carrier concerns for Public Use without placing a hard limit on the level of NS/EP calling activity. PURPL combines a trigger on the number of established NS/EP calls to invoke a Dynamic Channel Reservation approach to giving preference to Public Use. With the trigger set to N, whenever the number of established NS/EP calls is less than N, the next available channel is first used to serve the NS/EP queue, and if there are no NS/EP calls in queue, then it would be used to serve the next arriving call, NS/EP or Public Use. When the number of established NS/EP calls reaches N, then the NS/EP queue is not served until at least N channels become available, and arriving NS/EP calls join the NS/EP queue unless there are at least N channels available. Once the number of established NS/EP calls reduces to less than N, then the Dynamic Channel Reservation is suspended until once again triggered. PURPL demonstrated that by providing a preference mechanism for Public Use when NS/EP calling activity exceeds its expectation, the impact to Public Use can be minimized (Public Use performance even improves above performance without the feature) while still providing the flexibility to serve greater NS/EP calling volumes when there is little Public Use calling activity. However, vendor concerns with the additional complexity of tracking established NS/EP calls with an accurate counter on a cell by cell basis, including (soft) handoffs and handins, make it cost and schedule prohibitive.

25
The PURPL concept of providing preference to Public Use for that part of the capacity intended to provide assured public access directly fostered the search for PURDA as a simpler to implement form of the same concept.
3.4 Public Use Reservation by Departure Allocation (PURDA) A simpler approach is based on allocating to NS/EP queued calls a percentage of the departures from an “all channels busy” state, i.e., Public Use Reservation by Departure Allocation (PURDA). The PURDA concept uses a cyclical counter to count departures (i.e., channels becoming available). When the counter is in a specified low range, then a departure is coupled with serving the NS/EP queue. When the counter is in the complementary high range, the available channel is allocated to the next arriving call (the NS/EP queue would not be served). By provisioning the size of the counter and the boundary between the NS/EP (low) range and the Public Use (high) range, the NS/EP queue could be limited to a percentage of new call capacity. NS/EP calls would join the NS/EP queue only when they arrived and found no channels available. Any call that arrived and found a channel available would be served immediately. A pigeon language expression and simplified flow chart for PURDA is shown in Figure 3-4.
Figure 3-8: Simplified Pigeon Language Expression and Flow Chart of PURDA The PURDA concept has the throughput benefit of allowing any call (i.e., NS/EP or Public Use) to be processed if there is a channel available when the call arrives. (If the call is an NS/EP call, it can be “swapped” with a queued call to preserve the first-in, first-
channel?
BlockHappy
No –Public
No –NS/EP
Arrivals
Queue
Yes
When Channel Released: “Departure”Increment Allocation Count
If Allocation Count > 4 then Reset Allocation Count to 1 “Cyclical Counter”If Allocation Count = 1 then service NS/EP Queue “Provides 25% allocation”
If NS/EP queue empty then channel available for next arriving (Public or NS/EP) callIf 2 <= Allocation Count <= 4 then channel available for next arriving call
“Provides 75% allocation”
When Call Arrives (Originating or Terminating): “Arrival”If Channel available then service arriving callIf all Channels busy then:
If NS/EP call then place call in NS/EP queueIf Public call then block call
Arrivals
Departures Queue has capacity ofmany calls: If queue is full, arrival is blocked
channel?
BlockHappy
No –Public
No –NS/EP
Arrivals
Queue
Yes
channel?
BlockHappy
No –Public
No –NS/EP
Arrivals
Queue
channel?
BlockHappy
No –Public
No –NS/EP
Arrivals
Queue
Yes
When Channel Released: “Departure”Increment Allocation Count
If Allocation Count > 4 then Reset Allocation Count to 1 “Cyclical Counter”If Allocation Count = 1 then service NS/EP Queue “Provides 25% allocation”
If NS/EP queue empty then channel available for next arriving (Public or NS/EP) callIf 2 <= Allocation Count <= 4 then channel available for next arriving call
“Provides 75% allocation”
When Call Arrives (Originating or Terminating): “Arrival”If Channel available then service arriving callIf all Channels busy then:
If NS/EP call then place call in NS/EP queueIf Public call then block call
Arrivals
Departures Queue has capacity ofmany calls: If queue is full, arrival is blocked

26
out sequencing of NS/EP calls.) However, it has the corresponding risk that if NS/EP traffic is greater than its allocation, then, even though Public Use Traffic can essentially use all its allocation, the NS/EP traffic will take part of the Public Use allocation. How much it takes is a function of the relative traffic intensities; however, the risk is deemed sufficiently high as to warrant a more sophisticated limit.
3.5 Public Use Reservation with Queuing (PURQ) The Public Use Reservation with Queuing (PURQ) algorithm extends PURDA with the use of a one-call buffer for Public Use calls. The one-call buffer serves to increase the likelihood that a Public Use call will receive first access to a channel becoming available during the Public Use allocation period, i.e., as long as the Public Use traffic intensity is high enough to ensure that the buffer always has a call in it then the Public Use allocation period will always serve Public Use calls, independent of the NS/EP traffic intensity. A single call buffer, combined with a discipline of always putting the most recent arrival in the buffer (and removing as blocked the prior buffered call if not served before the new arrival) appears to provide significant benefit while minimizing delay and resource usage. It does not change the character of Public Use from a “circuit switched” service, but rather is more like a somewhat extended processing time for the Public Use calls. A pigeon language expression and simplified flow chart for PURQ is shown in Figure 3-5.
Figure 3-9: Simplified Pigeon Language Expression and Flow Chart of PURQ
3.6 Public Use Reservation with Queuing – All Calls (PURQ-AC) The Public Use Reservation with Queuing – All Calls (PURQ-AC) algorithm extends PURQ’s one-call buffer for Public Use calls to a multiple call queue. The rationale for such extension was to simplify the development requirement for the vendors by allowing
When Channel Released: “Departure”Increment Allocation Count
If Allocation Count > 4 then Reset Allocation Count to 1 “Cyclical Counter”If Allocation Count = 1 then Service NS/EP Queue “Provides 25% allocation”
If NS/EP queue empty then service Public BufferIf Public Buffer empty then channel available for next arriving call
If 2 <= Allocation Count <= 4 then service Public Buffer“Provides 75% allocation”If Public Buffer empty then channel available for next arriving call
When Call Arrives (Originating or Terminating): “Arrival”If Channel available then service arriving callIf all Channels busy then:
If NS/EP call then place call in NS/EP queueIf Public call then place call in Public Buffer
If previous Call still in Public Buffer then - replace buffered previous call with new Call- buffered previous call becomes blocked
Arrivals
Departures
channel?
Buffer
Happy
No –Public
No –NS/EP
Arrivals
Queue
Yes
Buffer has capacity ofone call:new call replaces old;old is blocked

27
them to reuse their queuing technology, to recognize and accommodate the natural extension of adding queues for other categories of calls (such as 911), and to increase the probable benefit in ensuring Public Use of its allocated spectrum. However, it should be noted that the intent remains to simply provide a way to ensure maximum throughput of Public Use calls and not to change the system character from circuit switched. A pigeon language expression and simplified flow chart for PURQ is shown in Figure 3-6.
Figure 3-10: Simplified Pigeon Language Expression and Flow Chart of PURQ-AC
3.7 Allocation Percentage Queuing as a priority treatment mechanism has the disadvantage of introducing additional delay for the user to experience as part of the call set-up process. For illustration, with 50 channels and 150 seconds call holding time, the average delay between “all-channel-busy” departures is 3 seconds. Although NS/EP calls may require at most 10% of the capacity, requiring the calls to wait for 10 departures (i.e., a 10% limit) as a service interval (i.e., 30 seconds) appears excessive. For this reason, the Government and Industry have agreed to interpret 25% (i.e., one out of four departures) as a reasonable limit on serving NS/EP queued calls. For the illustration, this gives a service interval of 12 seconds versus 30. It provides a complementary allocation of 75% to Public Use, viewed by both industry and the Government as reasonable in terms of the FCC requirement.
When Channel Released: “Departure”Increment Allocation Count
If Allocation Count > 4 then Reset Allocation Count to 1 “Cyclical Counter”If Allocation Count = 1 then service NS/EP Queue “Provides 25% allocation”
If NS/EP queue empty then service Public queueIf Public queue empty then channel available for next arriving call
If 2 <= Allocation Count <= 4 then service Public queue“Provides 75% allocation”If Public queue empty then service NS/EP queue
If NS/EP queue empty then channel available for next arriving call
When Call Arrives (Originating or Terminating): “Arrival”If Channel available then service arriving callIf all Channels busy then:
If NS/EP call then place call in NS/EP queueIf Public call then place call in Public queue
Departures
channel?
Queue
Happy
No –Public
No –NS/EP
Arrivals
Queue
Yes
channel?
Queue
Happy
No –Public
No –NS/EP
Arrivals
Queue
Yes

28
3.8 Busy Period and Super Count Although a 25% allocation serves to provide a reasonable delay, a lesser delay in light NS/EP traffic situations can be achieved by not starting the allocation counter until the first NS/EP call joins the NS/EP queue, i.e., the beginning of a busy period. The first NS/EP call is served with the next available channel, and then successive queued NS/EP calls are served as the counter cycles. When an NS/EP cycle is completed with no calls to be served from the NS/EP queue, then the busy period is over and the counter process is suspended until a new busy period begins. The Super Count is an extension of the Busy Period concept. The Super Count allows up to “n” NS/EP calls to be served from the NS/EP queue before beginning to apply the allocation counter. The Super Count is an up / down count that is incremented whenever an NS/EP call is served, and then decremented whenever the cyclical counter goes through a cycle with no calls in the NS/EP queue. Thus, it provides a running allowable “deficit” on the NS/EP allocation which is repaid at the end of the congestion period. The Super Count is particularly useful in countering possible long delays for NS/EP calls in small cells. A pigeon language expression and simplified flow chart for Super Count is shown in Figure 3-7.
Figure 3-11: Pigeon Language Expression and Flow Chart for Super Count
3.9 Time Preference Algorithms (TPA) NS/EP queued calls can also be limited by setting a timer when a resource becomes available, and during the timer interval only a Public Use arrival can be served, but after the timer interval any arrival can be served, i.e., during the timer interval NS/EP calls would go directly to the NS/EP queue. Two local variations are to a) serve the NS/EP
When Channel Released: Increment Allocation Count
If Allocation Count > 4 then Reset Allocation Count to 1If Allocation Count = 1 then service NS/EP Queue
If NS/EP queue empty then: Decrement SuperCount (But not less than zero)Service Public queue
If Public queue empty then channel available for next arriving callIf 2 <= Allocation Count <= 4 then:
If SuperCount <= 10 and NS/EP queue occupied thenService NS/EP queue and increment SuperCount
Else service Public queue If Public queue empty then service NS/EP queue
If NS/EP queue empty then channel available for next arriving call
Same
Departureschannel?
Queue
Happy
No –Public
No –NS/EP
Queue
Yes
SuperCount allows NS/EP“10 call running deficit” over allocation

29
queue when the timer expires if no public arrival has occurred, independent of whether or not an NS/EP call arrived, and b) serve the NS/EP queue when the timer expires if no public arrival has occurred only if an NS/EP call arrived during the timer interval. The time preference approach gives Public Use protection against high NS/EP calling activity. However, vendors generally do not like introduction of timers and hence time based approaches are not considered further.
3.10 PURAA (and PURQA) The Public Use Reservation by Arrival Allocation (PURAA) provides an alternative approach to PURDA in which call arrivals are designated as Type 1 and Type 2 in accordance with a specified ratio M:N. Arrivals of Type 1 that are NS/EP can proceed to immediately attempt access to a channel, and will join the NS/EP queue if the attempt fails. Arrivals of Type 1 that are Public Use will yield their access attempt to a queued NS/EP call if there is one in the WPS queue, and otherwise attempt to access resources as normal. Arrivals of Type 2 will always attempt normal access to resources, with failure causing NS/EP calls to join the NS/EP queue and Public Use calls to be blocked. The PURAA approach can be made to “behave” essentially the same as PURDA, or with addition of Public Use call buffering, the same as PURQ (in which case it becomes PURQA). It will cause a slight additional NS/EP call queuing delay over PURDA or PURQ because arrivals are used to test resource availability, instead of departures to immediately notify of resource availability. However, in the expected high overload situations intended for WPS, the greater arrival rate compared to departure rate should minimize the performance difference. PURQA is generally viewed as having the same acceptability as PURQ, offering vendors alternative approaches to implementation.

30
4. Network Modeling and Benefits WPS is intended to ensure NS/EP calls a high likelihood of “end-to-end” completion. To achieve such a high likelihood, the calls must get the needed resources at all steps in the call path from origination to termination. The PURQ-AC algorithm makes sure NS/EP calls get the needed radio channel resources at the cell during origination and / or termination. Trunk queuing is the additional feature set by which NS/EP calls receive priority access to the next available trunk when all trunks are busy. As before, no resources are reserved for NS/EP calls; such calls are simply permitted to queue for the next available resource when all resources are busy. The BSS to BSC trunk groups are generally non-blocking, but the other trunk groups generally serve a number of cells. Such trunk groups are GOS engineered and generally are less than the sum of all the radio channels being served, although much larger than any individual cell. During conditions of overload, their concentration of traffic can become a bottleneck affecting the likelihood of call completion. The WPS NS/EP feature set provides for Trunk Queuing on all the concentrated trunk groups in the NS/EP call path to and from the PSTN interconnecting networks. The NS/EP calls are signaled to the PSTN interconnect networks with an NS/EP marker enabling the calls to receive priority treatment within the PSTN via GETS. To evaluate performance of NS/EP calls in reaching the PSTN, a seven-cell network as described in Section 2 is simulated with essentially the same parameters as used in the comparison of the algorithms described in Section 3. The network is simulated under two scenario extremes: where the six surrounding cells of a designated cell experience the same 1X-10X overloading conditions as the designated cell, and where the six surrounding cells remain at 1X while the designated cell experiences an overload of 1X-10X. The former scenario is called the network “Wide” scenario, and the latter scenario is called the “Hot Spot” scenario. As shown in Section 1 (Figure 1-1), PURQ-AC NS/EP network performance is excellent for the two scenarios, with minimal impact to Public Use calls. However, as discussed below, the excellent performance is due to the different queuing features in each of the cases.
4.1 Network Performance in “Hot Spot” Scenario The Hot Spot scenario assumes all the surrounding cells have a nominal 1X load while the designated cell varies its overload from 1X – 10X. Because a 50 channel cell is only about 80% utilized at its normal engineered GOS traffic, during overload its throughput can be increased by only about 25%, i.e., the cell channel utilization can not exceed 100%. Because the designated cell is approximately 1/7 of the total network channel capacity, the increased throughput of 25% will cause an overall network traffic increase of less than (25% / 7 < ) 4%. The 4% increase in cell throughput will cause a stress on the trunk groups and degrade their GOS, but not significantly. Hence, most of the blocking will be attributable to the radio resources, as shown in Figure 4-1, and formally stated in the conclusion below:

31
CONCLUSION: PURQ-AC coupled with trunk queuing gives a high likelihood of success in accessing the PSTN backbone during Hot Spot scenarios where most of the PSTN access blocking is in the radio access.
Figure 4-1: Hot Spot Scenario Sources of Blocking
4.2 Network Performance in Wide Scenario The Wide scenario assumes all the surrounding cells have 1X-10X overload which tracks the designated cell overload from 1X-10X. Because a 50 channel cell is only about 80% utilized at its normal engineered GOS traffic, during overload its throughput can be increased by only about 25%, i.e., the cell channel utilization can not exceed 100%. However, now that all cells have a 25 % increase in their throughput, the concentrated trunk group sees an apparent 25% increase in its loading. Since it is a concentrated resource, its utilization at the engineered GOS is typically higher than the cells’ utilization, and hence the overload drives it into saturation. The calls the saturated trunk group blocks have a correspondingly very short holding time. The short holding times cause the cells’ channels to become more readily available. Since the blocked calls are no longer an insignificant part of the traffic, the cells appear to have many more radio channels available and experience little radio channel blocking. Hence, most of the blocking will be attributable to the trunks and not the radio resources, as shown in Figure 4-2. Note from the figure that the specific bottleneck is the BSC-MSc
WPS Network Hot Spot Performance ImpactGSM 50 Ch, 13 NS/EP MS, NS/EP and Public Queuing "PURQAC" @ 10%, Surrounding Cells at Constant 1X
0%10%20%30%40%50%60%70%80%90%
100%
Overload (X Times Engineered Load)
% S
ucce
ssfu
l R
esou
rce
Acc
ess
Trunks 911 .998 .998 .996 .997 .995 .997 .999 .999 .997 .998Trunks BSC-MSC .999 .996 .996 .995 .996 .997 .996 .995 .996 .998Trunks IXC .998 .995 .994 .995 .993 .997 .995 .996 .995 .995Trunks LEC .994 .989 .988 .989 .991 .992 .987 .989 .990 .987Dsg Cell Radio Erlang B .980 .719 .528 .415 .342 .290 .252 .223 .199 .181Dsg Cell Pub Radio Ch .993 .732 .519 .404 .327 .279 .246 .212 .188 .169Net Analytical Model .972 .700 .509 .398 .326 .276 .240 .211 .189 .171
1 2 3 4 5 6 7 8 9 10
Average of 6 x 10,000 Calls (min 1 hr) Event Simulations.02 Engineered GOS, 35% nominal Terminating TrafficOverload applied equally between nbr MS and traffic / MSTerminating traffic goes from 1X to 2X when orig at 10X
WPS Network Hot Spot Performance ImpactGSM 50 Ch, 13 NS/EP MS, NS/EP and Public Queuing "PURQAC" @ 10%, Surrounding Cells at Constant 1X
0%10%20%30%40%50%60%70%80%90%
100%
Overload (X Times Engineered Load)
% S
ucce
ssfu
l R
esou
rce
Acc
ess
Trunks 911 .998 .998 .996 .997 .995 .997 .999 .999 .997 .998Trunks BSC-MSC .999 .996 .996 .995 .996 .997 .996 .995 .996 .998Trunks IXC .998 .995 .994 .995 .993 .997 .995 .996 .995 .995Trunks LEC .994 .989 .988 .989 .991 .992 .987 .989
WPS Network Hot Spot Performance ImpactGSM 50 Ch, 13 NS/EP MS, NS/EP and Public Queuing "PURQAC" @ 10%, Surrounding Cells at Constant 1X
0%10%20%30%40%50%60%70%80%90%
100%
Overload (X Times Engineered Load)
% S
ucce
ssfu
l R
esou
rce
Acc
ess
Trunks 911 .998 .998 .996 .997 .995 .997 .999 .999 .997 .998Trunks BSC-MSC .999 .996 .996 .995 .996 .997 .996 .995 .996 .998Trunks IXC .998 .995 .994 .995 .993 .997 .995 .996 .995 .995Trunks LEC .994 .989 .988 .989 .991 .992 .987 .989 .990 .987Dsg Cell Radio Erlang B .980 .719 .528 .415 .342 .290 .252 .223 .199 .181Dsg Cell Pub Radio Ch .993 .732 .519 .404 .327 .279 .246 .212 .188 .169Net Analytical Model .972 .700 .509 .398 .326 .276 .240 .211 .189 .171
1 2 3 4 5 6 7 8 9 10
Average of 6 x 10,000 Calls (min 1 hr) Event Simulations.02 Engineered GOS, 35% nominal Terminating TrafficOverload applied equally between nbr MS and traffic / MSTerminating traffic goes from 1X to 2X when orig at 10X
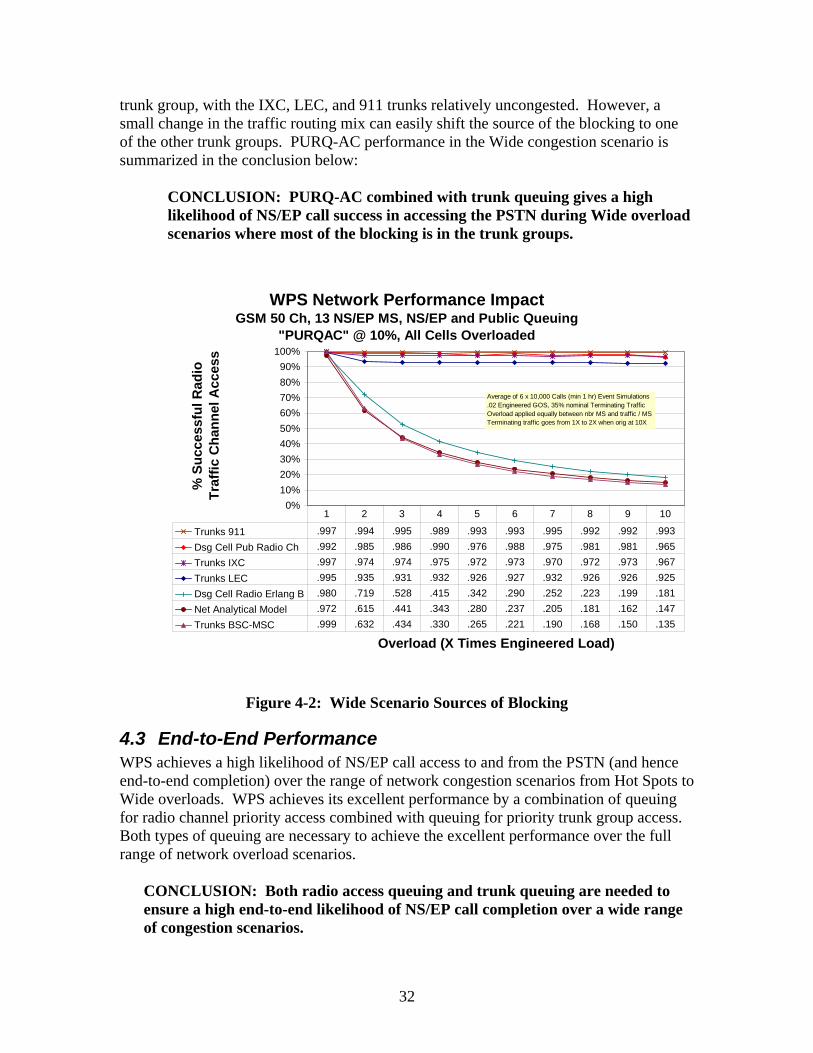
32
trunk group, with the IXC, LEC, and 911 trunks relatively uncongested. However, a small change in the traffic routing mix can easily shift the source of the blocking to one of the other trunk groups. PURQ-AC performance in the Wide congestion scenario is summarized in the conclusion below:
CONCLUSION: PURQ-AC combined with trunk queuing gives a high likelihood of NS/EP call success in accessing the PSTN during Wide overload scenarios where most of the blocking is in the trunk groups.
Figure 4-2: Wide Scenario Sources of Blocking
4.3 End-to-End Performance WPS achieves a high likelihood of NS/EP call access to and from the PSTN (and hence end-to-end completion) over the range of network congestion scenarios from Hot Spots to Wide overloads. WPS achieves its excellent performance by a combination of queuing for radio channel priority access combined with queuing for priority trunk group access. Both types of queuing are necessary to achieve the excellent performance over the full range of network overload scenarios.
CONCLUSION: Both radio access queuing and trunk queuing are needed to ensure a high end-to-end likelihood of NS/EP call completion over a wide range of congestion scenarios.
WPS Network Performance ImpactGSM 50 Ch, 13 NS/EP MS, NS/EP and Public Queuing
"PURQAC" @ 10%, All Cells Overloaded
0%10%20%30%40%50%60%70%80%90%
100%
Overload (X Times Engineered Load)
% S
ucce
ssfu
l Rad
io
Traf
fic C
hann
el A
cces
s
Trunks 911 .997 .994 .995 .989 .993 .993 .995 .992 .992 .993Dsg Cell Pub Radio Ch .992 .985 .986 .990 .976 .988 .975 .981 .981 .965Trunks IXC .997 .974 .974 .975 .972 .973 .970 .972 .973 .967Trunks LEC .995 .935 .931 .932 .926 .927 .932 .926 .926 .925Dsg Cell Radio Erlang B .980 .719 .528 .415 .342 .290 .252 .223 .199 .181Net Analytical Model .972 .615 .441 .343 .280 .237 .205 .181 .162 .147Trunks BSC-MSC .999 .632 .434 .330 .265 .221 .190 .168 .150 .135
1 2 3 4 5 6 7 8 9 10
Average of 6 x 10,000 Calls (min 1 hr) Event Simulations.02 Engineered GOS, 35% nominal Terminating TrafficOverload applied equally between nbr MS and traffic / MSTerminating traffic goes from 1X to 2X when orig at 10X

33
5. Sensitivities Wireless networks and associated simulations involve numerous parameters; the PURQ-AC algorithm for Public Use reservation provides NS/EP calls effective priority treatment with minimal Public Use impact over a broad range of the parameter values. In this section, the sensitivity of PURQ-AC to a number of parameters is examined. The general methodology involved is to hold all parameters at their nominal recommended values, except the one of interest. The parameter of interest is then varied over its excursion range and the corresponding performance metrics are compared for sensitivity.
5.1 Priorities The FCC requires NS/EP priority access follow a structure of five priorities. The performance as a function of priority for a set of three priority allocations has been examined:
• Small High – the priority mix is 3% of NS/EP users assigned to the highest priority, 7% to the next highest, then 14%, 26%, and finally 50% to the lowest priority. This is the recommended assignment distribution.
• Uniform – the priority mix is the same for all priorities, i.e., 20% of the NS/EP
users are assigned to each priority.
• Large High – the priority mix is the inverse of the small high, i.e., 50% are assigned the highest priority, followed by 26%, 14%, 7%, and 3% to the lowest priority.
When NS/EP traffic is at its design maximum of 10% of a cell’s engineered capacity, then NS/EP performance is excellent under all three scenarios and the distribution of the priorities is of minimal consequence. Performance for the highest (1) and lowest (5) priority for each distribution is given in Figure 5-1. However, in the extreme situation of NS/EP traffic swamping a cell, the priority distribution does become important. As expected, in the case of saturation, the Small High priority distribution shows continued excellent performance for the highest priority, whereas the Large High priority distribution shows a marked reduction in the highest priority performance. Although saturation is not a design condition, the behavior difference none-the-less leads to recommending priority assignment in accordance with the Small High priority distribution. This recommendation leads to the conclusion:
CONCLUSION: The highest priority should be assigned to the smallest group of NS/EP users, and progressively lower priorities to larger groups.

34
Figure 5-1: Performance Sensitivity to Priority Distribution
Figure 5-2 : Performance Sensitivity to Priority Distribution - Saturated
Performance Sensitivity to Priority Distribution(50 Chs, 13-15 NS/EP MS, 10%, 16 SDCCH, Q 5 @ 28 sec, 1 @ 5)
0%
10%
20%
30%
40%
50%
60%
70%
80%
90%
100%
Overload (X times Engineered Load)
% C
alls
Suc
cess
ful R
adio
Acc
ess
Small High - 1 1.000 1.000 .997 1.000 1.000 1.000 .983 1.000 1.000 1.000
Uniform - 1 1.000 1.000 .998 .999 1.000 .996 1.000 1.000 .994 .993
Large High - 1 1.000 .999 .999 .996 .995 .997 .997 .996 .988 .996
Small High - 5 1.000 .995 .993 .981 .986 .972 .981 .976 .957 .974
Uniform - 5 1.000 .994 .983 .974 .983 .968 .967 .968 .938 .939
Large High - 5 1.000 .994 .985 .969 .969 .973 .961 .966 .972 .927
2 3 4 5 6 7 8 9 10 11
Small High is 3% Pri 1 progressing to 50% Pri 5 Uniform is 20% for all PrioritiesLarge High is 50% Pri 1 progressing to 3% Pri 5
When NS/EP traffic is 10% of cell design traffic, NS/EP performance is excellent and priority distribution has minimal affect
Sensitivity to Priority Distribution - Saturation(50 Chs, 180-182 NS/EP MS, 160%, 16 SDCCH, Q 10 @ 28 sec, 1 @ 5)
0%
10%
20%
30%
40%
50%
60%
70%
80%
90%
100%
Overload (X times Engineered Load)
% C
alls
Suc
cess
ful R
adio
Acc
ess
Saturated NS/EP Small High - 1 .998 .997 .998 .995 .988 .983 .976 .983 .973 .967
Saturated NS/EP Uniform - 1 .999 .994 .988 .984 .973 .959 .957 .945 .942 .926
Saturated NS/EP Large High - 1 .995 .972 .941 .899 .872 .846 .816 .792 .781 .756
Saturated NS/EP with Small High - 5 .610 .379 .259 .197 .168 .123 .115 .106 .101 .088
Saturated NS/EP with Uniform - 5 .477 .245 .137 .094 .070 .055 .053 .040 .037 .032
Saturated NS/EP Large High - 5 .409 .165 .085 .050 .038 .026 .023 .015 .015 .012
1 2 3 4 5 6 7 8 9 10
Small High is 3% Pri 1 progressing to 50% Pri 5 Uniform is 20% for all PrioritiesLarge High is 50% Pri 1 progressing to 3% Pri 5
When NS/EP traffic saturates a cell (I.e., 160% design traffic), the Small High distribution still gives excellent performance

35
5.2 Queue Attributes Two key queue attributes are examined for sensitivity:
• Maximum Number Calls Allowed in Queue • Maximum Time Calls Allowed in Queue
Each parameter is applied separately to the NS/EP queue and the Public Use queue.
5.2.1 Maximum Number Calls Allowed in Queue For a 50 channel cell with the Maximum Number of Calls Allowed in Queue set for 48 for NS/EP and 48 for Public Use (i.e., a total of 96), at the 10% NS/EP traffic design objective and 10X overload, the maximum number of NS/EP calls queued at one time was 5 (seen once) across a set of six experiments (i.e., 100,000+ calls). However, the maximum number of Public Use calls queued was the maximum allowed value of 48. This is intuitively sensible because the offered NS/EP traffic is only 10% of the cells normally engineered capacity, whereas the offered Public Use traffic is over eight times the cells channel capacity (i.e., assured to produce a channel utilization approaching 100%, and hence full queue occupancy). Thus the issue is the number of Public Use queue slots needed to ensure reasonable Public Use performance, without wasting resources with excessive queuing. Setting the NS/EP queue size to a very conservative 10, Public Use queue sizes of 1, 5, and 10 are examined, with the results indicating a) for low overloads, the larger Public Use maximum allowed calls, the better for Public Use calls, and the worse for NS/EP calls, and b) for high overloads, the number of Public Use queue slots greater than one does not much affect relative performance, as shown in Figure 5-3. Since NS/EP priority performance is always very good, the number of Public Use queue slots is mostly a negotiating matter between the Government and the carriers. From the Government’s perspective, a single queue slot is adequate to ensure reservation of capacity for Public Use and gives the highest NS/EP performance, and hence is the preferred value.
CONCLUSION: The larger the maximum number of NS/EP calls allowed in the NS/EP queue the better will be NS/EP blocking performance, but the maximum can be set as low as five with acceptable performance. CONCLUSION: The larger the maximum number of calls allowed in the Public Use queue the better will be Public Use blocking performance, although a maximum of one call is adequate to ensure reasonable origination capacity is reserved for Public Use and to make Public Use performance better than the nominal (without WPS) Public Use performance.

36
Figure 5-3: Sensitivity to Maximum Number Public Use Calls Allowed to Queue
5.2.2 Maximum Allowed Time in Queue Clearly the longer NS/EP calls are allowed to wait the better will be their likelihood of completion. However, various network timers limit a call’s maximum allowed time in queue to approximately 28 seconds. For trained NS/EP users, such delay may be reasonable. However, for typical public users it may be viewed as extreme. The impact of limiting the maximum allowed time for Public Use calls in queue is examined for a range of 1, 5, 10, and 28 seconds with a maximum allowed queue length of 1. The results indicate that the performance is not very sensitive to the maximum allowed time in queue for Public Use calls. The results are shown in Figure 5-4. The conclusions of this section are as follows:
CONCLUSION: NS/EP calls will perform better the longer the maximum allowed time in the NS/EP queue, although implementation considerations appear to limit such maximum to 28 seconds. CONCLUSION: Public Use performance is not very sensitive to the maximum allowed time for calls in the Public Use queue and a maximum allowed time of 5 seconds can be used to ensure reasonable call origination capacity for Public Use.
Sensitivity to Max Allowed Public Use Queue(50 Chs, 13 NS/EP MS, 10%, Q 10 @ 28 sec, 1-10 @ 28)
0%
10%
20%
30%
40%
50%
60%
70%
80%
90%
100%
Overload (X times Engineered Load)
% C
alls
Suc
cess
fully
Acc
ess
Rad
ios
NS/EP w Pub Q Length = 0 1.000 1.000 1.000 1.000 1.000 1.000 1.000 1.000 1.000 1.000
NS/EP w Pub Q Length = 1 1.000 .994 .990 .983 .980 .973 .971 .970 .965 .959
NS/EP w Pub Q Length = 5 .997 .961 .951 .955 .950 .949 .951 .953 .956 .955
NS/EP w Pub Q Length = 10 .998 .955 .948 .952 .951 .956 .952 .949 .950 .946
Erlang B Analytical .980 .719 .528 .415 .342 .290 .252 .223 .199 .181
Public Use w Q Length = 10 .997 .732 .519 .400 .328 .280 .240 .207 .188 .169
Public Use w Q Length = 5 .993 .726 .519 .400 .329 .276 .237 .211 .188 .171
Public Use w Q Length = 1 .982 .713 .512 .399 .325 .275 .239 .210 .184 .170
Public Use w Q Length = 0 .977 .694 .505 .390 .320 .272 .235 .209 .186 .167
1 2 3 4 5 6 7 8 9 10

37
Figure 5-4: Sensitivity to Maximum Allowed Public Use Call Time in Queue
5.2.3 Combination Size and Time It is clear that NS/EP calls will perform best when their maximum allowed number in queue and maximum allowed time in queue are largest. For practical purposes, there is no apparent need for a maximum allowed number in queue greater than 5 (although we often use 10 for simulation purposes), and because of network timer issues a maximum allowed time in queue of 28 seconds. Public Use calls, because of their cell overload, will fill any size queue provisioned if the maximum allowed time in queue is large enough. However, for practical purposes, their queue size can be limited to ten or less and their time in queue to 10 seconds or less. An overall comparison of the sensitivity is provided by the curves for the joint values of Public Use at 1,5,10, and 28 queue slots with corresponding 1,5,10, and 28 seconds as the maximum allowed time in queue, given in Figure 5-5.
CONCLUSION: For both NS/EP queues and Public Use queues, blocking performance is better when the maximum allowed number in queue and maximum allowed time in queue is greater; for practical purposes, NS/EP queues can be set with attributes of maximum number equal to 5 and maximum time equal to 28 seconds, and Public Use queues with maximum number equal to 1 and maximum time equal to 5 seconds.
Sensitivity - Maximum Allowed Public Use Queue Time(50 Chs, 13 NS/EP MS, 10%, Q 10 @ 28 sec, 1 @ 5-28)
0%
10%
20%
30%
40%
50%
60%
70%
80%
90%
100%
Overload (X times Engineered Load)
% C
alls
Suc
cess
ful R
adio
Acc
ess
NS/EP w Pub @ 1-5 1.000 .998 .994 .991 .985 .983 .981 .978 .983 .978
NS/EP w Pub @ 1-10 1.000 .995 .987 .982 .983 .979 .972 .976 .969 .973
NS/EP w Pub @ 1-28 1.000 .994 .990 .983 .980 .973 .971 .970 .965 .959
Pub @ 1-28 .982 .713 .512 .399 .325 .275 .239 .210 .184 .170
Pub @ 1-10 .983 .707 .514 .398 .323 .273 .238 .208 .189 .169
Pub @ 1-5 .981 .709 .509 .398 .327 .273 .237 .211 .188 .171

38
Figure 5-5: Sensitivity to Allowed Queue Length and Time in Queue
5.3 Cell Size Performance is very sensitive to small cell size because a small cell (e.g., 15 channels) has a slow average “all channels busy” churn rate (e.g., 10 seconds if the average call holding time is 150 seconds). When allocated only 25% of the churn for NS/EP calls, the average time between allocated channel departures may be longer than the maximum allowed queuing time (e.g., 40 seconds for the same example above). Thus, even the highest priority calls will suffer significant performance degradation in small cells. However, as noted in Section 3, the use of a Super Count capability can considerably reduce the sensitivity to small cells. The relative benefit of Super Count on small cell performance is given in Figure 5-6. Performance is relatively insensitive to large cells because a large cell simply has a higher churn rate and hence a better capacity for NS/EP queued calls. With application of Super Count, performance over a range of cell sizes is very good as shown in Figure 5-7.
CONCLUSION: NS/EP performance is very sensitive to small cell size and much less sensitive to large cell size; addition of Super Count can mitigate the small cell size sensitivity.
Sensitivity to Queue Length and Allowed Time(50 Chs, 13 NS/EP MS, 10%, Q 5 @ 28, 1-28 @ 1-28)
0%
10%
20%
30%
40%
50%
60%
70%
80%
90%
100%
Overload (X times Engineered Load)
% C
alls
Suc
cess
fully
Acc
ess
Rad
ios
NS/EP w Pub @ 1-1 1.000 .999 .999 .998 .998 .995 .995 .997 .998 .993
NS/EP w Pub @ 5-5 1.000 .987 .972 .962 .960 .957 .953 .955 .946 .942
NS/EP w Pub @ 10-10 .999 .969 .956 .951 .949 .958 .952 .948 .947 .957
NS/EP w Pub @ 28-28 .997 .950 .950 .943 .951 .947 .952 .948 .946 .950
Pub @ 28-28 .997 .735 .516 .402 .329 .273 .239 .211 .188 .172
Pub @ 10-10 .989 .724 .519 .400 .327 .279 .238 .207 .189 .169
Pub @ 5-5 .984 .712 .518 .402 .324 .276 .240 .210 .185 .170
Pub @ 1-1 .979 .694 .501 .393 .320 .268 .232 .203 .182 .167
1 2 3 4 5 6 7 8 9 10

39
Figure 5-6: Benefit of Super Count for Small Cells
Figure 5-7: Sensitivity to Cell Size with Super Count
WPS NS/EP and Public Queuing Performance At Maximum NS/EP Load Share
"PURQAC" for Small (20 ch), Medium (50 ch), and Large Cells (80 ch)
0%
10%
20%
30%
40%
50%
60%
70%
80%
90%
100%
Overload
Perc
ent S
ucce
ss R
adio
Tr
affic
Cha
nnel
Acc
ess
NS/EP Large 80 Ch Cell 1.000 1.000 1.000 1.000 1.000 1.000 1.000 1.000 1.000 1.000NS/EP Medium 50 Ch Cell .998 .961 .969 .960 .963 .961 .967 .966 .958 .968NS/EP Small 20 Ch Cell .999 .987 .980 .982 .979 .973 .985 .984 .981 .984Pub Small 20 Ch Cell .994 .841 .632 .489 .395 .332 .288 .252 .222 .206Pub Medium 50 Ch Cell .995 .723 .526 .403 .329 .279 .241 .208 .185 .167Pub Large 80 Ch Cell .990 .687 .480 .376 .306 .256 .224 .196 .177 .161
1 2 3 4 5 6 7 8 9 10
Sensitivity to Small Cell Super Count(20 Chs, 6 NS/EP MS, 10%, Q 5 @ 28 sec, 10 @ 10)
0%
10%
20%
30%
40%
50%
60%
70%
80%
90%
100%
Overload (X times Engineered Load)
% C
alls
Suc
cess
fully
Acc
ess
Rad
ios
NS/EP w Super Count = 20 .999 .990 .981 .977 .974 .973 .974 .973 .976 .967
NS/EP w/o Super Count .997 .941 .856 .802 .761 .740 .724 .707 .713 .709
Pub w/o Super Count .988 .820 .626 .490 .402 .339 .294 .261 .232 .210
Pub w Super Count = 20 .987 .813 .612 .484 .392 .332 .289 .252 .227 .204
1 2 3 4 5 6 7 8 9 10

40
5.4 Random Access Control Channel Cellular systems use a Random Access Control Channel (RACCH) for the MSs to initiate call originations. The RACCH uses a slotted aloha access algorithm in which collisions result in random backoffs. Parameters specify the random range of backoff slots, power considerations, maximum number of backoff attempts in a sequence, random range of sequence backoffs, and the maximum number of sequences before a call is blocked. The RACCH serves additional functions other than call origination (e.g., MS registration). As the RACCH nears full utilization, users experience delays and blocking at their MS, and the RACCH channel experiences thrashing in which its throughput is degraded. To counter this affect, the carriers can exert an Access Load Control feature in which to prevent a percentage of the MS from attempting RACCH access when the user presses SEND. WPS assigns NS/EP users a special Access Load Control class that can be kept exempt from such control. The simulation program includes simulation of the RACCH. A background utilization (20%) is specified to account for non-simulated uses. Simulation of the 50 channel cell using a .24 second slot shows no RACCH congestion, as shown in Figure 5-8. However, simulation of a 100 channel cell shows the RACCH becoming progressively congested, reaching its limit of utilization at 9X, and causing a degradation in NS/EP performance at 10X. (Actually the RACCH congestion significantly increases NS/EP delay at 8X.) There is minimal impact on the Public Use performance as most of the calls would be blocked by the radio congestion if not first blocked by the RACCH congestion. The results are shown in Figure 5-9. The results lead to the following conclusion:
CONCLUSION: The Random Access Control Channel can become congested in large cells at high overloads, and NS/EP users’ MSs must be assigned an Access Load Control class which can be exempt from normal Access Load Control restriction when applied to control congestion.

41
Figure 5-8: Sensitivity to RACCH Congestion (50 Traffic Channel Cell)
Figure 5-9: Sensitivity to RACCH Congestion (100 Traffic Channel Cell)
WPS Random Access Control Channel SensitivityGSM 50 Ch, 10%, 13 NS/EP MS 5-28, 1-5
0%
10%
20%
30%
40%
50%
60%
70%
80%
90%
100%
Overload (X times Engneered Load)
% R
AC
CH
Util
izat
ion
/Li
kelih
ood
Rad
io A
cces
s
Random Access Control ChUtilization
.221 .243 .265 .292 .310 .336 .359 .389 .416 .438
NS/EP Likelihood Radio TrafficChannel Access
1.000 .996 .992 .989 .987 .985 .984 .982 .974 .976
Public Use Likelihood RadioTraffic Channel Access
.981 .716 .530 .417 .343 .295 .258 .226 .202 .185
1 2 3 4 5 6 7 8 9 10
Average of 6 x 10,000 Call (min 1 hr) Event Simulations.02 Engineered GOS, 35% nominal Terminating TrafficOverload applied equally between nbr MS and traffic / MSTerminating traffic goes from 1X to 2X when orig at 10X
WPS Random Access Control Channel SensitivityGSM 100 Ch, 10%, 27 NS/EP MS 5-28, 1-5
0%
10%
20%
30%
40%
50%
60%
70%
80%
90%
100%
Overload (X times Engneered Load)
% R
AC
CH
Util
izat
ion
/Li
kelih
ood
Rad
io A
cces
s
Random Access Control ChUtilization
.246 .296 .350 .403 .467 .527 .606 .732 .942 .969
NS/EP Likelihood Radio TrafficChannel Access
1.000 1.000 .999 .999 1.000 .998 .999 .998 .990 .947
Public Use Likelihood RadioTraffic Channel Access
.980 .676 .494 .390 .319 .272 .237 .209 .188 .172
1 2 3 4 5 6 7 8 9 10
Average of 6 x 10,000 Call (min 1 hr) Event Simulations.02 Engineered GOS, 35% nominal Terminating TrafficOverload applied equally between nbr MS and traffic / MSTerminating traffic goes from 1X to 2X when orig at 10X

42
5.5 GSM SDCCH In GSM cellular systems, a Standalone Dedicated Control Channel (SDCCH) is used in performing call setup over the air interface. When the user presses the send button on the phone, the MS first signals over the Random Access Channel using a slotted aloha protocol, and then, if an SDCCH channel is available, the BSC will assign the SDCCH channel to the MS, collect the dialed number (and other data), and, after MSC processing, will attempt to assign a radio traffic channel to the call. SDCCH channels are provisioned resources, typically in sets of 8. Various estimates for the holding time of SDCCH channels as part of call setup range from .5 to 4 seconds. For simulation purposes, the GSM SDCCH holding time for call setup is modeled as an exponentially distributed random time with an average of 2 seconds. With such short SDCCH holding times, SDCCH channels are rarely a resource limitation and indeed find application for additional services, such as the Short Messaging Service. However, when a call is queued, it must hold onto its SDCCH channel while in the queue until it is served and assigned a traffic channel. If the call can queue for up to 28 seconds, the SDCCH average holding time can increase dramatically. For the case of No Features in a 50 channel cell, provisioning of a minimal 8 SDCCH channels causes only a 1% blocking from lack of SDCCH availability at 10X overload. Addition of NS/EP call queuing (i.e., PURDA) with a maximum queue size of 5 and a maximum allowed time in queue of 28 seconds, still leaves the SDCCH blocking at about 1%. However, introduction of Public Use queuing, whether via PURQ or PURQ-AC has a much more dramatic impact. To keep the SDCCH blocking at around 1% with the addition of PURQ (or PURQ-AC) with a single call Public Use buffer (or queue) with maximum allowed time in buffer (or queue) of 5 seconds requires adding another SDCCH channel, i.e., going from 8 to 9. Addition of Public Use queuing with 5 queue slots with maximum allowed queuing time of 28 seconds (i.e., the same as NS/EP calls) requires an additional 5 SDCCH channels. The results show a marked SDCCH sensitivity to the number of Public Use queue slots, as shown in Figure 5-10. However, it also should be noted that many current GSM systems already provide a limited approach to Public Use queuing and are already provisioned with 16 or 24 SDCCH channels for a 50 channel cell. In these cases the introduction of PURQ-AC serves only to introduce an ordering to the queue, and places no additional burden on the number of SDCCH channels. The number of SDCCH channels required is also very sensitive to the average SDCCH holding time for non-queued calls. A comparison of average holding times at 1, 2, and 4 seconds shows that a 4 second average holding time (comparable to the allowed Public Use queuing time of 5 seconds) requires almost double the number of channels to get the same performance as 2 seconds, and at one second, SDCCH blocking is a non factor, as shown in Figure 5-11.

43
Figure 5-10: GSM NS/EP Sensitivity to SDCCH
Figure 5-11: Sensitivity to SDCCH Holding Time
Comparison of Algorithms: SDCCH(50 Ch, 10% NS/EP, 2 Sec HT, NS/EP 5@28)
0.0%
5.0%
10.0%
15.0%
20.0%
25.0%
30.0%
35.0%
40.0%
Number of SDCCH
Perc
enta
ge C
alls
Blo
cked
by
SD
CC
H N
on-A
vaila
bilit
y
PURQ-AC w Pub 5@28 .3716 .2428 .1401 .0745 .0346 .0123 .0045 .0014 .0003PURQ-AC w Pub 2@10 .0711 .0329 .0129 .0043 .0013 .0003 .0001 .0000PURQ-AC w Pub 1@5 .0313 .0111 .0041 .0009 .0004 .0000PURQ w Pub 1@5 .0337 .0122 .0043 .0015 .0003 .0001 .0000PURDA .0140 .0047 .0014 .0003 .0001 .0000No Features .0100 .0030 .0007 .0001 .0000
8 9 10 11 12 13 14 15 16
NS/EP Queuing has minimal affect
Significant Public Use Queuing has Major affect
Sensitivity to SDCCH Holding Time(50 Ch, 10% NS/EP, 1-4 Sec HT, PURQ-AC w NS/EP 5@28, Pub 1@5)
0.0%
5.0%
10.0%
15.0%
20.0%
25.0%
Number of SDCCH
Perc
enta
ge C
alls
Blo
cked
by
SD
CC
H N
on-A
vaila
bilit
y
4 Sec SDCCH Holding Time .2360 .1708 .1150 .0735 .0439 .0243 .0115 .0046 .00182 Sec SDCCH Holding Time .0313 .0111 .0041 .0009 .0004 .00001 Sec SDCCH Holding Time .0007 .0001 .0000No Features with 2 Sec SDCCHHolding Time
.0100 .0030 .0007 .0001 .0000
8 9 10 11 12 13 14 15 16
1 Sec Average SDCCH Hold Time essentially doubles availability compared to 2 sec
4 Sec Average SDCCH Hold Time essentially halves availability compared to 2 sec

44
In GSM systems the SDCCH channel is used for the dialed digits collection. Since WPS uses the dialed digits to identify an originating call as an NS/EP call, an SDCCH channel must be available to recognize an NS/EP call and discern its priority. If all the SDCCH channels are used by calls in queue, then a higher priority NS/EP origination will not be recognized and will not be allowed to displace a lower priority NS/EP call in queue. Similarly, since the Public Use queue will always fill during overload, if the Public Use queue maximum is the same (or nearly the same) as the number of SDCCH channels, then there will be less SDCCH capacity to recognize NS/EP calls and allow them to queue. The impact is illustrated in Figure 5-12 where the system has 16 SDCCH and 5
Figure 5-12: Sensitivity to Number SDCCH and Queue Slots
calls allowed in the NS/EP queue, and, in one case, the system allows up to 16 calls in the Public Use queue (the same as the number of SDCCH), and in the other case, allows only 8 calls in the Public Use queue. The case of the 16 calls allowed in the Public Use queue shows a marked NS/EP degradation in performance at the 9X and 10X overloads compared to the 8 calls allowed in the Public Use queue, although there is no statistically significant difference in the Public Use performance. For these reasons, general provisioning guidance is to ensure the additive maximum allowed total number of queued calls (i.e., the sum of the maximums for each queue type) is less than the provisioned number of SDCCH channels.
CONCLUSION: It is important to ensure the additive maximum allowed total number of queued calls (i.e., the sum of the maximums for each queue type) is less than the provisioned number of SDCCH channels.
WPS NS/EP Performance Comparison with 16 SDCCH and Max 21 Q Slots vs Max 13 Q Slots
(50 Chs, 13 NS/EP MS @ 10%, NS/EP 5 @ 28, Pub 8-16 @ 5)
0%
10%
20%
30%
40%
50%
60%
70%
80%
90%
100%
Overload (X Times Engineered Load)
Perc
ent S
ucce
ssR
adio
Tra
ffic
Cha
nnel
Acc
ess
NS/EP w Pub 8 Q Slots 1.000 .986 .970 .954 .955 .951 .951 .948 .944 .945NS/EP w Pub 16 Q Slots 1.000 .987 .970 .958 .953 .944 .948 .937 .914 .885Pub w 16 Q Slots .985 .718 .513 .399 .325 .273 .237 .212 .189 .172Pub w 8 Q Slots .985 .711 .517 .399 .324 .274 .236 .210 .188 .169
1 2 3 4 5 6 7 8 9 10
Average of 6 x 10,000 Calls (min 1 hr) Event Simulations.02 Engineered GOS, 35% nominal Terminating TrafficOverload applied equally between nbr MS and traffic / MSTerminating traffic goes from 1X to 2X when orig at 10X
NS/EP performance affected by Public Use queue size versus number SDCCH

45
5.6 Directed Retry Directed Retry is the process by which an MSC redirects calls to a neighboring cell if there is congestion in the originating cell. For Directed Retry to work, the MS must be in an overlap range between cells so that it can receive an adequate signal from a neighboring cell, and the neighboring cell must have a channel available. In metropolitan areas, the overlap is often considerable. In the modeling, a 40% likelihood that a MS will be in an acceptable radio signal strength overlap region with each of the six surrounding cells is assumed. Whether or not the neighboring cell has an available channel depends in large part on the congestion scenario. In a Hot Spot scenario where the designated cell is the only congested cell, and the surrounding cells are all experiencing their normal ABSBH traffic, the benefit of Directed Retry for Public Use calls can be substantial, as shown in Figure 5-13. (Note that the figure shows radio traffic channel access, and not network access; network access performance will be somewhat less due to minor trunk overloading from the designated cell.)
Figure 5-13: Directed Retry Benefits Public Use in Hot Spot Scenario
Directed Retry - Surrounding Cells Normal Load(54 Chs, 13 NS/EP MS, 10%, 8 SDCCH, 5/30, 2/5 Queue)
0%
10%
20%
30%
40%
50%
60%
70%
80%
90%
100%
Overload (X times Engineered Load)
% C
alls
Acc
ess
Rad
io R
esou
rces
NS/EP No Directed Retry 1.000 1.000 1.000 1.000 1.000 1.000 1.000 1.000 1.000 1.000NS/EP Yes Directed Retry 1.000 1.000 1.000 1.000 .999 .999 .996 .995 .990 .982Public Yes Directed Retry .998 .979 .972 .965 .957 .953 .945 .940 .928 .921Public No Directed Retry .984 .719 .519 .405 .331 .278 .238 .211 .191 .172
1 2 3 4 5 6 7 8 9 10
Public Use radio access greatly improved by Directed Retry

46
In the case of a Wide overload, radio resources are not the bottleneck and Directed Retry has minimal application and benefit, as shown in Figure 5-14. (Again, note that the figure portrays radio traffic channel access and not network access; network access for Public Use will be substantially worse as trunks are the bottleneck.)
Figure 5-14: Directed Retry has Minimal Application in Wide Overload Scenario In GSM systems, SDCCH channels must be held while checking for Directed Retry. The nominal time for such checking is expected to be quite small; however, if Public Use calls are (essentially) queued for some (provisionable) interval while Directed Retry is (repeatedly) attempted, the impact on SDCCH provisioning can be significant. This is offset by the benefits as noted above. The figure illustrates GSM with 8 SDCCH with their average holding times increased by 2 seconds for each cell found in the radio range of a neighbor before a channel is received. As can be seen, NS/EP performance remains high and Public Use performance is significantly improved even with PURQ-AC. It is expected that carriers that use Directed Retry have already taken the SDCCH provisioning implications into account, and additional sensitivity is not examined here.
CONCLUSION: Directed Retry considerably improves Public Use performance during Hot Spot scenarios, with minimal impact on NS/EP performance; GSM systems must account for Directed Retry use of SDCCH to ensure adequate provisioning for WPS.
Directed Retry - Surrounding Cells Overloaded(54 Chs, 13 NS/EP MS, 10%, 8 SDCCH, 5/30, 2/5 Queue)
0%
10%
20%
30%
40%
50%
60%
70%
80%
90%
100%
Overload (X times Engineered Load)
% C
alls
Acc
ess
Rad
io T
raffi
c C
hann
els
NS/EP No Directed Retry 1.000 1.000 .999 .999 .999 .999 .998 1.000 1.000 .995NS/EP Yes Directed Retry 1.000 1.000 1.000 1.000 1.000 1.000 1.000 1.000 1.000 1.000Public Yes Directed Retry .998 .999 .999 1.000 1.000 .999 .999 .999 .999 .998Public No Directed Retry .985 .977 .982 .979 .978 .976 .974 .977 .971 .956
1 2 3 4 5 6 7 8 9 10
Public Use radio traffic channel access is already high and Directed Retry has minimal benefit

47
5.7 Handovers Cellular system Handovers enable users to be mobile while engaged in an established call. When the user moves from one cell to a new cell with a stronger signal, the system automatically reassigns his radio channel from the new cell. The process is generally transparent to the user, but requires considerable processing by the cellular system. A time window, typically of several seconds, exists from the time a new cell’s signal first becomes stronger until the old cell’s signal is of inadequate strength. (Note that in CDMA systems the signals from both cells are generally used in the transition period, i.e., a soft handover versus a hard handover.) Once NS/EP calls are established, they are given handover the same as any other call. Maintaining established calls is generally considered more important than serving new originations from a customer satisfaction perspective, and vendors provide carriers feature capabilities to give handovers higher priority for access to radio channels than new originations. The most basic feature is simply giving handovers the highest priority to access the next available radio channel. This feature is considered part of the baseline. Additionally, a common feature is to permit carriers to dynamically reserve “n” channels to accommodate handovers. In this feature, the system always tries to keep the last “n” channels available for handover. Whenever one of these channels is assigned to handover, then the next available channel is assigned to the reserve pool until “n” is replenished. To examine the impact of such priority treatment on NS/EP performance, handovers have been simulated. Handouts (i.e., calls leaving the designated cell) serve only to reduce the average holding time of the calls; their success / failure is the result of the destination cell’s state. Handins (i.e., calls arriving into the designated cell) are either maintained or blocked, depending on whether a channel is available in the destination (designated) cell. The window for such a channel to become available is assumed random with an average time of seven seconds and an exponential distribution. For purposes of simulation, Handins are modeled as 30% of the terminating traffic (recognizing that the terminating traffic does not grow with overload at the same rate as originating traffic). The results of the simulation show that NS/EP performance is very little affected by the handover process and the number of channels dynamically reserved for handovers. However, Handin success is significantly affected by the dynamic channel reservation process with a small, but statistically significant impact on the Public Use performance. The performance result is intuitively pleasing and reflects the generally notion that the dynamic channel reservation is essentially reducing the cell channel count for Public Use call originations by “n”. The results are shown in Figure 5-15 for “n” equal to 0, 1, and 2.
CONCLUSION: Handover priority treatment does increase Handover success and has little affect on NS/EP performance, but does have a small, but statistically significant, negative affect on other Public Use performance.

48
Figure 5-15: Sensitivity to Handovers
5.8 Traffic Routing Mix NS/EP performance is generally not sensitive to the routing mix of traffic, i.e., in a system designed to support 35% IXC, 65% LEC routing, NS/EP performance remains high even with a mix of 50% IXC and 50% LEC. The high level of performance is consistent with the general notion that the NS/EP features are designed to counter congestion. However, it should be noted that such a shift in routing mix does impact Public Use performance and illustrates how, even in a Hot Spot scenario, the performance bottleneck can shift from all radio congestion to a combination of radio and trunk congestion, as shown in Figure 5-16. In the figure, the top line(s) show the excellent NS/EP performance and the lack of blocking on the BSC-MSC, 911, and LEC trunk groups. The middle line indicates that the shift in traffic has now overloaded the IXC trunk group and it is experiencing moderate congestion. It would be essentially the performance curve for the NS/EP traffic except for the NS/EP trunk queuing feature. The lower lines indicate that radio congestion is still the principal bottleneck, but no longer the only source of blocking. The results illustrate how trunk queuing is an important feature for NS/EP traffic to overcome shifts in the traffic routing mix even during Hot Spot scenarios.
CONCLUSION: NS/EP performance is insensitive to traffic routing mix (although a change in mix can vary the blocking sources of Public Use calls).
Sensitivity to Handover Reservation(50 Ch, 10% NS/EP, PURQ-AC)
0%10%20%30%40%50%60%70%80%90%
100%
Overload (X times Engineered Load)
Perc
enta
ge S
ucce
ss
Acc
ess
Rad
ios
NS/EP w HI @ Rsv 0 1.000 .999 .997 .996 .989 .990 .983 .987 .984 .985NS/EP w HI @ Rsv 1 1.000 .999 .997 .996 .991 .989 .984 .987 .989 .985NS/EP w HI @ Rsv 2 1.000 .999 .996 .994 .994 .992 .990 .985 .983 .983Handin @ Rsv 2 1.000 .998 .992 .988 .988 .981 .984 .976 .967 .971Handin @ Rsv 1 1.000 .982 .966 .958 .938 .944 .929 .927 .921 .921Handin @ Rsv 0 .999 .911 .836 .795 .784 .768 .767 .764 .755 .766Public Use w HI @ Rsv 0 .998 .820 .605 .473 .388 .331 .288 .251 .223 .205Public use w HI @ Rsv 1 .997 .805 .600 .465 .385 .327 .284 .247 .220 .202
1 2 3 4 5 6 7 8 9 10

49
Figure 5-16: Sensitivity to Routing Mix
5.9 Emergency (911) Traffic An attractive facet of PURQ-AC is that the general queuing structure can be readily extended to accommodate additional priorities for other classes of traffic, such as 911 emergency calls. There are many policy questions on how best to treat 911 calls, and there are implementation issues for vendors in extending their WPS queuing process to 911 calls (which are already given forms of special treatment). However, in concept, by applying the same sort of priority queuing process to 911 calls as applied to NS/EP calls, the likelihood of radio access for 911 calls can be significantly improved, as shown for the Hot Spot scenario in Figure 5-17. The sensitivity of NS/EP performance to 911 queuing is also portrayed in the figure and can be seen to be minimal. Although 911 priority queuing looks attractive, in the case of GSM it should be noted that such queuing would place additional demands on the SDCCH channels much the same as public queuing, as discussed in Section 5.4.
CONCLUSION: Emergency 911 calls can be given priority queuing at a lower priority than NS/EP calls with significant improvement in the 911 call likelihood of access to a radio traffic channel with minimal impact on NS/EP
Network Performance Sensitivity to Routing MixGSM 50 Ch, 10%, 13 NS/EP MS 5-28, 1-5
50 / 50 IXC / LEC Traffic Mix, Hot Spot Scenario
0%10%20%30%40%50%60%70%80%90%
100%
Overload (X Times Engineered Load)
% S
ucce
ssfu
l Acc
ess
NS/EP Network Access 1.000 .999 .995 .993 .990 .991 .986 .983 .989 .981Trunks BSC-MSC 1.000 1.000 1.000 1.000 1.000 1.000 1.000 1.000 1.000 1.000Trunks LEC 1.000 1.000 1.000 1.000 1.000 1.000 1.000 1.000 1.000 1.000Trunks 911 .997 .998 .996 .996 .998 .996 .998 .995 .995 .993Trunks IXC .777 .742 .741 .737 .736 .741 .735 .735 .738 .735Pub Radio Channel Access .998 .812 .600 .469 .387 .325 .284 .248 .222 .204Public Network Access .883 .707 .523 .408 .338 .284 .248 .216 .194 .177
1 2 3 4 5 6 7 8 9 10
Average of 6 x 10,000 Calls (min 1 hr) Event Simulations.02 Engineered GOS, 35% nominal Terminating TrafficOverload applied equally between nbr MS and traffic / MSTerminating traffic goes from 1X to 2X when orig at 10X

50
performance, but does place additional demands on SDCCH provisioning in GSM systems.
Figure 5-17: Sensitivity to Extension to 911 Priority Queuing
WPS 911 Network Performance GSM 50 Ch, 10%, 13 NS/EP MS 5-28, 5-28, 1-5
911 @ 10% with 5-28 Queue
0%
10%
20%
30%
40%
50%
60%
70%
80%
90%
100%
Overload (X Times Engineered Load)
% S
ucce
ssfu
l Acc
ess
NS/EP Network Access 1.000 .995 .987 .979 .973 .971 .963 .956 .956 .957911 Network Access 1.000 .998 .993 .991 .972 .960 .929 .903 .858 .824Public Network Access (and 911with No PURQ-AC queuing)
.966 .681 .477 .364 .286 .242 .207 .180 .160 .146
1 2 3 4 5 6 7 8 9 10
Average of 6 x 10,000 Calls (min 1 hr) Event Simulations.02 Engineered GOS, 35% nominal Terminating TrafficOverload applied equally between nbr MS and traffic / MSTerminating traffic goes from 1X to 2X when orig at 10X

51
6. Public Use Reservation Event (PURE) Simulation The Public Use Reservation Event (PURE) simulation program consists of three main modules:
• Excel Input / Output – Microsoft Excel spreadsheets are used as the input and output mechanism for the program.
• Dynamic Linked Library (DLL) – the actual simulation logic is implemented in a
Microsoft DLL written in “C”.
• Visual Basic Application (VBA) – Microsoft VBA is used in a macro for the Excel spreadsheets to transfer the Inputs and Outputs between Excel and the DLL.
Running on a 700 Mhz Pentium III with 256K memory, the program requires about 1 second of execution time to simulate two hours of a 50 channel BTS/BSC/MSC combination, and about 7 seconds to simulate two hours of a 350 channel 7 cell network. The DLL is a true event simulation program in which, for the designated cell, individual MSs are categorized as Public Use or NS/EP (or 911) and assigned corresponding traffic attributes in terms of average origination rate, average holding time, and trunk routing probabilities. The average origination rate is used to randomly originate calls according to an exponentially distributed inter-call time, and the average holding time is used to assign a random call holding time according to an exponential distribution. The trunk routing probabilities are used to select a random trunk group for routing from a uniformly distributed mix of the assigned percentages. The program uses a state machine for the MS to track an individual call’s progress, including access to the slotted aloha common control channel, assignment of an SDCCH in GSM, assignment to a channel if available and, if appropriate, to a queue if a channel is not available, and timing out of the queue if not served within the maximum allowed time. For the surrounding cells, the simulation uses a common traffic generator for each cell and tracks the routing, and channel and trunk occupancies, but does not deal with individual MS. The surrounding cells can be set to queue or not queue calls for access to channels. Trunk queuing is simulated for the NS/EP call paths. The program uses a heuristic algorithm to pre-populate the busy channels, trunks, and MS and then allows the user to specify an initial warm-up period followed by a user-specified actual simulation period. The latter is expressed in terms of both a minimum time and a minimum number of calls. In order to effectively engineer a network for input to the program, numerous assumptions and engineering practices must be translated into a consistent network

52
topology over which the experimental parameters can then be assigned. The parameters and logic used to produce the initial topology design are implemented in one worksheet using add-in analytical functions from the DLL (also available from a Nyquetek Inc DLL as a standalone commercial product). An annotated version of the worksheet is given in Figures 6-1 through 6-3. The basic design must then be coupled with the simulation specific parameters (e.g., time to simulate, number of calls, allowed waiting time in queue by priority, etc.). This translation is done in a second spreadsheet, shown in Figure 6-4. The VBA macro reads the spreadsheet to capture the parameters and call the DLL. The actual spreadsheet is set to run up to six experiments for up to 10 different overloads with one push of a button. A summary view of key inputs and outputs is provided as shown in Figure 6-5. Excel is used to produce charts from the summary results as shown in Section 4. A large number of peg counts are also reported back to the second spreadsheet. The peg counts itemize traffic levels and performance attributes by traffic class for each experiment iteration, organized by overload. The traffic classes include:
• All Originations • All Terminations • All Priority • All 911 • All POTS • All Handins • All Queues • Originations by Priority (with Handins at Priority 0, NS/EP in Priorities 1-5, 911
at Priority 6 and POTS at Priority 7) • Priority Terminations • POTS Terminations For each class of traffic, peg counts are produced for:
• Number of attempts • Number blocked by radio availability • Number blocked by SDCCH availability • Number attempt queue • Number blocked by queue full • Number blocked by queue timeout • Maximum number in the queue • Number in queue when simulation stopped
Summary measures for probability of blocking and average delays are also produced.

53
Figure 6-1: Designated Cell Input – Part 1
PURESIM Detailed Cell NOMINALNumber of Channels nbr 30 Number of traffic channels
Eng Channel GOS Fraction 0.02Engineered Grade of Service- nominal blocking probability at 1X overload
Percent Terminating Percent 35%Percent of the total traffic (public and NS/EP) that is terminating (going TO the detailed cell)
Percent of Terminating that is Priority Percent 10.0% self expanatory
Orig Calls / Pub MS nbr/hr 0.44Average calls per hour for each simulated public mobile phone
Orig Calls / 911 MS nbr/hr 1.00
Average calls per hour for each simulated "911" mobile phone (the model uses separate simulated mobile phone to generate 911 calls, rather than giving each public phone a split between 911 and regular calls)
Percent Public Calls 911 Percent 2%
Percent of the total public (non WPS) calls that are 911 calls- this drives the number of "911" mobile phones simulated. Note that it is the percent of the numer of calls, not necessarily the percent of the traffic volume (Erlangs).
HTterm secs 150 Holding time for Terminating callsHTpub secs 150 Holding time for Public callsHT911 secs 150 Holding time for 911 calls
Percent Orig Calls HandOut Percent 0%Percent of originating calls that are handed over to another cell during their holding time
Percent Term Calls HandIn Percent 0%Percent of terminating calls that are handed over to another cell during their holding time
Priorities Allocation Pri 1 Percent 3% Percent of WPS mobile phones that are Priority 1 Pri 2 Percent 7% Percent of WPS mobile phones that are Priority 2 Pri 3 Percent 14% Percent of WPS mobile phones that are Priority 3 Pri 4 Percent 26% Percent of WPS mobile phones that are Priority 4 Pri 5 Percent 50% Percent of WPS mobile phones that are Priority 5
Percent Normal (Eng) Orig Traffic PriorityPercent 10.0%Percent of the noremal engineered load that is WPS traffic- used to derive the number of WPS mobile phones
Orig Calls / Pri MS nbr/hr 5.60Average calls per hour for each simulated WPS mobile phone
HTpri secs 150 Holding time for WPS calls
DERIVEDEverything in the shaded scetion is derived- Do not change the values
Traffic per Pri MS Erlangs 0.23Traffic per WPS mobile pone, derived from calls per hour and holding time
Nominal Traffic Erlangs 21.9Nominal traffic at 1X overload, derived from GoS and number of traffic channels
Terminating Traffic Erlangs 7.7 Nominal Termimating traffic (WPS and Public) Terminating Priority Traffic Erlangs 0.8 Nominal Terminating WPS traffic Originating Traffic Erlangs 14.3 Nominal Originating traffic (WPS and Public)
Nominal Number Pri MS nbr 6.1
Nominal number of WPS mobile phones, derived from the nominal originating traffic, the percent of oriinating priority traffic, and the traffic per Pri MS
Pri 1 MS nbr 1
The actual number of priority 1 WPS mobile phones is derived by rounding up the priority allocation times the niminal number of WPS mobile phones
Pri 2 MS nbr 1 Pri 3 MS nbr 1 Pri 4 MS nbr 2 Pri 5 MS nbr 4Actual Number Pri MS nbr 9 Total number of WPS mobile phones simulated.Nominal MS Pub nbr 650 Total number of Public mobile phones simulated.Nominal MS 911 nbr 6 Total number of "911" mobile phones simulated.
Cross check Orig Traffic Erlangs 14.3This is a double check to make sure that the correct traffic volume will be generated

54
Figure 6-2: Designated Cell Input – Part 2
ORIGINATION OVERLOAD TARGET Ratio:1 1More checks, and recalculation of the valuees that change with the overload
Terminating Overload Target Ratio:1 1.00
Overload Orig Calls / Pub MS nbr/hr 0.44Overload Orig Calls / 911 MS nbr/hr 1.00Overload MS pub nbr 650Overload MS 911 6Overload Traffic per Pub MS Erlangs 0.02Overload Traffic per 911 MS Erlangs 0.04CHECKS More checks, for each level of overloadOriginating Overload Ratio:1 1.0
Percent Orig Priority Traffic Percent 14.7%This is more than the nominal at 1X because of the integer number of WPS mobile phones
Total Traffic Erlangs 21.9 Terminating Overload Traffic Erlangs 7.7 Term Pub Calls Calls 166 Term Pri Calls Calls 18 Originating Overload Traffic Erlangs 14.3 Orig Pub Calls Calls 286 Orig 911 Calls Calls 6 Orig Pri Calls Calls 50 Total Orig Calls Calls 342

55
Figure 6-3: Network Design Input
NETWORK INPUTSEngineering Practices EXPERIMENT Engineered Channels GOS Pb .020 GoS for radio traffic channels from above
Engineered Trunks BSC-MSC GOS Pb .005GoS for BSC-MSC trunks, used to calculate the number of BSC to MSC trunks below
Engineered LEC Trunks GOS Pb .010GoS for MSC-LEC trunks, used to calculate the number of MSC to LEC trunks below
Engineered IXC Trunks GOS Pb .010GoS for MSC-IXC trunks, used to calculate the number of MSC to IXC trunks below
Engineered 911 Trunks GOS Pb .005GoS for MSC 911 trunks, used to calculate the number of dedicated MSC to PSAP dedicated 911 trunks below
iCellQueuing (0 = NO, 1 = YES) Boole 1This indicates whether or not WPS queueing is activated in the surrounding cells
iQcellNbrAllow Nbr 5Maximum (radio traffic channel) queue size for WPS calls in the surrounding cells
iQcellTimeAllow Seconds 15Maximum (radio traffic channel) time in queue for WPS calls in the surrounding cells
iQtksNbrAllow Nbr 5Maximum (trunk) queue size for WPS calls in the surrounding cells
iQtksTimeAllow Seconds 30Maximum (trunk) time in queue for WPS calls in the surrounding cells
Traffic Mix fCellTrfPerLec % 63% Percent of traffic from the detailed cell to the LEC fCellTrfPerIxc % 35% Percent of traffic from the detailed cell to the IXC
fCellTrfPer911 % 2%
Percent of traffic from the detailed cell 911 (Note that this is caculated, not entered asinput, and you need to select values for LEC and IXC so this matches the 911 value above (C9).
Cell Topology Overload iCellCh(0) Nbr 30 Number of traffic chanels in adjacent cell 1
fCellTrf(0) Erlangs 21.9(Calculated) traffic in adgancent cell 1 at the specified GoS and ( at right) at each overload.
iCellCh(1) Nbr 30 fCellTrf(1) Erlangs 21.9 iCellCh(2) Nbr 30 fCellTrf(2) Erlangs 21.9 iCellCh(3) Nbr 30 fCellTrf(3) Erlangs 21.9 iCellCh(4) Nbr 30 fCellTrf(4) Erlangs 21.9 iCellCh(5) Nbr 30 fCellTrf(5) Erlangs 21.9 iDetail Cell Chs Nbr 30 Same for detailed cell fDetail Cell Traffic Erlangs 21.9
Total Network Cell Channels Nbr 210(Calculated)Sum of traffic channels for detailed cell and 6 adjacent cells
Total Network Cell Traffic Erlangs 153.5(Calculated)Sum of traffic at 1X oerload) for detailed cell and 6 adjacent cells
Traffic BSC - MSC Erlangs 150.4(Calculated) traffic offered to the BSC-MSC trunks at 1x overload
Traffic Lec Erlangs 94.3(Calculated) traffic offered to the MSC-LEC trunks at 1x overload
Traffic Ixc Erlangs 52.4(Calculated) traffic offered to the MSC-IXC trunks at 1x overload
Traffic 911 Erlangs 3.0(Calculated) traffic offered to the MSC-911 trunks at 1x overload
MSC Topology iTksBscMsc Nbr 175 iTksLec Nbr 111 iTksIxc Nbr 66 iTks911 Nbr 9

56
Figure 6-4: Simulation Input for Designated Cell
SIMULATIONInputs (Engineered Load) PubUseSimNet Release: 6.11 fSimTime (minimum) Hours 2.0 fSimTimeInit 1.0 iSimNbrCalls (minimum) nbr 20,000 iSimNetwork flag 1 1 is yes, 0 is no
Detailed Cell Designated Cell Overload 1 - 10 Dimensions iTrfChannels nbr 50 Public Buffer or Queue Queue CDMA or GSM GSM fEngGos prob 0.02 Minimum Simulated Hours 2.0 Designated Cell Chs 50 iCDMA(0)orGSM(1) nbr 1 Minimum Simulated Calls 20,000 Surround Cell Chs 300 iNbrGSM_SDCCH nbr 16 NS/EP Trf @ % Nom 10.0% fSDCCHht / CDMA RTP sec 2 Simulating Surrounding Cells Yes Pub/911 MS @ 1X 1239 Reserved for future use nbr 0 Surrounding Cells Ovrload 1 - 1 Pub/911 MS @ 10X 4408 iNbrTrfChHiRsv nbr 1 Surrounding Cells Queuing Yes NS/EP MS (Cnstant) 13 fHandinWindow secs 7 iQnbrAllow nbr 11 iQpriNbrAllow nbr 5 iQ911NbrAllow nbr 5 Allocation Max Q iQpubNbrAllow nbr 1 Pri 911 Pots Cycles Total 11 Time iAlgorithm index 6 1 3 2 1 Pri 5 28 iWPSalloc nbr 1 3 1 2 1 911 5 10 i911alloc nbr 1 3 2 1 2 Pots 1 5 iPUBalloc nbr 2 1 = Start counting cycle when first WPS call enters queue iBusyPeriodOn flag 0 Number of calls may exceed percentage allowed before hard limit iSuperCount nbr 20 iSuperCount911 nbr 0 Use Buffer concept when Public Queue limit is 1 iBufferFlag nbr 0 iDRflag Boole 1 fPerDReligible Percent 20% iDRmilliPerCell Millisecs 2000 fTrftermTotal Erlangs 14.1 fTrfTermPri Erlangs 1.4 fTrfTermHiPercent Percent 8.0% fTrfOrigHoPercent Percent 10.0% fTrfperMSpub Erlangs 0.02 fTrfperMS911 Erlangs 0.04 fTrfperMSpri Erlangs 0.25 fTrfPerPubLec % 65% fTrfPerPubIxc % 35% fTrfPerPriLec % 65% fTrfPerPriIxc % 35% fHTterm sec 150 fHTpub sec 150 fHT911 sec 150 fHTpri sec 150 fccutil fract 0.2 iDefaultTermPri nbr 5
iNbrMSpri1 nbr 1 iNbrMSpri2 nbr 1 iNbrMSpri3 nbr 2 iNbrMSpri4 nbr 3 iNbrMSpri5 nbr 6 iNbrMS911 nbr 11 iNbrMSpub nbr 1,228
fWallowPri1 sec 28 fWallowPri2 sec 28 fWallowPri3 sec 28 fWallowPri4 sec 28 fWallowPri5 sec 28 fWallow911 sec 10 fWallowPub sec 5
fSlotSecs sec 0.24 iNumSteps nbr 4 iPsistPOTS parm 1 iPsistPri parm 0
Queue Service Order Queue Size

57
Figure 6-5: Summary of Inputs and Outputs
6.1 Designated Cell Calibration The simulation program has been calibrated for consistency with Erlang B analytical approximations for radio access during Hot Spot scenario congestion (i.e., where there is no trunk blocking). The results show a very close agreement, as shown in Figure 6-6. In the comparison, the analytical model where the number of MS is greater than 100 is based on Erlang B considerations, expressed as:
Designated Cell Overload 1 2 3 4 5 6 7 8 9 10Nbr Priority MS 13 13 13 13 13 13 13 13 13 13Nbr Public MS 1136 1711 2139 2495 2806 3086 3342 3580 3804 4015Nbr 911 MS 56 84 105 122 137 151 163 175 186 196Erl Traffic per Priority MS .23 .23 .23 .23 .23 .23 .23 .23 .23 .23Erl Traffic per/ Public MS .02 .03 .03 .04 .04 .04 .05 .05 .06 .06Erl Traffic per 911 MS .04 .06 .07 .08 .09 .10 .11 .12 .13 .13
Surrounding Cells Overload 1 1 1 1 1 1 1 1 1 1Cell 1 Traffic Erl 68.7 68.7 68.7 68.7 68.7 68.7 68.7 68.7 68.7 68.7Cell 2 Traffic Erl 59.1 59.1 59.1 59.1 59.1 59.1 59.1 59.1 59.1 59.1Cell 3 Traffic Erl 49.6 49.6 49.6 49.6 49.6 49.6 49.6 49.6 49.6 49.6Cell 4 Traffic Erl 31.0 31.0 31.0 31.0 31.0 31.0 31.0 31.0 31.0 31.0Cell 5 Traffic Erl 21.9 21.9 21.9 21.9 21.9 21.9 21.9 21.9 21.9 21.9Cell 6 Traffic Erl 13.2 13.2 13.2 13.2 13.2 13.2 13.2 13.2 13.2 13.2
SUMMARY Iterations: 6Do Ovld 0.0 (0=all, or select number)
Overload in Process 10Progress Bar 4.7 5.9 7.0 4.7 5.3 6.9Result Code 0 0 0 0 0 0
Designated Cell Overload 1 2 3 4 5 6 7 8 9 10Pc Radio Ch NS/EP 1.000 .995 .987 .979 .973 .971 .963 .956 .956 .957Pc Radio Ch 911 1.000 .998 .993 .991 .972 .960 .929 .903 .858 .824Pc Radio Ch Pub .983 .699 .488 .372 .293 .247 .212 .183 .164 .148Pc Radio Ch All .986 .741 .554 .447 .373 .330 .296 .266 .244 .225Pc Radio Ch Erl .980 .719 .528 .415 .341 .290 .252 .223 .199 .181
Pc To/From Net NS/EP 1.000 .995 .987 .979 .973 .971 .963 .956 .956 .957Pc To/From Net 911 .984 .927 .841 .758 .672 .608 .546 .493 .446 .414Pc To/From Net Pub .966 .681 .477 .364 .286 .242 .207 .180 .160 .146Pc To/From Net All .971 .720 .531 .421 .341 .294 .256 .225 .202 .185Pc To/From Net Erl .947 .682 .496 .388 .318 .269 .233 .206 .184 .167
% Capacity NS/EP Use 11.3% 9.0% 8.5% 8.1% 8.0% 7.6% 7.6% 7.4% 7.1% 7.2%% Capacity NS/EP Q Use 0.3% 4.2% 6.1% 6.6% 7.0% 6.8% 6.9% 6.8% 6.5% 6.8%% Capacity NS/EP No Q Use 11.0% 4.8% 2.4% 1.5% 1.0% 0.8% 0.7% 0.6% 0.5% 0.4%% Capacity Pub/911 Use 88.7% 91.0% 91.5% 91.9% 92.0% 92.4% 92.4% 92.6% 92.9% 92.8%% Capacity NS/EP Allocation 25.0% 25.0% 25.0% 25.0% 25.0% 25.0% 25.0% 25.0% 25.0% 25.0%
Delay NS/EP 1 2.7 5.2 7.1 7.5 8.9 8.6 9.0 9.4 9.1 9.4Delay NS/EP 2 2.7 4.8 7.2 7.5 8.3 9.4 9.2 8.9 9.8 10.2Delay NS/EP 3 2.7 5.0 7.1 7.6 8.8 9.5 10.4 9.5 10.2 10.5Delay NS/EP 4 2.7 5.2 7.2 8.4 9.1 9.6 10.4 10.1 10.9 12.0Delay NS/EP 5 2.8 5.6 8.0 9.1 10.5 11.3 11.5 12.5 12.4 13.0Delay Public 2.7 3.3 3.6 3.7 3.7 3.8 3.9 4.0 4.1 4.2Delay 911 2.8 5.2 7.3 8.5 10.3 11.1 12.9 13.8 14.8 15.4
Pc Radio Ch NS/EP 1 1.000 .998 1.000 1.000 .990 1.000 1.000 .992 1.000 .991Pc Radio Ch NS/EP 2 1.000 .996 .994 1.000 1.000 1.000 .995 1.000 1.000 1.000Pc Radio Ch NS/EP 3 1.000 .996 .994 .996 .986 .995 .994 .992 .992 .983Pc Radio Ch NS/EP 4 1.000 .998 .993 .985 .978 .987 .980 .989 .975 .975Pc Radio ChNS/EP 5 1.000 .994 .981 .977 .967 .956 .945 .935 .937 .941
Traffic Chs Util 79.3% 96.6% 98.4% 99.0% 99.3% 99.4% 99.4% 99.5% 99.5% 99.5%Access Ch Util 21.9% 24.5% 26.3% 28.7% 30.6% 33.4% 36.0% 38.1% 41.7% 44.1%
Run Simulation

58
Figure 6-6: Erlang B Calibration PcDes = 1 – ErlBGosE(ChDes, TrfOvldDes + TrfTerm)
where
• PcDes is the Probability of radio traffic channel access in the cell designated for detailed analysis
• ChDes is the number of radio traffic channels in the designated cell
• TrfOvldDes is the overload origination traffic in the designated cell
• TrfTerm is the offered terminating traffic for the designated cell
• ErlBGosE(servers, traffic) is the Erlang B function for probability of
blocking when given servers and traffic, with the traffic expressed in Erlangs
The number of channels (ChDes) and the terminating traffic (TrfTerm) are direct inputs. The overload traffic is derived as the sum of the products of the traffic per MS by type and the number of MS by type, i.e.,
WPS Performance ImpactGSM 50 Ch, 23 NS/EP MS, No Features
("Calibration")
0%
10%
20%
30%
40%
50%
60%
70%
80%
90%
100%
Overload (X Times Engineered Load)
% S
ucce
ssfu
l Rad
io
Traf
fic C
hann
el A
cces
s
NS/EP with WPS .983 .718 .530 .436 .341 .276 .251 .235 .207 .175Public w WPS .979 .715 .524 .409 .340 .290 .253 .226 .200 .180Composite All w WPS .979 .714 .524 .409 .340 .290 .254 .226 .200 .179All via Erlang Model .980 .719 .528 .415 .341 .290 .252 .223 .199 .181
1 2 3 4 5 6 7 8 9 10
Average of 6 x 10,000 Calls (min 1 hr) Event Simulations.02 Engineered GOS, 35% nominal Terminating TrafficOverload applied equally between nbr MS and traffic / MSTerminating traffic goes from 1X to 2X when orig at 10X

59
TrfOvldDes = (TrfMSpub * NbrMSpub) + (TrfMSpri * NbrMSpri) + (TrfMS911 * NbrMS911)
The traffic and number of MS by type are inputs. When the number of MS is 100 or less, the same type of analysis is applied, except the Engset formula for blocking is used instead of the Erlang B. The Engset formula is applicable when the number of originating sources is sufficiently limited that their participation in a call origination materially reduces the rate at which additional calls can be generated. To apply the Engset formula, a composite traffic per MS is required and is derived as: TrfMScomp = (TrfOvldDes + TrfTermAdj) / NbrMStotal where
• TrfMScomp is the composite traffic per MS • TrfTermAdj is the adjusted terminating traffic to account for MS engaged in call
originations
• NbrMStotal is the total number of MS The adjusted terminating traffic reduces the terminating traffic by the percentage time an MS is engaged in originating calls as follows:
TrfTermAdj = TrfTerm * (1-(1-ErlBGosE(ChDes, TrfOvldDes+TrfTerm)) * (TrfOvldDes + TrfTerm) / NbrMStotal)
With these considerations, the probability of completion for less than 100 MS can be approximated as:
PcDes = EngGosE(ChDes, NbrMStotal, (TrfOvld+TrfTermAdj)/NbrMStotal)
where EngGosE is the Engset function for probability of blocking when given the number of channels, number of MS, and traffic per MS expressed in Erlangs.
6.2 Network Calibration The program has also been calibrated for consistency with general network engineering practices for the 7 cell configuration, with the results also being quite good even though the analytical model is rather simplistic, as shown in Figure 6-7. The network probability of success for the designated cell can be expressed as:
PcNet = PcDesPrim * PcBscMsc * (PcIxc * TrfIxcPerc + PcLec * TrfLecPerc)

60
Figure 6-7: Network Calibration where
• PcDesPrim is the probability of success in getting a radio channel in the designated cell, with a more primitive Erlang B approximation than used in Section 6.1
• PcBscMsc is the probability of success in getting a BSC-MSC trunk
• PcIxc is the probability of getting an IXC trunk
• TrfIxcPerc is the percent of traffic directed to the IXC
• PcLec is the probability of getting an LEC trunk
• TrfLecPerc is the percent of traffic directed to the LEC
The probability of getting a radio channel in the designated cell is approximated simply as:
WPS Network Wide Performance GSM 50 Ch, 10%, 85 NS/EP MS with Same Attibutes as Public MS
No Features, "Calibration"
0%
10%
20%
30%
40%
50%
60%
70%
80%
90%
100%
Overload (X Times Engineered Load)
% S
ucce
ssfu
l Acc
ess
Net Analytical Model .947 .591 .424 .330 .270 .228 .198 .174 .156 .141Net NS/EP with WPS .962 .580 .402 .295 .244 .211 .177 .167 .131 .134Net Composite All w WPS .966 .590 .405 .310 .250 .212 .181 .159 .141 .128Net Public w WPS .966 .589 .404 .310 .250 .212 .181 .158 .141 .127
1 2 3 4 5 6 7 8 9 10
Average of 6 x 10,000 Calls (min 1 hr) Event Simulations.02 Engineered GOS, 35% nominal Terminating TrafficOverload applied equally between nbr MS and traffic / MSTerminating traffic goes from 1X to 2X when orig at 10X

61
PcDesPrim = 1-ErlBGosE(ChDes, (OvldOrig * (1-TrfTermPerc)+OvldTerm*TrfTermPerc)*ErlBTrfE(ChDes, PbDesEng))
where
• OvldOrig is the overload level for originating traffic • TrfTermPerc is the percent of the normal (engineered) traffic that is terminating
traffic • OvldTerm is the overload level for terminating traffic
• ErlBTrfE() is the Erlang B function for traffic expressed in Erlangs for a given
number of servers and Grade of Service (i.e., probability of blocking)
• PbDesEng is the engineered Grade of Service for the designated cell
The probability of getting a BSC-MSC trunk can be expressed as:
PcBscMsc = 1 – ErlBGosE(TksBscMsc, TrfBscMsc) where
• TksBscMsc is the given number of BSC-MSC trunks
• TrfBscMsc is the BSC-MSC traffic The BSC-MSC traffic is derived as an aggregate of the cells’ traffic:
TrfBscMsc = PcDesPrim*(OvldOrig * (1-TrfTermPerc) + OvldTerm * TrfTermPerc) * ErlBTrfE(ChDes, PbDesEng) + Sum(PcCell(i)*TrfCellOvld(i))
where the Sum is over the index “i” and PcCell(i) is the probability of a call successfully getting a radio channel in cell “i” and TrfCellOvld(i) is the overload traffic for cell “i”. The overload traffic for cell “i” can be expressed as:
TrfCellOvld(i) = OvldCells * ErlBTrfE(Ch(i), GosCellEng)
where
• OvldCells is the common overload multiplier for all surrounding cells • Ch(i) is the number of radio traffic channels in surrounding cell “i”

62
• GosCellEng is the common Grade of Service used in engineering the size of each cell for its engineered traffic load
The probability of completion for cell(i) is then:
PcCell(i) = 1-ErlBGosE(Ch(i), TrafficCellOvld(i))

63
7. Conclusion PURQ-AC enables WPS to provide an effective NS/EP priority access service with minimal impact to Public Use and in such a way that minimizes time and cost to implement. PURQ-AC also provides the carriers and users improved radio resource utilization and call blocking performance during conditions of congestion when there is no or minimal NS/EP traffic. As the NS/EP traffic grows, NS/EP calls get priority access to radio resources, with minimal impact on Public Use performance. If NS/EP calling activity exceeds expectations then NS/EP performance will suffer, but Public Use impact will remain minimal (or actually improve).