wintertime spatio-temporal variation of ultrafine particles in a belgian city
TRANSCRIPT

Science of the Total Environment 431 (2012) 307–313
Contents lists available at SciVerse ScienceDirect
Science of the Total Environment
j ourna l homepage: www.e lsev ie r .com/ locate /sc i totenv
Wintertime spatio-temporal variation of ultrafine particles in a Belgian city
Vinit K. Mishra a,b,c, Prashant Kumar d,e,⁎, Martine Van Poppel a, Nico Bleux a, Evelien Frijns a,Matteo Reggente a,f, Patrick Berghmans a, Luc Int Panis a,g, Roeland Samson b
a VITO, Flemish Institute for Technological Research Boeretang 200, B-2400 Mol, Belgiumb Department of Bioscience Engineering, University of Antwerp, Antwerp, Belgiumc Underwriters Laboratories Management Systems Solutions India Private Limited, Banglore, Indiad Division of Civil, Chemical and Environmental Engineering, Faculty of Engineering and Physical Science (FEPS), University of Surrey, GU2 7XH, United Kingdome Environmental Flow (EnFlo) Research Centre, FEPS, University of Surrey, GU2 7XH, United Kingdomf Department of Information Technology (INTEC), Ghent University, Belgiumg Transportation Research Institute, University of Hasselt, Belgium
⁎ Corresponding author at: Civil Engineering (C5), Divvironmental Engineering, Faculty of Engineering and Phsity of Surrey, Guildford GU2 7XH, United Kingdom. Tel.1483 682135.
E-mail addresses: [email protected], Prashant.K
0048-9697/$ – see front matter © 2012 Elsevier B.V. Alldoi:10.1016/j.scitotenv.2012.05.054
a b s t r a c t
a r t i c l e i n f oArticle history:Received 29 November 2011Received in revised form 16 May 2012Accepted 17 May 2012Available online 14 June 2012
Keywords:Ultrafine particlesNumber and size distributionsStreet canyonTraffic emissions
Simultaneous measurements of ultrafine particles (UFPs) were carried out at four sampling locations situatedwithin a 1 km2 grid area in a Belgian city, Borgerhout (Antwerp). All sampling sites had different orientationand height of buildings and dissimilar levels of anthropogenic activities (mainly traffic volume). The aimswere to investigate: (i) the spatio-temporal variation of UFP within the area, (ii) the effect of wind directionwith respect to the volume of traffic on UFP levels, and (iii) the spatial representativeness of the official mon-itoring station situated in the study area. All sampling sites followed similar diurnal patterns of UFP variation,but effects of local traffic emissions were evident. Wind direction also had a profound influence on UFP con-centrations at certain sites. The results indicated a clear influence of local weather conditions and the moredominant effect of traffic volumes. Our analysis indicated that the regional air quality monitoring station rep-resented the other sampling sites in the study area reasonably well; temporal patterns were found to be com-parable though the absolute average concentrations showed differences of up to 35%.
© 2012 Elsevier B.V. All rights reserved.
1. Introduction
Exposure to ultrafine particles (UFPs; those below 100 nm in size)is of great concern to the air quality management community becauseof their adverse impacts on human health (Atkinson et al., 2010;Peters et al., 1997). Recent studies have shown significant contribu-tions to excess mortality due to the exposure to traffic‐derived UFPin urban areas (Kumar et al., 2011a). Even brief exposure of healthypeople to traffic UFP seems to induce some effects (Jacobs et al.,2010; Bos et al., 2011). Over 80% of particles, by number, in pollutedurban environments are represented by UFP (Morawska et al.,2008) whilst their corresponding mass accounts for less than 20% ofthe total PM mass concentration (Kittelson, 1998). Atmospheric for-mation of UFP is site and time specific (Kulmala et al., 2004) andthe transformation processes that change their number and size dis-tributions differ both temporally and spatially (Kumar et al., 2011b).On‐road UFP contains both nucleation (b50 nm) and accumulationmode (>50 nm) particles. Particles in the nucleation mode are of
ision of Civil, Chemical and En-ysical Sciences (FEPS), Univer-: +44 1483 682762; fax: +44
[email protected] (P. Kumar).
rights reserved.
major scientific interest because of their composition and potentialhealth effects. Once formed, UFP number concentrations of thismode are usually higher than those in the accumulation mode in aroadside environment (Kittelson, 1998).
Mean UFP number concentrations in urban background areas,along the roadsides in street canyons, and in vehicle wakes or exhaustplumes range from 103 to 104 cm−3, 104 to 106 cm−3 and 104 to107 cm−3, respectively (Carpentieri and Kumar, 2011; Kumar et al.,2010; Berghmans et al., 2009). The UFP number concentrationsalong the roadside show an association with the vehicle flow charac-teristics. For instance, increasing vehicle speed increases the emis-sions of UFP (Kittelson et al., 2004). Studies carried out nearhighways show that number concentrations of particles decrease ex-ponentially with the increasing downwind distance from the high-ways (Buonanno et al., 2009). Such a decrease was observed up to~300 m and beyond, at which point levels of UFP number concentra-tions approached the local urban background (Morawska et al., 1999;Zhu et al., 2002). Many traffic related pollutants show a similar de-crease. Likewise, a few studies have monitored UFP number concen-trations at different urban sites to understand the spatial variabilityof UFP (Holmes et al., 2005). Direct comparison of the results fromsuch studies is not possible since the study design was different interms of traffic characteristics and site locations. At urban backgroundsites particle size distributions are much more stable, and are likely to

308 V.K. Mishra et al. / Science of the Total Environment 431 (2012) 307–313
be more unimodal compared to the multimodal and rapidly changingdistributions close to traffic sites (Harrison et al., 1999). Finally, thephysical characteristics of UFP are more closely related to the numberof heavy duty vehicles than to the number of light duty vehicles(Holmes et al., 2005; Westerdahl et al., 2005).
Epidemiological studies typically use one or only a few centralmonitoring stations as a proxy for personal exposure to particulatematter air pollution. However, central monitoring sites may not accu-rately characterize the spatial complexities of the UFP concentrationsacross an urban area. Consequently, investigating the intra-urban var-iability of UFP has become a priority area of study. The aim of thisstudy is to investigate the spatio-temporal variability of the numberconcentration of UFP within a 1 km2 urban grid. Additionally, wealso want to study the effect of wind direction with respect to the vol-ume of traffic on UFP levels, and evaluate the spatial representative-ness of the official monitoring station situated in the study area.
To achieve these objectives, UFP number concentrations are si-multaneously measured at four different sites in a Belgian city(Borgerhout, Antwerp). All the sites have different traffic volumesand surrounding environments.
2. Methodology
2.1. Description of sampling location
Measurements were carried out in the Borgerhout district (51°13′N and 4°26′E) of Antwerp, Belgium, a port city of approximately500,000 inhabitants. Borgerhout has a surface area of 3.93 km2 andhouses about 44,080 inhabitants (as of April 4th 2011). This is a typ-ical urban commercial and residential area with busy traffic. Measure-ment campaigns were carried out during the winter of 2010 at fourdifferent sites (described in Table 1) simultaneously for one month(12th February until 12th March 2010). All the measuring sites aresituated within an area of about 1 km2 in the surroundings of a per-manent official air quality monitoring station of the Flemish Environ-mental Agency, VMM (see Fig. 1). Specific differences between siting(e.g. exact distance to the axis of the road) and meteorological condi-tions (low dispersion conditions during winter) may be reflected inthe UFP measurements (see Section 3).
The location of the sampling sites is shown in Fig. 1:
Site 1: Plantin en Moretuslei (PlMl) is a major access road to thecity with an east–west orientation, with busy traffic intersectionsand four lanes (two in each direction).Site 2: Districtshuis (Dis) represents a street canyon which is closeto an open space and has a north–south orientation. The road hastwo traffic lanes and moderate levels of traffic.Site 3: Kleine Beerstraat (KB) is a two lane street canyon. The siteexperiences moderate traffic, including two tram lines. The roadhas a northwest–southeast (i.e. 300ºN) orientation. The samplinglocation was at the southern corner of the street.
Table 1Description of measurement sites.
Site name Orientationrelative totraffica
The distancefrom traffic(m)
Weekdaytrafficvolume(veh day−1)
Weekendtrafficvolume(veh day−1)
Heavy dutyfraction onweekday (andweekend) (%)
Site 1(PlMl)
10 20 37,000 25,000 7% (3%)
Site 2 (Dis) 105 3 5000 4000 5% (2%)Site 3 (KB) 210 2 4000 3000 4% (2%)Site 4(VMM)
10 10 37,000 25,000 7% (3%)
a Showing the orientation of the site perpendicular to the road.
Site 4: VMM is located about 450 m to the east of site 1 (PlMl),experiencing very similar traffic levels as site 1. The sampling loca-tion at this site was ~10 m away from the moving traffic behind a0.5 m wide and 1.5 m high bushy vegetation screen. This is alsothe regional monitoring station of Flemish Environment Agency(VMM). Unfortunately, data were only available for 1 week (5/3/2011–12/3/2011) at this location.
Further details on the traffic at each site are presented in Table 1.
2.2. Instrumentation
Measurements of UFP were performed using the GRIMM “Nano-Check” model 1.320 (GRIMM), which is operated with a Grimm1.108 optical aerosol spectrometer in a weatherproof housing model1.165. The Nanocheck uses a diffusion charger and Faraday cup elec-trometer. The mean particle diameter is determined by varying(high and low) the voltage trough the electrometer. Comparison ofthe two resulting currents versus a factory calibration curve givesthe mean particle diameter. The Nano-Checks were installed at eachof the four sites for simultaneous measurements, enabling a temporalcomparison of UFP concentrations measured by identical instru-ments. Each instrument was calibrated by GRIMM using NaCl parti-cles (size range 27.8–177.0 nm). The Nano-Check can count totalparticle number concentrations between 25 and 300 nm, besides pro-viding the mean diameter of the measured size range. A sampling fre-quency of 5 min was used; the sampling inlet of the instruments wasabout 1.6 m above ground level. Using a cut‐off point at 25 nm, re-duces the uncertainty involved in measuring volatile and unstablenucleation mode particles that have a relatively short atmosphericlife time (Morawska et al., 2008). The deployed instruments arethus fit for long term representative measurements of UFP. The sizerange of the instruments is beyond the upper cutoff size of UFP, how-ever, in urban environments UFPs account typically for 90% of totalparticle number concentration (see Morawska et al., 2008, and refer-ences therein). The lower cut-off point can be seen as a limitation ofthis study, however the use of similar instruments guarantees thequality and representativeness of the data and the analysis presentedof the Aitken and agglomeration modes.
The Nanocheck-GRIMM configuration uses a dilution system inwhich the sampled air is diluted with clean and dry air. Dilution isstarted at a relative humidity (RH) of 50%. The dilution factor is approx-imately 2. Whereas dilution for PM fractions (0.23–20 μm)— using theGRIMM 1.108 aerosol spectrometer—was included in the software, wefound out that the dilution factor for UFP number concentrations mea-sured by Nanocheck was not taken into account in the software of theconfiguration used. Therefore, the correct concentrations were calculat-ed afterwards using the accurate dilution factor. The dilution factor wasdetermined for each instrument after the sampling campaign. Flowwasmeasured at the sampling inlet with dilution ‘on’ (0.6 lmin−1) and ‘off’(1.2 lmin−1). The resulting ratio is the corresponding dilution. The flowin the spectrometer was always 1.2 lmin−1 and was within 10% of themeasured flow at the sampling inletwith dilution ‘off’. Because the dilu-tion issue was not known at the start of the measurement campaign,data had to be corrected afterwards. Therefore, measurements of UFPnumber concentrations at a relative air humidity of >50% were multi-plied using the dilution factor. Because dilution was switched on andoff based on a relative humidity measurement at a 6 s interval andUFP number concentration measurements were made at 5 min inter-vals, some data had to be excluded from the dataset because themixingstate changed during the 5 min averaging. The resulting dilution factorsrange between 1.79 and 1.94 for the different instruments. In addition,an intercomparison of the instruments was performed at the end ofthe measurement campaign resulting in correction factors rangingfrom 1.00 to 1.37 relative to the instrument used at site 1 (PlMl).
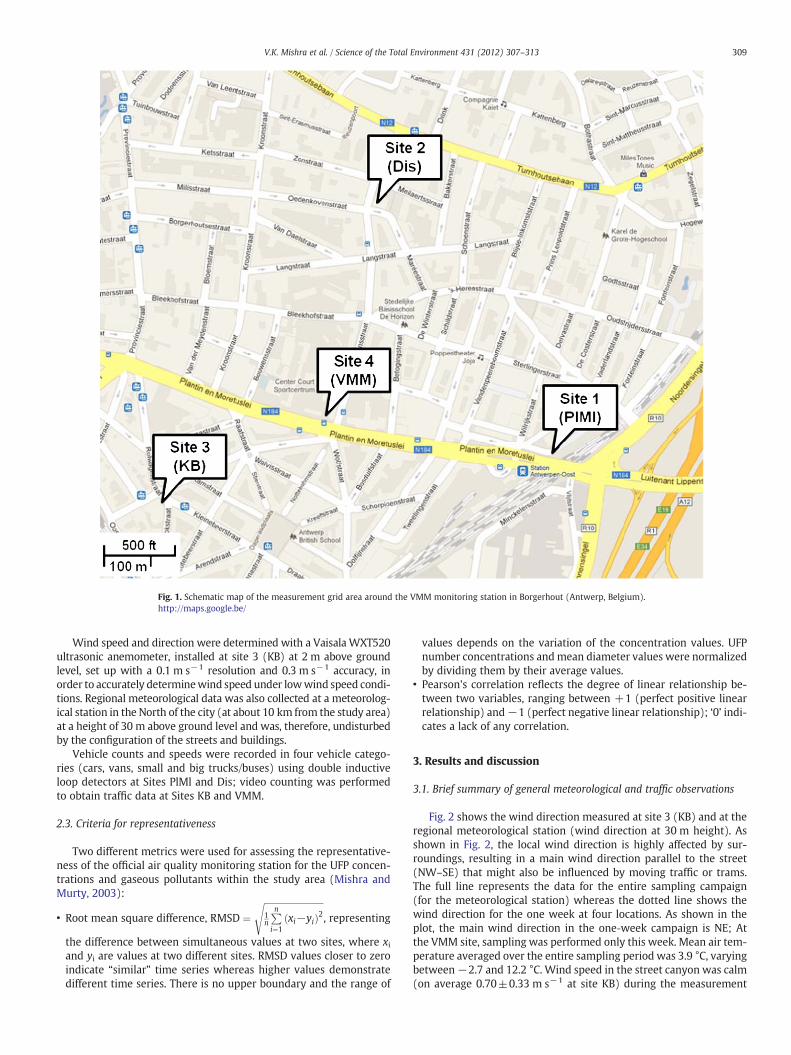
Fig. 1. Schematic map of the measurement grid area around the VMM monitoring station in Borgerhout (Antwerp, Belgium).http://maps.google.be/
309V.K. Mishra et al. / Science of the Total Environment 431 (2012) 307–313
Wind speed and direction were determined with a Vaisala WXT520ultrasonic anemometer, installed at site 3 (KB) at 2 m above groundlevel, set up with a 0.1 m s−1 resolution and 0.3 m s−1 accuracy, inorder to accurately determinewind speed under lowwind speed condi-tions. Regional meteorological data was also collected at a meteorolog-ical station in the North of the city (at about 10 km from the study area)at a height of 30 m above ground level and was, therefore, undisturbedby the configuration of the streets and buildings.
Vehicle counts and speeds were recorded in four vehicle catego-ries (cars, vans, small and big trucks/buses) using double inductiveloop detectors at Sites PlMl and Dis; video counting was performedto obtain traffic data at Sites KB and VMM.
2.3. Criteria for representativeness
Two different metrics were used for assessing the representative-ness of the official air quality monitoring station for the UFP concen-trations and gaseous pollutants within the study area (Mishra andMurty, 2003):
• Root mean square difference, RMSD ¼ffiffiffiffiffiffiffiffiffiffiffiffiffiffiffiffiffiffiffiffiffiffiffiffiffiffiffi1n
Pni¼1
xi−yið Þ2s
, representing
the difference between simultaneous values at two sites, where xiand yi are values at two different sites. RMSD values closer to zeroindicate “similar” time series whereas higher values demonstratedifferent time series. There is no upper boundary and the range of
values depends on the variation of the concentration values. UFPnumber concentrations andmean diameter values were normalizedby dividing them by their average values.
• Pearson's correlation reflects the degree of linear relationship be-tween two variables, ranging between +1 (perfect positive linearrelationship) and−1 (perfect negative linear relationship); ‘0’ indi-cates a lack of any correlation.
3. Results and discussion
3.1. Brief summary of general meteorological and traffic observations
Fig. 2 shows the wind direction measured at site 3 (KB) and at theregional meteorological station (wind direction at 30 m height). Asshown in Fig. 2, the local wind direction is highly affected by sur-roundings, resulting in a main wind direction parallel to the street(NW–SE) that might also be influenced by moving traffic or trams.The full line represents the data for the entire sampling campaign(for the meteorological station) whereas the dotted line shows thewind direction for the one week at four locations. As shown in theplot, the main wind direction in the one‐week campaign is NE; Atthe VMM site, sampling was performed only this week. Mean air tem-perature averaged over the entire sampling period was 3.9 °C, varyingbetween−2.7 and 12.2 °C. Wind speed in the street canyon was calm(on average 0.70±0.33 m s−1 at site KB) during the measurement

Fig. 2. Wind direction at meteorological station and site 3 during the entire sampling campaign. The x-axis is showing wind direction and the y‐axis is showing frequency of ob-served wind direction.
310 V.K. Mishra et al. / Science of the Total Environment 431 (2012) 307–313
period, having a minimal effect of wind turbulence on the UFP disper-sion (Kumar et al., 2008a). As expected, wind speed measured at themeteo station (at 30 m height) is higher (4.0±1.9 m s−1).
All four sites containing functional Nano-Checks experienced dif-ferent levels of traffic, with the highest at PlMl and VMM (bothwere located on the same road) followed by the sites Dis and KB(Table 1). Electricity driven tram lines were present only at KB,though these are unlikely to have a strong influence on UFP concen-trations (Kardel et al., 2012). As expected, passing of HDVs stronglyinfluenced the UFP concentrations at all sites. It was frequently ob-served during the daily personal visits to the measurement sitesthat UFP concentrations increased substantially seconds after theHDVs departed from the vicinity of a measurement site. All the sitesfollowed a similar diurnal pattern of UFP concentrations, but the indi-vidual short term variations at each site were noteworthy.
3.2. Diurnal pattern of UFP concentrations and count mean diameter
Fig. 3a, b and c shows the temporal variation of UFP concentra-tions for weekdays (9th of March and 5th of March, respectively)and for a Sunday (7th of March) at all four locations. As expected,the UFP concentrations follow the diurnal variation of the traffic vol-umes at individual sites. An increase in UFP concentrations was ob-served during morning and evening traffic rush hours. On the 9th ofMarch (Fig. 3a), the mean UFP concentrations during night timewere of the order of ~12,000 cm−3 at all the sites. However, themorning peak was reached between 7 and 8 am (GMT+1) whenUFP levels increased up to 35,000 cm−3 at sites VMM and PlMl andup to 50,000 cm−3 at Dis and KB. This day, regional wind directionwas mainly from NE.
However, on the 5th of March (Fig. 3b), when wind direction wasmainly SW, morning peak concentrations increased up to 75,000 cm−3
at PlMl and up to 50,000 and 60,000 cm−3 at Dis and KB sites, respec-tively. The evening peak on the 9th of March was observed at all thesites between 4 and 8 pm when the UFP number concentrations werelower compared to the morning peaks i.e. up to ~30,000 cm−3 at KB,VMM and PlMl and up to 40,000 cm−3 at Dis. On the 7th of March (aSunday; Fig. 3c), the diurnal pattern of UFP number concentrationswas less pronounced at all locations. This is because traffic flows are re-duced compared to weekdays (see Table 1).
Also plotted in Fig. 3 are the mean diameters of the UFP size distri-bution. These follow an opposite trend, showing an increase in UFPnumber concentrations as the mean diameter gets smaller and vice‐versa. There could be two possible explanations for this trend. Firstly,the UFP number concentrations in the UFP size range are higher whenthe count mean diameters are smaller during periods with high ve-hicular emissions. Likewise, lower UFP concentrations at the time oflarger count mean diameter could be caused by a substantial amountof smaller nucleation mode particles (b50 nm) which are likely to co-agulate and get adsorbed onto the surface of already existing particlesin the accumulation size range (Mäkelä et al., 1997). The overall meanparticle diameter in our study area was ~50 nm during the entiresampling period.
3.3. Spatio‐temporal variations of UFP number concentrations atdifferent sites
Table 2 provides a comprehensive summary of all the UFP mea-surements made over the entire one month sampling period (exceptfor the VMM site, where only data for 1 week was available). Betweenbrackets, corresponding numbers for the one-week period are shown.For the one week period, maximum mean UFP concentrations werefound at the Dis site, followed by the KB, PlMl and VMM sites, respec-tively. The variation between the highest and the lowest mean UFPconcentrations was 35% within the grid area, showing similar UFPconcentrations at the lower end (i.e. ranging between 18,181 cm−3
at the VMM and 24,460 cm−3 at the Dis). However, when comparingthe one-month sampling campaign at the three sites other trends areobserved. Highest concentrations are observed at PlMl (23,219 cm−3)and lowest at KB (21,586 cm−3), corresponding to the relative trafficintensities.
For the one month data the mean diameters at three sites followedthe opposite trend in comparison to the mean UFP concentrations;lowest value (48 nm) at PlMl and the highest (52 nm) at the Dis.The inter quartile range at the four sites during the one week periodwere lowest at the PlMl and VMM (10,728 and 8967, respectively),11,617 at KB and highest at Dis (13,091). The coefficient of variance(CV) of UFP concentrations does not follow the same trend as theinter quartile range (i.e. highest, 63, at PlMl and the lowest at Dis).

Fig. 3. Typical diurnal trend of UFP number concentration and particle mean diameters on (a) 9th March 2010, (b) 5th March 2010, and (c) 7th March 2010 at the sites PlMl (site 1),Dis (site 2), KB (site 3), and VMM (site 4).
311V.K. Mishra et al. / Science of the Total Environment 431 (2012) 307–313
A closer inspection of the UFP concentration trends, inter quartileranges and the CV shows that traffic volume was not the only decid-ing factor in the variations of the UFPs at the chosen sites, this was
Table 2Summary of UFP number concentrations measured at different sites in a Belgian city, Borge
Instrument used (measured metric; unit) Sites Mean Std. dev. Median
Nano-Check (UFP concentrations; # cm−3) 1 (PlMl) 23,219 14,129 19,517(20,015) (12,628) (16,14
Nano-Check (UFP concentrations; # cm−3) 2 (Dis) 22,810 12,934 20,628(24,460) (11,839) (22,81
Nano‐Check (UFP concentrations; # cm−3) 3 (KB) 21,586 11,249 19,278(20,497) (10,470) (17,85
Nano-Check (UFP concentrations; # cm−3) 4 (VMM) NA NA NA(18,181) (9421) (16,33
Nano-Check (UFP mean diameter; nm) 1 (PlMl) 48 8 46(49) (8) (48)
Nano-Check (UFP mean diameter; nm) 2 (Dis) 52 9 50(50) (7) (49)
Nano-Check (UFP mean diameter; nm) 3 (KB) 51 8 49(52) (7) (51)
Nano-Check (UFP mean diameter; nm) 4 (VMM) NA NA NA(45) (6) (44)
N*: number of data points.
also the distance from the moving traffic and the wind direction.The pair of sites with the same traffic volume (PlMl and VMM)shows similar concentrations for the one week period. However, at
rhout (Antwerp).
Min. Max. Lower quartile Upper quartile Coefficient ofvariance
N*
2528 87,210 13,703 28,883 61 12955) (4795) (77,496) (12,132) (22,860) (63) (324)
1768 88,004 13,190 29,316 57 12923) (4969) (88,004) (17,035) (30,126) (48) (317)
2168 80,355 13,866 27,486 52 12799) (5375) (60,870) (13,623) (25,240) (51) (316)
NA NA NA NA NA NA5) (4639) (69,208) (12,663) (21,630) (52) (301)
28 80 42 53 16 1295(29) (80) (44) (54) (16) (324)32 96 46 57 18 1292(32) (78) (45) (54) (14) (317)29 80 44 56 16 1279(29) (77) (47) (56) (14) (316)NA NA NA NA NA NA(28) (66) (41) (49) (14) (301)

Table 3Average UFP number concentrations (# cm−3) during the winds originating from thetraffic sector and non-traffic sector. Wind is measured at meteorological station andsite 3 for the entire period. In brackets are shown the number of points used to calcu-late the mean.
UFP number concentrations Wind measured at meteorological station
Traffic sector Non-traffic sector Other sector
Site 1 (PlMl) 24,692 (488) 18,905 (522) 28,597 (285)Site 2 (Dis) 18,802 (300) 31,094 (354) 20,096 (638)Site 3 (KB) 20,225 (490) 19,852 (499) 26,865 (290)Site 4 (VMM)⁎ 56,217 (3) 17,102 (253) 21,706 (45)
UFP number concentrations Wind measured at site 3 (KB)Traffic sector Non-traffic sector Other sector
Site 3 (KB) 17,988 (154) 19,081 (308) 23,207 (817)Site 3 (KB) broaderwind sector⁎⁎
22,707 (753) 19,046 (342) NA
⁎ Site 4 (VMM) only one week UFP data (5–12 March).⁎⁎ Site 3 broader traffic sector=270–135.
312 V.K. Mishra et al. / Science of the Total Environment 431 (2012) 307–313
some days, concentrations are lower compared to sites that are locat-ed very close to the road but have less traffic, revealing that wind di-rection in relation to site orientation had a large effect.
At the VMM site (mean concentrations~18,181 cm−3) the distancebetween themoving traffic and the sampling locationwasonly two thirdsof the distance at PlMl (mean concentrations~20,015 cm−3). These ob-servations are in contrast to those reported by Buonanno et al. (2009)where the UFP number concentrations were found to decrease by nearly50% of the roadside values at about 30 m away from the highway. Asmaller drop is expected in our case, compared to highway measure-ments, because of the limited dispersion of UFP number concentrationsdue to surrounding buildings (Kumar et al., 2008b, c; Buonanno et al.,2011) and the absence of the monitoring of short‐lived nucleationmode particles (Carpentieri and Kumar, 2011). In addition, wind wasmainly not coming from the road side at the time of simultaneous mea-surement at these locations.
3.4. Effect of synoptic wind direction on UFP levels
The measured UFP concentrations are compared to the measuredsynoptic wind direction at the meteorological central site and at thelocal station at site KB (see Table 3). The effect of wind directionwas investigated by dividing the data into groups, namely traffic sec-tor and non‐traffic sector. The traffic sector was defined as 60° fromperpendicular to the road as a conservative number. At locationsvery close to traffic, it can be expected that a broader wind sector in-fluences the UFP number concentrations at the sampling site. Theresulting traffic sectors were 180–250° (VMM and PlMl), 225–345°(Dis) and 330–90° (KB). The result of this comparison is shown inTable 3. In addition to regional wind direction, local wind directionat KB was also used for analysis.
The UFP concentrations at the PlMl site were found to be nearly 30%higher forwinds coming from the traffic sector (~24,692 cm−3) compared
Table 4Correlation matrix (R2) of 30 minute average UFP values measured using the Nano‐Check atdiameter). The values in bold show R2 values of more than 0.66.
Metric (site) UFP; # cm−3 (PlMl) UFP; # cm−3 (Dis) UFP; # cm−3 (K
UFP; # cm−3(1 PlMl) 1.00 0.52⁎ 0.75⁎
UFP; # cm−3(2 Dis) 1.00 0.68⁎
UFP; # cm−3(3 KB) 1.00UFP; # cm−3(4 VMM)MD (1 PlMl)MD (2 Dis)MD (3 KB)MD (4 VMM)
⁎ pb0.005.
to winds coming from the non‐traffic sector (~18,905 cm−3), as shown inTable3. As opposed to this trend theUFP concentrations at theDis sitewereabout 40% lower (i.e. 18,802 cm−3) for winds coming from the traffic sec-tor compared with the non-traffic sector winds (~31,094 cm−3). For theKB site, UFP concentrations were found to be similar for non‐traffic sectorwinds (19,852 cm−3) compared with the traffic sector winds(20,225 cm−3). For the one week that was measured at the VMM site,only three data points were within the traffic sector. However, moredata points were just outside the non‐traffic sector as discussed inSection 3.2. When comparing traffic and non-traffic sector, taking local-ly measured wind directions into account and using a broader trafficsector (270–135°) at site 3 (KB), UFP concentrations are 20% higherfor the traffic sector (22,707 cm−3) as compared to the non-traffic sec-tor (19,046 cm−3).
3.5. Cross‐correlation of UFP
Inter‐correlations between the UFP concentrations at different sitesshowed a significant relationship (i.e. R2 values between 0.52 and 0.86;see Table 4). Likewise, the comparison of themean diameters of UFP be-tween the different sites showed mostly higher correlations (rangingbetween 0.6 and 0.84) than those found for the UFP concentrations.
The highly correlated pair of sites for UFP concentrations andcount mean diameter was PlMl and VMM with a R2 value of 0.86and 0.84, respectively. These two sites were experiencing similarlevels of traffic volume, which can explain the good correlation.Note that the data at the VMM site are only for one week sampling.However the correlations of both VMM (for one week) and PlMl(for one month) were higher for KB (0.79 and 0.74 respectively)than for Dis (0.55 and 0.52 respectively). As described earlier, thesampling locations at the KB site and the Dis site were situated inthe parking space next to the moving traffic, with the Dis siteexperiencing a slightly higher level of traffic volume compared tothe KB site. The possibility of fresh vehicular emissions (with smallerdiameter of UFP) reaching the samplers at these siteswas higher than thatat the other locations. Despite the fact that these sites were experiencingabout 10 times less traffic than the PlMl site (which was close to a majoraccess road) they had similar UFP concentrations at some days.
The Pearson correlation coefficient between the VMM and othermonitoring sites was 0.86, 0.79 and 0.55 for the PlMl, KB and Dis, re-spectively. These values are relatively close to +1 which indicates areasonably good representativeness of the VMM station, except forthe Dis site. The higher correlation between VMM and PlMl was prob-ably because both of them were situated on the same road with sim-ilar traffic and microclimatic conditions (i.e. road orientation, heightof buildings).
3.6. Representativeness of central monitoring station (VMM) forUFP levels within the grid
Table 5 shows the RMSD values for UFP for the individual sites.The RMSD values for UFP (ranging from ~0.38 to 0.71) was found to
different sites in Borgerhout for UFP number concentrations (# cm−3) and MD (mean
B) UFP; # cm−3 (VMM) MD (PlMl) MD (Dis) MD (KB) MD (VMM)
0.86⁎
0.55⁎
0.79⁎
1.001.00 0.72⁎ 0.84⁎ 0.83⁎
1.00 0.74⁎ 0.60⁎
1.00 0.84⁎
1.00
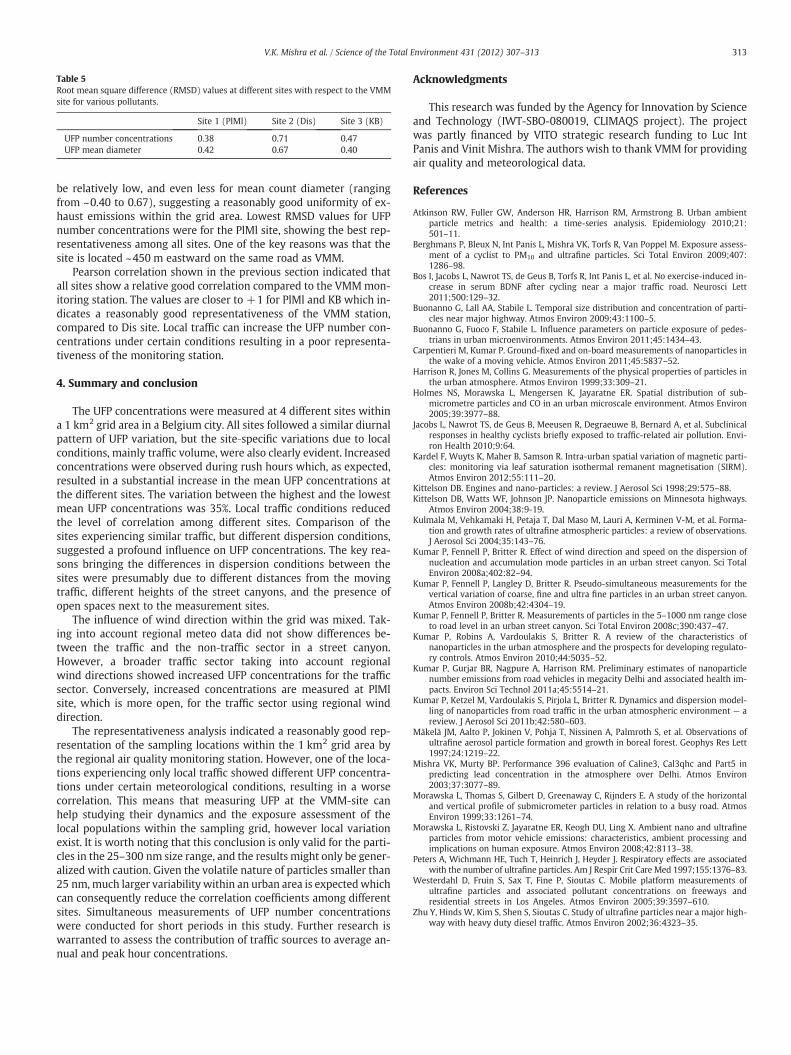
Table 5Root mean square difference (RMSD) values at different sites with respect to the VMMsite for various pollutants.
Site 1 (PlMl) Site 2 (Dis) Site 3 (KB)
UFP number concentrations 0.38 0.71 0.47UFP mean diameter 0.42 0.67 0.40
313V.K. Mishra et al. / Science of the Total Environment 431 (2012) 307–313
be relatively low, and even less for mean count diameter (rangingfrom ~0.40 to 0.67), suggesting a reasonably good uniformity of ex-haust emissions within the grid area. Lowest RMSD values for UFPnumber concentrations were for the PlMl site, showing the best rep-resentativeness among all sites. One of the key reasons was that thesite is located ~450 m eastward on the same road as VMM.
Pearson correlation shown in the previous section indicated thatall sites show a relative good correlation compared to the VMMmon-itoring station. The values are closer to +1 for PlMl and KB which in-dicates a reasonably good representativeness of the VMM station,compared to Dis site. Local traffic can increase the UFP number con-centrations under certain conditions resulting in a poor representa-tiveness of the monitoring station.
4. Summary and conclusion
The UFP concentrations were measured at 4 different sites withina 1 km2 grid area in a Belgium city. All sites followed a similar diurnalpattern of UFP variation, but the site‐specific variations due to localconditions, mainly traffic volume, were also clearly evident. Increasedconcentrations were observed during rush hours which, as expected,resulted in a substantial increase in the mean UFP concentrations atthe different sites. The variation between the highest and the lowestmean UFP concentrations was 35%. Local traffic conditions reducedthe level of correlation among different sites. Comparison of thesites experiencing similar traffic, but different dispersion conditions,suggested a profound influence on UFP concentrations. The key rea-sons bringing the differences in dispersion conditions between thesites were presumably due to different distances from the movingtraffic, different heights of the street canyons, and the presence ofopen spaces next to the measurement sites.
The influence of wind direction within the grid was mixed. Tak-ing into account regional meteo data did not show differences be-tween the traffic and the non‐traffic sector in a street canyon.However, a broader traffic sector taking into account regionalwind directions showed increased UFP concentrations for the trafficsector. Conversely, increased concentrations are measured at PlMlsite, which is more open, for the traffic sector using regional winddirection.
The representativeness analysis indicated a reasonably good rep-resentation of the sampling locations within the 1 km2 grid area bythe regional air quality monitoring station. However, one of the loca-tions experiencing only local traffic showed different UFP concentra-tions under certain meteorological conditions, resulting in a worsecorrelation. This means that measuring UFP at the VMM-site canhelp studying their dynamics and the exposure assessment of thelocal populations within the sampling grid, however local variationexist. It is worth noting that this conclusion is only valid for the parti-cles in the 25–300 nm size range, and the results might only be gener-alized with caution. Given the volatile nature of particles smaller than25 nm,much larger variability within an urban area is expectedwhichcan consequently reduce the correlation coefficients among differentsites. Simultaneous measurements of UFP number concentrationswere conducted for short periods in this study. Further research iswarranted to assess the contribution of traffic sources to average an-nual and peak hour concentrations.
Acknowledgments
This research was funded by the Agency for Innovation by Scienceand Technology (IWT-SBO-080019, CLIMAQS project). The projectwas partly financed by VITO strategic research funding to Luc IntPanis and Vinit Mishra. The authors wish to thank VMM for providingair quality and meteorological data.
References
Atkinson RW, Fuller GW, Anderson HR, Harrison RM, Armstrong B. Urban ambientparticle metrics and health: a time-series analysis. Epidemiology 2010;21:501–11.
Berghmans P, Bleux N, Int Panis L, Mishra VK, Torfs R, Van Poppel M. Exposure assess-ment of a cyclist to PM10 and ultrafine particles. Sci Total Environ 2009;407:1286–98.
Bos I, Jacobs L, Nawrot TS, de Geus B, Torfs R, Int Panis L, et al. No exercise-induced in-crease in serum BDNF after cycling near a major traffic road. Neurosci Lett2011;500:129–32.
Buonanno G, Lall AA, Stabile L. Temporal size distribution and concentration of parti-cles near major highway. Atmos Environ 2009;43:1100–5.
Buonanno G, Fuoco F, Stabile L. Influence parameters on particle exposure of pedes-trians in urban microenvironments. Atmos Environ 2011;45:1434–43.
Carpentieri M, Kumar P. Ground-fixed and on-board measurements of nanoparticles inthe wake of a moving vehicle. Atmos Environ 2011;45:5837–52.
Harrison R, Jones M, Collins G. Measurements of the physical properties of particles inthe urban atmosphere. Atmos Environ 1999;33:309–21.
Holmes NS, Morawska L, Mengersen K, Jayaratne ER. Spatial distribution of sub-micrometre particles and CO in an urban microscale environment. Atmos Environ2005;39:3977–88.
Jacobs L, Nawrot TS, de Geus B, Meeusen R, Degraeuwe B, Bernard A, et al. Subclinicalresponses in healthy cyclists briefly exposed to traffic-related air pollution. Envi-ron Health 2010;9:64.
Kardel F, Wuyts K, Maher B, Samson R. Intra-urban spatial variation of magnetic parti-cles: monitoring via leaf saturation isothermal remanent magnetisation (SIRM).Atmos Environ 2012;55:111–20.
Kittelson DB. Engines and nano-particles: a review. J Aerosol Sci 1998;29:575–88.Kittelson DB, Watts WF, Johnson JP. Nanoparticle emissions on Minnesota highways.
Atmos Environ 2004;38:9-19.Kulmala M, Vehkamaki H, Petaja T, Dal Maso M, Lauri A, Kerminen V-M, et al. Forma-
tion and growth rates of ultrafine atmospheric particles: a review of observations.J Aerosol Sci 2004;35:143–76.
Kumar P, Fennell P, Britter R. Effect of wind direction and speed on the dispersion ofnucleation and accumulation mode particles in an urban street canyon. Sci TotalEnviron 2008a;402:82–94.
Kumar P, Fennell P, Langley D, Britter R. Pseudo-simultaneous measurements for thevertical variation of coarse, fine and ultra fine particles in an urban street canyon.Atmos Environ 2008b;42:4304–19.
Kumar P, Fennell P, Britter R. Measurements of particles in the 5–1000 nm range closeto road level in an urban street canyon. Sci Total Environ 2008c;390:437–47.
Kumar P, Robins A, Vardoulakis S, Britter R. A review of the characteristics ofnanoparticles in the urban atmosphere and the prospects for developing regulato-ry controls. Atmos Environ 2010;44:5035–52.
Kumar P, Gurjar BR, Nagpure A, Harrison RM. Preliminary estimates of nanoparticlenumber emissions from road vehicles in megacity Delhi and associated health im-pacts. Environ Sci Technol 2011a;45:5514–21.
Kumar P, Ketzel M, Vardoulakis S, Pirjola L, Britter R. Dynamics and dispersion model-ling of nanoparticles from road traffic in the urban atmospheric environment — areview. J Aerosol Sci 2011b;42:580–603.
Mäkelä JM, Aalto P, Jokinen V, Pohja T, Nissinen A, Palmroth S, et al. Observations ofultrafine aerosol particle formation and growth in boreal forest. Geophys Res Lett1997;24:1219–22.
Mishra VK, Murty BP. Performance 396 evaluation of Caline3, Cal3qhc and Part5 inpredicting lead concentration in the atmosphere over Delhi. Atmos Environ2003;37:3077–89.
Morawska L, Thomas S, Gilbert D, Greenaway C, Rijnders E. A study of the horizontaland vertical profile of submicrometer particles in relation to a busy road. AtmosEnviron 1999;33:1261–74.
Morawska L, Ristovski Z, Jayaratne ER, Keogh DU, Ling X. Ambient nano and ultrafineparticles from motor vehicle emissions: characteristics, ambient processing andimplications on human exposure. Atmos Environ 2008;42:8113–38.
Peters A, Wichmann HE, Tuch T, Heinrich J, Heyder J. Respiratory effects are associatedwith the number of ultrafine particles. Am J Respir Crit Care Med 1997;155:1376–83.
Westerdahl D, Fruin S, Sax T, Fine P, Sioutas C. Mobile platform measurements ofultrafine particles and associated pollutant concentrations on freeways andresidential streets in Los Angeles. Atmos Environ 2005;39:3597–610.
Zhu Y, Hinds W, Kim S, Shen S, Sioutas C. Study of ultrafine particles near a major high-way with heavy duty diesel traffic. Atmos Environ 2002;36:4323–35.