wintergreen pond management plan (1)
TRANSCRIPT
*=Environmental Science Students
Wintergreen Ponds
Water Quality Assessment Report
Wintergreen Va.
Prepared by Thomas D. Shahady, Ph.D.
John Fitzpatrick* Tyler Stadtherr*
Lynchburg College
October 14, 2015

2
Table of Contents
I. Executive Summary
II. Project Description
III. Study Area and Descriptions
a. Watershed
b. Ponds
c. WPOA
IV. Sampling Methodologies
V. Water Quality Assessment
a. Streams
b. Ponds
c. Conclusions
3
I. Executive Summary
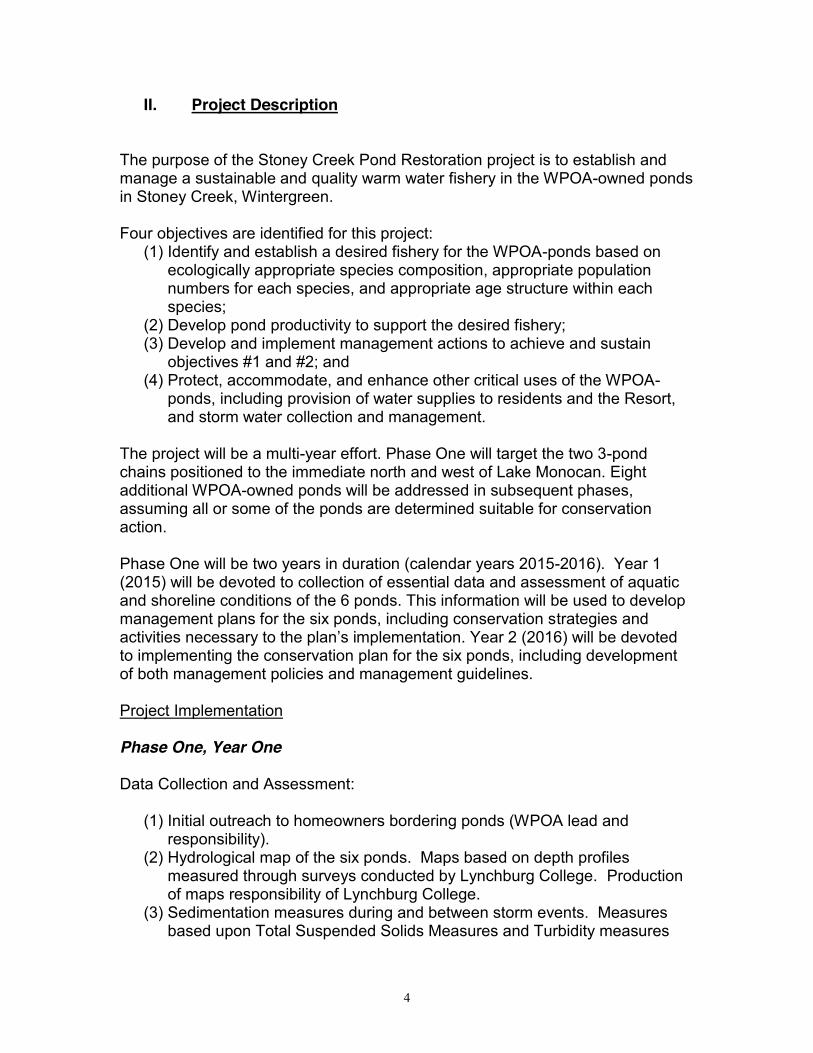
Project was undertaken to explore the water quality and fisheries status of series of ponds at Wintergreen Resort in Virginia. A partnership was established between Lynchburg College and Wintergreen Property Owners Association to assess the current status of 6 selected ponds and further develop a management plan in the future for these ponds. Assessment work was completed throughout the spring and summer of 2015 and is reported here. The ponds are fed by two streams that originate at the top of Crawford Knob. Watersheds for these streams are wooded and both streams have excellent water quality. Ponds are arranged in two series parallel and all are surrounded by wooded areas and homes with lawns that stretch to the ponds edge. The first series of ponds are numbered 8 – 7 – 4 with the second series 9 – 6 – 5. Three of the ponds are approximately 4 acres in size while the other three ponds are approximately 2 acres in size. Water quality of the ponds is influenced more by land use than stream water quality. In the first series of ponds, number 8 has elevated nutrient and bacteria loading likely from surrounding land use. It is one of the smaller ponds and currently supports a balanced fishery but bluegill populations are very out of proportion. The second pond in the series, number 7, is the shallowest of the larger ponds and has the greatest populations of aquatic weeds. Productivity is low. It currently supports a stock – quality size largemouth bass fishery. The third pond in the series, pond 4, is the largest and deepest of the ponds. It has very low biological productivity and does not support any fishery. In the second series of ponds, pond 9 is a small pond with a high concentration of nutrients and bacteria. Likely sources involve surrounding land use other than stream inputs. This pond is currently managed as a good bluegill fishery. The second pond in the series, pond 6, is very similar in size and depth to pond 9. It has greater nutrient concentrations and higher biological activity. It currently supports an excellent quality bass fishery. Pond 5 is one of the larger ponds and it is the least productive of the ponds on this chain. It has good buffer surrounding the pond as this likely reduces the productivity in this pond. It is currently supporting a good bluegill fishery.
4
II. Project Description The purpose of the Stoney Creek Pond Restoration project is to establish and manage a sustainable and quality warm water fishery in the WPOA-owned ponds in Stoney Creek, Wintergreen. Four objectives are identified for this project:
(1) Identify and establish a desired fishery for the WPOA-ponds based on ecologically appropriate species composition, appropriate population numbers for each species, and appropriate age structure within each species;
(2) Develop pond productivity to support the desired fishery; (3) Develop and implement management actions to achieve and sustain
objectives #1 and #2; and (4) Protect, accommodate, and enhance other critical uses of the WPOA-
ponds, including provision of water supplies to residents and the Resort, and storm water collection and management.
The project will be a multi-year effort. Phase One will target the two 3-pond chains positioned to the immediate north and west of Lake Monocan. Eight additional WPOA-owned ponds will be addressed in subsequent phases, assuming all or some of the ponds are determined suitable for conservation action. Phase One will be two years in duration (calendar years 2015-2016). Year 1 (2015) will be devoted to collection of essential data and assessment of aquatic and shoreline conditions of the 6 ponds. This information will be used to develop management plans for the six ponds, including conservation strategies and activities necessary to the plan’s implementation. Year 2 (2016) will be devoted to implementing the conservation plan for the six ponds, including development of both management policies and management guidelines. Project Implementation Phase One, Year One Data Collection and Assessment:
(1) Initial outreach to homeowners bordering ponds (WPOA lead and responsibility).
(2) Hydrological map of the six ponds. Maps based on depth profiles measured through surveys conducted by Lynchburg College. Production of maps responsibility of Lynchburg College.
(3) Sedimentation measures during and between storm events. Measures based upon Total Suspended Solids Measures and Turbidity measures
5
conducted by Lynchburg College. Discharge (cfs) will accompany these measures to calculate total sediment load. A minimum of three significant rain event (greater than 1 inch in 24 hours) will be measured over calendar year 2015. The headwater streams and discharge between each pond chain will be measured. Lynchburg College is responsible for this work.
(4) Status of septic fields on properties adjacent to the ponds (Note: This step will be contingent on water quality analysis.) Status will be classified functioning and maintained. Functioning and unmaintained. And non functioning. Assessment based upon adequate pumping records and water quality measures. Responsibility of WPOA and WSC.
(5) Water quality testing and analysis. Lynchburg College will test each pond in April and July of 2015. Testing parameters include profiles of oxygen, temperature, conductivity, pH, turbidity and chlorophyll a. Measures of total phosphorus and nitrate nitrogen for each pond in surface water and below the thermocline. One measure of Secchi Depth.
(6) Inventory and assessment of aquatic vegetation in the six ponds and along drainages feeding the ponds. Lynchburg College will collect representative samples of all vegetation in the ponds and approximate coverage of submergent, emergent and floating vegetation during the April and July sampling events. Will use visual surveys to approximate the coverage and locate on a map.
(7) Assessment of existing fish habitat conditions. Lynchburg College will conduct visual surveys noting fish habitat and will approximate the coverage and locate on a map. These surveys will be conducted in April and July.
(8) Inventory of pond fish species, including species composition, numbers, and age structures. Lynchburg College will conduct two surveys of fish populations using 10 foot seine and shoreline electrofishing equipment. Surveys conducted in April and July recording all species and length of captured fish. April fish will be fin clipped to make population assessments for the July sampling. WSC will be responsible for creel surveys or other methodologies for surveys.
(9) Invertebrate survey (Streams and Ponds). Lynchburg college will assess the populations of zooplankton on each pond and composition of aquatic insects in each headwater stream in April and July. Samples collected on the ponds using a zooplankton net pulled through the epilimnion and samples in the streams with a kick net sampling a composite of three riffle sites. All insects will be identified to a minimum of family and used to generate water quality indices.
6
Phase One, Year Two Management may include any or all of the following actions. Pertaining to all of this work Lynchburg College will provide recommendations only. WPOA and WSC will be responsible for any work in this area. :
(1) Mitigate external sources of water degradation. (2) Restore or enhance stream bank vegetation composition and structure. .
Restore or enhance wetland plant communities within or bordering drainages feeding the ponds.
(3) Address invasive aquatic vegetation (4) Re-establish native aquatic vegetation (5) Add structure to fish habitat (6) Manipulate species composition, numbers, and age structures (7) Establish fishing policies and rules, fisheries management guidelines, and
enforcement mechanisms to sustain management achievements and objectives (WPOA overall responsibility; WSC provide fishery management recommendations.)
(8) Follow-up outreach to homeowners bordering ponds (WPOA lead responsibility; coordinate with WSC)
(9) Perform outreach to current and potential users of the ponds Project Management The project shall be managed as a cooperative effort between the Wintergreen Property Owners Association (pond owners), the Wintergreen Sporting Club (a recreational association of homeowners at Wintergreen) and Lynchburg College (scientific advisors for the project). For the duration of this project, the responsible parties for the three cooperating entities are: Russell Otis, Executive Director of WPOA; Karl Hess, President, Wintergreen Sporting Club, and Dr. Tom Shahady, Professor Lynchburg College. WPOA will exercise final authority over any and all actions affecting the ponds owned by WPOA. The Wintergreen Sporting Club will, with the consent and support of WPOA, oversee the day-to-day assessment and management activities of the project and will have the responsibility to work with both WPOA and Lynchburg College to acquire and deploy human and material resources required for the project. Lynchburg College will, with the consent of WPOA and support of the Wintergreen Sporting Club, perform or assist in the performance of data collection and assessment of the ponds and in subsequent design and implementation of pond fishery management. In addition, Lynchburg College will provide an estimate of costs for pond restoration activities not otherwise covered by its participation in the project; work with the Wintergreen Sporting Club to identify possible funding sources; and provide one or more students to assist in

7
the two phases of the project as part of their academic training (for credit as an associated course, as a paid stipend or both). In regard to any staff or students of Lynchburg College participating in the project, WPOA and the Wintergreen Sporting Club will ensure safe and continuous access to those ponds for those participants for the duration of the project. WPOA and the Wintergreen Sporting Club will accompany participants as needed, introduce participants to local homeowners, and provide credentials identifying them as agents of WPOA. Personnel Two Lynchburg College Environmental Students, Tyler Stadtherr and John Fitzpatrick, will work as interns on various aspects of this project. They will be responsible for sample collection, data analysis and other tasks assigned by Professor Shahady or the WPOA. Dr. Shahady will supervise their activities in all aspects of the project at Lynchburg College and when he is present with them on site in conjunction with WPOA. If students are on site independently, WPOA will assume responsibility for management of their activities. Environmental Science Professor, Tom Shahady, will direct the entire project in coordination with WPOA. He will be responsible for production of the lake management plan, integrity of data collected and interpretation of all data.
8
III. Study Area and Descriptions
A. Watershed
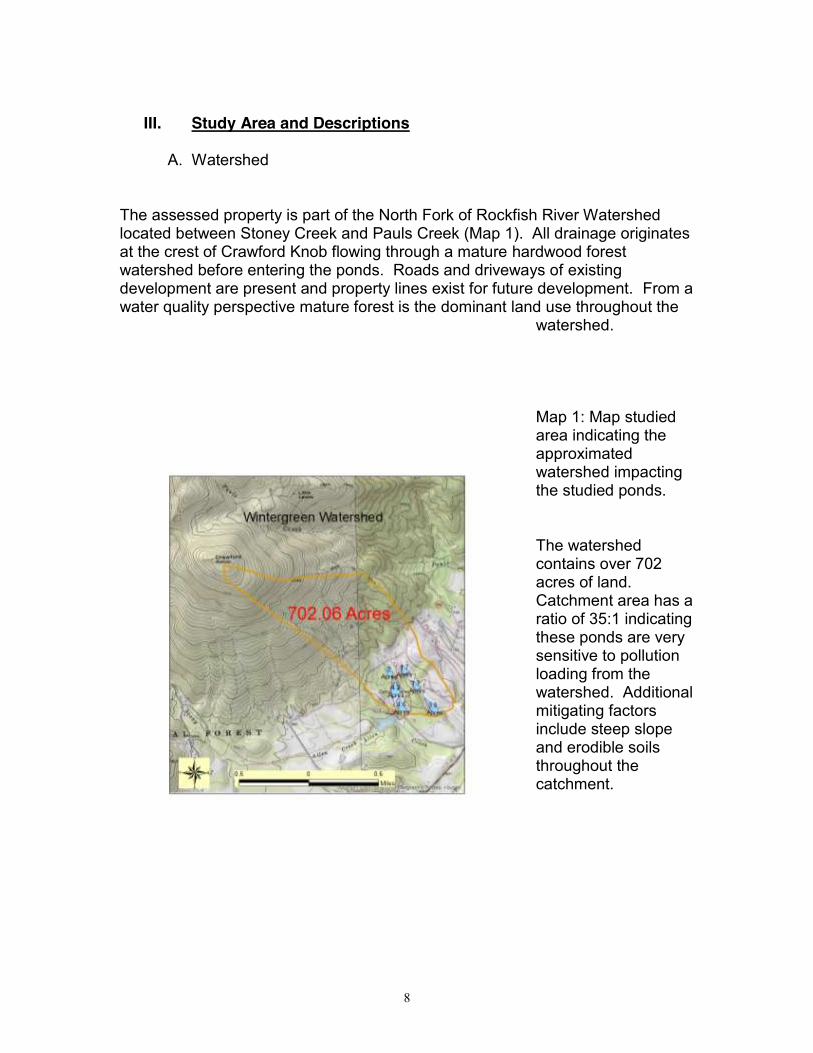
The assessed property is part of the North Fork of Rockfish River Watershed located between Stoney Creek and Pauls Creek (Map 1). All drainage originates at the crest of Crawford Knob flowing through a mature hardwood forest watershed before entering the ponds. Roads and driveways of existing development are present and property lines exist for future development. From a water quality perspective mature forest is the dominant land use throughout the
watershed. Map 1: Map studied area indicating the approximated watershed impacting the studied ponds. The watershed contains over 702 acres of land. Catchment area has a ratio of 35:1 indicating these ponds are very sensitive to pollution loading from the watershed. Additional mitigating factors include steep slope and erodible soils throughout the catchment.
9
B. Ponds
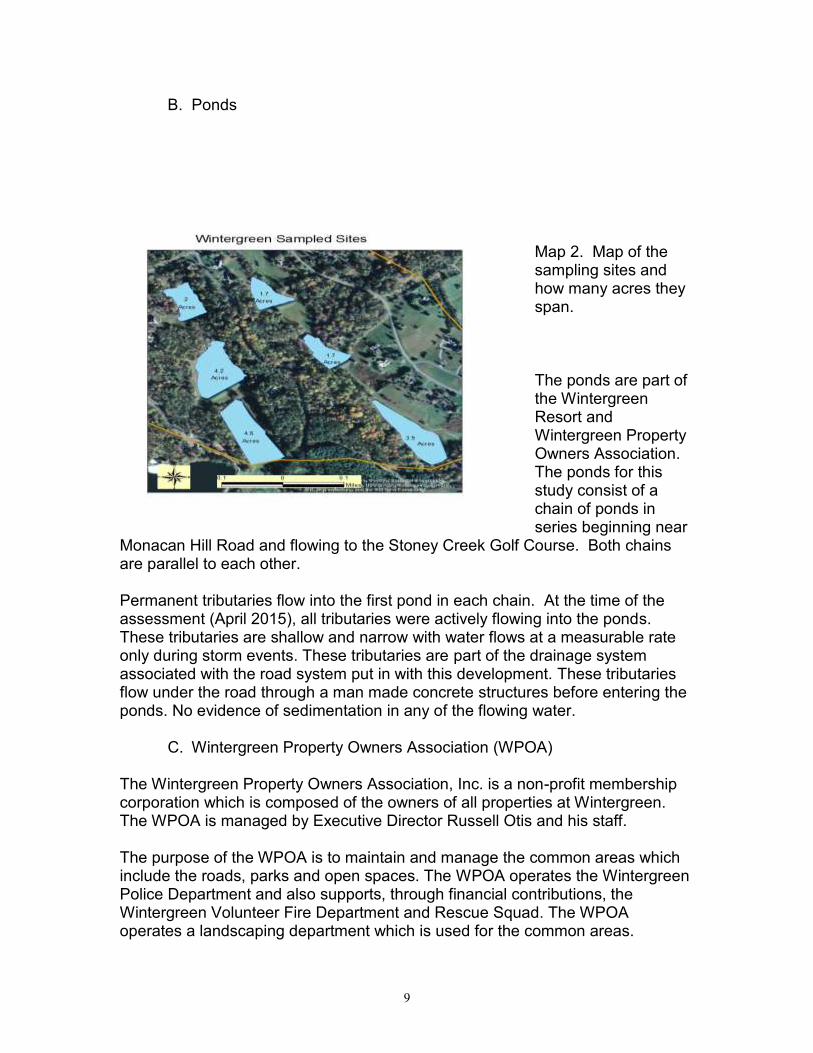
Map 2. Map of the sampling sites and how many acres they span. The ponds are part of the Wintergreen Resort and Wintergreen Property Owners Association. The ponds for this study consist of a chain of ponds in series beginning near
Monacan Hill Road and flowing to the Stoney Creek Golf Course. Both chains are parallel to each other. Permanent tributaries flow into the first pond in each chain. At the time of the assessment (April 2015), all tributaries were actively flowing into the ponds. These tributaries are shallow and narrow with water flows at a measurable rate only during storm events. These tributaries are part of the drainage system associated with the road system put in with this development. These tributaries flow under the road through a man made concrete structures before entering the ponds. No evidence of sedimentation in any of the flowing water.
C. Wintergreen Property Owners Association (WPOA) The Wintergreen Property Owners Association, Inc. is a non-profit membership corporation which is composed of the owners of all properties at Wintergreen. The WPOA is managed by Executive Director Russell Otis and his staff. The purpose of the WPOA is to maintain and manage the common areas which include the roads, parks and open spaces. The WPOA operates the Wintergreen Police Department and also supports, through financial contributions, the Wintergreen Volunteer Fire Department and Rescue Squad. The WPOA operates a landscaping department which is used for the common areas.
10
All property owners are welcome to fish the various lakes in Stoney Creek and Rhodes Farm. Guests are also permitted when accompanied by the property owner. As in other waters of the Commonwealth, a fishing license is required. Also providing excellent fishing is Stoney Creek itself where it flows within the boundaries of Wintergreen. The trout stream is stocked annually and offers lots of opportunities for catching fish up to 20 inches. The stream is limited to fly fishing only with barbless hooks and is a catch and release area.
11
IV. Sampling Methodology
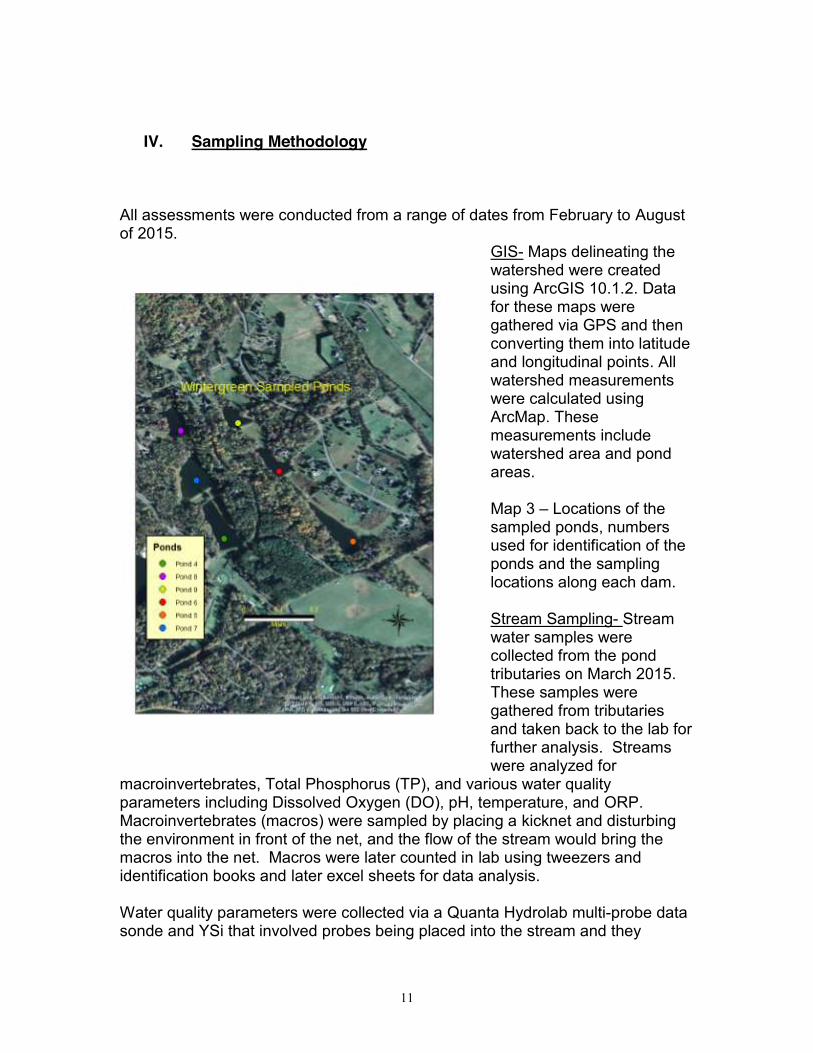
All assessments were conducted from a range of dates from February to August of 2015.
GIS- Maps delineating the watershed were created using ArcGIS 10.1.2. Data for these maps were gathered via GPS and then converting them into latitude and longitudinal points. All watershed measurements were calculated using ArcMap. These measurements include watershed area and pond areas. Map 3 – Locations of the sampled ponds, numbers used for identification of the ponds and the sampling locations along each dam. Stream Sampling- Stream water samples were collected from the pond tributaries on March 2015. These samples were gathered from tributaries and taken back to the lab for further analysis. Streams were analyzed for
macroinvertebrates, Total Phosphorus (TP), and various water quality parameters including Dissolved Oxygen (DO), pH, temperature, and ORP. Macroinvertebrates (macros) were sampled by placing a kicknet and disturbing the environment in front of the net, and the flow of the stream would bring the macros into the net. Macros were later counted in lab using tweezers and identification books and later excel sheets for data analysis. Water quality parameters were collected via a Quanta Hydrolab multi-probe data sonde and YSi that involved probes being placed into the stream and they
12
displayed them on the screen to be later recorded. Water samples were then collected and brought back to campus to be later analyzed using Easy Chem. Auto analyzer. Pond Sampling – Pond sampling involved many steps. A boat was used and transported between ponds. While on the boat, a Quanta Hydrolab multi-probe data sonde was used to collect water quality (WQ) parameters. It was placed every half meter and a recorder recorded all the parameters in a notebook for later analysis. Individual depth profiles were created using each individual WQ parameter. A Secchi Disk was used to determine water clarity by placing the disk in the water until it no longer appeared. Notches on the line indicated on far the disk was in the water and that measurement was later recorded. Water samples were collected for later analysis of plankton or small living organisms. Lake Depths Pond depths were analyzed using a sonar device called Get Deeper Sonar. The Deeper sonar projected the depth on a mobile device that was later recorded and a GPS that was used to mark areas in depths were collected in latitude and longitude and all coordinates and depths were collected in a notebook. Creel Surveys Two Creel surveys were completed during this analysis. One in April and the other in July. Typically, the April sampling provides greater catches of fish with lower catches expected in July. Angler effort consisted of approximately 10 angler hours on each pond for the creel survey with equal fishing pressure on both pan fish and bass species. Proportional Stock Density and Relative Stock Density were calculated for each of the ponds. Proportional Stock Density (PSD) is defined as the proportion of a species of fish that is of a stock size but also of a quality size. These lengths are defined for a given species. The Relative Stock Density (RSD) is defined as the proportion of a species that is of a stock size and also of a given or defined size. In this study it is the preferred size used for RSD. Table 1 defines these parameters for our study.
13
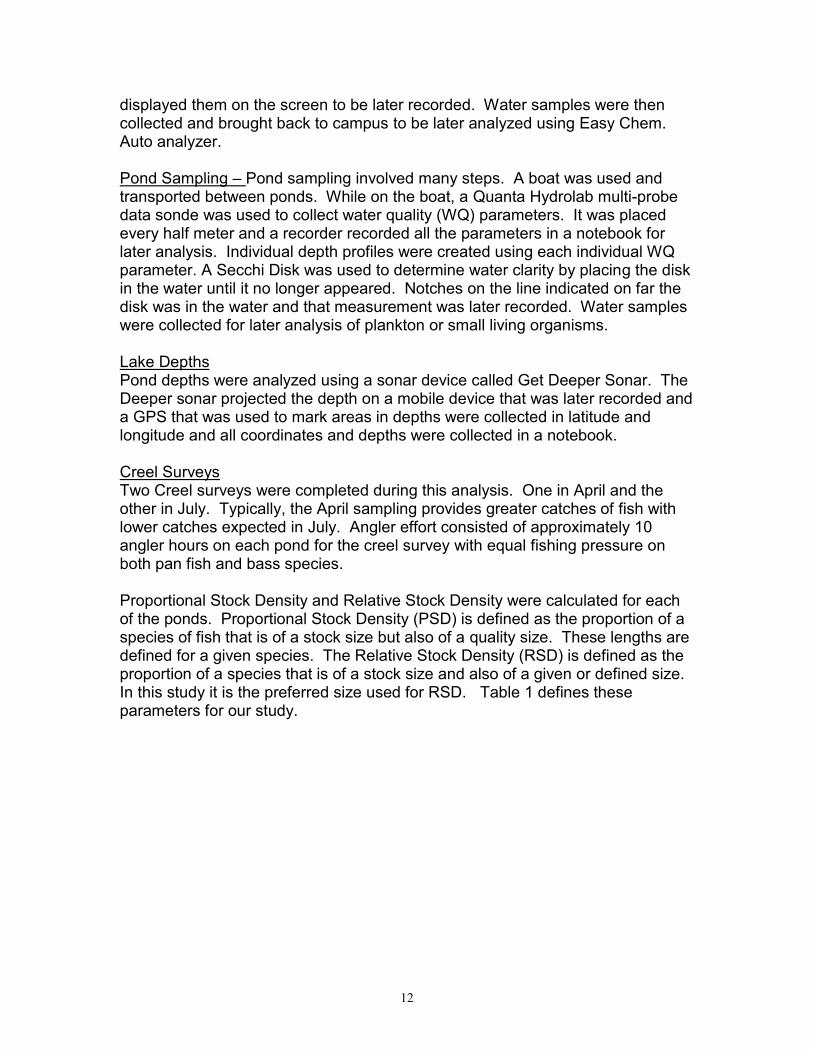
Table 1. Size of fish used in calculation of PSD and RSD for this study.
Species Stock
Length
Quality
Size
Relative
Size
PSD RSD
Bluegill and
Pumpkinseed
3” 6” 8” Number 3”
Number 6”
X100
Number 3”
Number 8”
X100
Largemouth
Bass
8” 12” 15” Number 8”
Number 12”
X100
Number 8”
Number 15”
X100
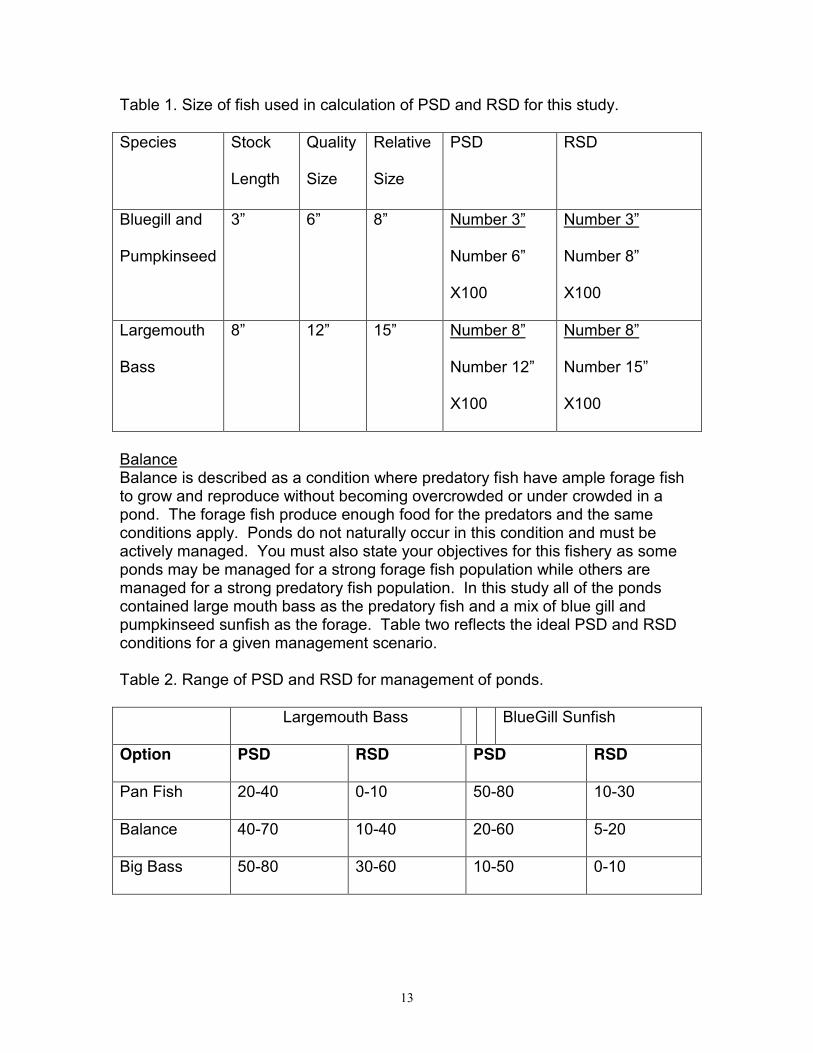
Balance Balance is described as a condition where predatory fish have ample forage fish to grow and reproduce without becoming overcrowded or under crowded in a pond. The forage fish produce enough food for the predators and the same conditions apply. Ponds do not naturally occur in this condition and must be actively managed. You must also state your objectives for this fishery as some ponds may be managed for a strong forage fish population while others are managed for a strong predatory fish population. In this study all of the ponds contained large mouth bass as the predatory fish and a mix of blue gill and pumpkinseed sunfish as the forage. Table two reflects the ideal PSD and RSD conditions for a given management scenario. Table 2. Range of PSD and RSD for management of ponds.
Largemouth Bass BlueGill Sunfish
Option PSD RSD PSD RSD
Pan Fish 20-40 0-10 50-80 10-30
Balance 40-70 10-40 20-60 5-20
Big Bass 50-80 30-60 10-50 0-10

14
In the panfish option, largemouth bass are managed at a much smaller size. A slow growing and dense population of largemouth bass prey upon bluegill populations and the surviving bluegill have very high rates of reproduction and grow outside a size preyed upon by bass populations. In the big bass option, the management idea is to produce fewer larger bass with less predation pressure on bluegills.
15
V. Water Quality Assessment
A. Stream Analysis
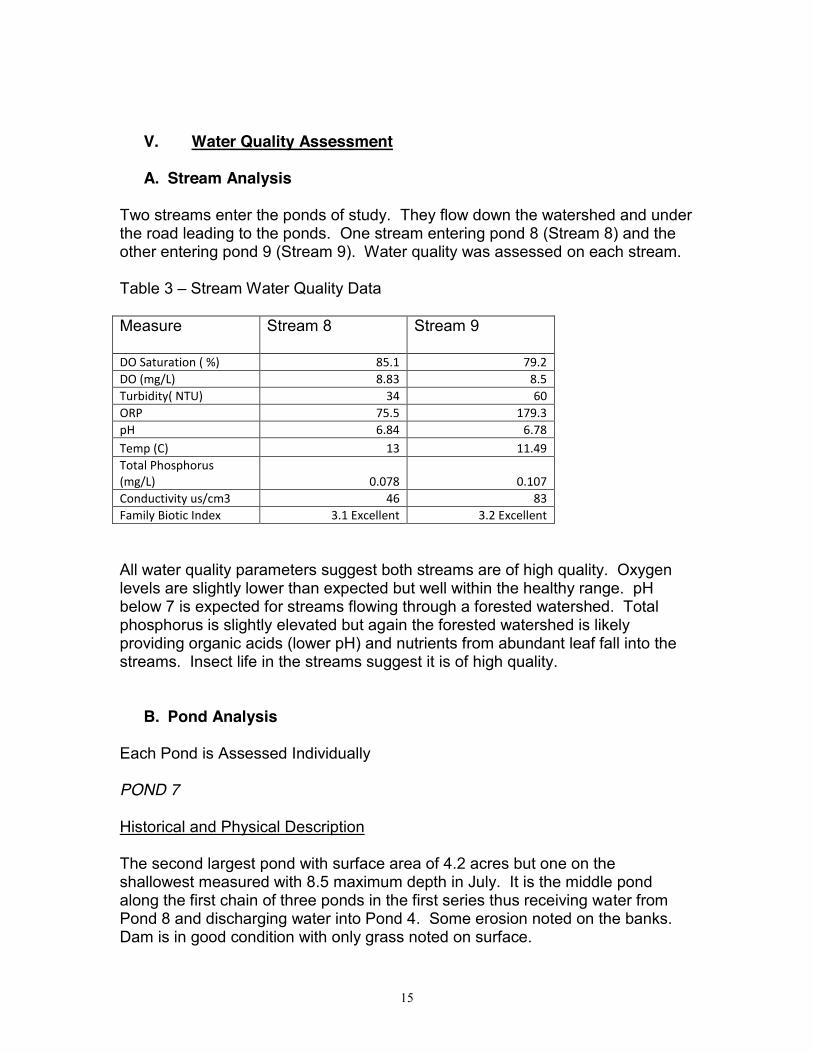
Two streams enter the ponds of study. They flow down the watershed and under the road leading to the ponds. One stream entering pond 8 (Stream 8) and the other entering pond 9 (Stream 9). Water quality was assessed on each stream. Table 3 – Stream Water Quality Data
Measure Stream 8 Stream 9
DO Saturation ( %) 85.1 79.2 DO (mg/L) 8.83 8.5 Turbidity( NTU) 34 60 ORP 75.5 179.3 pH 6.84 6.78 Temp (C) 13 11.49 Total Phosphorus (mg/L) 0.078 0.107 Conductivity us/cm3 46 83 Family Biotic Index 3.1 Excellent 3.2 Excellent
All water quality parameters suggest both streams are of high quality. Oxygen levels are slightly lower than expected but well within the healthy range. pH below 7 is expected for streams flowing through a forested watershed. Total phosphorus is slightly elevated but again the forested watershed is likely providing organic acids (lower pH) and nutrients from abundant leaf fall into the streams. Insect life in the streams suggest it is of high quality.
B. Pond Analysis
Each Pond is Assessed Individually POND 7 Historical and Physical Description The second largest pond with surface area of 4.2 acres but one on the shallowest measured with 8.5 maximum depth in July. It is the middle pond along the first chain of three ponds in the first series thus receiving water from Pond 8 and discharging water into Pond 4. Some erosion noted on the banks. Dam is in good condition with only grass noted on surface.
16
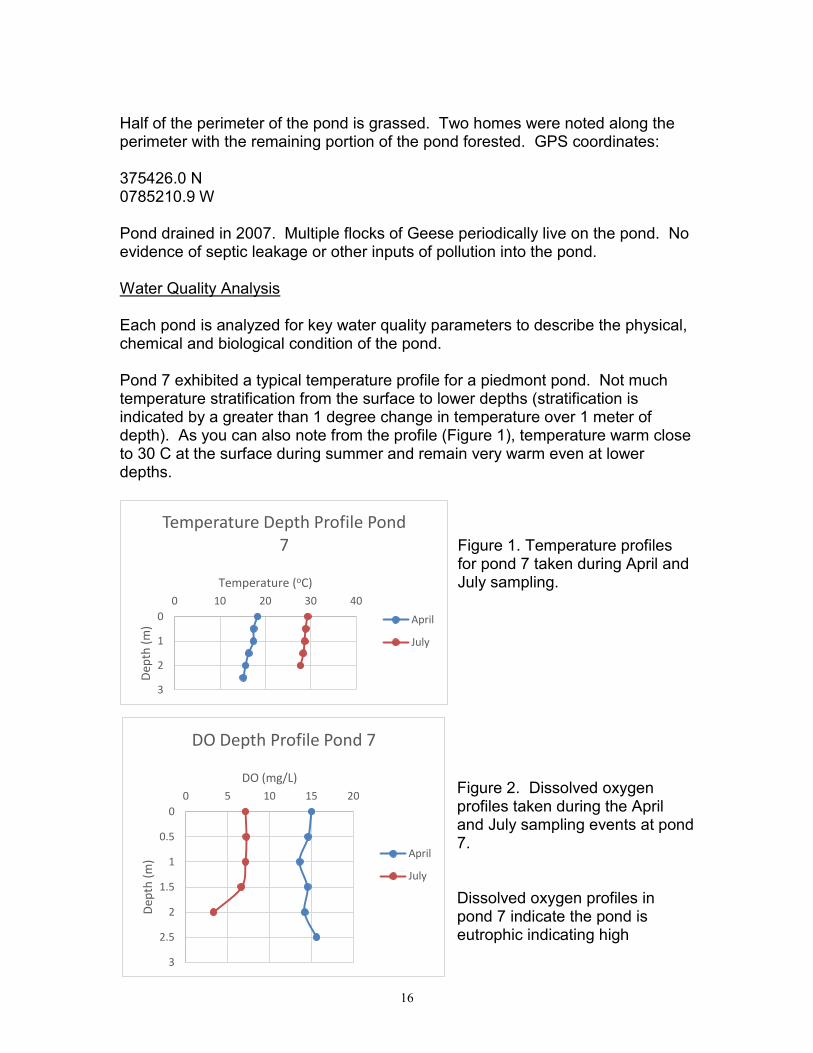
Half of the perimeter of the pond is grassed. Two homes were noted along the perimeter with the remaining portion of the pond forested. GPS coordinates: 375426.0 N 0785210.9 W Pond drained in 2007. Multiple flocks of Geese periodically live on the pond. No evidence of septic leakage or other inputs of pollution into the pond. Water Quality Analysis Each pond is analyzed for key water quality parameters to describe the physical, chemical and biological condition of the pond. Pond 7 exhibited a typical temperature profile for a piedmont pond. Not much temperature stratification from the surface to lower depths (stratification is indicated by a greater than 1 degree change in temperature over 1 meter of depth). As you can also note from the profile (Figure 1), temperature warm close to 30 C at the surface during summer and remain very warm even at lower depths.
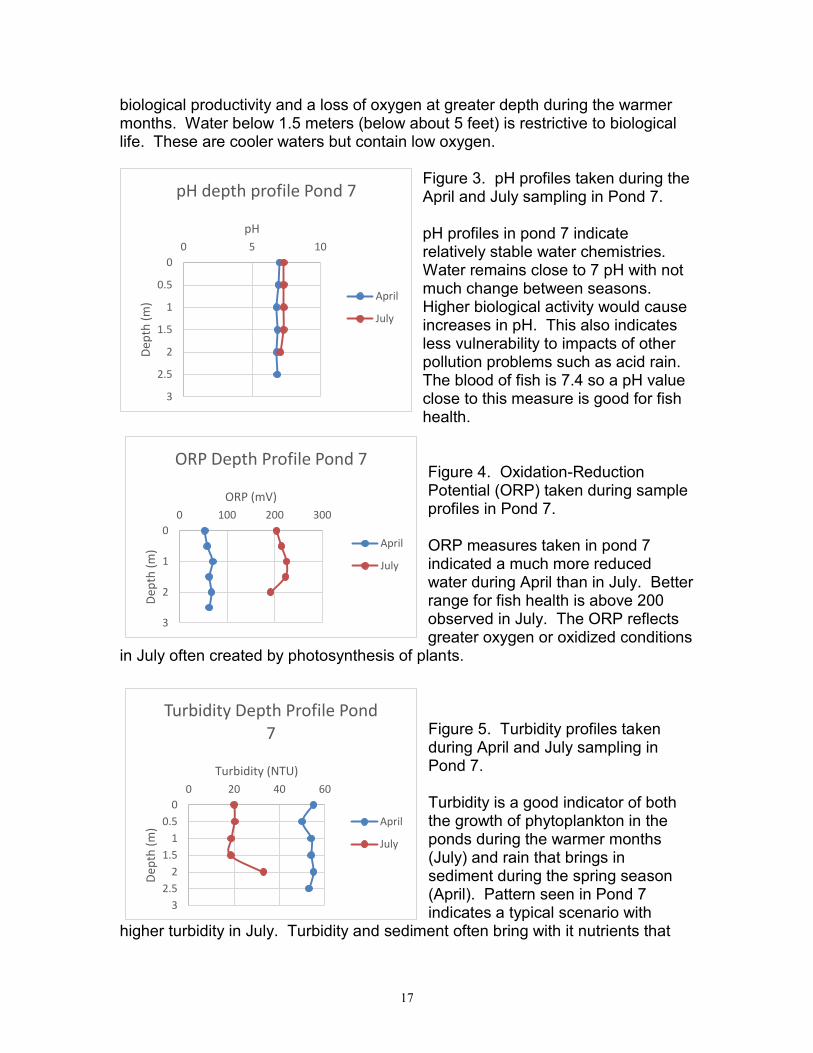
Figure 1. Temperature profiles for pond 7 taken during April and July sampling. Figure 2. Dissolved oxygen profiles taken during the April and July sampling events at pond 7. Dissolved oxygen profiles in pond 7 indicate the pond is eutrophic indicating high
0
1
2
3
0 10 20 30 40
Dept
h (m
)
Temperature (oC)
Temperature Depth Profile Pond 7
April
July
0
0.5
1
1.5
2
2.5
3
0 5 10 15 20
Dept
h (m
)
DO (mg/L)
DO Depth Profile Pond 7
April
July
17
biological productivity and a loss of oxygen at greater depth during the warmer months. Water below 1.5 meters (below about 5 feet) is restrictive to biological life. These are cooler waters but contain low oxygen.
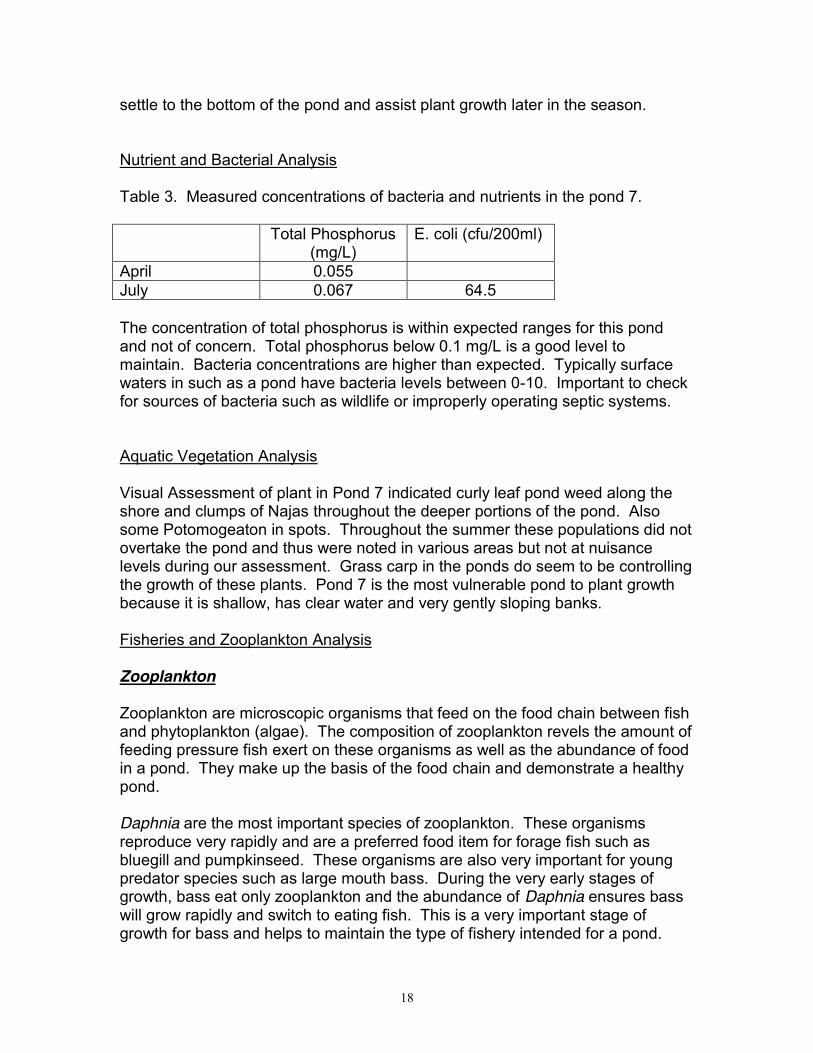
Figure 3. pH profiles taken during the April and July sampling in Pond 7. pH profiles in pond 7 indicate relatively stable water chemistries. Water remains close to 7 pH with not much change between seasons. Higher biological activity would cause increases in pH. This also indicates less vulnerability to impacts of other pollution problems such as acid rain. The blood of fish is 7.4 so a pH value close to this measure is good for fish health. Figure 4. Oxidation-Reduction Potential (ORP) taken during sample profiles in Pond 7. ORP measures taken in pond 7 indicated a much more reduced water during April than in July. Better range for fish health is above 200 observed in July. The ORP reflects greater oxygen or oxidized conditions
in July often created by photosynthesis of plants.
Figure 5. Turbidity profiles taken during April and July sampling in Pond 7. Turbidity is a good indicator of both the growth of phytoplankton in the ponds during the warmer months (July) and rain that brings in sediment during the spring season (April). Pattern seen in Pond 7 indicates a typical scenario with
higher turbidity in July. Turbidity and sediment often bring with it nutrients that
0
0.5
1
1.5
2
2.5
3
0 5 10
Dept
h (m
)
pH
pH depth profile Pond 7
April
July
0
1
2
3
0 100 200 300
Dept
h (m
)
ORP (mV)
ORP Depth Profile Pond 7
April
July
0 0.5
1 1.5
2 2.5
3
0 20 40 60
Dept
h (m
)
Turbidity (NTU)
Turbidity Depth Profile Pond 7
April
July
18
settle to the bottom of the pond and assist plant growth later in the season. Nutrient and Bacterial Analysis Table 3. Measured concentrations of bacteria and nutrients in the pond 7. Total Phosphorus
(mg/L) E. coli (cfu/200ml)
April 0.055 July 0.067 64.5 The concentration of total phosphorus is within expected ranges for this pond and not of concern. Total phosphorus below 0.1 mg/L is a good level to maintain. Bacteria concentrations are higher than expected. Typically surface waters in such as a pond have bacteria levels between 0-10. Important to check for sources of bacteria such as wildlife or improperly operating septic systems. Aquatic Vegetation Analysis Visual Assessment of plant in Pond 7 indicated curly leaf pond weed along the shore and clumps of Najas throughout the deeper portions of the pond. Also some Potomogeaton in spots. Throughout the summer these populations did not overtake the pond and thus were noted in various areas but not at nuisance levels during our assessment. Grass carp in the ponds do seem to be controlling the growth of these plants. Pond 7 is the most vulnerable pond to plant growth because it is shallow, has clear water and very gently sloping banks. Fisheries and Zooplankton Analysis Zooplankton Zooplankton are microscopic organisms that feed on the food chain between fish and phytoplankton (algae). The composition of zooplankton revels the amount of feeding pressure fish exert on these organisms as well as the abundance of food in a pond. They make up the basis of the food chain and demonstrate a healthy pond. Daphnia are the most important species of zooplankton. These organisms reproduce very rapidly and are a preferred food item for forage fish such as bluegill and pumpkinseed. These organisms are also very important for young predator species such as large mouth bass. During the very early stages of growth, bass eat only zooplankton and the abundance of Daphnia ensures bass will grow rapidly and switch to eating fish. This is a very important stage of growth for bass and helps to maintain the type of fishery intended for a pond.
19
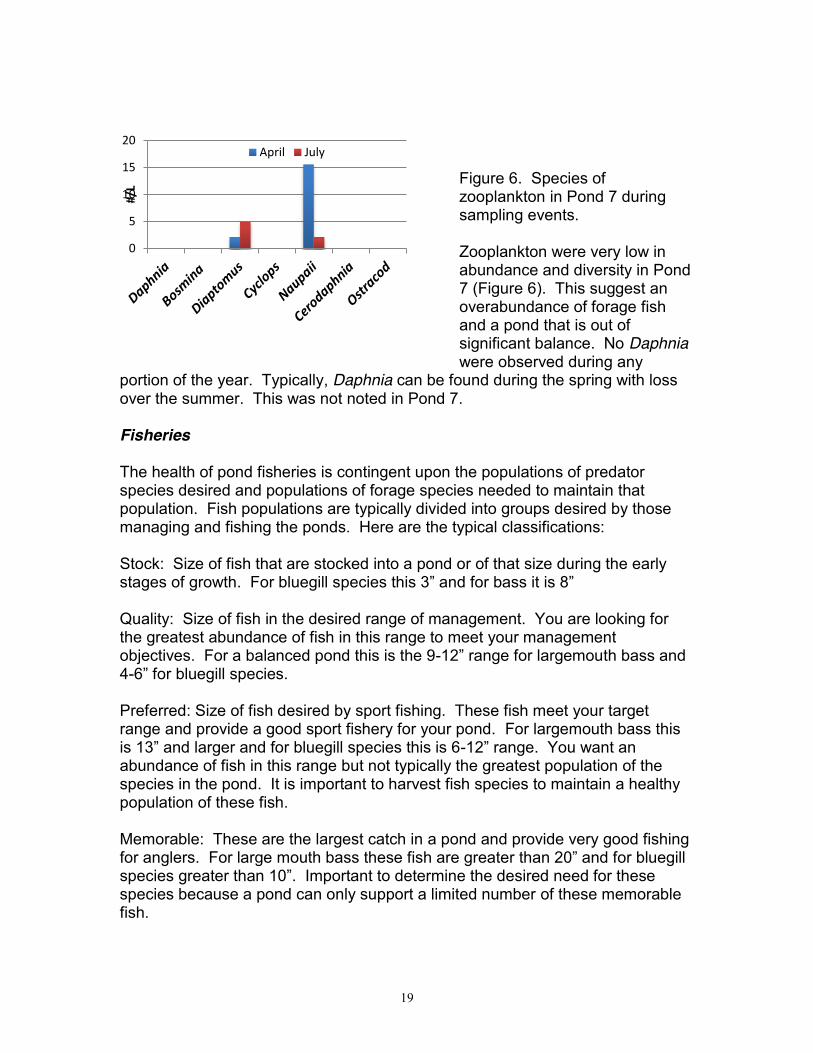
Figure 6. Species of zooplankton in Pond 7 during sampling events. Zooplankton were very low in abundance and diversity in Pond 7 (Figure 6). This suggest an overabundance of forage fish and a pond that is out of significant balance. No Daphnia were observed during any
portion of the year. Typically, Daphnia can be found during the spring with loss over the summer. This was not noted in Pond 7. Fisheries The health of pond fisheries is contingent upon the populations of predator species desired and populations of forage species needed to maintain that population. Fish populations are typically divided into groups desired by those managing and fishing the ponds. Here are the typical classifications: Stock: Size of fish that are stocked into a pond or of that size during the early stages of growth. For bluegill species this 3” and for bass it is 8” Quality: Size of fish in the desired range of management. You are looking for the greatest abundance of fish in this range to meet your management objectives. For a balanced pond this is the 9-12” range for largemouth bass and 4-6” for bluegill species. Preferred: Size of fish desired by sport fishing. These fish meet your target range and provide a good sport fishery for your pond. For largemouth bass this is 13” and larger and for bluegill species this is 6-12” range. You want an abundance of fish in this range but not typically the greatest population of the species in the pond. It is important to harvest fish species to maintain a healthy population of these fish. Memorable: These are the largest catch in a pond and provide very good fishing for anglers. For large mouth bass these fish are greater than 20” and for bluegill species greater than 10”. Important to determine the desired need for these species because a pond can only support a limited number of these memorable fish.
0
5
10
15
20 #/
L
April July
20
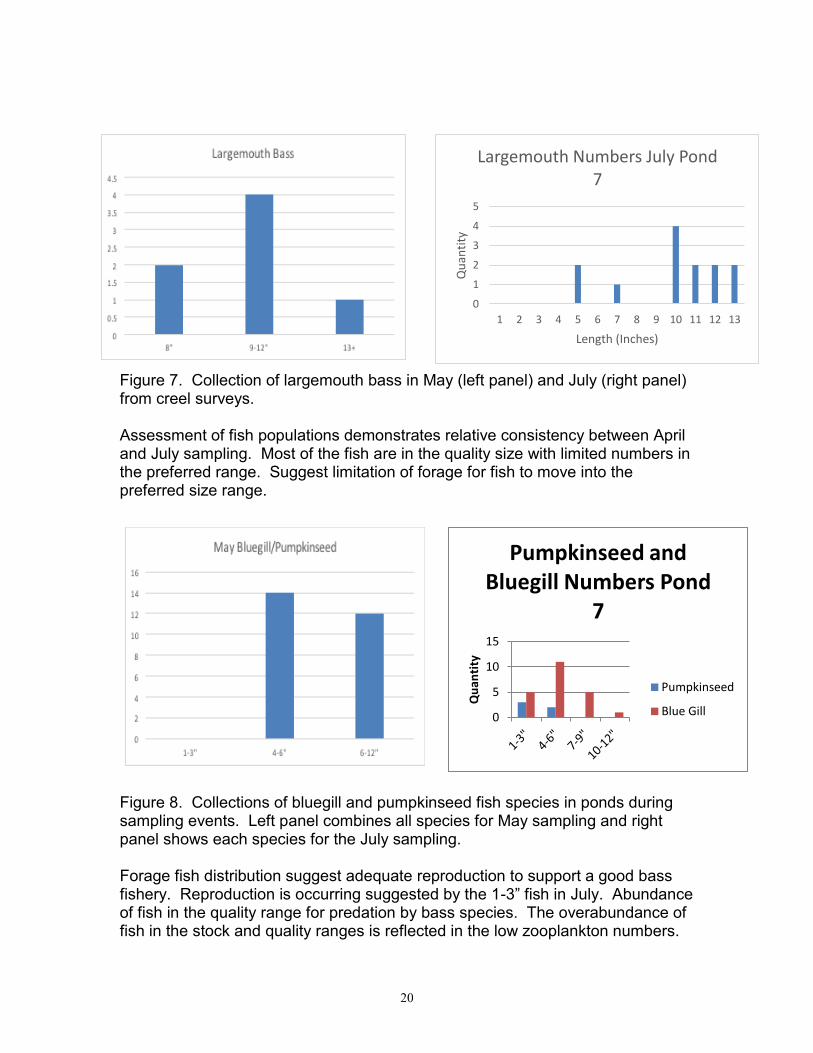
Figure 7. Collection of largemouth bass in May (left panel) and July (right panel) from creel surveys. Assessment of fish populations demonstrates relative consistency between April and July sampling. Most of the fish are in the quality size with limited numbers in the preferred range. Suggest limitation of forage for fish to move into the preferred size range.
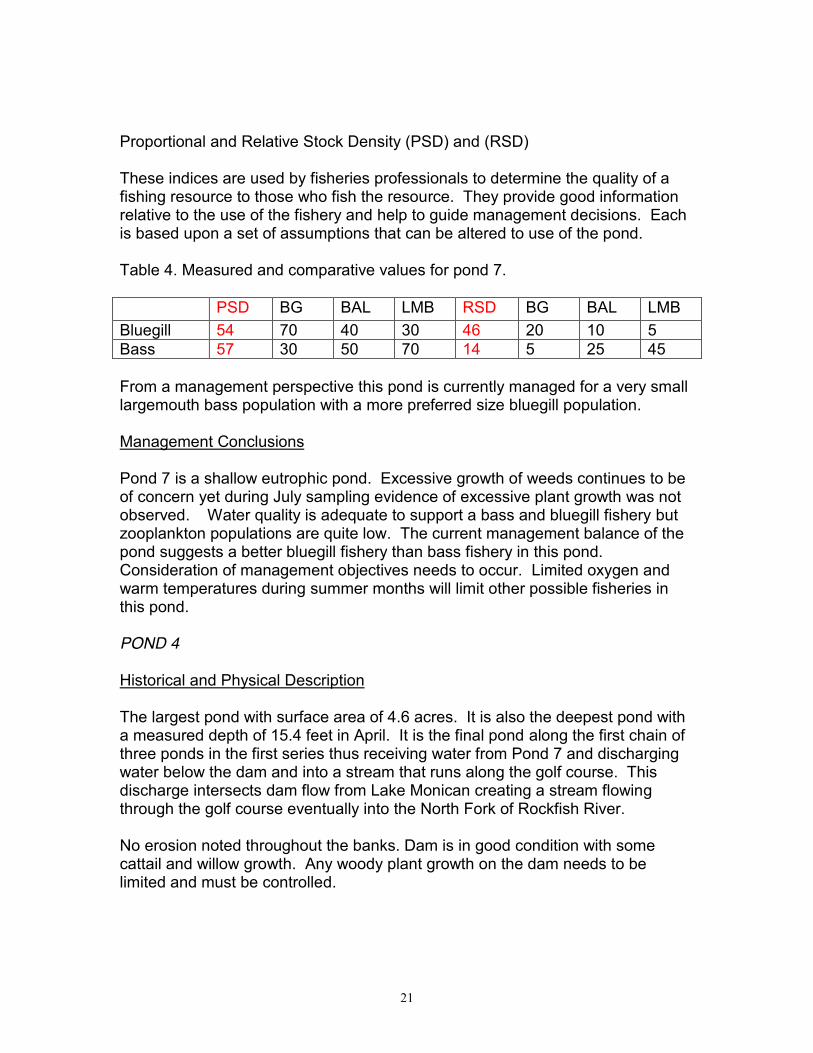
Figure 8. Collections of bluegill and pumpkinseed fish species in ponds during sampling events. Left panel combines all species for May sampling and right panel shows each species for the July sampling. Forage fish distribution suggest adequate reproduction to support a good bass fishery. Reproduction is occurring suggested by the 1-3” fish in July. Abundance of fish in the quality range for predation by bass species. The overabundance of fish in the stock and quality ranges is reflected in the low zooplankton numbers.
0
1
2
3
4
5
1 2 3 4 5 6 7 8 9 10 11 12 13
Qua
ntity
Length (Inches)
Largemouth Numbers July Pond 7
0
5
10
15
Qu
anti
ty
Pumpkinseed and Bluegill Numbers Pond
7
Pumpkinseed
Blue Gill
21
Proportional and Relative Stock Density (PSD) and (RSD) These indices are used by fisheries professionals to determine the quality of a fishing resource to those who fish the resource. They provide good information relative to the use of the fishery and help to guide management decisions. Each is based upon a set of assumptions that can be altered to use of the pond. Table 4. Measured and comparative values for pond 7. PSD BG BAL LMB RSD BG BAL LMB Bluegill 54 70 40 30 46 20 10 5 Bass 57 30 50 70 14 5 25 45 From a management perspective this pond is currently managed for a very small largemouth bass population with a more preferred size bluegill population. Management Conclusions Pond 7 is a shallow eutrophic pond. Excessive growth of weeds continues to be of concern yet during July sampling evidence of excessive plant growth was not observed. Water quality is adequate to support a bass and bluegill fishery but zooplankton populations are quite low. The current management balance of the pond suggests a better bluegill fishery than bass fishery in this pond. Consideration of management objectives needs to occur. Limited oxygen and warm temperatures during summer months will limit other possible fisheries in this pond. POND 4 Historical and Physical Description The largest pond with surface area of 4.6 acres. It is also the deepest pond with a measured depth of 15.4 feet in April. It is the final pond along the first chain of three ponds in the first series thus receiving water from Pond 7 and discharging water below the dam and into a stream that runs along the golf course. This discharge intersects dam flow from Lake Monican creating a stream flowing through the golf course eventually into the North Fork of Rockfish River. No erosion noted throughout the banks. Dam is in good condition with some cattail and willow growth. Any woody plant growth on the dam needs to be limited and must be controlled.
22
Portions of the perimeter of the pond are grassed. One home is located directly along the shoreline of the pond with other homes noted in the forested portion of the pond. GPS coordinates: 375419.7 N 07852o1.2 W Visual observations included extensive salamander populations along the shoreline of the pond. Water is very clear. Water Quality Analysis Pond 4 exhibited a typical temperature profile for a piedmont pond with stratification at 2 meters. This is because of the depth found at this pond. Warm July temperatures close to 30 C at the surface during summer but do become cooler below 2 meters.
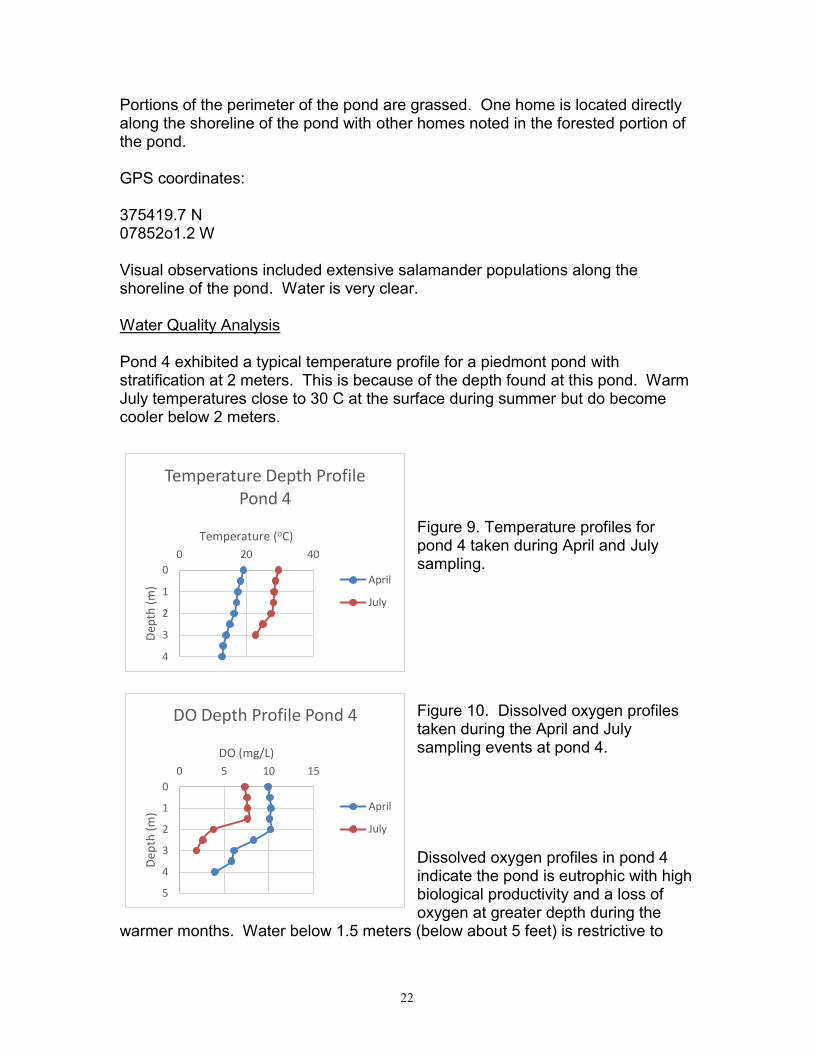
Figure 9. Temperature profiles for pond 4 taken during April and July sampling. Figure 10. Dissolved oxygen profiles taken during the April and July sampling events at pond 4. Dissolved oxygen profiles in pond 4 indicate the pond is eutrophic with high biological productivity and a loss of oxygen at greater depth during the
warmer months. Water below 1.5 meters (below about 5 feet) is restrictive to
0
1
2
3
4
0 20 40
Dept
h (m
)
Temperature (oC)
Temperature Depth Profile Pond 4
April
July
0
1
2
3
4
5
0 5 10 15
Dept
h (m
)
DO (mg/L)
DO Depth Profile Pond 4
April
July
23
biological life. These are cooler waters but contain low oxygen. Interestingly, stratification and loss of oxygen occurred in April and July. Cooler water species of fish typically need 5 mg/l or greater concentrations of oxygen to thrive.
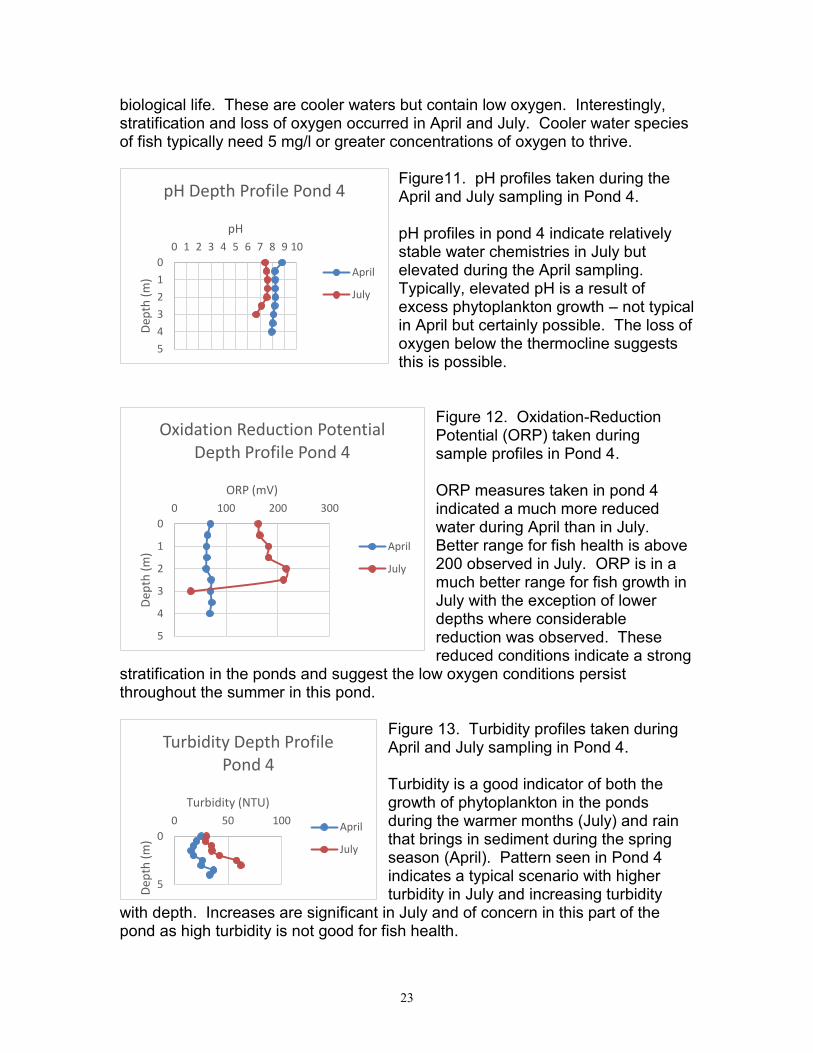
Figure11. pH profiles taken during the April and July sampling in Pond 4. pH profiles in pond 4 indicate relatively stable water chemistries in July but elevated during the April sampling. Typically, elevated pH is a result of excess phytoplankton growth – not typical in April but certainly possible. The loss of oxygen below the thermocline suggests this is possible.
Figure 12. Oxidation-Reduction Potential (ORP) taken during sample profiles in Pond 4. ORP measures taken in pond 4 indicated a much more reduced water during April than in July. Better range for fish health is above 200 observed in July. ORP is in a much better range for fish growth in July with the exception of lower depths where considerable reduction was observed. These reduced conditions indicate a strong
stratification in the ponds and suggest the low oxygen conditions persist throughout the summer in this pond.
Figure 13. Turbidity profiles taken during April and July sampling in Pond 4. Turbidity is a good indicator of both the growth of phytoplankton in the ponds during the warmer months (July) and rain that brings in sediment during the spring season (April). Pattern seen in Pond 4 indicates a typical scenario with higher turbidity in July and increasing turbidity
with depth. Increases are significant in July and of concern in this part of the pond as high turbidity is not good for fish health.
0 1 2 3 4 5
0 1 2 3 4 5 6 7 8 9 10
Dept
h (m
)
pH
pH Depth Profile Pond 4
April
July
0
1
2
3
4
5
0 100 200 300
Dept
h (m
)
ORP (mV)
Oxidation Reduction Potential Depth Profile Pond 4
April
July
0
5
0 50 100
Dept
h (m
)
Turbidity (NTU)
Turbidity Depth Profile Pond 4
April
July
24
Nutrient and Bacterial Analysis Table 5. Measured concentrations of bacteria and nutrients in the pond 4. Total Phosphorus
(mg/L) E. coli (cfu/200ml)
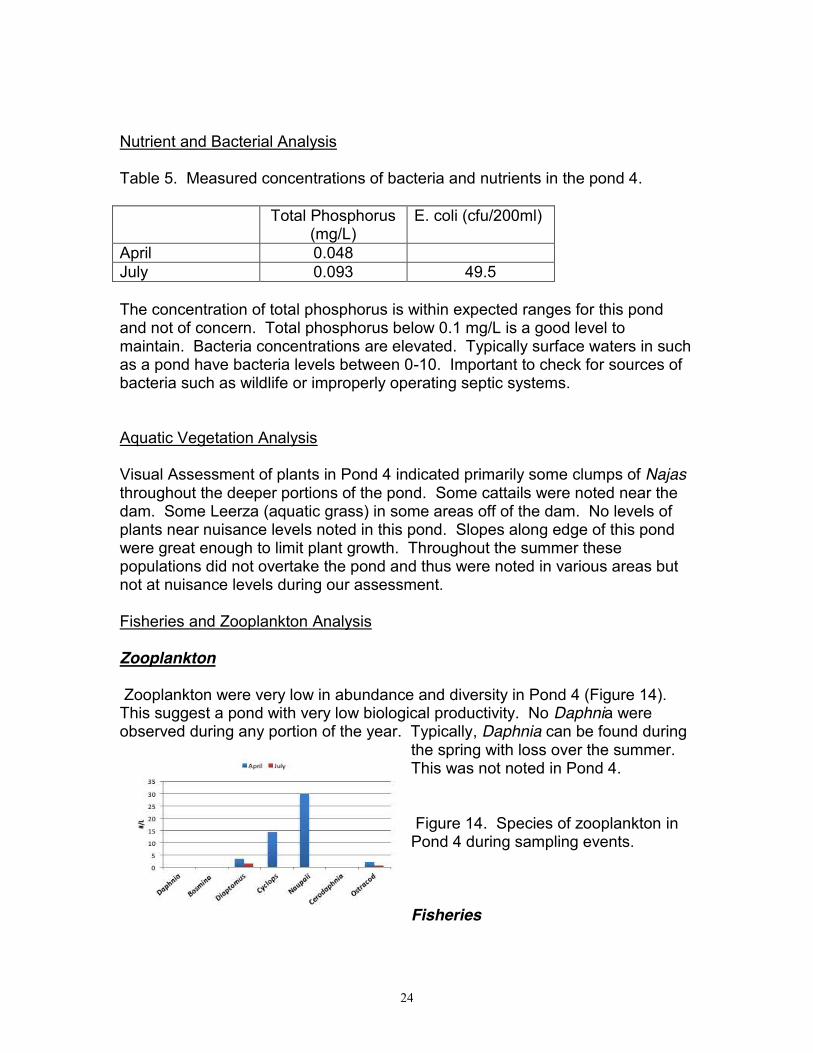
April 0.048 July 0.093 49.5 The concentration of total phosphorus is within expected ranges for this pond and not of concern. Total phosphorus below 0.1 mg/L is a good level to maintain. Bacteria concentrations are elevated. Typically surface waters in such as a pond have bacteria levels between 0-10. Important to check for sources of bacteria such as wildlife or improperly operating septic systems. Aquatic Vegetation Analysis Visual Assessment of plants in Pond 4 indicated primarily some clumps of Najas throughout the deeper portions of the pond. Some cattails were noted near the dam. Some Leerza (aquatic grass) in some areas off of the dam. No levels of plants near nuisance levels noted in this pond. Slopes along edge of this pond were great enough to limit plant growth. Throughout the summer these populations did not overtake the pond and thus were noted in various areas but not at nuisance levels during our assessment. Fisheries and Zooplankton Analysis Zooplankton Zooplankton were very low in abundance and diversity in Pond 4 (Figure 14). This suggest a pond with very low biological productivity. No Daphnia were observed during any portion of the year. Typically, Daphnia can be found during
the spring with loss over the summer. This was not noted in Pond 4. Figure 14. Species of zooplankton in Pond 4 during sampling events. Fisheries
25
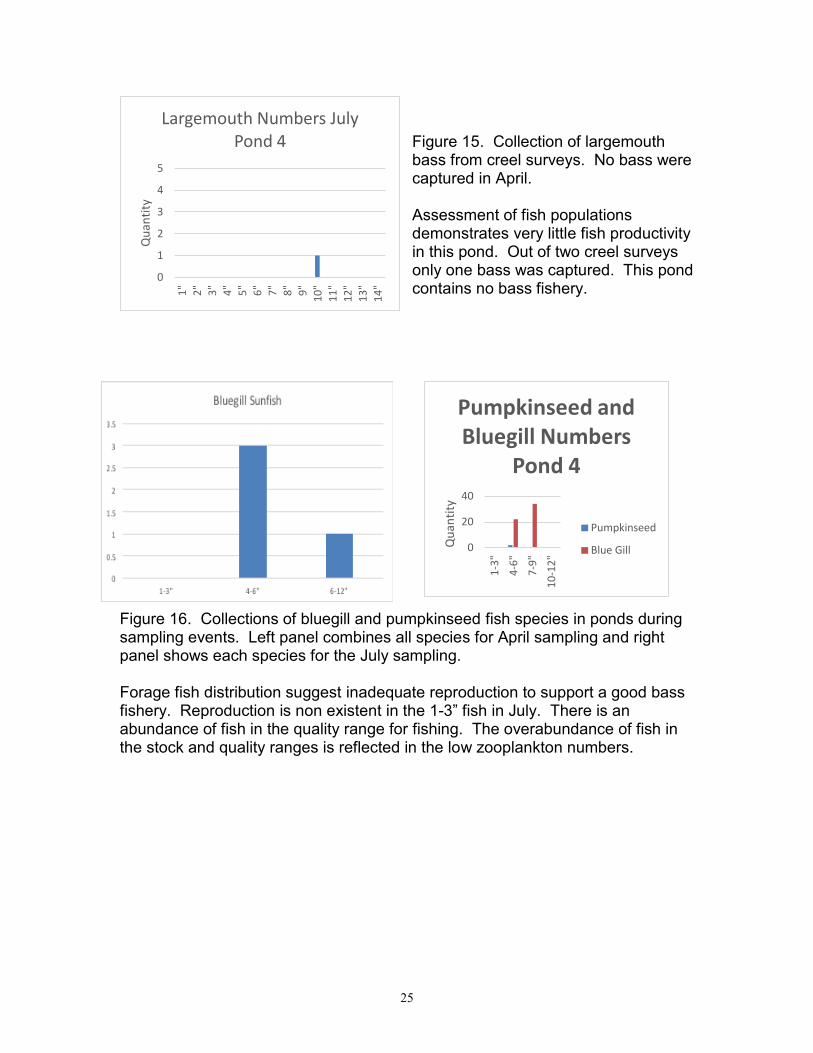
Figure 15. Collection of largemouth bass from creel surveys. No bass were captured in April. Assessment of fish populations demonstrates very little fish productivity in this pond. Out of two creel surveys only one bass was captured. This pond contains no bass fishery.
Figure 16. Collections of bluegill and pumpkinseed fish species in ponds during sampling events. Left panel combines all species for April sampling and right panel shows each species for the July sampling. Forage fish distribution suggest inadequate reproduction to support a good bass fishery. Reproduction is non existent in the 1-3” fish in July. There is an abundance of fish in the quality range for fishing. The overabundance of fish in the stock and quality ranges is reflected in the low zooplankton numbers.
0
1
2
3
4
5 1"
2"
3"
4"
5"
6"
7"
8"
9"
10
" 11
" 12
" 13
" 14
"
Qua
ntity
Largemouth Numbers July Pond 4
0
20
40 1-
3"
4-6"
7-
9"
10-1
2"
Qua
ntity
Pumpkinseed and Bluegill Numbers
Pond 4
Pumpkinseed
Blue Gill
26
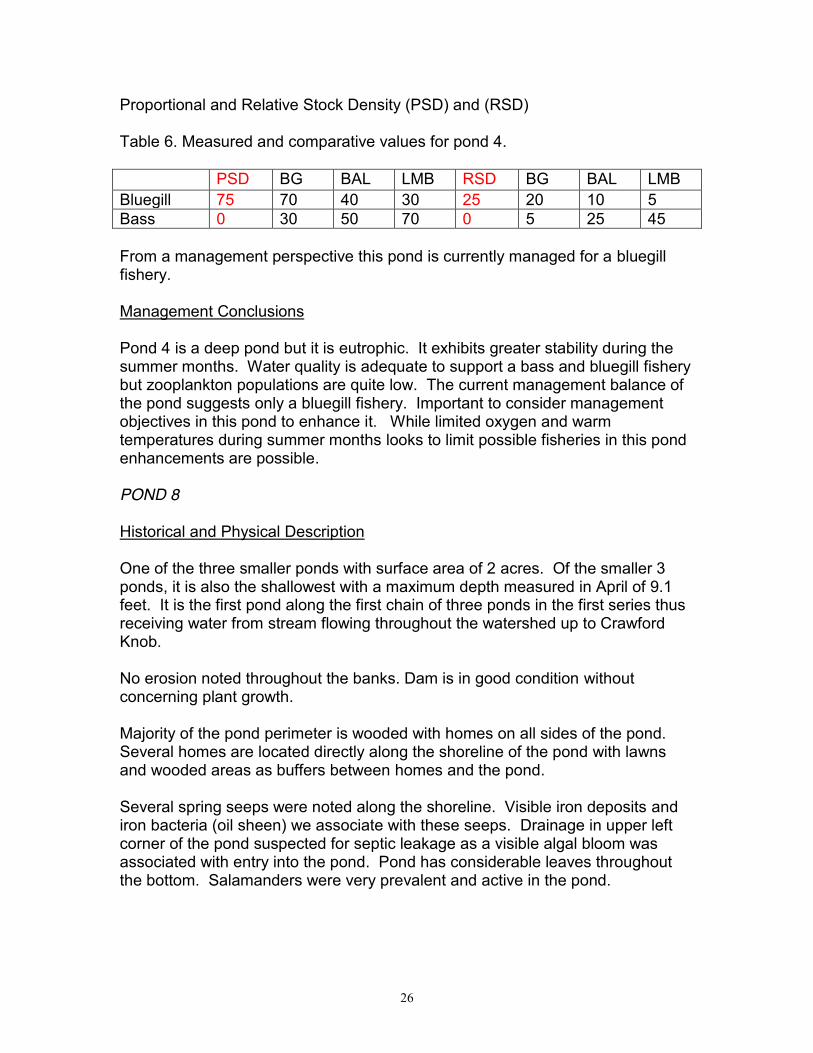
Proportional and Relative Stock Density (PSD) and (RSD) Table 6. Measured and comparative values for pond 4. PSD BG BAL LMB RSD BG BAL LMB Bluegill 75 70 40 30 25 20 10 5 Bass 0 30 50 70 0 5 25 45 From a management perspective this pond is currently managed for a bluegill fishery. Management Conclusions Pond 4 is a deep pond but it is eutrophic. It exhibits greater stability during the summer months. Water quality is adequate to support a bass and bluegill fishery but zooplankton populations are quite low. The current management balance of the pond suggests only a bluegill fishery. Important to consider management objectives in this pond to enhance it. While limited oxygen and warm temperatures during summer months looks to limit possible fisheries in this pond enhancements are possible. POND 8 Historical and Physical Description One of the three smaller ponds with surface area of 2 acres. Of the smaller 3 ponds, it is also the shallowest with a maximum depth measured in April of 9.1 feet. It is the first pond along the first chain of three ponds in the first series thus receiving water from stream flowing throughout the watershed up to Crawford Knob. No erosion noted throughout the banks. Dam is in good condition without concerning plant growth. Majority of the pond perimeter is wooded with homes on all sides of the pond. Several homes are located directly along the shoreline of the pond with lawns and wooded areas as buffers between homes and the pond. Several spring seeps were noted along the shoreline. Visible iron deposits and iron bacteria (oil sheen) we associate with these seeps. Drainage in upper left corner of the pond suspected for septic leakage as a visible algal bloom was associated with entry into the pond. Pond has considerable leaves throughout the bottom. Salamanders were very prevalent and active in the pond.
27
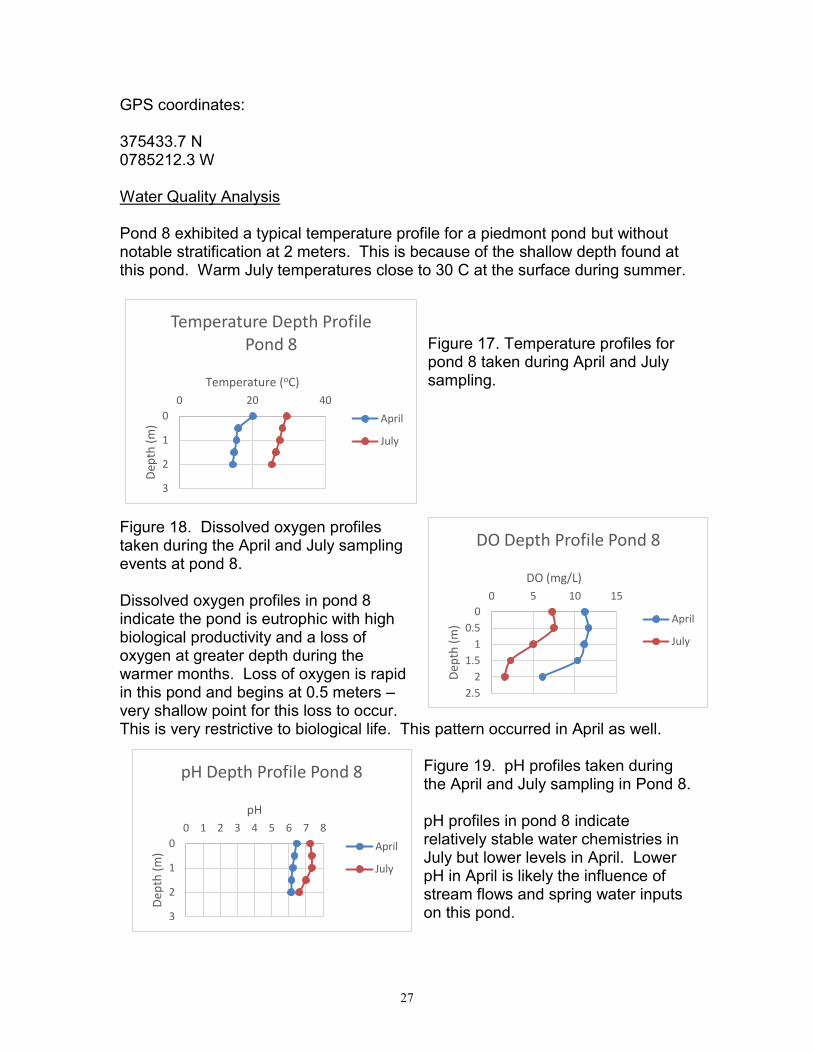
GPS coordinates: 375433.7 N 0785212.3 W Water Quality Analysis Pond 8 exhibited a typical temperature profile for a piedmont pond but without notable stratification at 2 meters. This is because of the shallow depth found at this pond. Warm July temperatures close to 30 C at the surface during summer.
Figure 17. Temperature profiles for pond 8 taken during April and July sampling.
Figure 18. Dissolved oxygen profiles taken during the April and July sampling events at pond 8. Dissolved oxygen profiles in pond 8 indicate the pond is eutrophic with high biological productivity and a loss of oxygen at greater depth during the warmer months. Loss of oxygen is rapid in this pond and begins at 0.5 meters – very shallow point for this loss to occur. This is very restrictive to biological life. This pattern occurred in April as well.
Figure 19. pH profiles taken during the April and July sampling in Pond 8. pH profiles in pond 8 indicate relatively stable water chemistries in July but lower levels in April. Lower pH in April is likely the influence of stream flows and spring water inputs on this pond.
0
1
2
3
0 20 40
Dept
h (m
)
Temperature (oC)
Temperature Depth Profile Pond 8
April
July
0 0.5
1 1.5
2 2.5
0 5 10 15
Dept
h (m
)
DO (mg/L)
DO Depth Profile Pond 8
April
July
0
1
2
3
0 1 2 3 4 5 6 7 8
Dept
h (m
)
pH
pH Depth Profile Pond 8
April
July
28
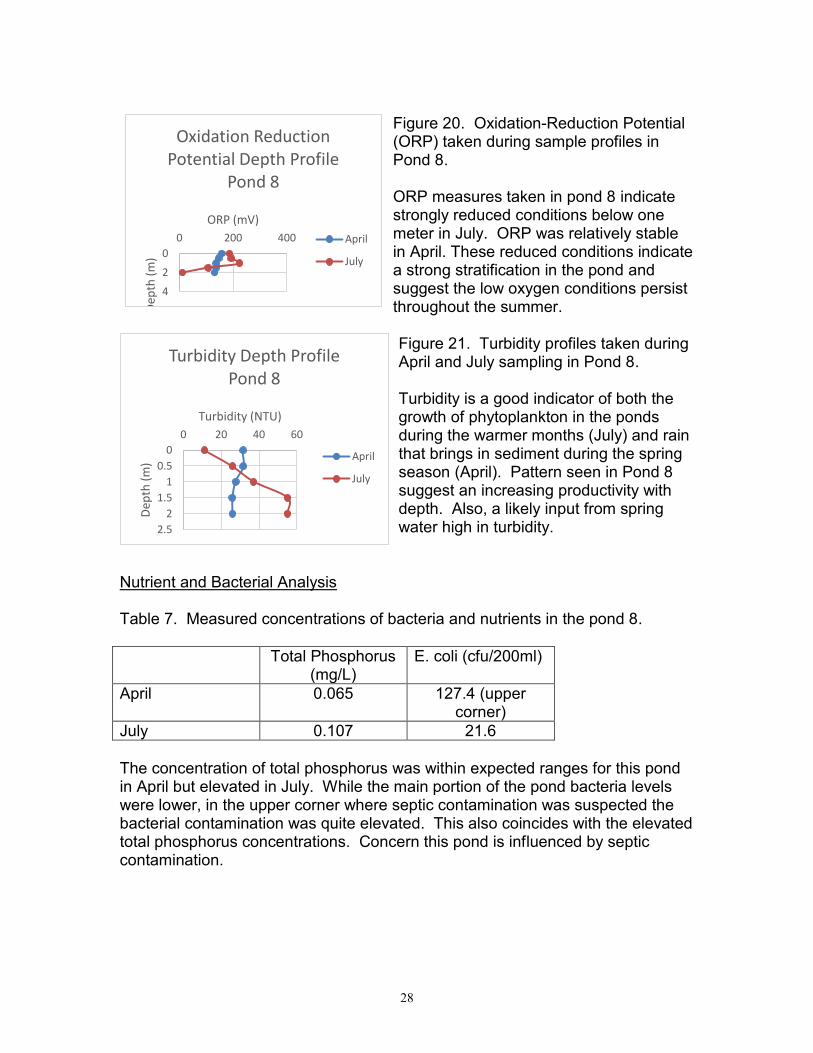
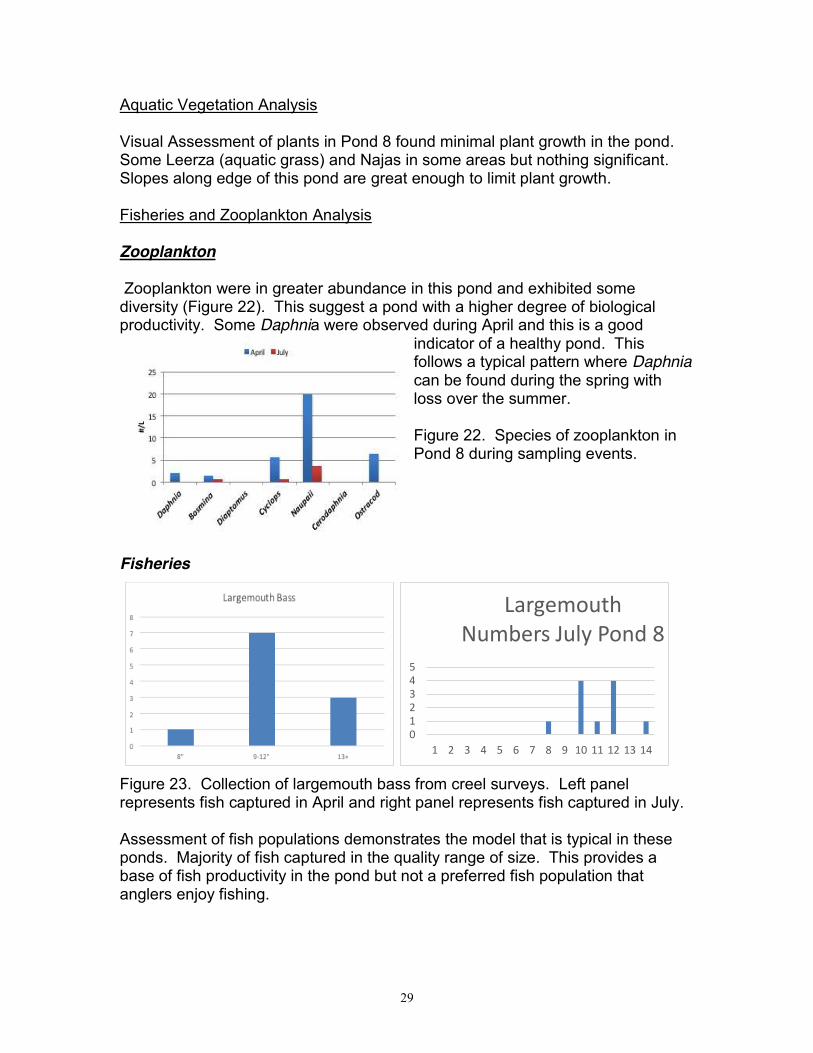
Figure 20. Oxidation-Reduction Potential (ORP) taken during sample profiles in Pond 8. ORP measures taken in pond 8 indicate strongly reduced conditions below one meter in July. ORP was relatively stable in April. These reduced conditions indicate a strong stratification in the pond and suggest the low oxygen conditions persist throughout the summer. Figure 21. Turbidity profiles taken during April and July sampling in Pond 8. Turbidity is a good indicator of both the growth of phytoplankton in the ponds during the warmer months (July) and rain that brings in sediment during the spring season (April). Pattern seen in Pond 8 suggest an increasing productivity with depth. Also, a likely input from spring water high in turbidity.
Nutrient and Bacterial Analysis Table 7. Measured concentrations of bacteria and nutrients in the pond 8. Total Phosphorus
(mg/L) E. coli (cfu/200ml)
April 0.065 127.4 (upper corner)
July 0.107 21.6 The concentration of total phosphorus was within expected ranges for this pond in April but elevated in July. While the main portion of the pond bacteria levels were lower, in the upper corner where septic contamination was suspected the bacterial contamination was quite elevated. This also coincides with the elevated total phosphorus concentrations. Concern this pond is influenced by septic contamination.
0
2
4
0 200 400
Dept
h (m
)
ORP (mV)
Oxidation Reduction Potential Depth Profile
Pond 8
April
July
0 0.5
1 1.5
2 2.5
0 20 40 60
Dept
h (m
)
Turbidity (NTU)
Turbidity Depth Profile Pond 8
April
July
29
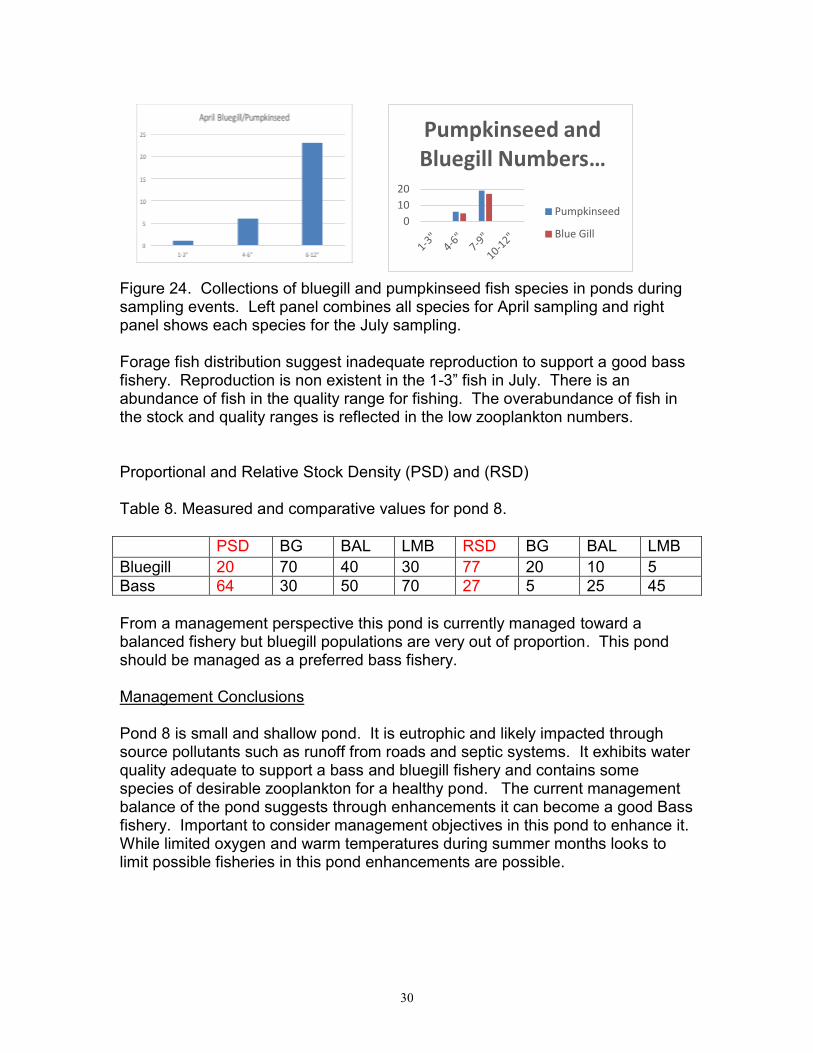
Aquatic Vegetation Analysis Visual Assessment of plants in Pond 8 found minimal plant growth in the pond. Some Leerza (aquatic grass) and Najas in some areas but nothing significant. Slopes along edge of this pond are great enough to limit plant growth. Fisheries and Zooplankton Analysis Zooplankton Zooplankton were in greater abundance in this pond and exhibited some diversity (Figure 22). This suggest a pond with a higher degree of biological productivity. Some Daphnia were observed during April and this is a good
indicator of a healthy pond. This follows a typical pattern where Daphnia can be found during the spring with loss over the summer. Figure 22. Species of zooplankton in Pond 8 during sampling events.
Fisheries
Figure 23. Collection of largemouth bass from creel surveys. Left panel represents fish captured in April and right panel represents fish captured in July. Assessment of fish populations demonstrates the model that is typical in these ponds. Majority of fish captured in the quality range of size. This provides a base of fish productivity in the pond but not a preferred fish population that anglers enjoy fishing.
0 1 2 3 4 5
1 2 3 4 5 6 7 8 9 10 11 12 13 14
Largemouth Numbers July Pond 8
30
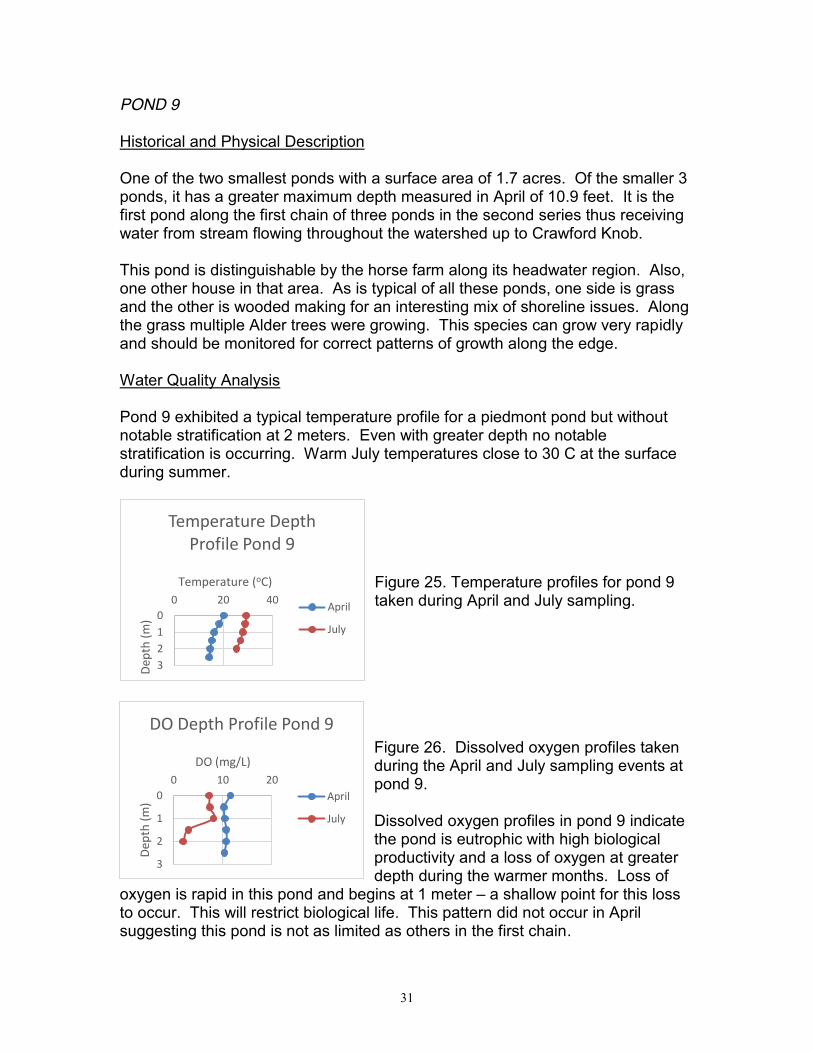
Figure 24. Collections of bluegill and pumpkinseed fish species in ponds during sampling events. Left panel combines all species for April sampling and right panel shows each species for the July sampling. Forage fish distribution suggest inadequate reproduction to support a good bass fishery. Reproduction is non existent in the 1-3” fish in July. There is an abundance of fish in the quality range for fishing. The overabundance of fish in the stock and quality ranges is reflected in the low zooplankton numbers. Proportional and Relative Stock Density (PSD) and (RSD) Table 8. Measured and comparative values for pond 8. PSD BG BAL LMB RSD BG BAL LMB Bluegill 20 70 40 30 77 20 10 5 Bass 64 30 50 70 27 5 25 45 From a management perspective this pond is currently managed toward a balanced fishery but bluegill populations are very out of proportion. This pond should be managed as a preferred bass fishery. Management Conclusions Pond 8 is small and shallow pond. It is eutrophic and likely impacted through source pollutants such as runoff from roads and septic systems. It exhibits water quality adequate to support a bass and bluegill fishery and contains some species of desirable zooplankton for a healthy pond. The current management balance of the pond suggests through enhancements it can become a good Bass fishery. Important to consider management objectives in this pond to enhance it. While limited oxygen and warm temperatures during summer months looks to limit possible fisheries in this pond enhancements are possible.
0 10 20
Pumpkinseed and Bluegill Numbers …
Pumpkinseed
Blue Gill
31
POND 9 Historical and Physical Description One of the two smallest ponds with a surface area of 1.7 acres. Of the smaller 3 ponds, it has a greater maximum depth measured in April of 10.9 feet. It is the first pond along the first chain of three ponds in the second series thus receiving water from stream flowing throughout the watershed up to Crawford Knob. This pond is distinguishable by the horse farm along its headwater region. Also, one other house in that area. As is typical of all these ponds, one side is grass and the other is wooded making for an interesting mix of shoreline issues. Along the grass multiple Alder trees were growing. This species can grow very rapidly and should be monitored for correct patterns of growth along the edge. Water Quality Analysis Pond 9 exhibited a typical temperature profile for a piedmont pond but without notable stratification at 2 meters. Even with greater depth no notable stratification is occurring. Warm July temperatures close to 30 C at the surface during summer.
Figure 25. Temperature profiles for pond 9 taken during April and July sampling.
Figure 26. Dissolved oxygen profiles taken during the April and July sampling events at pond 9. Dissolved oxygen profiles in pond 9 indicate the pond is eutrophic with high biological productivity and a loss of oxygen at greater depth during the warmer months. Loss of
oxygen is rapid in this pond and begins at 1 meter – a shallow point for this loss to occur. This will restrict biological life. This pattern did not occur in April suggesting this pond is not as limited as others in the first chain.
0 1 2 3
0 20 40
Dept
h (m
)
Temperature (oC)
Temperature Depth Profile Pond 9
April
July
0
1
2
3
0 10 20
Dept
h (m
)
DO (mg/L)
DO Depth Profile Pond 9
April
July
32
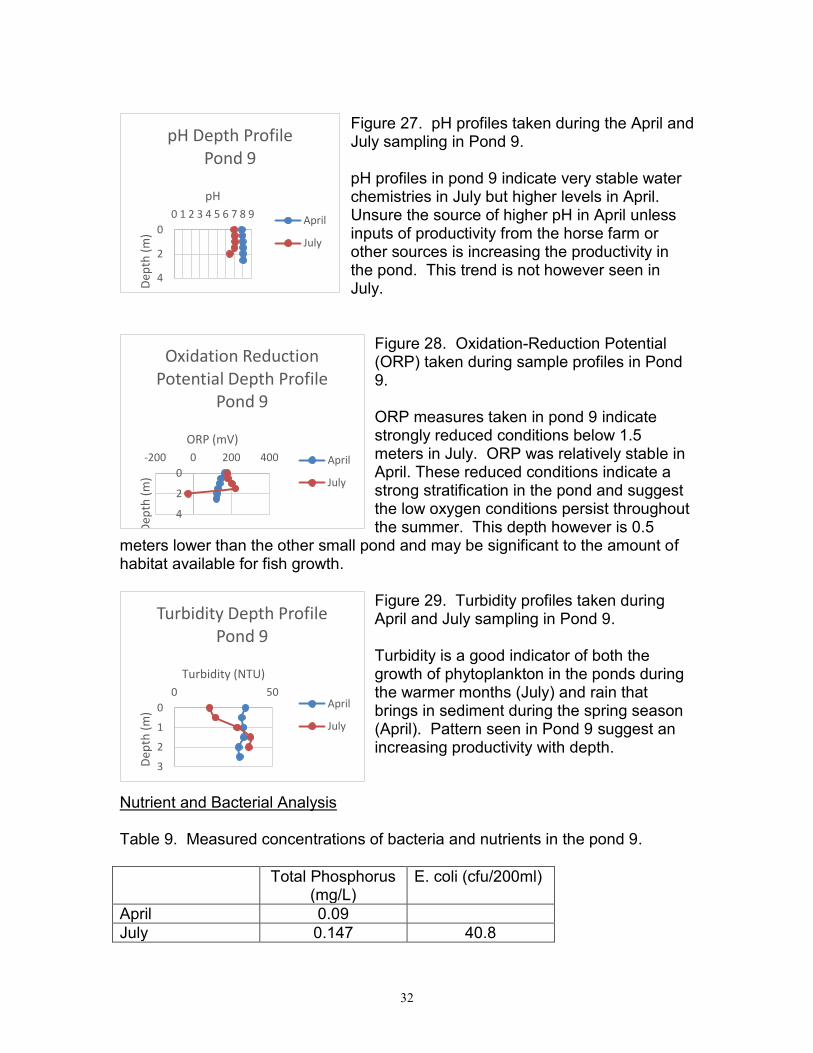
Figure 27. pH profiles taken during the April and July sampling in Pond 9. pH profiles in pond 9 indicate very stable water chemistries in July but higher levels in April. Unsure the source of higher pH in April unless inputs of productivity from the horse farm or other sources is increasing the productivity in the pond. This trend is not however seen in July.
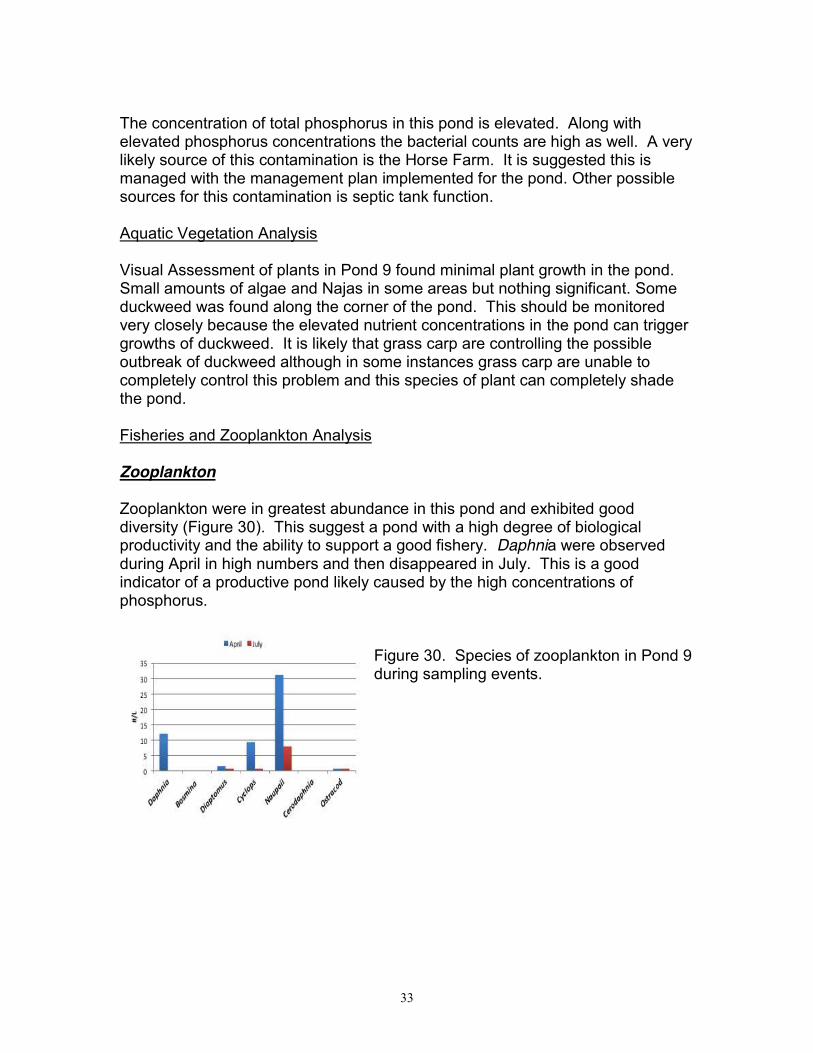
Figure 28. Oxidation-Reduction Potential (ORP) taken during sample profiles in Pond 9. ORP measures taken in pond 9 indicate strongly reduced conditions below 1.5 meters in July. ORP was relatively stable in April. These reduced conditions indicate a strong stratification in the pond and suggest the low oxygen conditions persist throughout the summer. This depth however is 0.5
meters lower than the other small pond and may be significant to the amount of habitat available for fish growth.
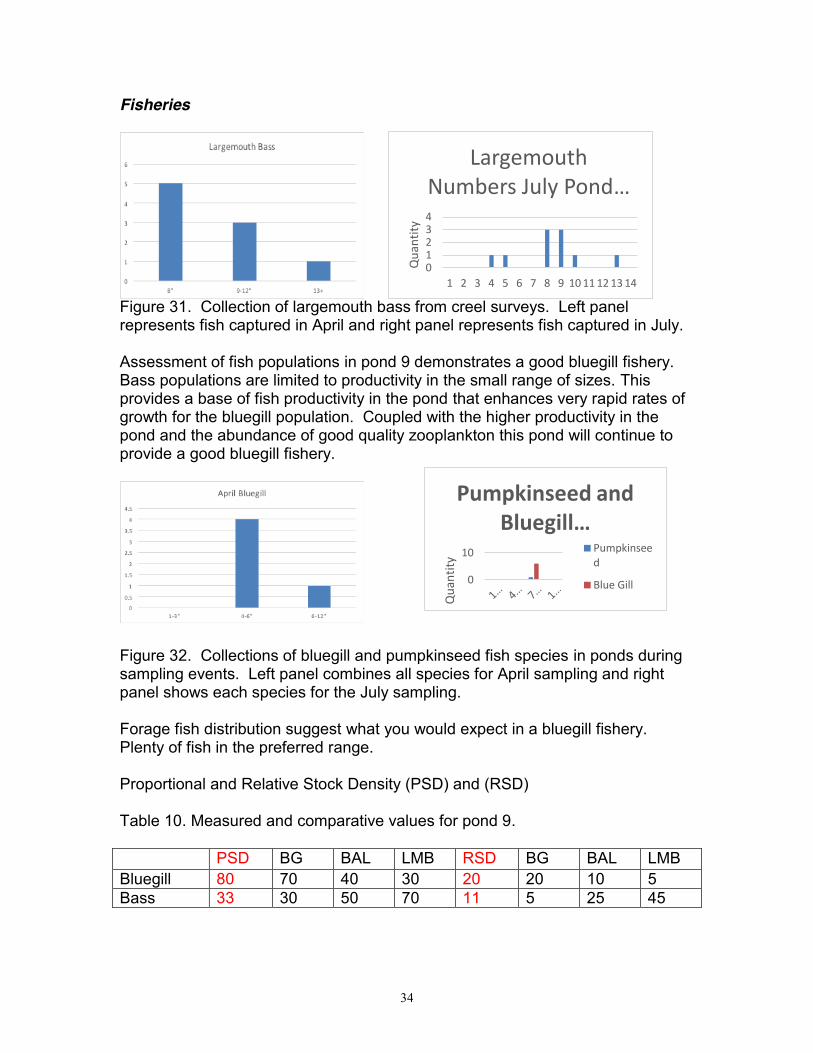
Figure 29. Turbidity profiles taken during April and July sampling in Pond 9. Turbidity is a good indicator of both the growth of phytoplankton in the ponds during the warmer months (July) and rain that brings in sediment during the spring season (April). Pattern seen in Pond 9 suggest an increasing productivity with depth.
Nutrient and Bacterial Analysis Table 9. Measured concentrations of bacteria and nutrients in the pond 9. Total Phosphorus
(mg/L) E. coli (cfu/200ml)
April 0.09 July 0.147 40.8
0
2
4
0 1 2 3 4 5 6 7 8 9
Dept
h (m
)
pH
pH Depth Profile Pond 9
April
July
0
2
4
-200 0 200 400
Dept
h (m
)
ORP (mV)
Oxidation Reduction Potential Depth Profile
Pond 9
April
July
0
1
2
3
0 50
Dept
h (m
)
Turbidity (NTU)
Turbidity Depth Profile Pond 9
April
July
33
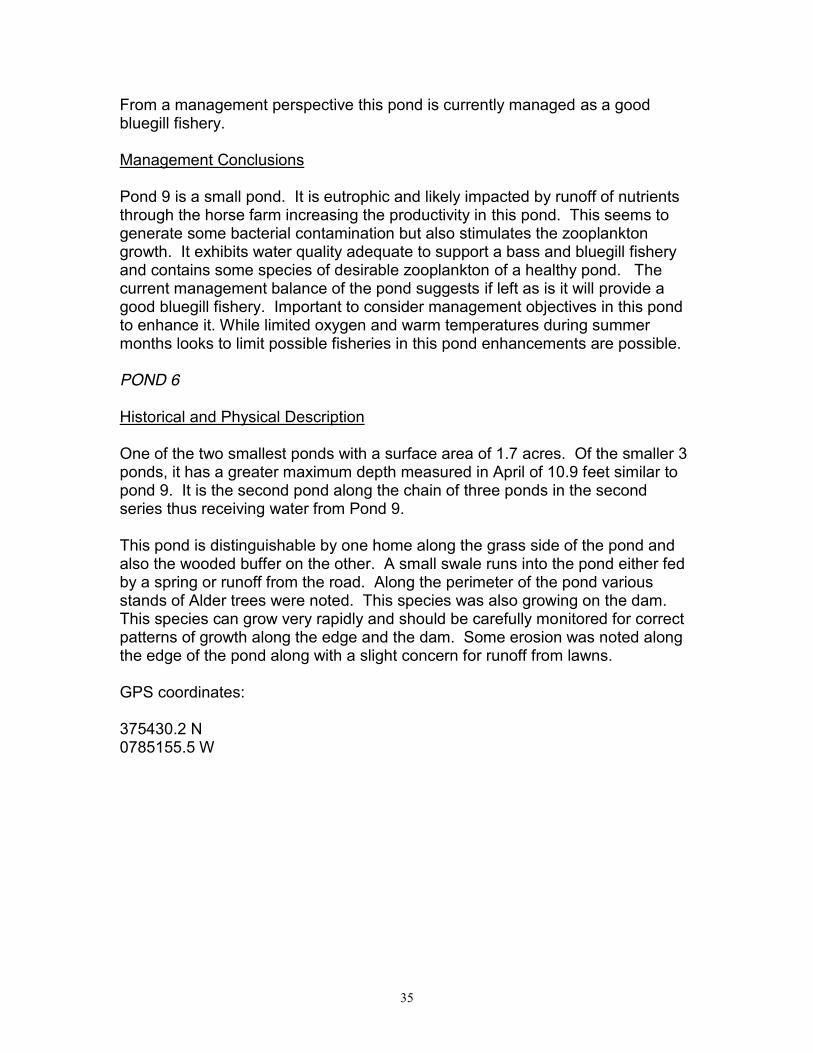
The concentration of total phosphorus in this pond is elevated. Along with elevated phosphorus concentrations the bacterial counts are high as well. A very likely source of this contamination is the Horse Farm. It is suggested this is managed with the management plan implemented for the pond. Other possible sources for this contamination is septic tank function. Aquatic Vegetation Analysis Visual Assessment of plants in Pond 9 found minimal plant growth in the pond. Small amounts of algae and Najas in some areas but nothing significant. Some duckweed was found along the corner of the pond. This should be monitored very closely because the elevated nutrient concentrations in the pond can trigger growths of duckweed. It is likely that grass carp are controlling the possible outbreak of duckweed although in some instances grass carp are unable to completely control this problem and this species of plant can completely shade the pond. Fisheries and Zooplankton Analysis Zooplankton Zooplankton were in greatest abundance in this pond and exhibited good diversity (Figure 30). This suggest a pond with a high degree of biological productivity and the ability to support a good fishery. Daphnia were observed during April in high numbers and then disappeared in July. This is a good indicator of a productive pond likely caused by the high concentrations of phosphorus.
Figure 30. Species of zooplankton in Pond 9 during sampling events.
34
Fisheries
Figure 31. Collection of largemouth bass from creel surveys. Left panel represents fish captured in April and right panel represents fish captured in July. Assessment of fish populations in pond 9 demonstrates a good bluegill fishery. Bass populations are limited to productivity in the small range of sizes. This provides a base of fish productivity in the pond that enhances very rapid rates of growth for the bluegill population. Coupled with the higher productivity in the pond and the abundance of good quality zooplankton this pond will continue to provide a good bluegill fishery.
Figure 32. Collections of bluegill and pumpkinseed fish species in ponds during sampling events. Left panel combines all species for April sampling and right panel shows each species for the July sampling. Forage fish distribution suggest what you would expect in a bluegill fishery. Plenty of fish in the preferred range. Proportional and Relative Stock Density (PSD) and (RSD) Table 10. Measured and comparative values for pond 9. PSD BG BAL LMB RSD BG BAL LMB Bluegill 80 70 40 30 20 20 10 5 Bass 33 30 50 70 11 5 25 45
0 1 2 3 4
1 2 3 4 5 6 7 8 9 10 11 12 13 14
Qua
ntity
Largemouth Numbers July Pond …
0
10
Qua
ntity
Pumpkinseed and Bluegill …
Pumpkinseed
Blue Gill
35
From a management perspective this pond is currently managed as a good bluegill fishery. Management Conclusions Pond 9 is a small pond. It is eutrophic and likely impacted by runoff of nutrients through the horse farm increasing the productivity in this pond. This seems to generate some bacterial contamination but also stimulates the zooplankton growth. It exhibits water quality adequate to support a bass and bluegill fishery and contains some species of desirable zooplankton of a healthy pond. The current management balance of the pond suggests if left as is it will provide a good bluegill fishery. Important to consider management objectives in this pond to enhance it. While limited oxygen and warm temperatures during summer months looks to limit possible fisheries in this pond enhancements are possible. POND 6 Historical and Physical Description One of the two smallest ponds with a surface area of 1.7 acres. Of the smaller 3 ponds, it has a greater maximum depth measured in April of 10.9 feet similar to pond 9. It is the second pond along the chain of three ponds in the second series thus receiving water from Pond 9. This pond is distinguishable by one home along the grass side of the pond and also the wooded buffer on the other. A small swale runs into the pond either fed by a spring or runoff from the road. Along the perimeter of the pond various stands of Alder trees were noted. This species was also growing on the dam. This species can grow very rapidly and should be carefully monitored for correct patterns of growth along the edge and the dam. Some erosion was noted along the edge of the pond along with a slight concern for runoff from lawns. GPS coordinates: 375430.2 N 0785155.5 W
36
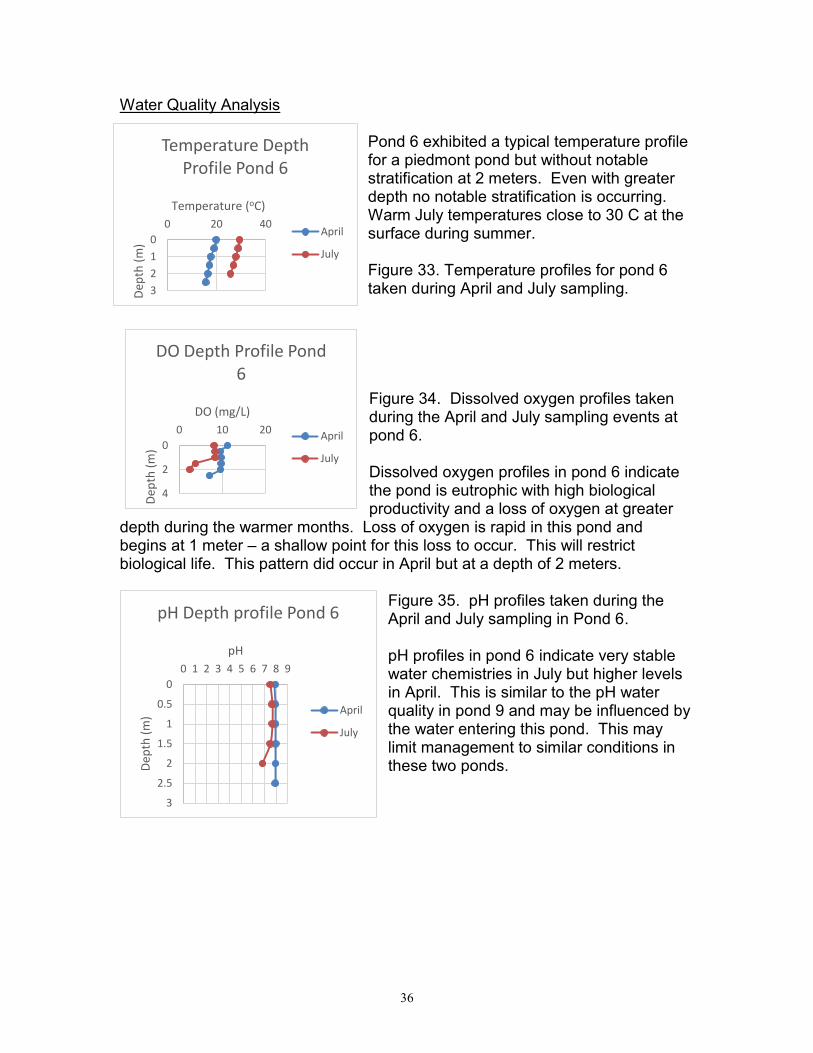
Water Quality Analysis Pond 6 exhibited a typical temperature profile for a piedmont pond but without notable stratification at 2 meters. Even with greater depth no notable stratification is occurring. Warm July temperatures close to 30 C at the surface during summer. Figure 33. Temperature profiles for pond 6 taken during April and July sampling. Figure 34. Dissolved oxygen profiles taken during the April and July sampling events at pond 6. Dissolved oxygen profiles in pond 6 indicate the pond is eutrophic with high biological productivity and a loss of oxygen at greater
depth during the warmer months. Loss of oxygen is rapid in this pond and begins at 1 meter – a shallow point for this loss to occur. This will restrict biological life. This pattern did occur in April but at a depth of 2 meters.
Figure 35. pH profiles taken during the April and July sampling in Pond 6. pH profiles in pond 6 indicate very stable water chemistries in July but higher levels in April. This is similar to the pH water quality in pond 9 and may be influenced by the water entering this pond. This may limit management to similar conditions in these two ponds.
0 1 2 3
0 20 40
Dept
h (m
)
Temperature (oC)
Temperature Depth Profile Pond 6
April
July
0
2
4
0 10 20
Dept
h (m
)
DO (mg/L)
DO Depth Profile Pond 6
April
July
0
0.5
1
1.5
2
2.5
3
0 1 2 3 4 5 6 7 8 9
Dept
h (m
)
pH
pH Depth profile Pond 6
April
July
37
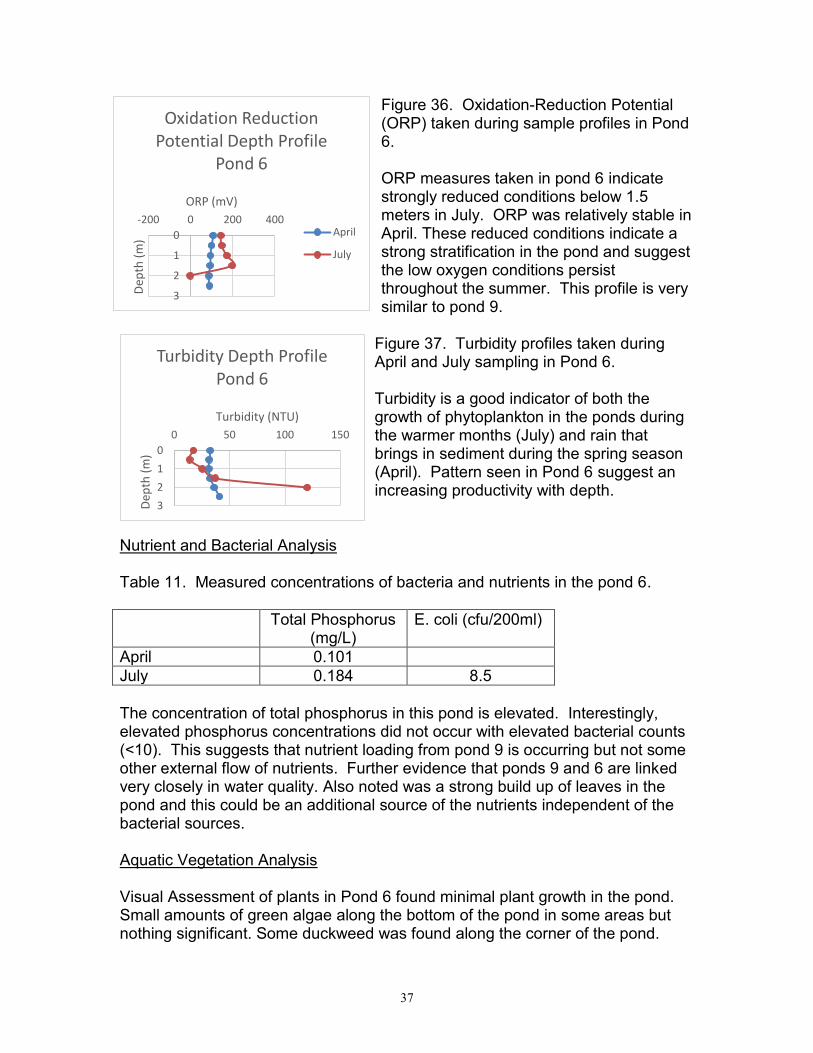
Figure 36. Oxidation-Reduction Potential (ORP) taken during sample profiles in Pond 6. ORP measures taken in pond 6 indicate strongly reduced conditions below 1.5 meters in July. ORP was relatively stable in April. These reduced conditions indicate a strong stratification in the pond and suggest the low oxygen conditions persist throughout the summer. This profile is very similar to pond 9.
Figure 37. Turbidity profiles taken during April and July sampling in Pond 6. Turbidity is a good indicator of both the growth of phytoplankton in the ponds during the warmer months (July) and rain that brings in sediment during the spring season (April). Pattern seen in Pond 6 suggest an increasing productivity with depth.
Nutrient and Bacterial Analysis Table 11. Measured concentrations of bacteria and nutrients in the pond 6. Total Phosphorus
(mg/L) E. coli (cfu/200ml)
April 0.101 July 0.184 8.5 The concentration of total phosphorus in this pond is elevated. Interestingly, elevated phosphorus concentrations did not occur with elevated bacterial counts (<10). This suggests that nutrient loading from pond 9 is occurring but not some other external flow of nutrients. Further evidence that ponds 9 and 6 are linked very closely in water quality. Also noted was a strong build up of leaves in the pond and this could be an additional source of the nutrients independent of the bacterial sources. Aquatic Vegetation Analysis Visual Assessment of plants in Pond 6 found minimal plant growth in the pond. Small amounts of green algae along the bottom of the pond in some areas but nothing significant. Some duckweed was found along the corner of the pond.
0
1
2
3
-200 0 200 400
Dept
h (m
)
ORP (mV)
Oxidation Reduction Potential Depth Profile
Pond 6
April
July
0 1 2 3
0 50 100 150
Dept
h (m
)
Turbidity (NTU)
Turbidity Depth Profile Pond 6
38
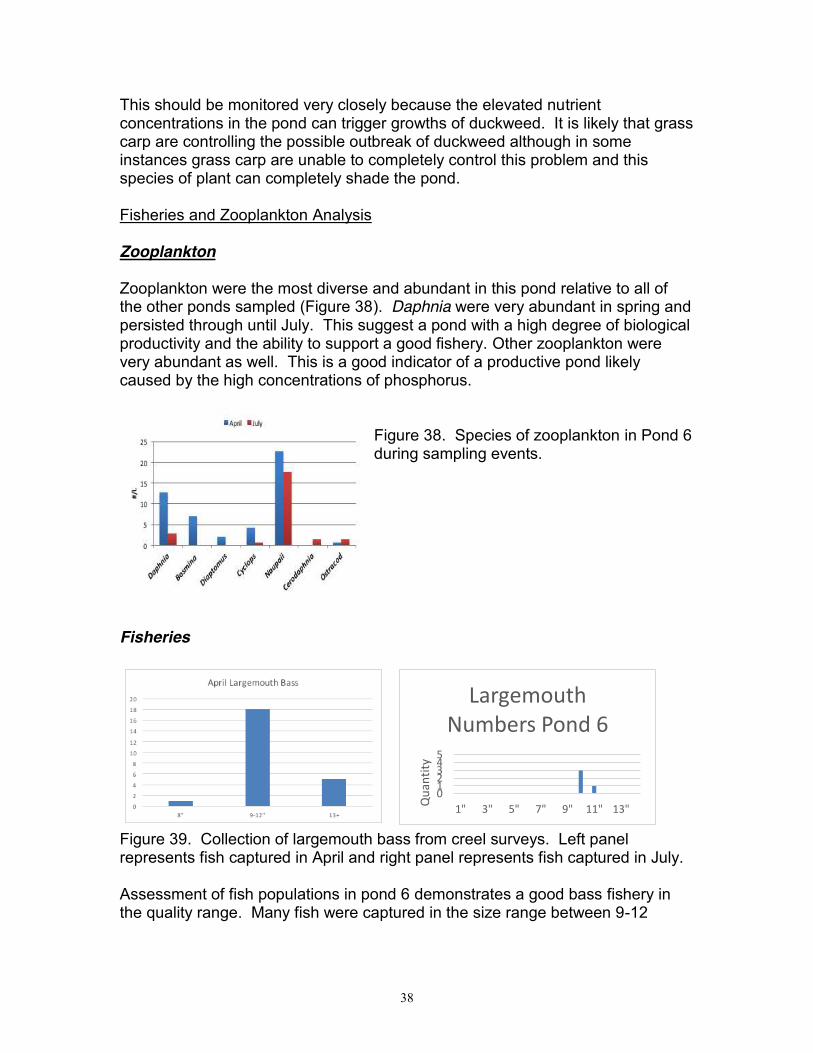
This should be monitored very closely because the elevated nutrient concentrations in the pond can trigger growths of duckweed. It is likely that grass carp are controlling the possible outbreak of duckweed although in some instances grass carp are unable to completely control this problem and this species of plant can completely shade the pond. Fisheries and Zooplankton Analysis Zooplankton Zooplankton were the most diverse and abundant in this pond relative to all of the other ponds sampled (Figure 38). Daphnia were very abundant in spring and persisted through until July. This suggest a pond with a high degree of biological productivity and the ability to support a good fishery. Other zooplankton were very abundant as well. This is a good indicator of a productive pond likely caused by the high concentrations of phosphorus.
Figure 38. Species of zooplankton in Pond 6 during sampling events.
Fisheries
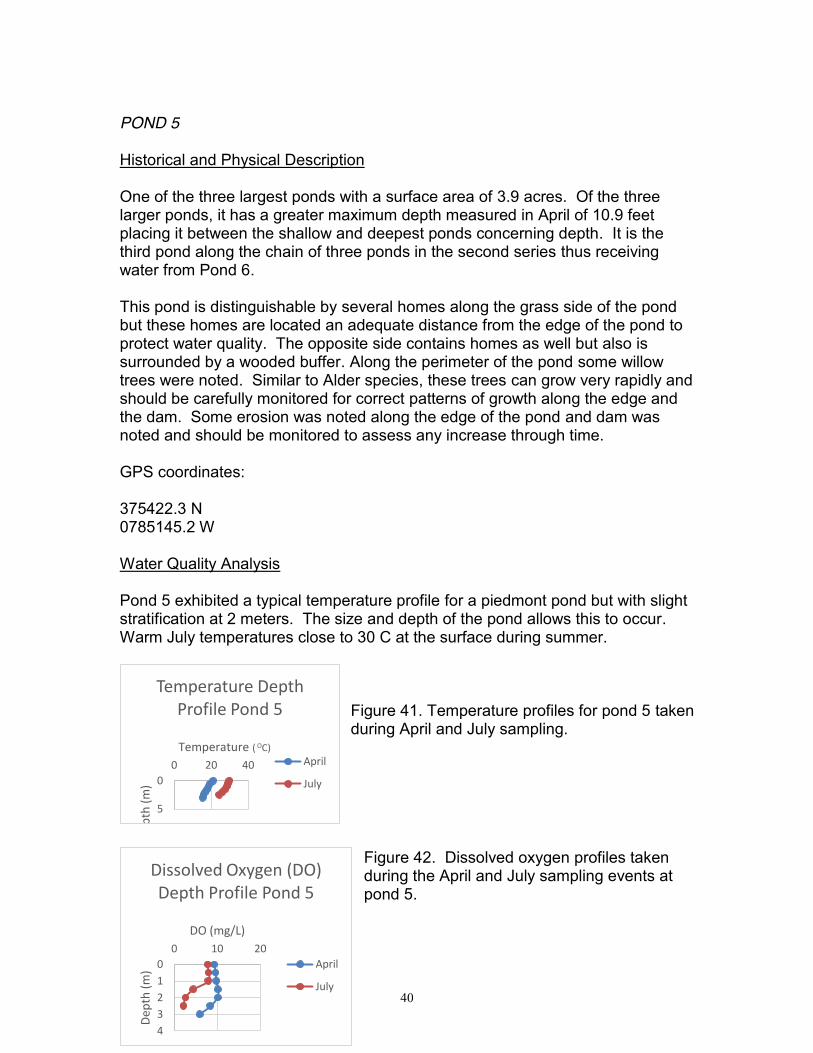
Figure 39. Collection of largemouth bass from creel surveys. Left panel represents fish captured in April and right panel represents fish captured in July. Assessment of fish populations in pond 6 demonstrates a good bass fishery in the quality range. Many fish were captured in the size range between 9-12
0 1 2 3 4 5
1" 3" 5" 7" 9" 11" 13" Qua
ntity
Largemouth Numbers Pond 6

39
inches. A fishery of this size can support more numbers of fish than a preferred fishery but of a smaller size that fish anglers may not desire.
Figure 40. Collections of bluegill and pumpkinseed fish species in ponds during sampling events. Left panel combines all species for April sampling and right panel shows each species for the July sampling. Forage fish distribution suggest what you would expect to support a good bass fishery. Bluegill reproduction is evident in the 1-3 inch range. There is not an overabundance of large bluegill providing a good forage base for these fish. Plenty of fish in the preferred range for bass to consume. Proportional and Relative Stock Density (PSD) and (RSD) Table 12. Measured and comparative values for pond 6. PSD BG BAL LMB RSD BG BAL LMB Bluegill 45 70 40 30 45 20 10 5 Bass 75 30 50 70 21 5 25 45 From a management perspective this pond is currently managed as an excellent quality bass fishery. Numbers reflect a very good fishery for bass within the quality range. As a preferred fishery it is out of balance. The bluegill population is more reflective of a bluegill fishery – too large. Some changes in management to this pond can shift the current fishery to a preferred range. Management Conclusions Pond 6 is one of three small ponds. It is eutrophic and likely impacted by nutrients supplied through the horse farm impacting pond 9. Also, leaves and other runoff from the road may increase the productivity of this pond. It has the highest levels of phosphorus and lowest bacteria counts of any pond measured. Zooplankton populations are very good in this pond and able to support a good fishery. The current management balance of the pond suggests if left as is it will continue to provide a good bass fishery in the quality range. Management changes can be made to move it into the preferred range as well.
0 1 2 3 4 5
1-3"
4-6"
7-9"
10-…
Qua
ntity
Pumpkinseed and Bluegill Numbers …
Pumpkinseed
Blue Gill
40
POND 5 Historical and Physical Description One of the three largest ponds with a surface area of 3.9 acres. Of the three larger ponds, it has a greater maximum depth measured in April of 10.9 feet placing it between the shallow and deepest ponds concerning depth. It is the third pond along the chain of three ponds in the second series thus receiving water from Pond 6. This pond is distinguishable by several homes along the grass side of the pond but these homes are located an adequate distance from the edge of the pond to protect water quality. The opposite side contains homes as well but also is surrounded by a wooded buffer. Along the perimeter of the pond some willow trees were noted. Similar to Alder species, these trees can grow very rapidly and should be carefully monitored for correct patterns of growth along the edge and the dam. Some erosion was noted along the edge of the pond and dam was noted and should be monitored to assess any increase through time. GPS coordinates: 375422.3 N 0785145.2 W Water Quality Analysis Pond 5 exhibited a typical temperature profile for a piedmont pond but with slight stratification at 2 meters. The size and depth of the pond allows this to occur. Warm July temperatures close to 30 C at the surface during summer.
Figure 41. Temperature profiles for pond 5 taken during April and July sampling.
Figure 42. Dissolved oxygen profiles taken during the April and July sampling events at pond 5.
0
5
0 20 40
Dept
h (m
)
Temperature ( OC)
Temperature Depth Profile Pond 5
April
July
0 1 2 3 4
0 10 20
Dept
h (m
)
DO (mg/L)
Dissolved Oxygen (DO) Depth Profile Pond 5
April
July
41
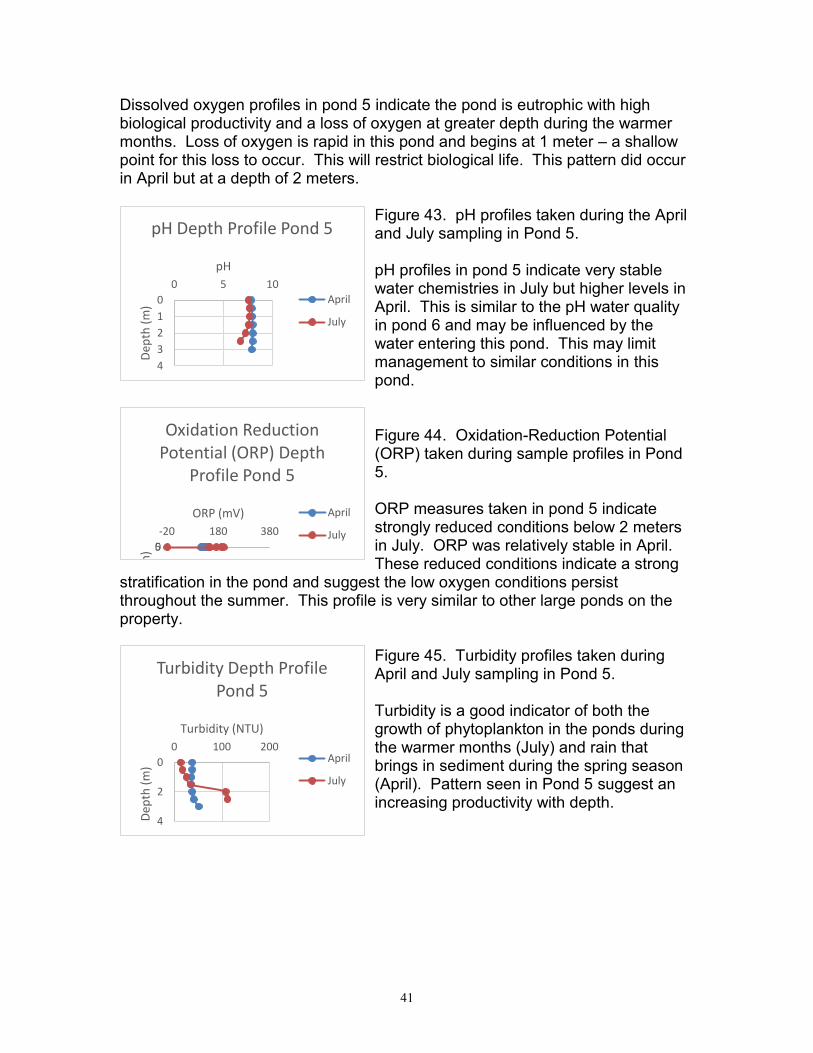
Dissolved oxygen profiles in pond 5 indicate the pond is eutrophic with high biological productivity and a loss of oxygen at greater depth during the warmer months. Loss of oxygen is rapid in this pond and begins at 1 meter – a shallow point for this loss to occur. This will restrict biological life. This pattern did occur in April but at a depth of 2 meters.
Figure 43. pH profiles taken during the April and July sampling in Pond 5. pH profiles in pond 5 indicate very stable water chemistries in July but higher levels in April. This is similar to the pH water quality in pond 6 and may be influenced by the water entering this pond. This may limit management to similar conditions in this pond.
Figure 44. Oxidation-Reduction Potential (ORP) taken during sample profiles in Pond 5. ORP measures taken in pond 5 indicate strongly reduced conditions below 2 meters in July. ORP was relatively stable in April. These reduced conditions indicate a strong
stratification in the pond and suggest the low oxygen conditions persist throughout the summer. This profile is very similar to other large ponds on the property.
Figure 45. Turbidity profiles taken during April and July sampling in Pond 5. Turbidity is a good indicator of both the growth of phytoplankton in the ponds during the warmer months (July) and rain that brings in sediment during the spring season (April). Pattern seen in Pond 5 suggest an increasing productivity with depth.
0 1 2 3 4
0 5 10
Dept
h (m
)
pH
pH Depth Profile Pond 5
April
July
0 5 -20 180 380
Dept
h (m
)
ORP (mV)
Oxidation Reduction Potential (ORP) Depth
Profile Pond 5
April
July
0
2
4
0 100 200
Dept
h (m
)
Turbidity (NTU)
Turbidity Depth Profile Pond 5
April
July
42
Nutrient and Bacterial Analysis Table 13. Measured concentrations of bacteria and nutrients in the pond 6. Total Phosphorus
(mg/L) E. coli (cfu/200ml)
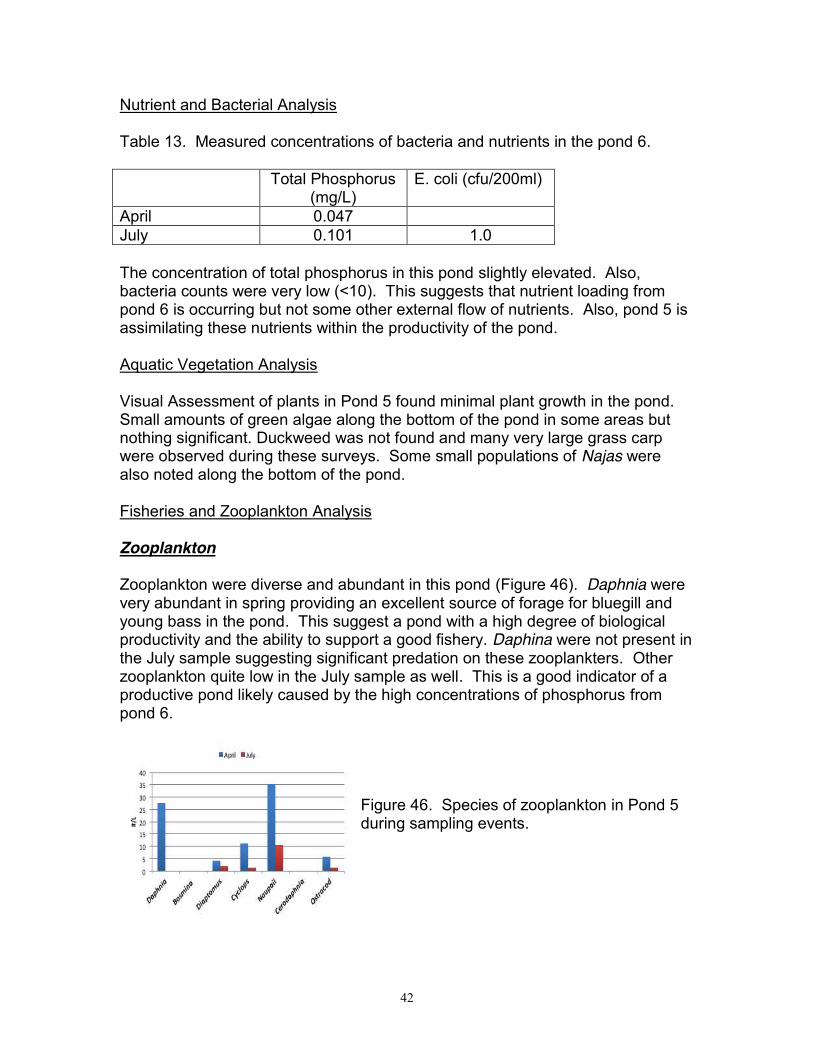
April 0.047 July 0.101 1.0 The concentration of total phosphorus in this pond slightly elevated. Also, bacteria counts were very low (<10). This suggests that nutrient loading from pond 6 is occurring but not some other external flow of nutrients. Also, pond 5 is assimilating these nutrients within the productivity of the pond. Aquatic Vegetation Analysis Visual Assessment of plants in Pond 5 found minimal plant growth in the pond. Small amounts of green algae along the bottom of the pond in some areas but nothing significant. Duckweed was not found and many very large grass carp were observed during these surveys. Some small populations of Najas were also noted along the bottom of the pond. Fisheries and Zooplankton Analysis Zooplankton Zooplankton were diverse and abundant in this pond (Figure 46). Daphnia were very abundant in spring providing an excellent source of forage for bluegill and young bass in the pond. This suggest a pond with a high degree of biological productivity and the ability to support a good fishery. Daphina were not present in the July sample suggesting significant predation on these zooplankters. Other zooplankton quite low in the July sample as well. This is a good indicator of a productive pond likely caused by the high concentrations of phosphorus from pond 6.
Figure 46. Species of zooplankton in Pond 5 during sampling events.
43
Fisheries
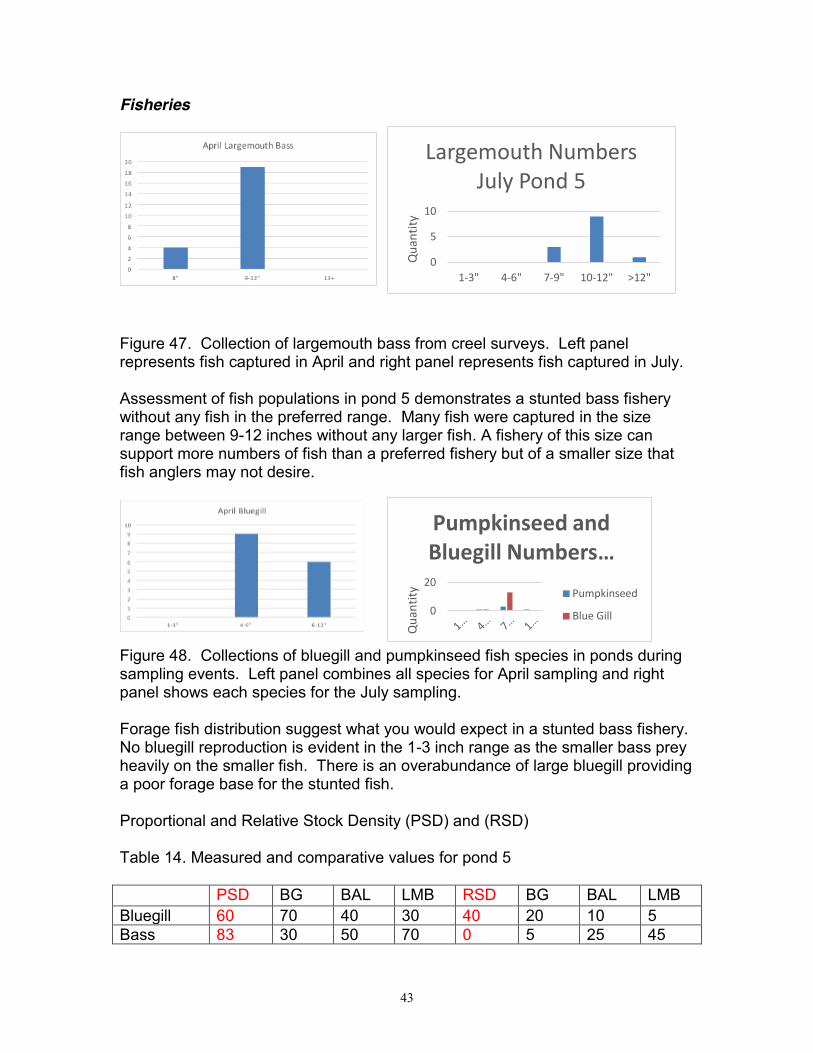
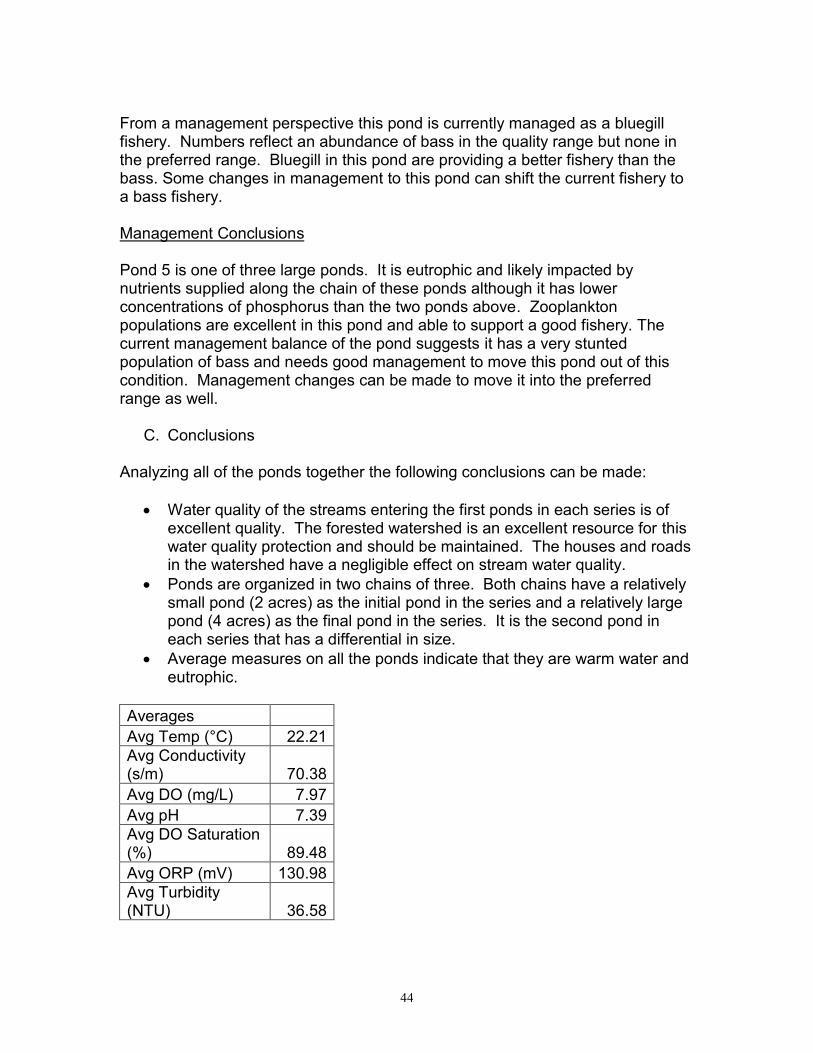
Figure 47. Collection of largemouth bass from creel surveys. Left panel represents fish captured in April and right panel represents fish captured in July. Assessment of fish populations in pond 5 demonstrates a stunted bass fishery without any fish in the preferred range. Many fish were captured in the size range between 9-12 inches without any larger fish. A fishery of this size can support more numbers of fish than a preferred fishery but of a smaller size that fish anglers may not desire.
Figure 48. Collections of bluegill and pumpkinseed fish species in ponds during sampling events. Left panel combines all species for April sampling and right panel shows each species for the July sampling. Forage fish distribution suggest what you would expect in a stunted bass fishery. No bluegill reproduction is evident in the 1-3 inch range as the smaller bass prey heavily on the smaller fish. There is an overabundance of large bluegill providing a poor forage base for the stunted fish. Proportional and Relative Stock Density (PSD) and (RSD) Table 14. Measured and comparative values for pond 5 PSD BG BAL LMB RSD BG BAL LMB Bluegill 60 70 40 30 40 20 10 5 Bass 83 30 50 70 0 5 25 45
0
5
10
1-3" 4-6" 7-9" 10-12" >12"
Qua
ntity
Largemouth Numbers July Pond 5
0
20
Qua
ntity
Pumpkinseed and Bluegill Numbers …
Pumpkinseed
Blue Gill
44
From a management perspective this pond is currently managed as a bluegill fishery. Numbers reflect an abundance of bass in the quality range but none in the preferred range. Bluegill in this pond are providing a better fishery than the bass. Some changes in management to this pond can shift the current fishery to a bass fishery. Management Conclusions Pond 5 is one of three large ponds. It is eutrophic and likely impacted by nutrients supplied along the chain of these ponds although it has lower concentrations of phosphorus than the two ponds above. Zooplankton populations are excellent in this pond and able to support a good fishery. The current management balance of the pond suggests it has a very stunted population of bass and needs good management to move this pond out of this condition. Management changes can be made to move it into the preferred range as well.
C. Conclusions Analyzing all of the ponds together the following conclusions can be made:
x Water quality of the streams entering the first ponds in each series is of excellent quality. The forested watershed is an excellent resource for this water quality protection and should be maintained. The houses and roads in the watershed have a negligible effect on stream water quality.
x Ponds are organized in two chains of three. Both chains have a relatively small pond (2 acres) as the initial pond in the series and a relatively large pond (4 acres) as the final pond in the series. It is the second pond in each series that has a differential in size.
x Average measures on all the ponds indicate that they are warm water and eutrophic.
Averages Avg Temp (°C) 22.21 Avg Conductivity (s/m) 70.38 Avg DO (mg/L) 7.97 Avg pH 7.39 Avg DO Saturation (%) 89.48 Avg ORP (mV) 130.98 Avg Turbidity (NTU) 36.58
45
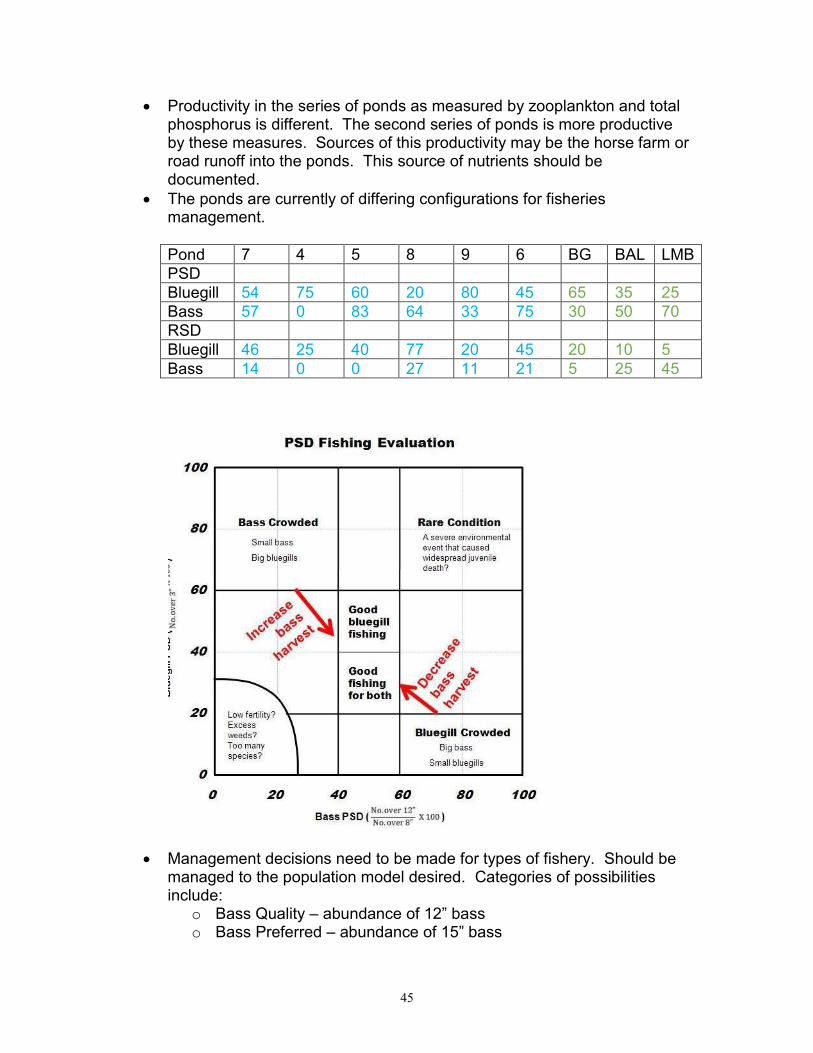
x Productivity in the series of ponds as measured by zooplankton and total phosphorus is different. The second series of ponds is more productive by these measures. Sources of this productivity may be the horse farm or road runoff into the ponds. This source of nutrients should be documented.
x The ponds are currently of differing configurations for fisheries management. Pond 7 4 5 8 9 6 BG BAL LMB PSD Bluegill 54 75 60 20 80 45 65 35 25 Bass 57 0 83 64 33 75 30 50 70 RSD Bluegill 46 25 40 77 20 45 20 10 5 Bass 14 0 0 27 11 21 5 25 45
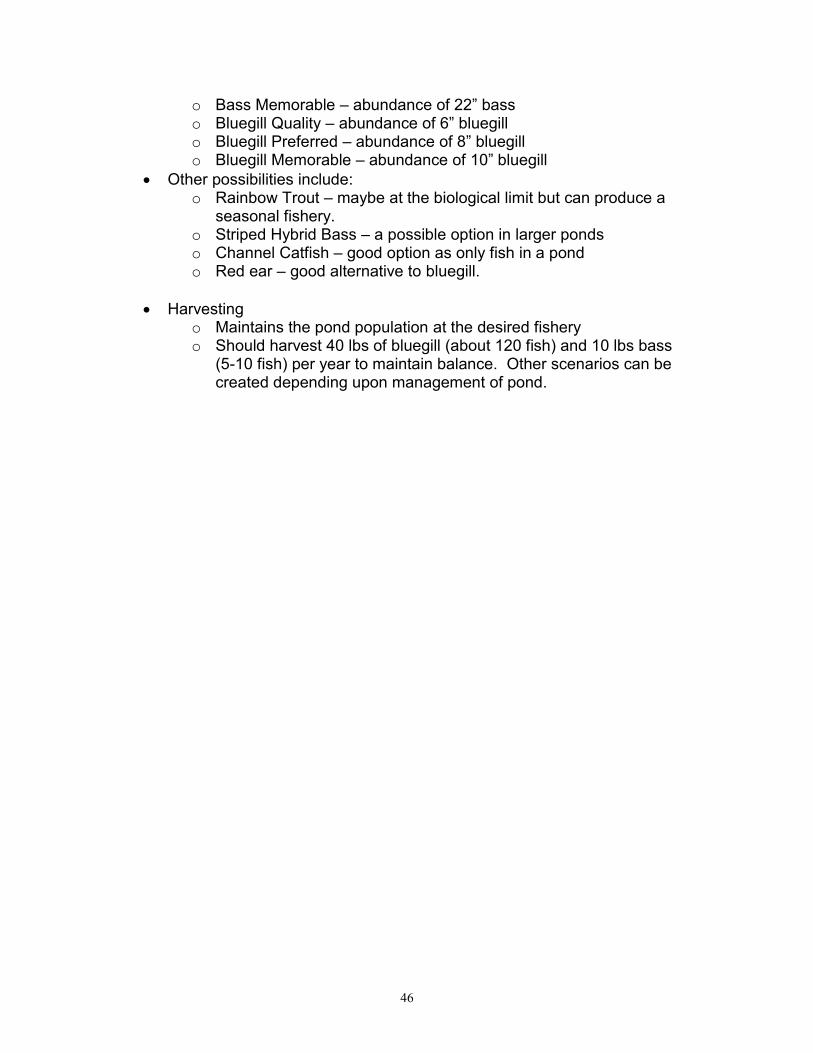
x Management decisions need to be made for types of fishery. Should be managed to the population model desired. Categories of possibilities include:
o Bass Quality – abundance of 12” bass o Bass Preferred – abundance of 15” bass
46
o Bass Memorable – abundance of 22” bass o Bluegill Quality – abundance of 6” bluegill o Bluegill Preferred – abundance of 8” bluegill o Bluegill Memorable – abundance of 10” bluegill
x Other possibilities include: o Rainbow Trout – maybe at the biological limit but can produce a
seasonal fishery. o Striped Hybrid Bass – a possible option in larger ponds o Channel Catfish – good option as only fish in a pond o Red ear – good alternative to bluegill.
x Harvesting
o Maintains the pond population at the desired fishery o Should harvest 40 lbs of bluegill (about 120 fish) and 10 lbs bass
(5-10 fish) per year to maintain balance. Other scenarios can be created depending upon management of pond.
47
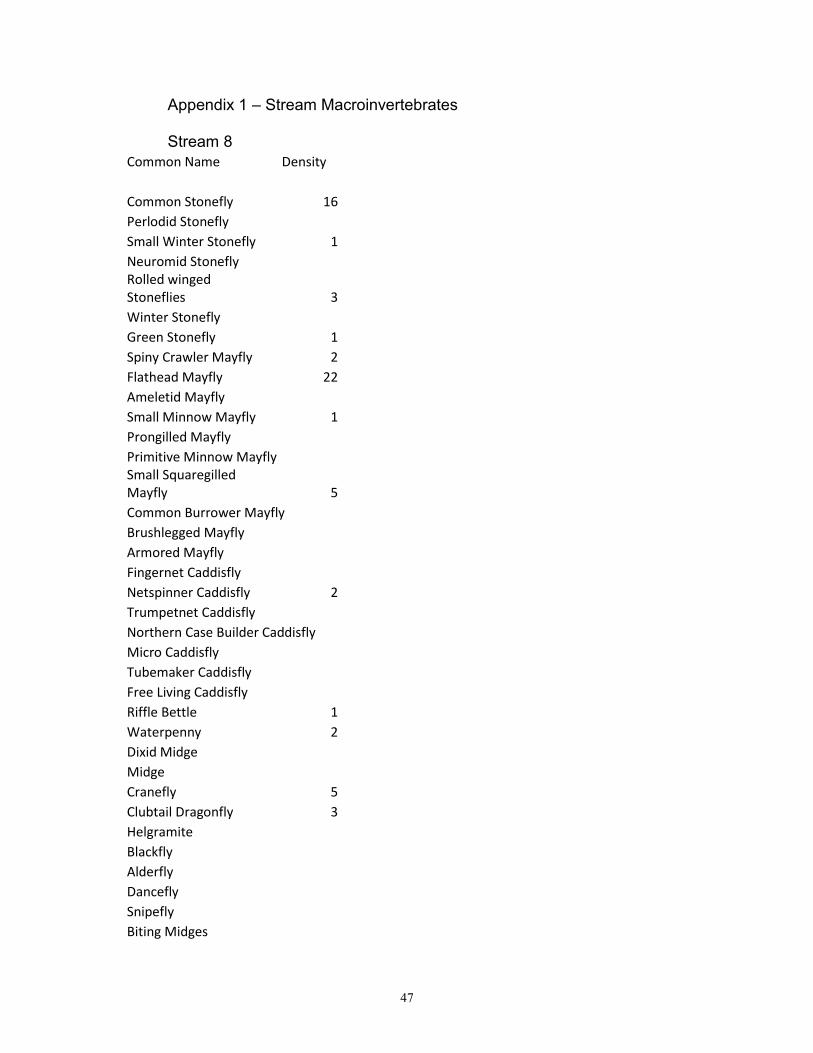
Appendix 1 – Stream Macroinvertebrates Stream 8
Common Name Density
Common Stonefly 16 Perlodid Stonefly
Small Winter Stonefly 1 Neuromid Stonefly
Rolled winged Stoneflies 3 Winter Stonefly
Green Stonefly 1 Spiny Crawler Mayfly 2 Flathead Mayfly 22 Ameletid Mayfly
Small Minnow Mayfly 1 Prongilled Mayfly
Primitive Minnow Mayfly Small Squaregilled Mayfly 5 Common Burrower Mayfly Brushlegged Mayfly Armored Mayfly
Fingernet Caddisfly Netspinner Caddisfly 2 Trumpetnet Caddisfly Northern Case Builder Caddisfly Micro Caddisfly
Tubemaker Caddisfly Free Living Caddisfly Riffle Bettle 1 Waterpenny 2 Dixid Midge
Midge Cranefly 5
Clubtail Dragonfly 3 Helgramite
Blackfly Alderfly Dancefly Snipefly Biting Midges
48
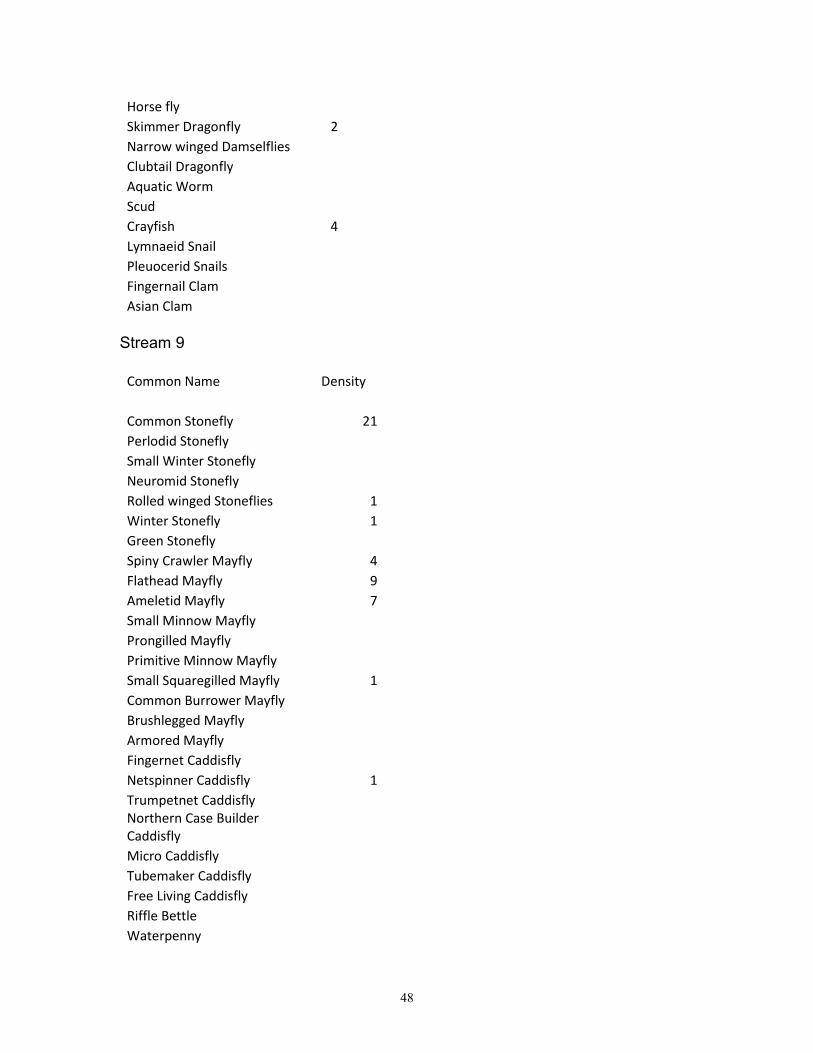
Horse fly Skimmer Dragonfly 2
Narrow winged Damselflies Clubtail Dragonfly
Aquatic Worm Scud Crayfish 4
Lymnaeid Snail Pleuocerid Snails Fingernail Clam Asian Clam
Stream 9
Common Name Density
Common Stonefly 21 Perlodid Stonefly
Small Winter Stonefly Neuromid Stonefly Rolled winged Stoneflies 1
Winter Stonefly 1 Green Stonefly
Spiny Crawler Mayfly 4 Flathead Mayfly 9 Ameletid Mayfly 7 Small Minnow Mayfly
Prongilled Mayfly Primitive Minnow Mayfly Small Squaregilled Mayfly 1
Common Burrower Mayfly Brushlegged Mayfly Armored Mayfly Fingernet Caddisfly Netspinner Caddisfly 1
Trumpetnet Caddisfly Northern Case Builder
Caddisfly Micro Caddisfly Tubemaker Caddisfly Free Living Caddisfly Riffle Bettle Waterpenny
49
Dixid Midge Midge Cranefly 5
Clubtail Dragonfly Helgramite 2
Blackfly Alderfly Dancefly Snipefly Biting Midges Horse fly Skimmer Dragonfly Narrow winged Damselflies Clubtail Dragonfly Aquatic Worm 1
Scud Crayfish 5
Lymnaeid Snail Pleuocerid Snails Fingernail Clam Asian Clam