winter mortality of okhotsk sea pink salmon in the ocean mortality of okhotsk sea pink salmon in the...
TRANSCRIPT

Winter mortality of Okhotsk Sea pink salmon in the ocean
TINRO-Center, Vladivostok, Russia
Alexander Zavolokin & Elena Strezhneva
0
100
200
300
400
500
600
1925
1929
1933
1937
1941
1945
1949
1953
1957
1961
1965
1969
1973
1977
1981
1985
1989
1993
1997
2001
2005
2009
2013
Cat
ch, t
h. t
Chinook Coho Sockeye Chum Pink
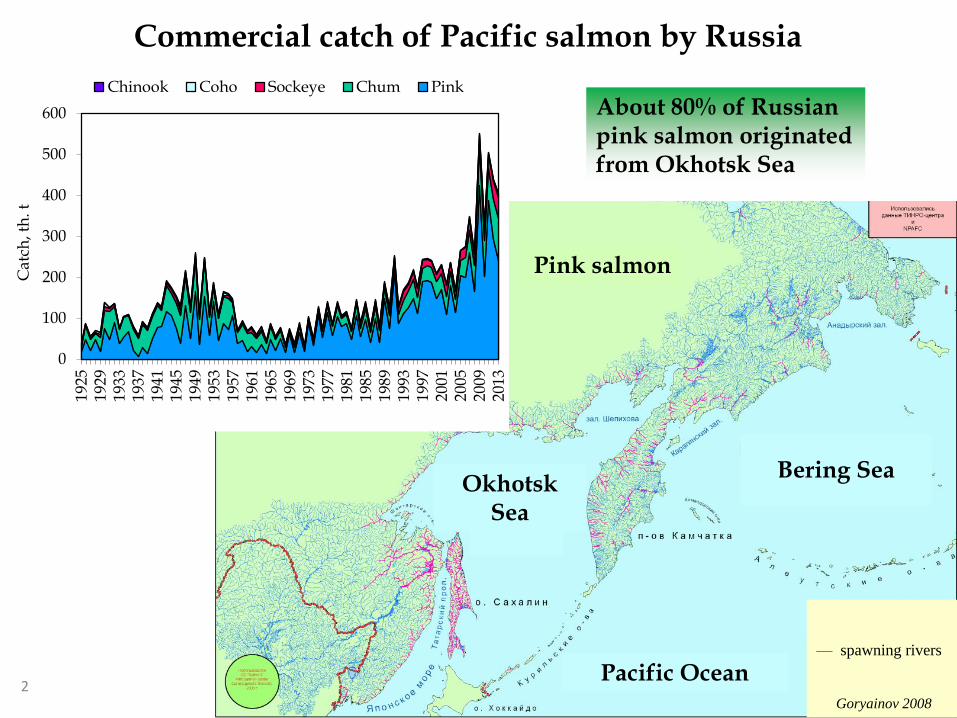
About 80% of Russian pink salmon originated from Okhotsk Sea
Commercial catch of Pacific salmon by Russia
Pink salmon
Bering Sea Okhotsk
Sea
Pacific Ocean
— spawning rivers
Goryainov 2008
2
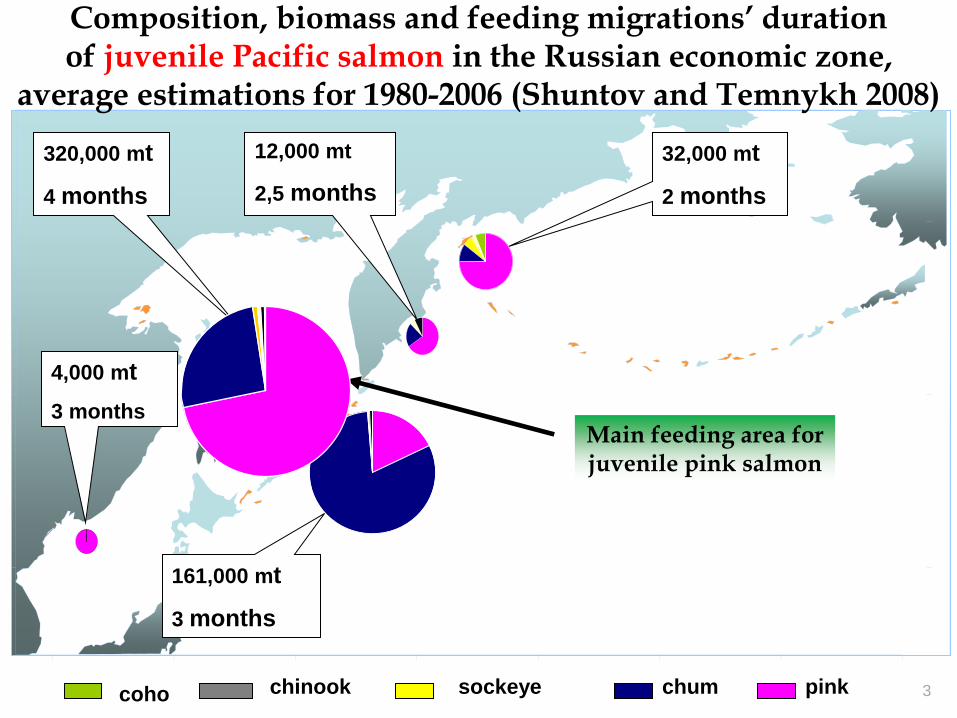
320,000 mt
4 months
32,000 mt
2 months
161,000 mt
3 months
12,000 mt
2,5 months
4,000 mt
3 months
pink chum sockeye chinook coho
Main feeding area for juvenile pink salmon
Composition, biomass and feeding migrations’ duration of juvenile Pacific salmon in the Russian economic zone,
average estimations for 1980-2006 (Shuntov and Temnykh 2008)
3
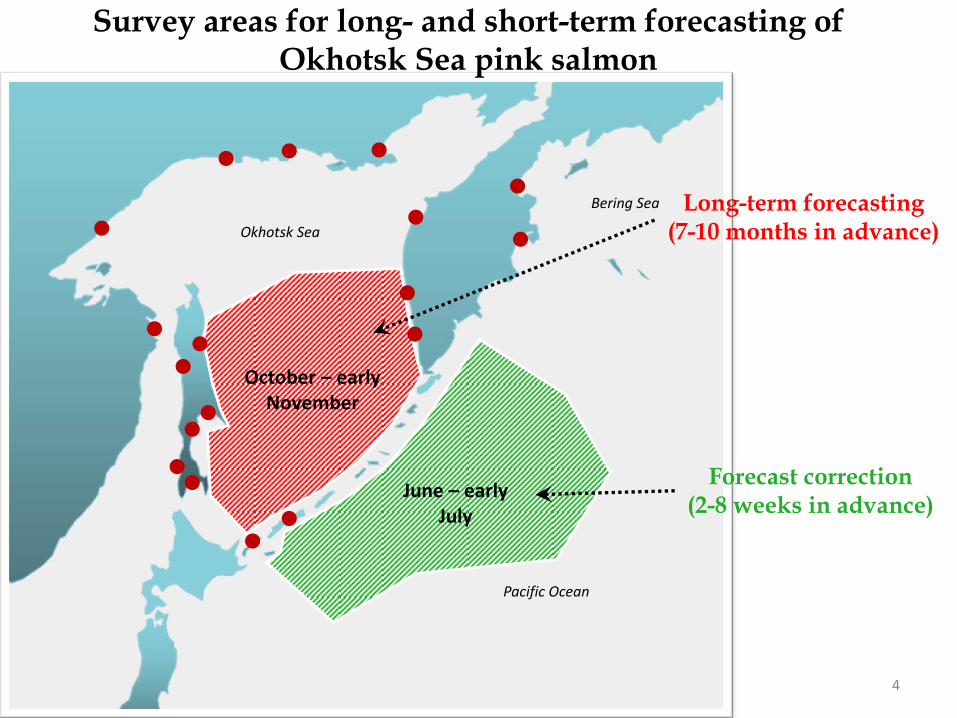
Long-term forecasting (7-10 months in advance)
Forecast correction (2-8 weeks in advance)
Okhotsk Sea
Bering Sea
Pacific Ocean
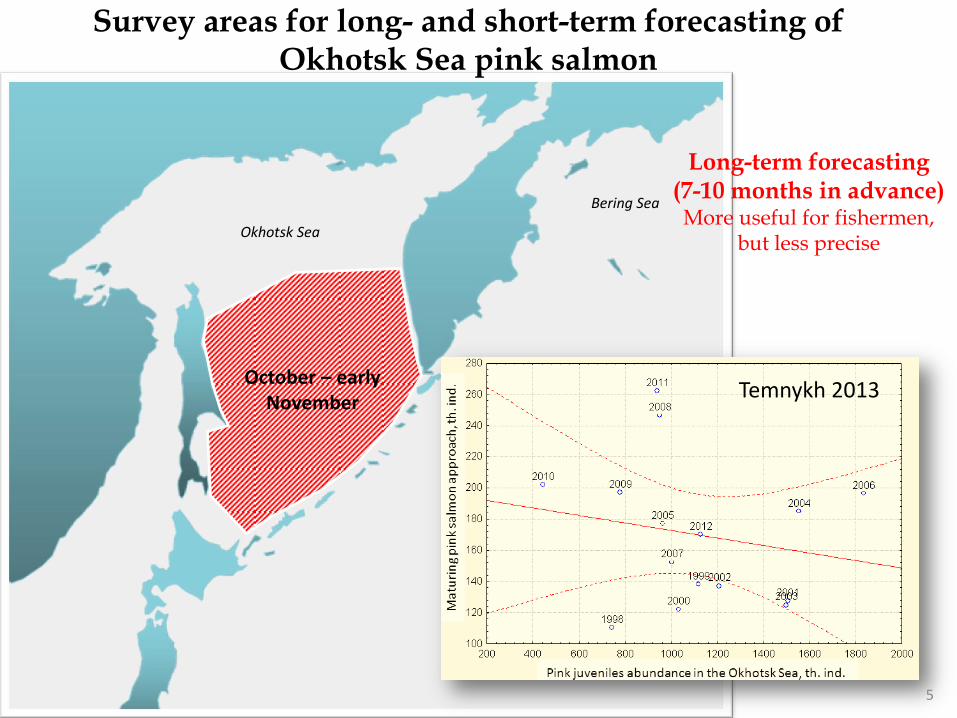
October – early November
June – early July
Survey areas for long- and short-term forecasting of Okhotsk Sea pink salmon
4
Okhotsk Sea
Bering Sea
Pacific Ocean
October – early November
Survey areas for long- and short-term forecasting of Okhotsk Sea pink salmon
Long-term forecasting (7-10 months in advance) More useful for fishermen,
but less precise
5
Temnykh 2013

Forecast correction (2-8 weeks in advance) More precise, but late for
fishermen
Okhotsk Sea
Bering Sea
Pacific Ocean
June – early July
Survey areas for long- and short-term forecasting of Okhotsk Sea pink salmon
6
Temnykh 2013

Survival rates of pink salmon belonging to the Sea of Okhotsk stocks during period from fall surveys till prespawning approaches to coasts, 1989-2010 (Radchenko et al., 2013)
0
5
10
15
20
25
30
35
40
45
19
89/1
99
0
19
90/1
99
1
19
91/1
99
2
19
92/1
99
3
19
93/1
99
4
19
94/1
99
5
19
95/1
99
6
19
96/1
99
7
19
97/1
99
8
19
98/1
99
9
19
99/2
00
0
20
00/2
00
1
20
01/2
00
2
20
02/2
00
3
20
03/2
00
4
20
04/2
00
5
20
05/2
00
6
20
06/2
00
7
20
07/2
00
8
20
08/2
00
9
20
09/2
01
0
20
10/2
01
1
Su
rviv
al
rate
, %
Year of parental generation spawn/downstream migration
Pink salmon marine survival changes 4-fold
7

Okhotsk Sea
Bering Sea
Pacific Ocean
October – early November
June – early July
How can we improve long-term forecasting of pink
salmon returns?
X 500,000 USD
? Predictors of pink salmon winter survival
8

Critical Size, Critical Period Hypothesis (Beamish and Mahnken 2001)
The distribution of the average circuli spacing of the first 10 saltwater circuli from (a) ocean-age-0 coho salmon collected in the Strait of Georgia in September and November, 2000 and (b) ocean-age-1 coho salmon collected in March, July, August, and September in the Strait of Georgia and from Chilliwack and Big Qualicum hatcheries. (Figure from Beamish et al. 2004)
Relative frequencies of scale radius length to circuli 3, 6, 9, 12, and 15 for hatchery pink salmon juveniles (dotted lines) and individuals of that cohort returning the following year as mature adults (solid lines). (Figure from Moss et al. 2005)
ocean-age-0 coho
ocean-age-1 coho
9
Goal: to test the hypothesis of critical size and critical period for Sea of Okhotsk pink salmon, and to evaluate the possibility of using the data on the growth and body size of juveniles for predicting their returns
10
Ind./hour– 0
– < 20
– 21-50
– 51-100
– > 100
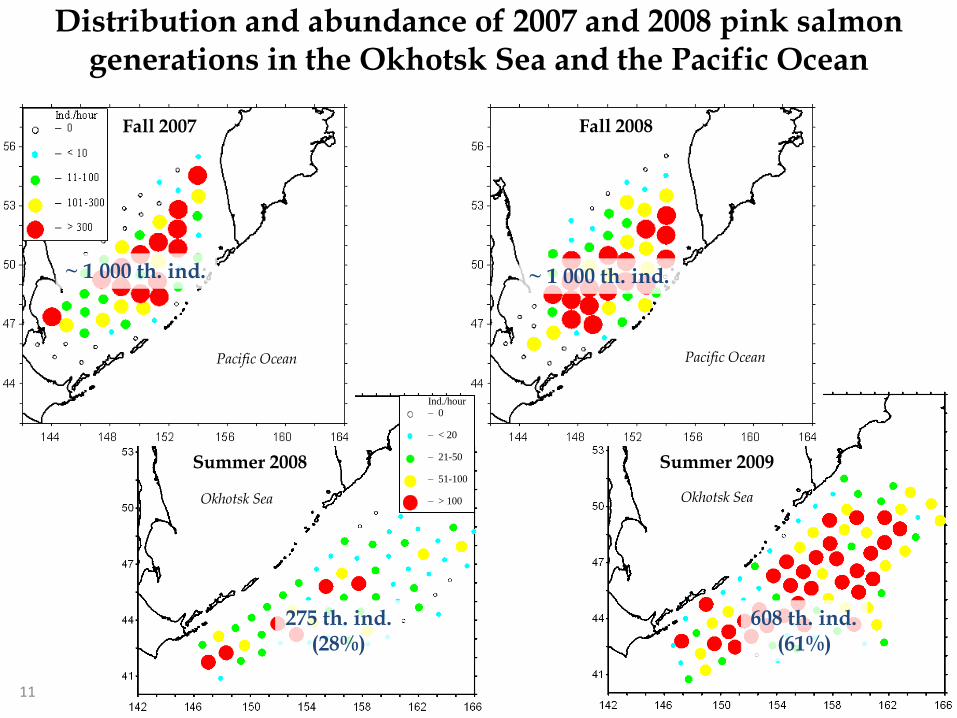
Fall 2007 Fall 2008
~ 1 000 th. ind. ~ 1 000 th. ind.
275 th. ind. (28%)
608 th. ind. (61%)
Okhotsk Sea
Pacific Ocean
Okhotsk Sea
Pacific Ocean
Summer 2008 Summer 2009
Distribution and abundance of 2007 and 2008 pink salmon generations in the Okhotsk Sea and the Pacific Ocean
11
Okhotsk Sea
Pacific Ocean
3 6
9 12
3 6
9 12
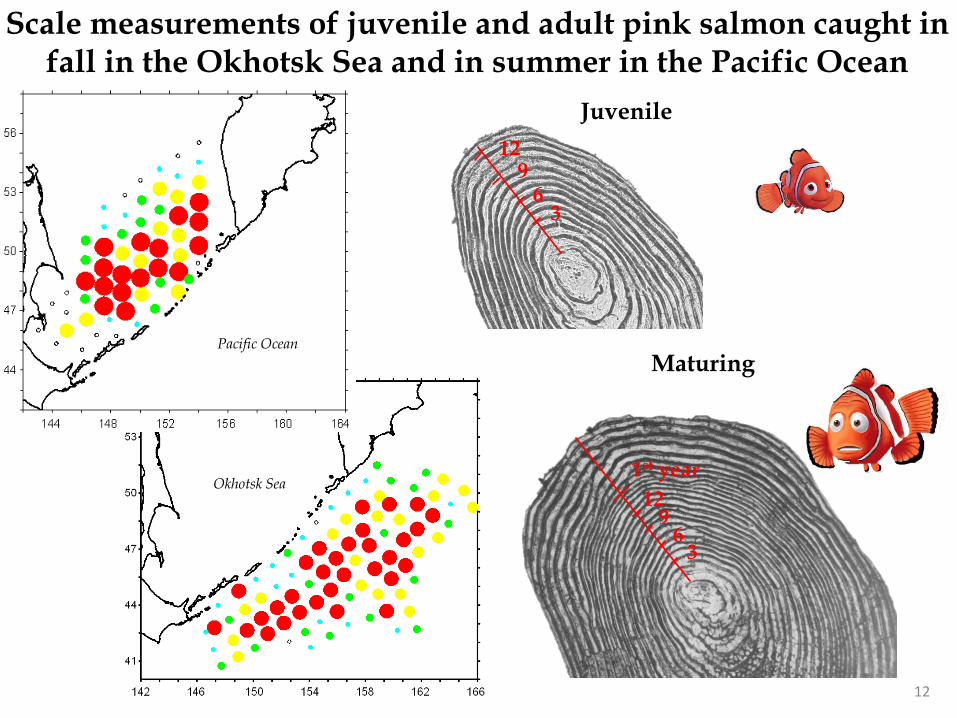
1st year
Juvenile
Maturing
Scale measurements of juvenile and adult pink salmon caught in fall in the Okhotsk Sea and in summer in the Pacific Ocean
12
200 300 400 500 600 700 800 900 10000%
1%
3%
4%
6%
7%
9%
10%
11%
13%
14%
150 250 350 450 550 650 7500%
1%
3%
4%
5%
7%
8%
9%
11%
12%
13%
15%
16%
17%
19%
100 200 300 400 500 6000%
3%
7%
10%
13%
17%
20%
23%
27%
40 80 120 160 200 240 280 3200%
1%
3%
4%
5%
7%
8%
9%
11%
12%
13%
15%
16%
17%
19%
250 350 450 550 650 750 8500%
4%
8%
12%
16%
20%
23%
27%
150 250 350 450 550 6500%
4%
8%
11%
15%
19%
23%
26%
30%
34%
38%
100 200 300 4000%
8%
15%
23%
30%
38%
45%
20 60 100 140 180 220 2600%
4%
8%
11%
15%
19%
23%
26%
30%
34%
18
12
6
0
30
20
10
0
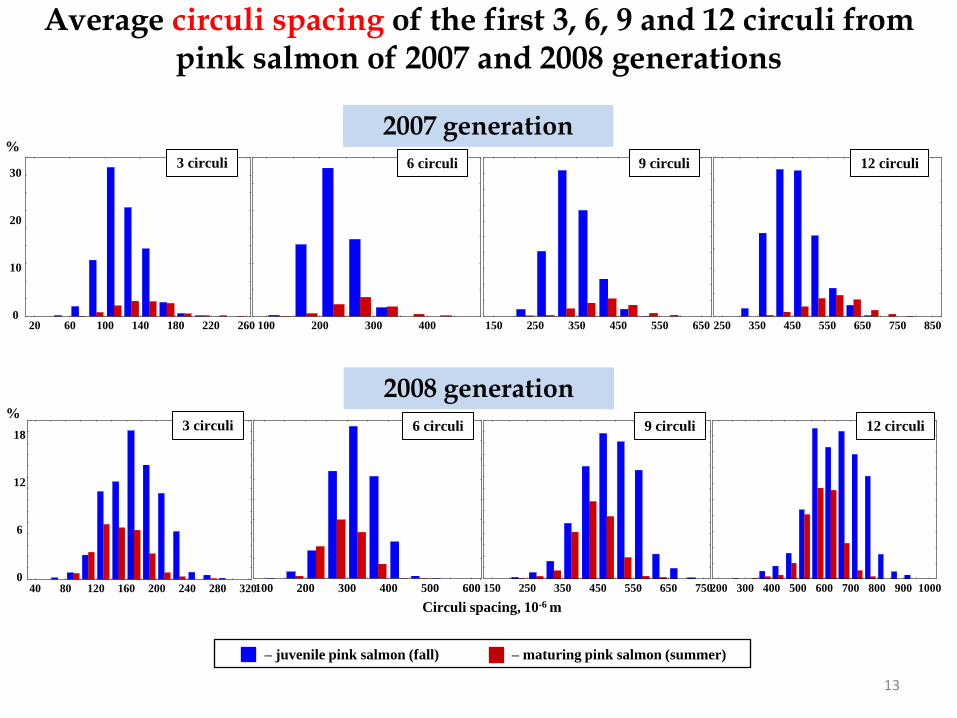
– juvenile pink salmon (fall) – maturing pink salmon (summer)
Circuli spacing, 10-6 m
% 3 circuli 6 circuli 9 circuli 12 circuli
Average circuli spacing of the first 3, 6, 9 and 12 circuli from pink salmon of 2007 and 2008 generations
3 circuli 6 circuli 9 circuli 12 circuli %
2007 generation
2008 generation
13

2008 275 th. ind.
2009 608 th. ind.
Average circuli spacing of maturing pink salmon in the second year of life
300
400
500
600
700
800
150
250
350
450
550
60
100
140
180
220
260
3 circuli 6 circuli
9 circuli
Cir
culi
sp
aci
ng
, 10
-6 m
2008 2009 2008 2009
2008 2009
– median
– quartile
– limits
Second year growth was similar in 2008
and 2009
14

200120022003
2004
2005
2006
2007
2008
2009
2011
2012
2013
-40 -30 -20 -10 0 10 20 30 40 50
Detrended body mass
66
68
70
72
74
76
78
80
82
84
86
88
90
92
94
Mort
ali
ty,
%
200120022003
2004
2005
2006
2007
2008
2009
2011
2012
2013
200120022003
2004
2005
2006
2007
2008
2009
2011
2012
2013
-40 -30 -20 -10 0 10 20 30 40 50
Detrended body length
66
68
70
72
74
76
78
80
82
84
86
88
90
92
94
Mort
ali
ty,
%
200120022003
2004
2005
2006
2007
2008
2009
2011
2012
2013
0
10
20
30
40
50
60
70
80
90
100
-4
-3
-2
-1
0
1
2
3
2001
2002
2003
2004
2005
2006
2007
2008
2009
2010
2011
2012
2013
Mort
ali
ty, %
Det
ren
ded
bod
y l
ength
Body length Mortality
0
10
20
30
40
50
60
70
80
90
100
-60
-50
-40
-30
-20
-10
0
10
20
30
40
50
200
1
200
2
200
3
200
4
200
5
200
6
200
7
200
8
200
9
201
0
201
1
201
2
201
3
Mort
ali
ty, %
Det
ren
ded
bod
y m
ass
Body mass Mortality
r = 0.74, p < 0.01 r = 0.74, p < 0.01
Changes in body size of juvenile pink salmon and their mortality from fall till approach to coast
15

200120022003
2004
2005
2006
2007
2008
2009
2011
2012
2013
-40 -30 -20 -10 0 10 20 30 40 50
Detrended body mass
66
68
70
72
74
76
78
80
82
84
86
88
90
92
94
Mort
ali
ty,
%
200120022003
2004
2005
2006
2007
2008
2009
2011
2012
2013
200120022003
2004
2005
2006
2007
2008
2009
2011
2012
2013
-40 -30 -20 -10 0 10 20 30 40 50
Detrended body length
66
68
70
72
74
76
78
80
82
84
86
88
90
92
94
Mort
ali
ty,
%
200120022003
2004
2005
2006
2007
2008
2009
2011
2012
2013
r = 0.74, p < 0.01 r = 0.74, p < 0.01
Changes in body size of juvenile pink salmon and their mortality from fall till approach to coast
Pacific Ocean
ODD YEARS High abundance of
relatively small juveniles
EVEN YEARS Dominance of relatively big
juveniles
16
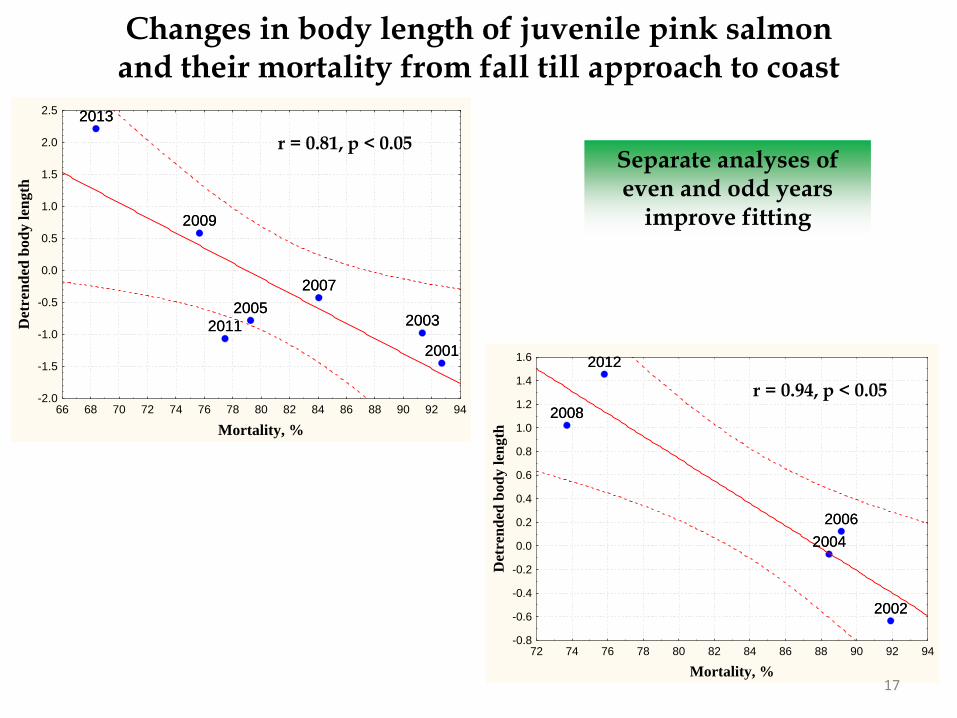
2001
20032005
2007
2009
2011
2013
66 68 70 72 74 76 78 80 82 84 86 88 90 92 94
Mortality, %
-2.0
-1.5
-1.0
-0.5
0.0
0.5
1.0
1.5
2.0
2.5
Det
ren
ded
bo
dy
len
gth
2001
20032005
2007
2009
2011
2013
2002
2004
2006
2008
2012
72 74 76 78 80 82 84 86 88 90 92 94
Mortality, %
-0.8
-0.6
-0.4
-0.2
0.0
0.2
0.4
0.6
0.8
1.0
1.2
1.4
1.6
Det
ren
ded
bod
y l
ength
2002
2004
2006
2008
2012
r = 0.81, p < 0.05
r = 0.94, p < 0.05
Changes in body length of juvenile pink salmon and their mortality from fall till approach to coast
Separate analyses of even and odd years
improve fitting
17
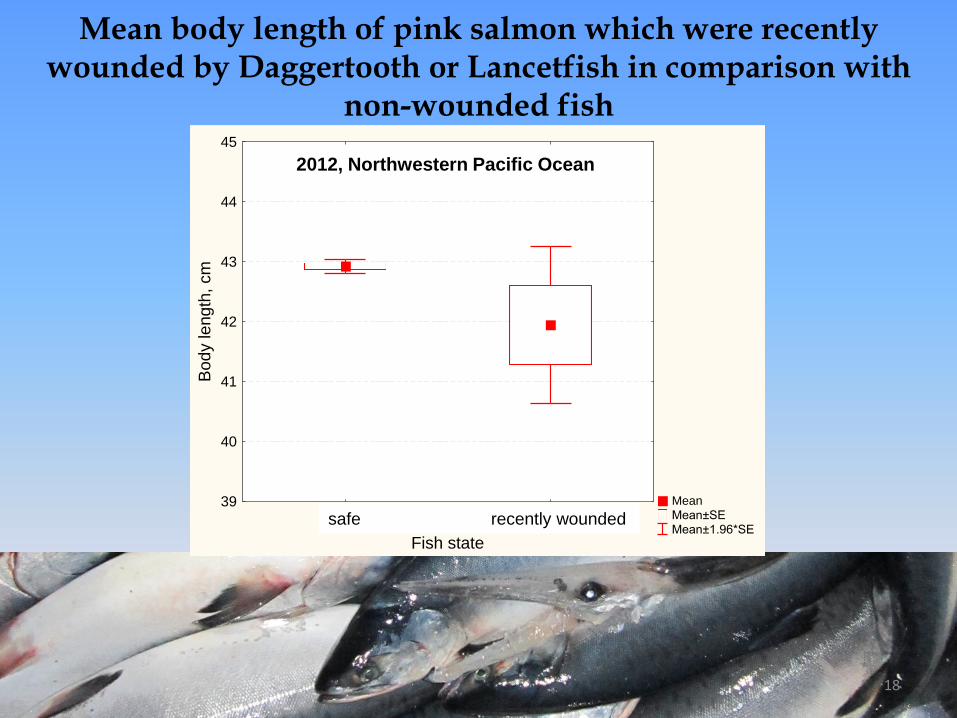
Mean
Mean±SE
Mean±1.96*SE safe recently injured
Fish state
39
40
41
42
43
44
45
Body length
, cm
safe recently wounded
Mean body length of pink salmon which were recently wounded by Daggertooth or Lancetfish in comparison with
non-wounded fish
2012, Northwestern Pacific Ocean
18
Conclusion critical size and critical period
hypothesis is confirmed for Sea of Okhotsk pink salmon
data on body size of juvenile pink salmon can be useful for long-term forecasting of their returns
19
Thank you!
20