winter 2010/2011 challenges with experimental design and ... · pdf filechallenges with...
TRANSCRIPT
Understanding Nutrient & Sediment Loss at Saxon Homestead Farm - 8
Challenges with Experimental Design and Tile Monitoring at Saxon Homestead Farm
Winter 2010/2011
Eric Cooley, UW-Extension/Discovery FarmsDennis Frame, UW-Extension/Discovery Farms
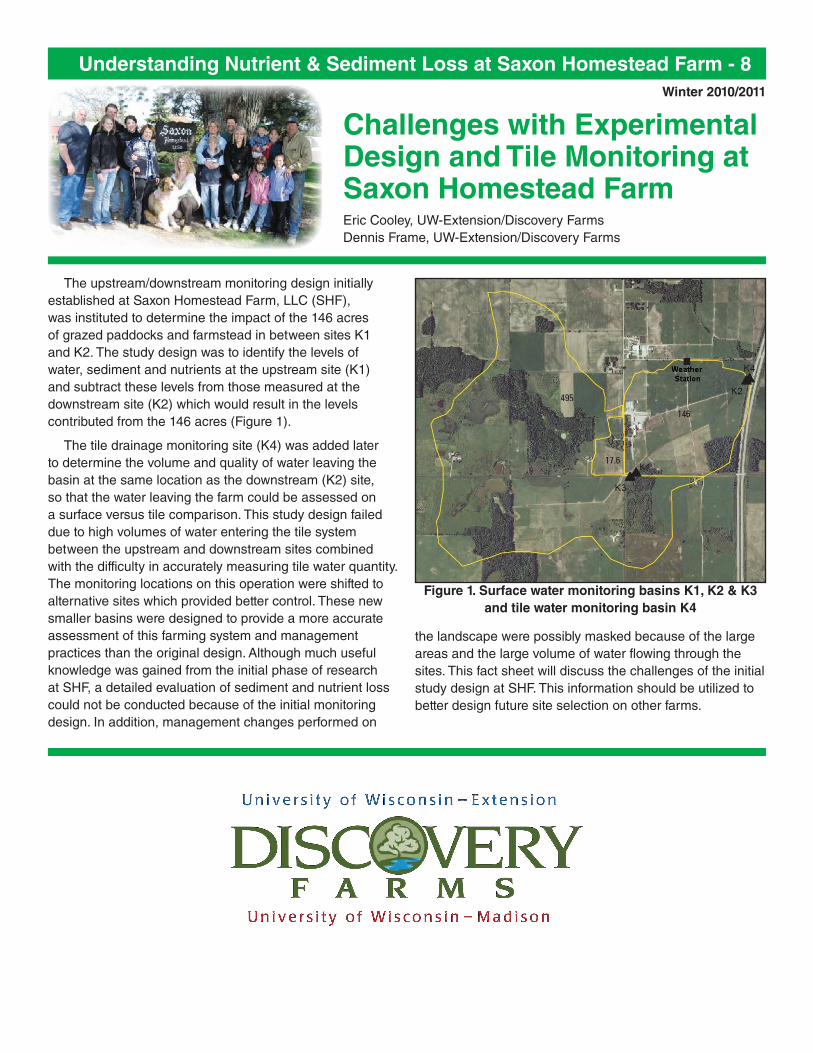
The upstream/downstream monitoring design initially established at Saxon Homestead Farm, LLC (SHF), was instituted to determine the impact of the 146 acres of grazed paddocks and farmstead in between sites K1 and K2. The study design was to identify the levels of water, sediment and nutrients at the upstream site (K1) and subtract these levels from those measured at the downstream site (K2) which would result in the levels contributed from the 146 acres (Figure 1).
The tile drainage monitoring site (K4) was added later to determine the volume and quality of water leaving the basin at the same location as the downstream (K2) site, so that the water leaving the farm could be assessed on a surface versus tile comparison. This study design failed due to high volumes of water entering the tile system between the upstream and downstream sites combined with the difficulty in accurately measuring tile water quantity. The monitoring locations on this operation were shifted to alternative sites which provided better control. These new smaller basins were designed to provide a more accurate assessment of this farming system and management practices than the original design. Although much useful knowledge was gained from the initial phase of research at SHF, a detailed evaluation of sediment and nutrient loss could not be conducted because of the initial monitoring design. In addition, management changes performed on
the landscape were possibly masked because of the large areas and the large volume of water flowing through the sites. This fact sheet will discuss the challenges of the initial study design at SHF. This information should be utilized to better design future site selection on other farms.
Figure 1. Surface water monitoring basins K1, K2 & K3 and tile water monitoring basin K4

Water, sediment and nutrient loss from surface to tile The upstream (K1) and downstream (K2)
monitoring sites were installed in a grassed waterway which flowed as an intermittent stream during high runoff periods. Prior to the installation of equipment, the tile main underlying this grassed waterway was repaired to fix blockages caused by road construction. The surface runoff was noted by the producer to flow at higher volumes and longer periods prior to the tile repairs. Once the tile was repaired, the tiles did an effective job at removing excess water and surface runoff flowed for shorter durations and lower volumes.
The 12-inch main tile leaving the farm had the potential to move large volumes of water, sediment and nutrients. To assess this potential, simultaneous tile monitoring and surface water monitoring was performed at the downstream site. As indicated in SHF-4, it was evident shortly after monitoring began that the tile must be flowing at near capacity before surface runoff would begin at the downstream site (Figure 2). The theory for preferential flow pathways from surface to tile causing the tile flow was further validated when evaluating the total volume of water flowing though the upstream and downstream sites.
Throughout this set of fact sheets, the amount of water, sediment, and nutrients reported at each of the sites was reported on a yield (pounds per acre) basis so that basins of differing size could be compared on a similar scale. When the data is analyzed on a load (total amount) basis it provides further evidence that water and sediment are being lost via preferential flow paths to tile. The levels of water and sediment are lower in both years at the downstream site (K1) as compared to the upstream site (K2) (Table 1). The comparison of the low values in both the upstream and downstream in respect to the much larger values in the tile (K4) strengthens the theory that much of the water and sediment was transferred from the surface
runoff to the tile drainage system.
Although the evidence for preferential flow paths was observed in the water and sediment loading data for the upstream/downstream comparison, similar trends were not observed for phosphorus and nitrogen. Higher loads of phosphorus and nitrogen were observed at the downstream (K2) site as compared to the upstream (K1). The contributing area between the upstream and downstream sites contained paddocks where cows were overwintered and these paddocks had high stocking densities for extended periods of time as compared to other paddocks on the farm. These overwintered paddocks likely had high losses of phosphorus and nitrogen during the frozen ground period (SHF-7), when preferential flow is not as prevalent, which resulted in these values. It should be noted that yield values (pounds per acre) for phosphorus and nitrogen were very similar for the upstream and downstream sites as compared to the elevated values observed at the intensively tilled (K3) and tile (K4) sites that measured higher losses per acre (SHF-7).
Timing of surface water runoff and tile flow
0.0
0.5
1.0
1.5
2.0
2.5
4/30/06 0:00 5/7/06 0:00 5/14/06 0:00 5/21/06 0:00G
age
heig
ht, i
n in
ches Upstream
Downstream
Tile
Tile full
Figure 2. Timing of downstream surface flow based on tile flowing at capacity
Table 1. Annual load of water, sediment and nutrients
Water FY2005 18.9 16.3 1.3 65.5
(million gallons) FY2006 49.1 39.9 1.8 93.9
Sediment FY2005 5,012 4,546 4,109 126,242
(pounds) FY2006 60,202 15,624 88,054 436,068
Phosphorus FY2005 139 383 119 604
(pounds) FY2006 252 521 126 983
Nitrogen FY2005 687 1,729 62 3,756
(pounds) FY2006 1,743 2,008 339 9,137
K1 K2 K3 K4

Rating development for tile water volume monitoringAs stated in the previous section, it was evident
from the data that preferential flow from the surface to the tile was occurring between the upstream and downstream monitoring sites. To accurately assess the amount of water, sediment and nutrients leaving the farm, it was crucial to correctly determine tile flow.
At the onset of monitoring at the tile site, it was apparent that the flume was experiencing backwater conditions and the rated discharge for the flume would not be appropriate. The tile was running almost half full at the time of installation. The outlet of the discharge pipe was either partially or fully submerged where the tile emptied into Centerville Creek (Figure 3).
Several discharge measurements were made at the outlet of the flume, approximately 700 feet downstream of the flume. This was the only place for a measurement because the tile line went under an interstate highway. After taking several discharge measurements it was apparent that when the stage was within the limits of the flume, the measurement-modified flume rating was appropriate down to near 0.37 feet (suspected point of backwater control). When flow exceeded the limits of the flume (Figure 4), the rating needed to be redeveloped. There were several measurements made when the stage was above the flume so that an extended rating could be developed. It was suspected that the discharge record was still inappropriate due to velocity changes in the tile when the tile was surcharging.
To determine the velocity of the water in order to calculate a volume measurement, a Marsh McBirney velocity meter was installed on the upstream side of the flume in the tile (Figure 5).
Figure 3. Submerged tile outlet
Figure 4. Surcharged tile from backwater
Figure 5. Marsh McBirney velocity meter to determine flow

Figure 7. New stage discharge rating due to backwater and surcharge conditions
This velocity meter showed changing velocities outside the flume range (above 1 foot depth). Also, the velocity meter’s discharge coincided with the measurement-modified flume rating when the water was confined in the flume. The Marsh McBirney velocity meter worked fairly well until it was damaged and a subsequent Marsh McBirney meter was installed and never worked correctly.
On November 8, 2005 an ISCO velocity meter (Figure 6) replaced the Marsh McBirney meter and again provided area-velocity discharges for the site until it started to malfunction. Both the Marsh McBirney and ISCO velocity provided area-velocity discharges that were similar but both never seemed to work flawlessly in this situation. An evaluation was done of the discharges produced by all three methods (modified flume & extended rating from measurements, Marsh velocity, and ISCO velocity) to determine the best combination to produce a rating for the site.
A new stage discharge rating was developed after comparing all the methods of measurement. The new stage rating is comprised of a linear relationship between the stage and discharge within the limits of the flume and a polynomial relationship outside of the limits of the flume (Figure 7). This polynomial is based on the measurements made and the area-velocity discharges; and is used to
create a stage discharge relationship that will cover the area outside the limits of the flume. This new rating is a best fit rating and is not completely accurate. The rating was applied to portions of the discharge record in which the velocity meters were not installed or operating correctly. For periods that the velocity meters were operational, the area-velocity is the rated discharge.
Figure 6. ISCO velocity meter
All StormsNew Rating updated 7/25/06
y = 1.8436x - 0.681R2 = 1, use to top of flume @ 0.88 feet
y = -0.0462x5 + 0.5371x4 - 2.2601x3 + 4.1801x2 - 2.8882x + 1.5135R2 = 0.9992
-0.5
0
0.5
1
1.5
2
2.5
3
0 0.5 1 1.5 2 2.5 3 3.5 4 4.5
January
Jan-Feb
March
April
Measurements
original stage-q
New Linear Low-End
New Upper End
Linear (New Linear Low-End)
Poly. (New Upper End)

Potential of water volume to hide changes in water quality – the dilution effectOne final reason that the original study design was not
optimal for the goals of this study was due to the large volumes of water that were monitored through these sites. The large basin sizes in the upstream (495 acres) and downstream (641 acres) contributed large volumes of water through the monitoring sites. The concentrations of sediment and nutrients were often so low that changes in management made on a small scale would be hard or impossible to detect in the large water volume. For example, if a change in management occurred on a 40 acre parcel of the land, it would be less than one-tenth of the total contributing area, therefore changes in water quantity/quality would be difficult to identify due to the small fraction of land changed.
To compound the issue with detection of small changes in the large water volume, the long flow periods of the upstream K1 site (days to weeks), compared to shorter flow periods of intensively tilled site K3 (hours to days) caused irregularities of sample frequency between sites K1 and K3. Therefore the peak flow at K3, which should have the highest sediment movement, would be sampled at K3 but may have sampled at K1 before or after the peak discharge. Therefore, the short pulse of the highest discharge at K3 may be missed at K1.
The dilution effect can be seen in the load data presented in Table 1. The high quantity of sediment observed at K3 should have gone almost completely through K1 due to the close proximity of the discharge of K3 to K1. However, it can be observed that the two values are nearly equal in FY05 and K3 is significantly higher than K1 in FY06. Because of the dilution effect, some of the sediment monitored in the lower volume going through K3
is masked by the large volume of water going through K1 (Figure 8).
One additional way to conceptualize the dilution effect is to put a drop of food coloring in a glass of water and one in a swimming pool. You could easily see the drop of food coloring in the glass of water, but it would be almost indistinguishable in the pool. It is the same amount added to both, but the dilution in the pool makes it more difficult to identify.
The dilution effect which impacted this study design would not provide for the level of detail to assess changes in water quality/quantity because of changes in management. For this reason, the initial larger basin monitoring project was redesigned and scaled down to a smaller basin size for subsequent monitoring of the farm and management system at SHF.
Figure 8. Sediment in K3 flow just upstream of K1
➢ Loss of surface water to tile in the upstream/downstream study design made it difficult to assess what was coming from the land between the two surface sites.
➢ Preferential flow from surface to tile was evident as the tile flowed at near capacity before runoff was produced at the downstream surface site. Also, the load of water and sediment through the downstream surface site was lower than at the upstream surface site.
➢ Backwater and surcharged conditions made tile flow monitoring extremely difficult. Although two types of
flow velocity meters were installed to more accurately measure flow, both were problematic to sustain operation.
➢ The dilution effect from high volumes of flow with low concentrations of sediment and nutrients made the correlation of land management to water quality difficult. Because of the large basin size, small changes in water quality could be masked by the large volume of water. For this reason, the research design was shifted to smaller basin sizes at SHF.
Conclusions

This material is based upon work supported by the National Institute of Food and Agriculture (NIFA), U.S. Department of Agriculture, under Agreement No. 2009-45045-05632. Any opinions, findings, conclusions, or recommendations expressed in this publication are those of the author(s) and do not necessarily reflect the view of the U.S. Department of Agriculture.
This fact sheet is part 8 of a 9 part series and can be found along with the rest of the fact sheets on the web at: www.uwdiscoveryfarms.org or by calling the UW-Discovery Farms Office at 715-983-5668.
© 2010 by the Board of Regents of the University of Wisconsin System. University of Wisconsin-Extension is an EEO/Affirmative Action employer and provides equal opportunities in employment and programming, including Title IX and ADA requirements. Publications are available in alternative formats upon request.
The data presented in this article were provided by the U.S. Geological Survey as part of a cooperative agreement with the UW-Discovery Farms Program.