winning strategies 2014
TRANSCRIPT

A STUDY BYDEVELOPMENT COUNSELLORS INTERNATIONAL
IN ECONOMIC DEVELOPMENT MARKETING
A VIEW FROM CORPORATE AMERICA
WINNING STRATEGIES
2014

2
Table Of Contents
Index Of Charts And
Tables
Executive Summary . . . . . . . . . . . . . . . . . . . . . . . . . . . . . . . . . . . . . . . . . . . . . . . . . . . . .4
Introduction and Methodology . . . . . . . . . . . . . . . . . . . . . . . . . . . . . . . . . . . . . . . . . . . .6
Influencing Executive Perceptions: Leading Sources of Information . . . . . . . . . . .7
Best Marketing Techniques from the Customer’s Perspective . . . . . . . . . . . . . . . 11
The Web and Site Selection . . . . . . . . . . . . . . . . . . . . . . . . . . . . . . . . . . . . . . . . . . . . . 14
First Contact: When Site Selectors Turn to Economic Development Groups . . . . . . . . . . . . . . . . . . . . . . . . . . . . . . . . . . . . . . . . . 15
Web Design: Important Information for Site Selectors . . . . . . . . . . . . . . . . . . . . . . 19
Social Media and Executive Decision Makers . . . . . . . . . . . . . . . . . . . . . . . . . . . . . . 21
Best and Worst Places for Business . . . . . . . . . . . . . . . . . . . . . . . . . . . . . . . . . . . . . .23
The International Perspective . . . . . . . . . . . . . . . . . . . . . . . . . . . . . . . . . . . . . . . . . . . 26
The Consultants Speak: Best Economic Development Groups . . . . . . . . . . . . . . 29
Looking Forward: Corporate Projected Location Decisions in 2014 and 2015 . . . . . . . . . . . . . . . . . 30
A Word About DCI . . . . . . . . . . . . . . . . . . . . . . . . . . . . . . . . . . . . . . . . . . . . . . . . . . . . 33
Appendix A: Questionnaire and Invitation to Participate . . . . . . . . . . . . . . . . . . . 34
Appendix B: Most Favorable Business Climate Rankings for All States . . . . . . 38
Appendix C: Least Favorable Business Climate Rankings for All States . . . . . . 39
Appendix D: Demographic Profile of Respondents . . . . . . . . . . . . . . . . . . . . . . . . 40
2014 Survey Results
Chart A Leading Sources of Information Influencing Executive Perceptions of an Area’s Business Climate . . . . . . . . . . . . . .7
Chart C Most Effective Marketing Techniques . . . . . . . . . . . . . . . . . . . . . . . . . . . 11
Chart E Frequency of Internet Use in Most Recent Site Location Search . . . . . . . . . . . . . . . . . . . . . . . . . . . . . . . . . . . 14
Chart G First Contact with Economic Development Groups . . . . . . . . . . . . . . . 15
Chart I Likelihood of Visiting Economic Development Organizations’ Websites During Next Site Search . . . . . . . . . . . . . . . . . 17
Chart L Most Useful Features of an Economic Development Organization’s Website . . . . . . . . . . . . . . . . . . . . . . . . . . 20
Chart N Social Media Channels Used for Business . . . . . . . . . . . . . . . . . . . . . . . . 21
Chart Q Part of the World with the Best International Growth Opportunities . . . . . . . . . . . . . . . . . . . . . . . . . . . . 26
Chart T Drivers for International Expansion . . . . . . . . . . . . . . . . . . . . . . . . . . . . . 28
Chart U Most Likely Facility Type for Next Facility Change . . . . . . . . . . . . . . . 30
Chart W Location Advisors: Most Common Type of Relocation Project . . . . . . . . . . . . . . . . . . . . . . . . . . . . . . . . . . . . . . . . . . 31
3
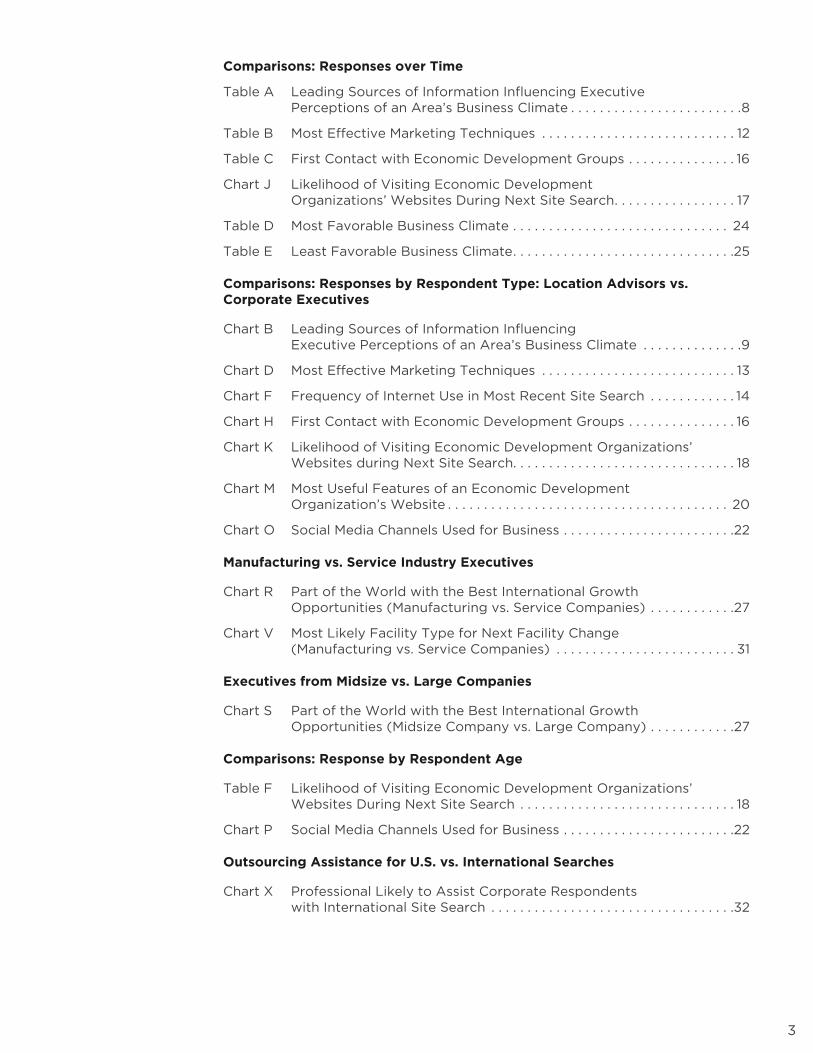
Comparisons: Responses over Time
Table A Leading Sources of Information Influencing Executive Perceptions of an Area’s Business Climate . . . . . . . . . . . . . . . . . . . . . . . .8
Table B Most Effective Marketing Techniques . . . . . . . . . . . . . . . . . . . . . . . . . . . 12
Table C First Contact with Economic Development Groups . . . . . . . . . . . . . . . 16
Chart J Likelihood of Visiting Economic Development Organizations’ Websites During Next Site Search . . . . . . . . . . . . . . . . . 17
Table D Most Favorable Business Climate . . . . . . . . . . . . . . . . . . . . . . . . . . . . . . 24
Table E Least Favorable Business Climate . . . . . . . . . . . . . . . . . . . . . . . . . . . . . . .25
Comparisons: Responses by Respondent Type: Location Advisors vs. Corporate Executives
Chart B Leading Sources of Information Influencing Executive Perceptions of an Area’s Business Climate . . . . . . . . . . . . . .9
Chart D Most Effective Marketing Techniques . . . . . . . . . . . . . . . . . . . . . . . . . . . 13
Chart F Frequency of Internet Use in Most Recent Site Search . . . . . . . . . . . . 14
Chart H First Contact with Economic Development Groups . . . . . . . . . . . . . . . 16
Chart K Likelihood of Visiting Economic Development Organizations’ Websites during Next Site Search . . . . . . . . . . . . . . . . . . . . . . . . . . . . . . . 18
Chart M Most Useful Features of an Economic Development Organization’s Website . . . . . . . . . . . . . . . . . . . . . . . . . . . . . . . . . . . . . . . 20
Chart O Social Media Channels Used for Business . . . . . . . . . . . . . . . . . . . . . . . .22
Manufacturing vs. Service Industry Executives
Chart R Part of the World with the Best International Growth Opportunities (Manufacturing vs. Service Companies) . . . . . . . . . . . .27
Chart V Most Likely Facility Type for Next Facility Change (Manufacturing vs. Service Companies) . . . . . . . . . . . . . . . . . . . . . . . . . 31
Executives from Midsize vs. Large Companies
Chart S Part of the World with the Best International Growth Opportunities (Midsize Company vs. Large Company) . . . . . . . . . . . .27
Comparisons: Response by Respondent Age
Table F Likelihood of Visiting Economic Development Organizations’ Websites During Next Site Search . . . . . . . . . . . . . . . . . . . . . . . . . . . . . . 18
Chart P Social Media Channels Used for Business . . . . . . . . . . . . . . . . . . . . . . . .22
Outsourcing Assistance for U.S. vs. International Searches
Chart X Professional Likely to Assist Corporate Respondents with International Site Search . . . . . . . . . . . . . . . . . . . . . . . . . . . . . . . . . .32

4
In 1996, Development Counsellors
International set out to provide the economic
development community with a unique
opportunity: a chance to hear from its target
audience. With a comprehensive survey
of corporate executives with site selection
responsibilities, DCI sought to understand
best practices in marketing places by going
directly to the “customer” of the economic
development world.
Since its inception, A View from Corporate
America: Winning Strategies in Economic
Development Marketing has become a
valuable and highly regarded resource among
economic development professionals. Now in
its seventh iteration, Winning Strategies has
expanded upon its original form to include
questions on international business climates,
as well as to provide an updated snapshot of
corporate America in 2014.
Key findings, based on the aggregate
responses of 356 participants in the 2014
survey, follow.
Executive Summary

5
• The leading sources of information
influencing executive perceptions of
a community’s business climate were
dialogue with industry peers, articles in
newspapers and magazines and business
travel .
• Internet/website followed by planned
visits to corporate executives rate highest
among all economic development
marketing tools . Media relations/publicity,
hosting special events and trade shows
were also identified as effective techniques
for communicating with decision makers.
• For the fourth consecutive time,
corporate executives and their advisors
indicate that they contact economic
development groups most frequently
following the development of the shortlist
of communities to request specific
information or to arrange a site visit .
• Sixty-three percent of respondents
indicated a strong likelihood that they
would use an economic development
organization’s website in their next site
location search .
• Respondents named incentives information
as the most useful feature of an economic
development organization’s website,
followed by workforce statistics and
demographic information .
• Among respondents who use social media
for business, LinkedIn is the most dominant
communications channel, with 77% of
location advisors and 72% of corporate
executives indicating that they use the
platform for business.
• The Wall Street Journal, both print and
online, ranked as the top news sources
for the survey audience, followed by local
daily newspaper and The New York Times.
• Forbes’ rankings/surveys, followed by
those in Site Selection, received the
most attention among respondents who
look to rankings as a source of valuable
information about a location’s business
climate .
• When asked to select the most favorable
business climates among the 50 states,
respondents gave Texas, Florida, Georgia
and North Carolina the highest tally in that
order, with Georgia and North Carolina
tying for third place. South Carolina and
Tennessee also ranked in the top five.
• Forty-seven percent of location advisors
identified manufacturing/production plant
as the most common type of relocation
project they expect to see from their
clients in the year ahead .
• Forty percent of executives anticipate
outsourcing a portion of the site selection
responsibilities in their next site selection
search. Of these respondents, 53% say they
would hire a real estate broker to assist in
the site selection process.
The Asia/Pacific region was identified as the part of the world with the best opportunities for international growth, followed by Western Europe.
The new set of questions aimed at foreign
direct investment revealed the following:
• China, the United Kingdom and Germany
were identified as the countries with the
most to offer for companies interested in
international expansion.
• When asked to indicate the primary drivers
for their company’s potential international
expansion, respondents chose market
access as the primary driver, followed by
cost savings.
6
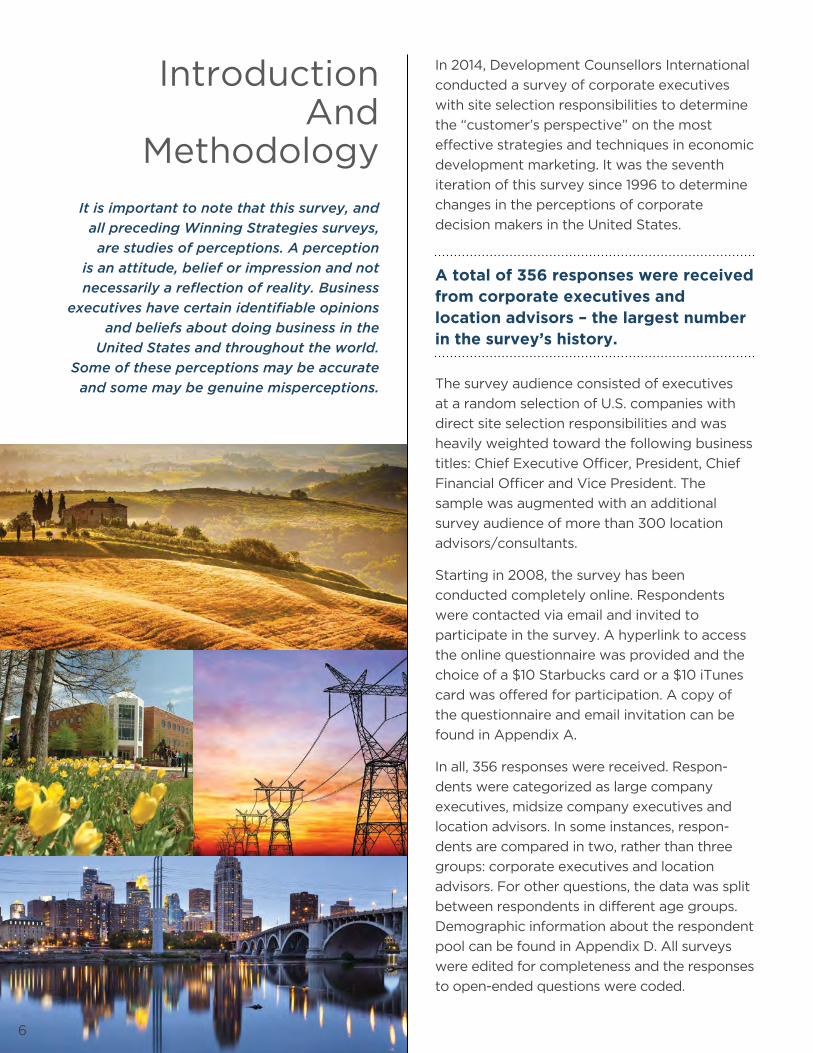
Introduction And
Methodology
It is important to note that this survey, and
all preceding Winning Strategies surveys,
are studies of perceptions. A perception
is an attitude, belief or impression and not
necessarily a reflection of reality. Business
executives have certain identifiable opinions
and beliefs about doing business in the
United States and throughout the world.
Some of these perceptions may be accurate
and some may be genuine misperceptions.
In 2014, Development Counsellors International
conducted a survey of corporate executives
with site selection responsibilities to determine
the “customer’s perspective” on the most
effective strategies and techniques in economic
development marketing. It was the seventh
iteration of this survey since 1996 to determine
changes in the perceptions of corporate
decision makers in the United States .
A total of 356 responses were received from corporate executives and location advisors – the largest number in the survey’s history.
The survey audience consisted of executives
at a random selection of U.S. companies with
direct site selection responsibilities and was
heavily weighted toward the following business
titles: Chief Executive Officer, President, Chief
Financial Officer and Vice President. The
sample was augmented with an additional
survey audience of more than 300 location
advisors/consultants .
Starting in 2008, the survey has been
conducted completely online. Respondents
were contacted via email and invited to
participate in the survey. A hyperlink to access
the online questionnaire was provided and the
choice of a $10 Starbucks card or a $10 iTunes
card was offered for participation. A copy of
the questionnaire and email invitation can be
found in Appendix A.
In all, 356 responses were received. Respon-
dents were categorized as large company
executives, midsize company executives and
location advisors. In some instances, respon-
dents are compared in two, rather than three
groups: corporate executives and location
advisors. For other questions, the data was split
between respondents in different age groups.
Demographic information about the respondent
pool can be found in Appendix D. All surveys
were edited for completeness and the responses
to open-ended questions were coded.

7
How can an economic development
organization best promote a favorable
reputation among executive decision makers?
In order to begin to answer this question,
we must ask another: What sources of
information do executive decision makers
look to in developing perceptions of a
location’s business climate?
Dialogue with industry peers and articles in newspapers and magazines were the top two influencers.
For the seventh time, the Winning Strategies
survey asked corporate decision makers
with site selection responsibilities a series of
questions in order to determine the leading
sources of information influencing executive
perceptions of an area’s business climate.
Respondents were asked to choose three
from 13 possible responses: advertising (a
category that, in the past, was split into two
categories: print advertising and TV/radio
advertising), articles in newspapers and
magazines, business travel, dialogue with
industry peers, direct mail, meetings with
economic development groups, rankings/
surveys (previously called national surveys),
online sources (added in 1999), personal
travel, social media, TV and radio newscasts/
shows, word of mouth and other .
Influencing Executive
Perceptions: Leading Sources
Of Information
Chart A: Leading Sources of Information Influencing Executive Perceptions of an Area’s Business Climate
Dialogue with industry peers
Articles in newspapers and magazine
Business travel
Meetings with economic development groups
Rankings/surveys
Online sources
Word of mouth
Personal travel
Other
TV and radio newscasts/shows
Advertising
Direct mail
Social media
55%
44%
37%
31%
24%
22%
21%
13%
12%
9%
4%
2%
2%
8
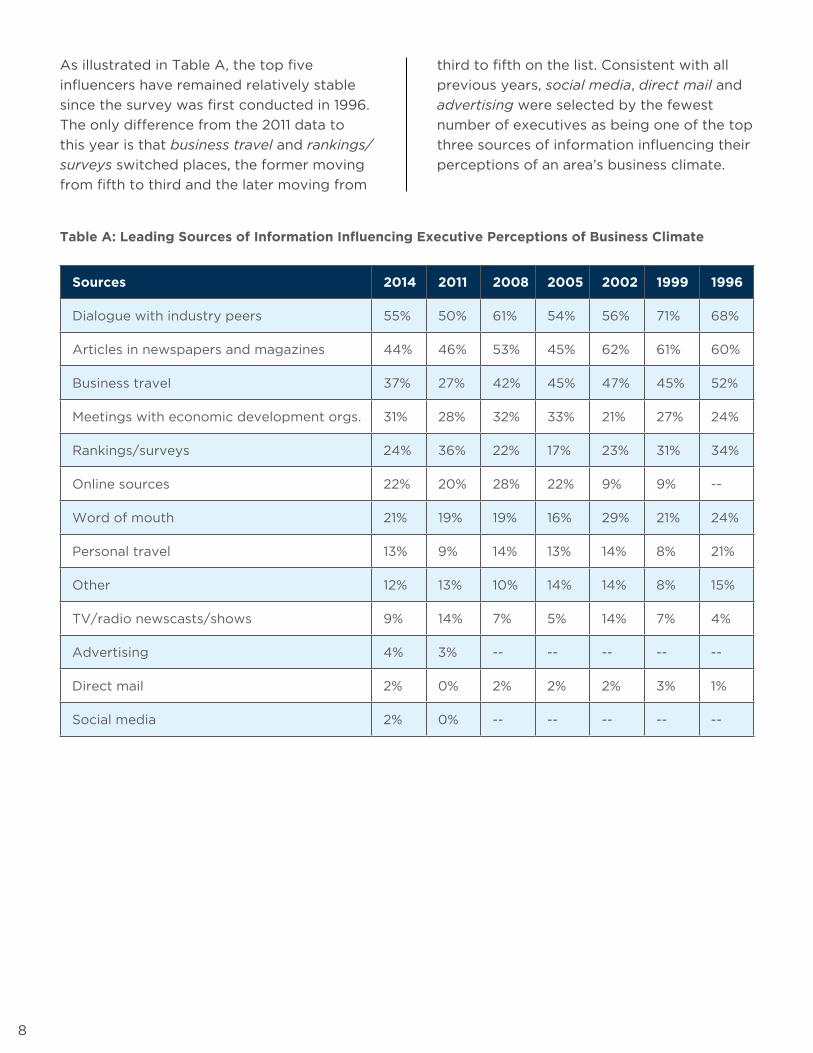
As illustrated in Table A, the top five
influencers have remained relatively stable
since the survey was first conducted in 1996.
The only difference from the 2011 data to
this year is that business travel and rankings/
surveys switched places, the former moving
from fifth to third and the later moving from
third to fifth on the list. Consistent with all
previous years, social media, direct mail and
advertising were selected by the fewest
number of executives as being one of the top
three sources of information influencing their
perceptions of an area’s business climate.
Table A: Leading Sources of Information Influencing Executive Perceptions of Business Climate
Sources 2014 2011 2008 2005 2002 1999 1996
Dialogue with industry peers 55% 50% 61% 54% 56% 71% 68%
Articles in newspapers and magazines 44% 46% 53% 45% 62% 61% 60%
Business travel 37% 27% 42% 45% 47% 45% 52%
Meetings with economic development orgs. 31% 28% 32% 33% 21% 27% 24%
Rankings/surveys 24% 36% 22% 17% 23% 31% 34%
Online sources 22% 20% 28% 22% 9% 9% --
Word of mouth 21% 19% 19% 16% 29% 21% 24%
Personal travel 13% 9% 14% 13% 14% 8% 21%
Other 12% 13% 10% 14% 14% 8% 15%
TV/radio newscasts/shows 9% 14% 7% 5% 14% 7% 4%
Advertising 4% 3% -- -- -- -- --
Direct mail 2% 0% 2% 2% 2% 3% 1%
Social media 2% 0% -- -- -- -- --

9
Leading Sources of Information: Corporate Executives vs. Location Advisors
Do the subgroups of our survey audience
get their information from different sources?
The following chart illustrates how corporate
executives versus location advisors rate the
top six information sources.
As Chart B shows, separating responses
according to the subgroups of the survey
reveals that corporate executives value
dialogue with industry peers as their leading
source of information on an area’s business
climate, whereas location advisors value
meetings with economic development groups
the most in this regard. Additionally, while
corporate executives and location advisors
both value dialogue with industry peers (59%
and 48%, respectively), corporate executives
value meetings with economic development
groups significantly less than do location
advisors (19% versus 52%).
Chart B: Leading Sources of Information Influencing Executive Perceptions of an Area’s Business Climate (Response based on Respondent Type)
Dialogue with industry peers
Articles in newspapers and magazines
Business travel
Meetings with economic development groups
Rankings/surveys
Online sources
CorporateExecutives
Location Advisors
59%
48%
45%
41%
40%
32%
19%
52%
24%
24%
24%
19%

10
Where Are Executives Getting Their News?
Learning the specific sources of news
consumed by business leaders can help
economic development groups to create
more effective marketing programs. For this
reason, we asked respondents who chose
articles in newspapers and magazines, online
sources, rankings/surveys and/or TV and
radio newscasts/shows to indicate specifically
the media in these categories they most
frequently pay attention to. While the results
for TV and radio newscasts/shows were not
statistically significant, the most frequently
cited sources were CNN and Fox News.
The Wall Street Journal, both print and online, tops the list of most influential news outlets.
The Wall Street Journal, once again, ranked at
the top of the newspapers and magazines list,
though the percentage of respondents who
chose the outlet fell from 82% in 2011 to 65%
in 2014. The complete list follows:
65% Wall Street Journal
30% Local Daily Newspaper
24% New York Times
20% The Economist
15% Forbes
7% USA Today
6% Bloomberg Businessweek
6% Financial Times
3% Fast Company
3% Site Selection
3% Fortune
3% Time
Respondents who chose online sources
indicated that WSJ .com is a go-to online
source for information on a location’s
business climate .
26% WSJ .com
17% Google.com
15% Economic Development Agency
Websites
13% Bloomberg .com
11% Bureau of Labor Statistics
11% CNN
11% NYTimes.com
11% Yahoo! Finance
Respondents who chose rankings/surveys
were asked to list the three sources for
surveys and rankings that they pay the most
attention to. The results are as follows:
26% Forbes
21% Site Selection Magazine
16% Area Development
14% Tax Foundation Business Tax
Climate Index
14% Wall Street Journal
5% Bloomberg

11
Best Marketing Techniques From
The Customer’s Perspective
Since 1996, the Winning Strategies
survey has asked respondents to rate
the effectiveness of seven conventional
marketing techniques used by economic
development groups. Respondents rated
each technique (advertising, direct mail,
Internet/website, media relations/publicity,
hosting special events, planned visits to
corporate executives, telemarketing and
trade shows) on a 1 to 5 scale, where 1 equals
“poor” and 5 equals “excellent.” The order in
the chart below is based on the percentage
of responses that were either a 4 or a 5.
Chart C: Most Effective Marketing Techniques (% Rating 4 or 5 on a 5-Point Scale)
Internet/website
Planned visits to corporate executives
Media relations/publicity
Hosting special events
Trade shows
Advertising
Direct mail
Telemarketing
67%
64%
48%
46%
38%
17%
14%
6%

12
Looking at responses over time in Table B,
we see the steady increase in perceptions of
Internet/website as an effective marketing
technique. In 2014, it took the number
one spot over planned visits to corporate
executives, which topped the list in 1996,
1999, 2002, 2005 and 2011.
Table B: Most Effective Marketing Techniques (% Rating 4 or 5 on a 5-Point Scale)
Technique 2014 2011 2008 2005 2002 1999 1996
Internet/website 67% 55% 56% 53% 34% 37% 18%
Planned visits to corporate executives
64% 57% 54% 55% 53% 46% 53%
Media relations/publicity 48% 33% 52% 50% 40% 38% 39%
Hosting special events 46% 35% 45% 49% 37% 42% 39%
Trade shows* 38% 35% -- 33% 32% 45% 39%
Advertising 17% 16% 15% 20% 21% 19% 19%
Direct mail 14% 15% 19% 23% 33% 25% 25%
Telemarketing 6% 4% 4% 6% 4% 6% 7%
*Trade shows was inadvertently excluded in the 2008 survey.
Separating responses according to the
three subgroups of the survey pool (large
company, midsize company and location
advisors) reveals that executives from
midsize companies (71%) find Internet/
website to be the most effective marketing
technique for economic development groups,
whereas location advisors select planned
visits to corporate executives (81%). Large
company executives are relatively split
between these two, with a slight preference
for Internet/website (57% vs. 56%). Media
relations/publicity and hosting special events
were also frequently given a 4 or a 5 by
location advisors .
The “customer” agrees: the Internet has become an increasingly effective marketing tool for economic development organizations.

13
Chart D: Most Effective Marketing Techniques (% Rating 4 or 5 on a 5-Point Scale) (Response based on Respondent Type)
Advertising
Direct mail
Internet/website
Media relations/publicity
Hosting special events
Planned visits to corporate executives
Trade shows
Telemarketing
24%
71%
37%
30%
50%
9%
42%
13%
57%
39%
30%
56%
2%
43%
12%
15%
4%
20%
65%
62%
72%
81%
5%
28%
Location Advisor
Large Company
Midsize Company

14
The Web And Site
Selection
As indicated by the 2011 data and further
reinforced by this year’s findings, the Internet
has become an instrumental part of the site
selection process. When asked to indicate,
on a scale of 1 to 5, where 1 is Not at all and 5
is Often, how often they used the Internet in
their last site search, 66% of the executives
responded with a 4 or 5—an increase of 18%
since 2011. The following chart shows the
distribution of responses.
Chart E: Frequency of Internet Use in Most Recent Site Location Search
Not at all Often
Not at all Often
Not at all Often
1 52 3 4
14%7% 12% 20% 46%
1 52 3 4
12%4% 14% 15% 56%
71%
1 52 3 4
17%10% 11% 23% 39%
62%
Just as was indicated by 2011 data, location
advisors use the Internet in their site
selection search slightly more than do
corporate executives. Approximately 56%
of location advisors selected the highest
ranking of 5 when responding to this
question versus 39% of corporate executives.
Overall, both groups use the Internet in the
site selection process relatively frequently,
with 71% of location advisors and 62% of
corporate executives selecting either a 4 or a
5 in response to this question.
Chart F: Frequency of Internet Use in Most Recent Site Location SearchNot at all Often
Not at all Often
Not at all Often
1 52 3 4
14%7% 12% 20% 46%
1 52 3 4
12%4% 14% 15% 56%
71%
1 52 3 4
17%10% 11% 23% 39%
62%
All
Location Advisors
Corporate Executives
Corporate executive use of the Internet for site searches jumped by 18% since 2011.
15
First Contact:When Site
Selectors Turn To Economic Development
Groups
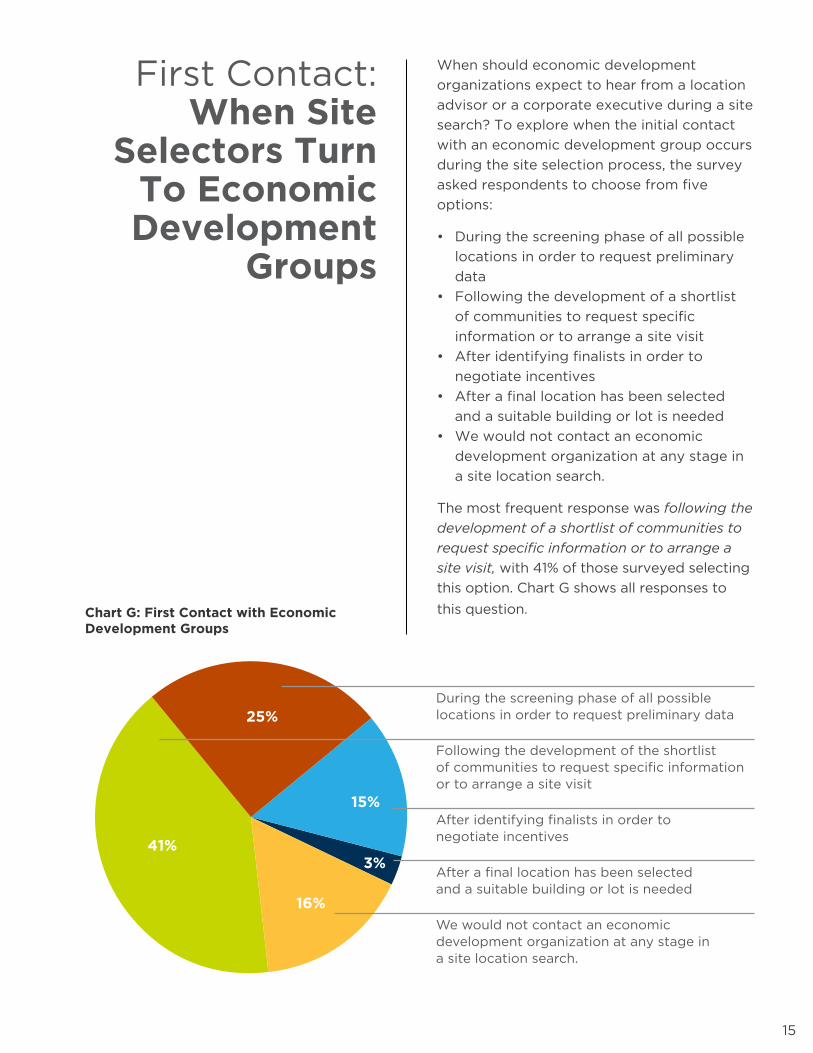
When should economic development
organizations expect to hear from a location
advisor or a corporate executive during a site
search? To explore when the initial contact
with an economic development group occurs
during the site selection process, the survey
asked respondents to choose from five
options:
• During the screening phase of all possible
locations in order to request preliminary
data
• Following the development of a shortlist
of communities to request specific
information or to arrange a site visit
• After identifying finalists in order to
negotiate incentives
• After a final location has been selected
and a suitable building or lot is needed
• We would not contact an economic
development organization at any stage in
a site location search .
The most frequent response was following the
development of a shortlist of communities to
request specific information or to arrange a
site visit, with 41% of those surveyed selecting
this option. Chart G shows all responses to
this question .
During the screening phase of all possible locations in order to request preliminary data
Following the development of the shortlist of communities to request specific information or to arrange a site visit
After identifying finalists in order to negotiate incentives
After a final location has been selected and a suitable building or lot is needed
We would not contact an economic development organization at any stage in a site location search.
25%
41%
16%
15%
3%
Chart G: First Contact with Economic Development Groups

16
For the fourth consecutive time, responses
indicate that location advisors and corporate
executives are most likely to contact
economic development organizations for
the first time following the development
of a shortlist in order to request specific
information or to arrange a visit . Based on
the data in Table C, corporate executives and
their advisors continue to contact economic
development organizations later in the site
selection process or in some cases not at all.
The percentage of respondents who would
not contact an economic development
organization doubled from 2008 to 2011, and
remained stable in 2014.
Table C: First Contact with Economic Development Groups (Response over Time)
Timing of First Contact
2014 2011 2008 2005
During the screen-ing phase of all possible locations in order to request preliminary data
25% 24% 29% 27%
Following the development of the shortlist of com-munities to request specific information or to arrange a site visit
41% 40% 40% 48%
After identifying finalists in order to negotiate incentives
15% 13% 18% 15%
After a final location has been selected and a suitable building or lot is needed
3% 6% 5% 2%
We would not con-tact an economic development organization at any stage in a site location search .
16% 17% 8% 8%
Economic development groups continue to play an important role after a shortlist has been developed.
Consistent with findings of previous years,
location advisors are more likely to utilize
the services of an economic development
organization (none indicated they would
not contact an economic development
organization at any stage), and are more
likely to contact an organization earlier in the
site selection process.
Chart H: First Contact with Economic Development Groups (Response based on Respondent Type)
During the screening phase
Following the development of the shortlist
After identifying finalists
After a final location has been selected
We would not contact an economic development organization at any stage
CorporateExecutives
Location Advisors
24%
27%
31%
64%
17%
9%
5%
0%
23%
0%

17
Often, an executive’s first contact with an
economic development organization is
through the organization’s website. Regarding
the likelihood of visiting an economic
development organization’s website during
their next site location search, 63% of
respondents indicated a 4 or 5 on a scale of
1 to 5, where 1 is Low and 5 is High . Chart I
shows the distribution of all responses.
Chart J shows the change over time since
the question was first asked in 2002. The
percentage of executives planning to visit
an economic development organization’s
website in their next location search dipped
from 64% in 2008 to 47% in 2011 and rose
again to 63% in 2014.
The use of economic development websites by corporate executives in a site search jumped back up to 63% in the 2014 survey.
Not at all Often1 52 3 4
9%12% 16% 23% 40%
39%
2002
65%
2005
64%
2008
47%
2011
63%
2014
Chart J: Likelihood of Visiting Economic Development Organizations’ Websites During Next Site Search (% Rating 4 or 5 on a 5-Point Scale) (Response over Time)
Chart I: Likelihood of Visiting Economic Development Organizations’ Websites During Next Site Search

18
As Chart K shows, location advisors are more
likely to visit an economic development
organization’s website than the corporate
respondents.
Age does not appear to be a significant
factor in the likelihood of visiting an
economic development organization’s
website during a site location search.
In a counter-intuitive finding, the ends of the
age spectrum — executives 39 and younger
and executives 60 and older — are more
likely to visit an economic development
website than executives in the 40-49 and
50-59 age range.
Chart K: Likelihood of Visiting Economic Development Organizations’ Websites During Next Site Search (Distribution of Responses on a 1-5 Scale) (Response based on Respondent Type)
53%
Not at all Often
Not at all Often
1 52 3 4
11%19% 17% 28% 25%
1 52 3 4
8%1% 15% 17% 62%
79%
Table F: Likelihood of Visiting Economic Development Organizations’ Websites During Next Site Search (Distribution of Responses on a 1-5 Scale) (Response based on Respondent Age)
Under 39 years 40 - 49 50 - 59 Over 60 years
1 4% 16% 11% 14%
2 4% 8% 11% 7%
3 27% 18% 19% 9%
4 27% 28% 21% 26%
5 38% 30% 38% 44%
“4” or “5” 65% 58% 59% 70%
CorporateExecutives
LocationAdvisors

19
Website Design: Important
Information For Site Selectors
How can economic development organization
websites be more effective in supplying
relevant information to location advisors and
corporate executives? In order to get the
answer to this question, we asked respondents
to indicate which features are most important
to the usefulness of an economic development
organization’s website. The survey presented
14 features that are commonly included in
the design of an economic development
organization’s website:
• Comparisons to competitor locations (e.g.
cost comparisons)
• Searchable database of available buildings
and sites
• Demographic information (e.g. population,
income, age distribution, educational
attainment)
• Incentives information
• Major employer list
• Educational institution information (K-12
and post-secondary)
• Maps of the community
• Current press releases/announcements
• Quality of life information (e.g. cost of
living, cultural/recreational opportunities)
• Target industries and related information
• Testimonials from local companies
• Video content
• Workforce statistics (e.g. labor force,
employment by industry/occupation)
• Staff contact information
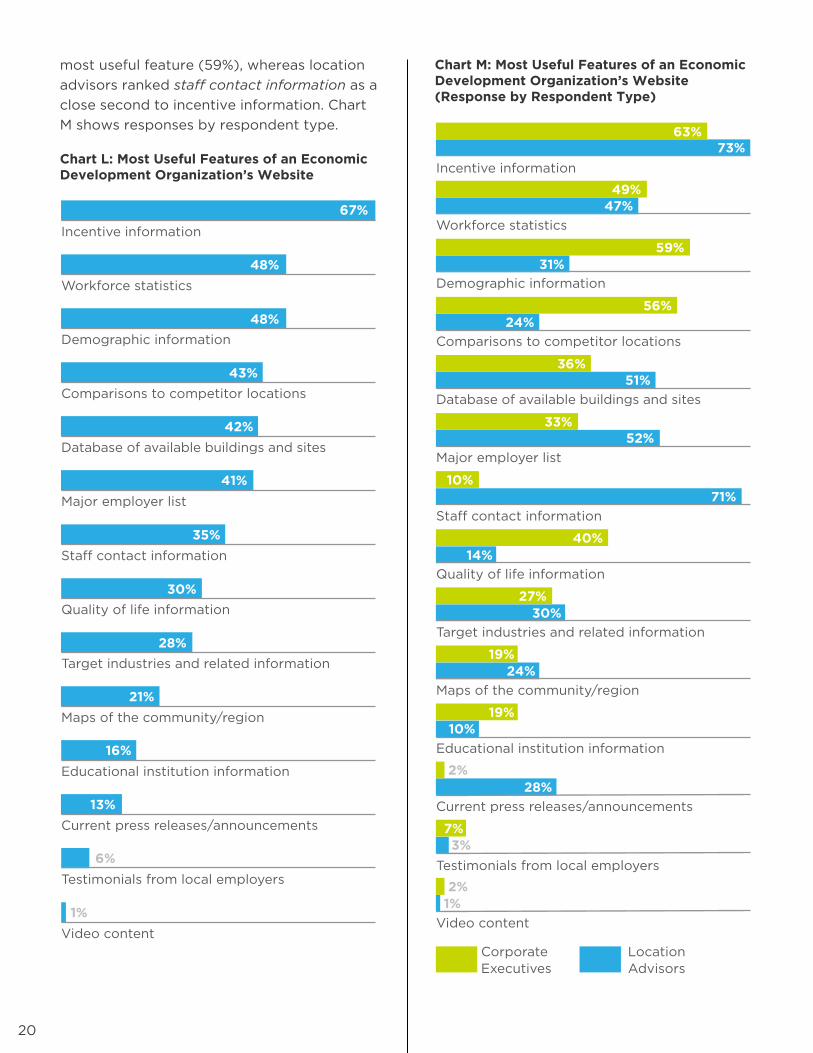
Incentives information was selected by 67%
of respondents, workforce statistics by 48%
and demographic information by 46%. The
responses remained remarkably consistent
with results from past years. Chart L on page
20 shows all responses.
Comparing the survey’s subgroups shows
that both location advisors (73%) and
corporate executives (63%) find incentive
information to be the most useful feature of
an economic development organization’s
website. Corporate executives find
demographic information to be the second
20
most useful feature (59%), whereas location
advisors ranked staff contact information as a
close second to incentive information . Chart
M shows responses by respondent type.
Chart L: Most Useful Features of an Economic Development Organization’s Website
Incentive information
Workforce statistics
Demographic information
Comparisons to competitor locations
Database of available buildings and sites
Major employer list
Staff contact information
Quality of life information
Target industries and related information
Maps of the community/region
Educational institution information
Current press releases/announcements
Testimonials from local employers
Video content
67%
48%
48%
43%
42%
41%
35%
30%
28%
21%
16%
13%
6%
1%
Chart M: Most Useful Features of an Economic Development Organization’s Website (Response by Respondent Type)
Incentive information
Workforce statistics
Demographic information
Comparisons to competitor locations
Database of available buildings and sites
Major employer list
Staff contact information
Quality of life information
Target industries and related information
Maps of the community/region
Educational institution information
Current press releases/announcements
Testimonials from local employers
Video content
CorporateExecutives
Location Advisors
73%
47%
31%
24%
51%
52%
71%
14%
30%
24%
10%
28%
3%
1%
63%
49%
59%
56%
36%
33%
10%
40%
27%
19%
19%
2%
7%
2%

21
Social Media And Executive
Decision Makers
For the second time, Winning Strategies
asked location advisors and corporate
executives which social media channels they
currently use for business purposes. The
survey presented seven options: blog forums,
Facebook, LinkedIn, Twitter, YouTube, other
social media channels and I do NOT use social
media for business. Respondents were asked
to check all that apply. Just as 2011 data
revealed, LinkedIn is the most widely used
social media outlet for business, with 74% of
all respondents selecting this option. Chart N
shows the full distribution of responses.
Chart N: Social Media Channels Used for Business
Blog forums
I do NOT use social media for business purposes
YouTube
Other
74%
24%
23%
22%
21%
17%
2%
The percentage of executives who do not
use social media for business (21%) has
decreased since 2011, when 38% indicated
that this option was true. Additionally,
corporate executives indicated using all
social media platforms for business—except
LinkedIn—more than or equal to location

22
advisors. Twitter and Facebook traded
places in 2014 versus 2011. Chart O shows all
responses by subgroup.
Chart O: Social Media Channels Used for Business (Response based on Respondent Type)
Blog forums
I do NOT use social media for business purposes
YouTube
Other
CorporateExecutives
Location Advisors
72%
77%
24%
24%
26%
17%
28%
11%
21%
20%
20%
9%
4%
0%
When comparing the use of social media
for business purposes among different age
groups, several patterns emerge. Since
2011, 30-somethings have increased their
use of Facebook for business purposes,
while 40-somethings have increased their
use of Twitter. Among all age groups, the
percentage of people who do not use social
media for business purposes has decreased,
whereas the use of LinkedIn has increased.
Chart P: Social Media Channels Used for Business (Response based on Respondent Age)
Blog forums
YouTube
Other
I do NOT use social media for business purposes
Under 39 40-49
50-59 60 and over
78%
61%
88%
74%
31%
13%
63%
24%
24%
22%
25%
29%
26%
4%
25%
34%
21%
17%
25%
24%
2%
0%
0%
11%
19%
35%
0%
18%

23
Best And Worst Places For
Business
DCI’s research on which states are winning
the “perception” contest has consistently
received intense attention from both the
news media and the economic development
community .
This year, in order to broaden the scope
of our study, we also gauged executives’
perceptions of non-U.S. locations as
candidates for their company’s potential
international expansion.
To determine U.S. state rankings, we asked
survey respondents to name three states
perceived as having the most favorable
business climates in the United States . We
also asked the same audience to select the
three states they perceive as having the
least favorable business climates among the
50 states.
Tax climate, pro-business environment and incentives are among those factors associated with winning states.
Overall, in the state rankings, respondents
selected Texas (49.7%) as having the most
favorable business climate, followed by
Florida (18.1%), Georgia and North Carolina
(17.6%), which tied for third place, South
Carolina (12.6%) and Tennessee (11.6%).
The top five responses are:
1 . Texas 49.7%
2 . Florida 18.1%
3 .Georgia
North Carolina17.6%
4 . South Carolina 12.6%
5 . Tennessee 11.6%
Why did the respondents select these states?
What qualities are associated with a winning
business climate? We asked respondents to
tell us in an open-ended question.
TIE

24
Among those who named Texas as having
a favorable business climate, the factors
mentioned most frequently were tax climate
(54%), pro-business environment (47%) and
incentives/financial assistance (18%).
Those who named Florida as having a
favorable business climate also frequently
mentioned tax climate (47%) and pro-
business environment (33%) as factors in
their positive perception of the state.
Since DCI began conducting this survey in 1996, the states in the top five have been relatively stable.
Those who named Georgia pointed to its
pro-business environment (34%), incentives
(31%) and workforce quality and availability
(31%) as indicators of its favorable business
climate. North Carolina was noted for its
pro-business environment (31%), workforce
quality and availability (31%) and its low
overall operating costs (25%).
Since DCI began conducting this survey in
1996, the states in the top five have been
relatively stable. Texas has held the #1 spot
since 1999, while North Carolina, which held
the #2 spot from 2002 to 2011, dropped
to third place. In a tie with Geogia, North
Carolina received 17% of the votes compared
to 27% in 2011 and 30% in 2008. Although
only 1% separated the second and third slots,
Florida jumped from #5 in 2011 to #2 in 2014
with 18% of respondents indicating it as the
best state for business in the current survey .
South Carolina, which was fourth this year,
was sixth in 2008 and third in 2002, 2005,
and 2011. Tennessee, which fell to fourth
place in 2008 and 2011, dropped to fifth
place. Table D presents how states have
ranked in the top five since 1996.
Table D: Most Favorable Business Climate (Response over Time)
2014 2011 2008 2005 2002 1999 1996
Texas50%
Texas49%
Texas 41%
Texas 33%
Texas 25%
Texas 30%
North Carolina 33%
Florida 18%
North Carolina27%
North Carolina 30%
North Carolina 26%
North Carolina 20%
California 22%
Texas 28%
Georgia; North Carolina 17% (tie)
South Carolina14%
Georgia 20%
South Carolina20%
South Carolina 18%
North Carolina 20%
Georgia 27%
South Carolina12%
Tennessee14%
Florida;Tennessee 15% (tie)
Georgia18%
Florida18%
Georgia17%
South Carolina 21%
Tennessee11%
Florida 14%
Nevada14%
Nevada16%
Georgia15%
Florida14%
Tennessee20%

25
States with the Worst Business Climates
The survey results also revealed the states
deemed to have the least favorable business
climates. The top five least favorable states
are identical to those from 2011, except that
Massachusetts traded places with Michigan,
putting the former at number five and the
latter at number six in 2014.
The top 5 responses were:
1 . California 74%
2 . New York 42%
3 . Illinois 34%
4 . New Jersey 16%
5 . Massachusetts 11%
In an open-ended question, respondents
were asked to explain why they perceive
certain states as having unfavorable business
climates . Overall, taxes was the reason listed
most frequently .
California was cited for having high taxes by
46% of respondents, while 43% said it was
too highly regulated . Cost/expense (29%)
and anti-business climate (15%) were also
mentioned in reference to the state .
Among those who named New York as
having an unfavorable business climate, 59%
listed taxes and 40% listed cost of living
and business as reasons for their negative
perceptions, while 24% of respondents said
the state is too highly regulated .
High taxes were the factor most frequently associated with states perceived as having unfavorable business climates.
Illinois’ taxes (44%), dysfunctional/corrupt
government (37%), cost/expense (17%) and
regulations/permitting (12%) earned the
state its position on the list of least favorable
business climates .
The list of states with the least favorable
business climates has remained remarkably
consistent over the years . California and
New York have swapped the first and
second place spots on this list since DCI first
conducted the survey in 1996, with California
in first place and New York in second place
since 2002. Massachusetts dropped out of
the top 5 in 2011 for the first time since 1996,
but re-joined the list in 2014. Table E shows
the changes over time .
Table E: Least Favorable Business Climate (Response over Time)
2014 2011 2008 2005 2002 1999 1996
California74%
California71%
California72%
California66%
California57%
New York29%
New York55%
New York42%
New York47%
New York42%
New York34%
New York36%
California25%
California47%
Illinois34%
Illinois24%
Michigan17%
Mass .22%
Mass .18%
Mass .19%
New Jersey20%
New Jersey16%
New Jersey24%
New Jersey14%
New Jersey21%
New Jersey15%
NewJersey14%
Mass .19%
Mass .11%
Michigan16%
Mass . 12%
Illinois 13%
Florida 10%
Connecticut 10%
Connecticut9%

26
The International Perspective
In 2014, for the first time, DCI expanded on
the previous questions to include international
business climates . We began by asking
respondents to indicate which part of the
world represents the best international growth
opportunity for their companies (Africa, Asia/
Pacific, Western Europe, Latin America, Eastern
Europe, Middle East) and followed up by asking
respondents to list the three specific countries
that they believe would offer the strongest
opportunities for international investment in
the next three years .
Asia/Pacific represents the best international growth opportunity for nearly 41% of corporate executives.
Overall, Asia/Pacific was selected most
frequently, followed by Western Europe .
Africa was not viewed as an opportunity
among any respondents. Chart Q shows the
distribution of responses.
Chart Q: Part of the World with the Best International Growth Opportunity
Asia/Pacific Western Europe Latin America
Eastern Europe Middle East Africa – 0%
41%
5%
19%
5%
29%

27
Executives involved in manufacturing and
those involved in services think differently
when it comes to where they see the most
opportunity for international growth;
manufacturing executives see the Asia/
Pacific region as representing the best
international growth opportunities for
their companies, whereas executives in the
services industry see Western Europe as a
most promising region in this regard.
Chart R: Part of the World with the Best International Growth Opportunity (Responses based on Industry)
20%
8%28%
40%
18%
3%
3%
21%
50%
8%
Manufacturing Executives Responses
Services Executives Responses
Breaking responses down by company size
reveals that large companies are drawn
to the Asia/Pacific region (50%) when it
comes to international growth opportunities,
whereas midsize companies are drawn to
Western Europe (38%).
Chart S: Part of the World with Best International Growth Opportunity (Responses based on Company Size)
50%
2%
20%
6%
22%
32%
6%
38%
8%
17%
Midsize Company Responses
Large Company Responses
Asia/Pacific Western Europe Latin America
Eastern Europe Middle East Africa – 0%

28
Countries with the Strongest International Investment Opportunities
We asked executives to indicate which
countries they believe offer the strongest
international investment opportunities
for their company if they plan to explore
this option in the next three years. The
257 respondents to this question listed 57
countries; China (30%), the United Kingdom
(22%) and Germany (20%) were listed most
frequently .
China tops the list of countries with the strongest international investment opportunities for executives.
1 . China 30%
2 . United Kingdom 22%
3 . Germany 20%
4 . India 17%
5 . Brazil 14%
6 . Singapore 12%
7 . France 11%
8 . Mexico 10%
9 . Canada 7%
10. Australia 6%
Why Executives Explore International Expansion
Next, we asked executives to indicate
the primary drivers for their company’s
international expansion by checking all
that apply from a list of six items: market
access, cost savings, workforce/talent pool,
technology/product partnership, other and
we don’t have any plans for international
expansion . Market access followed by cost
savings was the most frequently checked
item by respondents with potential plans for
international expansion.
Executives identified market access as the primary driver for international expansion.
Chart T: Drivers for International Expansion
Market access Cost savingsWorkforce/
talent pool
OtherTechnology/
product partnership
35%
44%28%
7%
28%
29
The Consultants Speak:
Best Economic Development
Groups
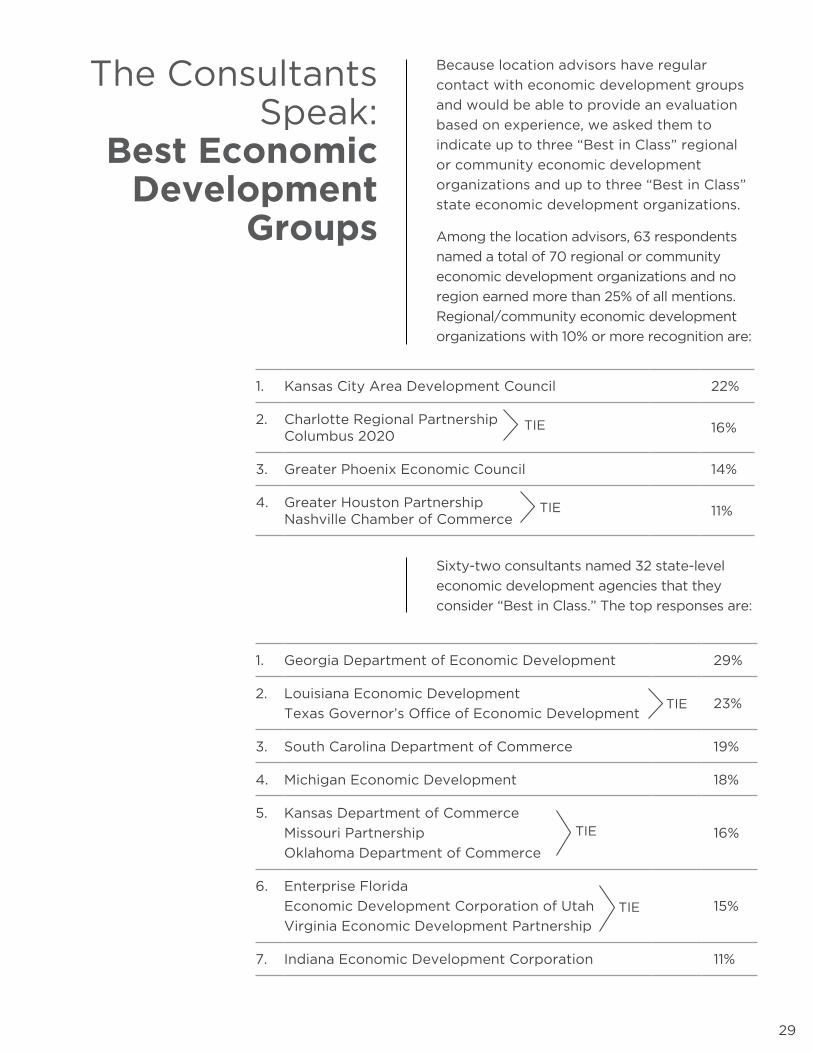
Because location advisors have regular
contact with economic development groups
and would be able to provide an evaluation
based on experience, we asked them to
indicate up to three “Best in Class” regional
or community economic development
organizations and up to three “Best in Class”
state economic development organizations.
Among the location advisors, 63 respondents
named a total of 70 regional or community
economic development organizations and no
region earned more than 25% of all mentions.
Regional/community economic development
organizations with 10% or more recognition are:
Sixty-two consultants named 32 state-level
economic development agencies that they
consider “Best in Class.” The top responses are:
1 . Georgia Department of Economic Development 29%
2 . Louisiana Economic Development
Texas Governor’s Office of Economic Development23%
3 . South Carolina Department of Commerce 19%
4 . Michigan Economic Development 18%
5 . Kansas Department of Commerce
Missouri Partnership
Oklahoma Department of Commerce
16%
6 . Enterprise Florida
Economic Development Corporation of Utah
Virginia Economic Development Partnership
15%
7 . Indiana Economic Development Corporation 11%
TIE
TIE
TIE
1 . Kansas City Area Development Council 22%
2 . Charlotte Regional Partnership Columbus 2020
16%
3 . Greater Phoenix Economic Council 14%
4 . Greater Houston Partnership Nashville Chamber of Commerce
11%TIE
TIE

30
Looking Forward:Projected Location
Decisions In 2014 And 2015
DCI also asked corporate executives about
projected location decisions in 2014 and 2015.
Dipping slightly from 46% in 2011, 44% of
respondents indicated that their company will
make a location decision (move, expansion,
consolidation, etc.) in the next 24 months. An
additional 30% indicated they were not sure,
while 26% said their company would not make
a location decision in the next two years.
Down a notch, 44% of executives expect to make a location decision in the next 24 months.
What types of projects are being planned?
When asked to indicate from five different
facility types, which is the most likely
candidate for a facility change, respondents
most frequently indicated a manufacturing/
production plant (31%) followed by corporate,
division or regional headquarters (25%).
Chart U shows the distribution of responses.
Chart U: Most Likely Facility Type for Next Facility Change
Manufacturing/ production plant
Corporate, division or regional headquarters
Regional sales office or service center
Back office/ shared services facility
Distribution center
Other
25%
31%
11%
12%
5%
16%
31
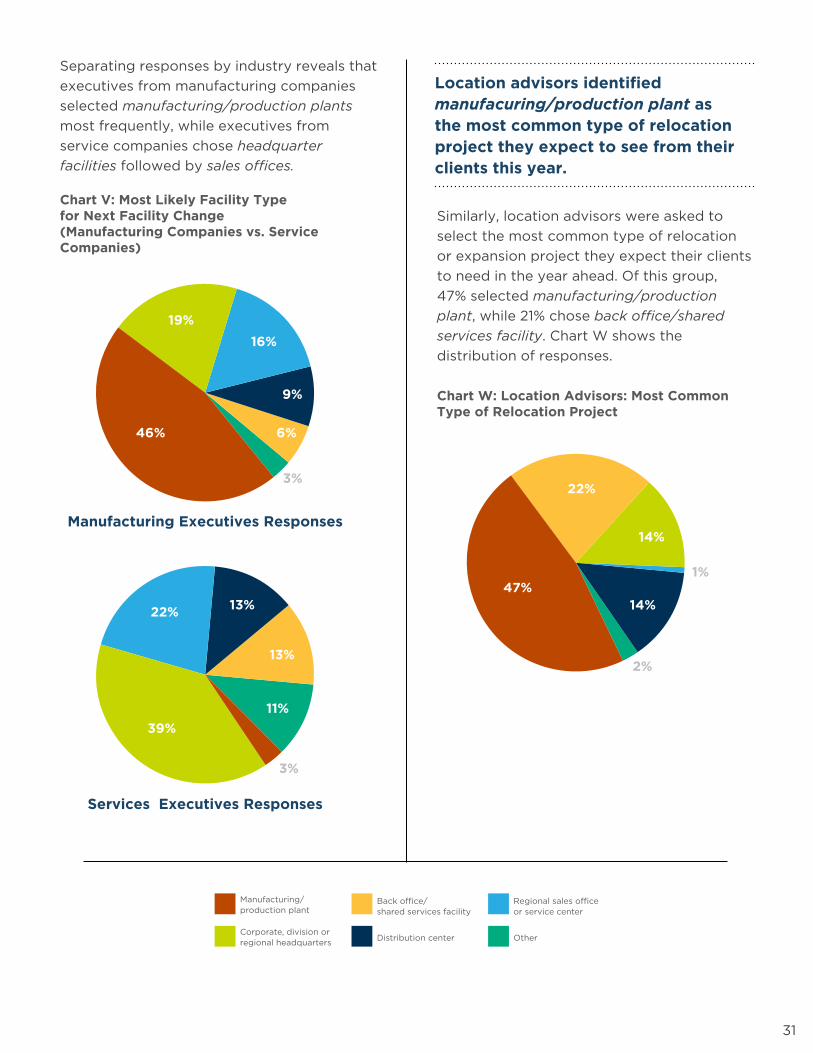
Separating responses by industry reveals that
executives from manufacturing companies
selected manufacturing/production plants
most frequently, while executives from
service companies chose headquarter
facilities followed by sales offices.
Chart V: Most Likely Facility Type for Next Facility Change (Manufacturing Companies vs. Service Companies)
13%
3%
13%
11%
22%
39%
6%46%
16%
19%
3%
9%
Manufacturing Executives Responses
Services Executives Responses
Similarly, location advisors were asked to
select the most common type of relocation
or expansion project they expect their clients
to need in the year ahead. Of this group,
47% selected manufacturing/production
plant, while 21% chose back office/shared
services facility. Chart W shows the
distribution of responses.
Chart W: Location Advisors: Most Common Type of Relocation Project
Manufacturing / production plant
Corporate, division or regional headquarters
Regional sales office or service center
Back office / shared services facility
Distribution center
Other
14%
14%
22%
47%1%
2%
Location advisors identified manufacuring/production plant as the most common type of relocation project they expect to see from their clients this year.
Manufacturing/ production plant
Corporate, division or regional headquarters
Back office/ shared services facility
Distribution center
Regional sales office or service center
Other

32
Outsourcing a Portion of the Site Selection Process
To further understand the corporate site
selection process, we asked corporate
respondents whether they anticipate
outsourcing a portion of the site selection
responsibilities in their next site selection
search. Dropping from 47% in 2011, 40%
answered “yes.”
Forty percent of executives anticipate outsourcing a portion of the site selection responsibilities in their next site selection search.
A higher percentage of large companies
(59%) will outsource a portion of the site
selection responsibilities versus midsized
companies (37%).
Chart X shows what type of individual/
organization would be hired by executives
to assist with both U.S. and international
site searches . In U .S . searches, executives
are most likely to use real estate brokers
followed by site selection consultants. When
conducting international searches, executives
rely most commonly on real estate brokers
followed by lawyers.
Chart X: Professional Likely to Assist Corporate Respondents with Site Search (U.S. vs. International Site Search)
Accountant LawyerSite SelectionConsultant
Real EstateBroker
Other
15%
26%
1%
11%
30%
19%
53%
12%
24%
10%
United States
International

33
A Word About DCI
Development Counsellors International (DCI)
is the leader in marketing places. Since 1960,
we have worked with more than 450 cities,
regions, provinces, states and countries,
helping them attract both investors and
visitors. We specialize exclusively in all
phases of economic development and
tourism marketing .
Our areas of expertise include:
• Editorial Placement/Media Relations
• Lead Generation
• Location Advisor Relationship Building
• Perception Studies (Corporate Executives/
Site Selection Consultants)
• Social/Digital Media
• Media Training
• Talent Attraction Programs
• Special Events
• Marketing Blueprints and Strategies
• Website Development
• Tourism Development
• Crisis Communications
DCI has worked with more economic
development groups than all other marketing
agencies combined. The firm also frequently
forms alliances with local advertising, public
relations and marketing agencies to provide
specialized economic development input.
Interested in learning more? We’d love
to explore how we might assist your
community:
Andrew T. Levine
President/Chief Creative Officer
Development Counsellors International
215 Park Avenue South
New York, NY 10003
Phone: 212-725-0707 Ext. 107
Fax: 212-725-2254
andy .levine@aboutdci .com
www.aboutdci.com
34
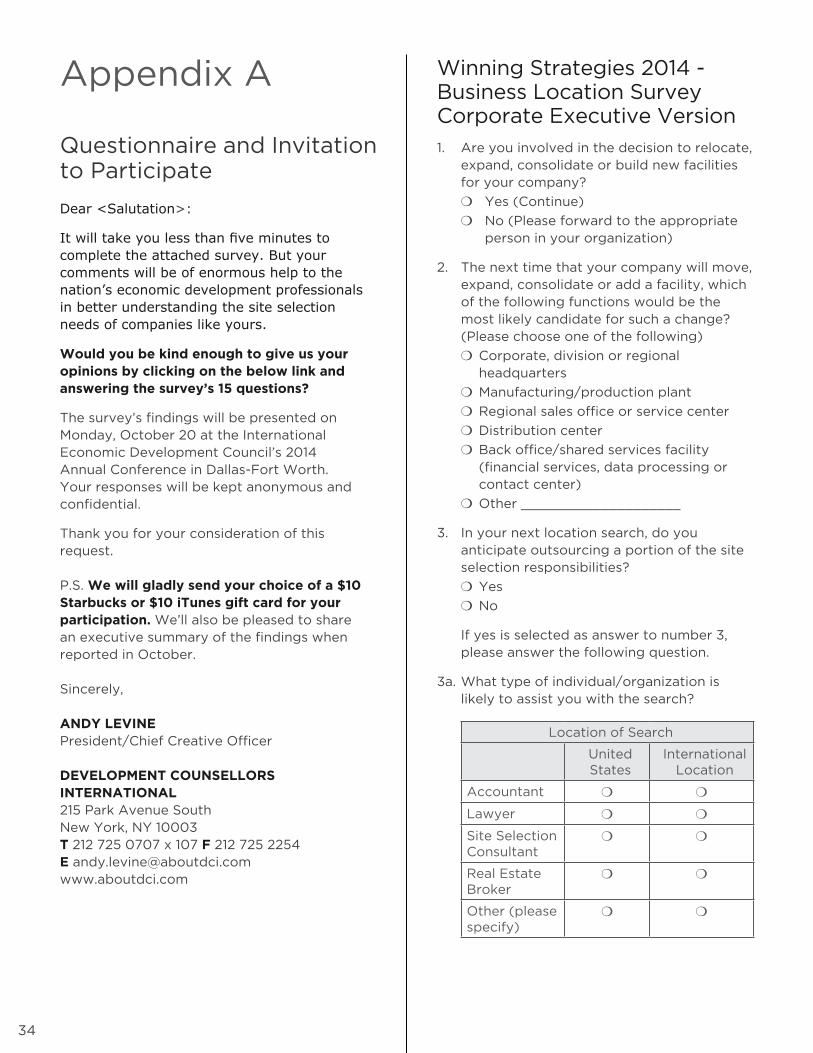
Appendix A
Questionnaire and Invitation to Participate
Dear <Salutation>:
It will take you less than five minutes to complete the attached survey. But your comments will be of enormous help to the nation’s economic development professionals in better understanding the site selection needs of companies like yours.
Would you be kind enough to give us your opinions by clicking on the below link and answering the survey’s 15 questions?
The survey’s findings will be presented on Monday, October 20 at the International Economic Development Council’s 2014 Annual Conference in Dallas-Fort Worth . Your responses will be kept anonymous and confidential.
Thank you for your consideration of this request . P.S. We will gladly send your choice of a $10 Starbucks or $10 iTunes gift card for your participation. We’ll also be pleased to share an executive summary of the findings when reported in October. Sincerely, ANDY LEVINE President/Chief Creative Officer DEVELOPMENT COUNSELLORS INTERNATIONAL 215 Park Avenue South New York, NY 10003 T 212 725 0707 x 107 F 212 725 2254 E andy .levine@aboutdci .com www.aboutdci.com
Winning Strategies 2014 - Business Location Survey Corporate Executive Version
1 . Are you involved in the decision to relocate, expand, consolidate or build new facilities for your company?
❍❍ Yes (Continue)
❍❍ No (Please forward to the appropriate person in your organization)
2. The next time that your company will move, expand, consolidate or add a facility, which of the following functions would be the most likely candidate for such a change? (Please choose one of the following)
❍❍ Corporate, division or regional headquarters
❍❍ Manufacturing/production plant
❍❍ Regional sales office or service center
❍❍ Distribution center
❍❍ Back office/shared services facility (financial services, data processing or contact center)
❍❍ Other ____________________
3 . In your next location search, do you anticipate outsourcing a portion of the site selection responsibilities?
❍❍ Yes
❍❍ No
If yes is selected as answer to number 3, please answer the following question.
3a. What type of individual/organization is likely to assist you with the search?
Location of Search
United States
International Location
Accountant ❍ ❍
Lawyer ❍ ❍
Site Selection Consultant
❍ ❍
Real Estate Broker
❍ ❍
Other (please specify)
❍ ❍

35
4. In general, at what stage in a site selection
search do you FIRST contact economic
development organizations?
❍❍ During the screening phase of all possible
locations in order to request preliminary
data
❍❍ Following the development of the
shortlist of communities to request
specific information or to arrange a site
visit
❍❍ After identifying finalists in order to
negotiate incentives
❍❍ After a final location has been selected
and a suitable building or lot is needed
❍❍ We would not contact an economic
development organization at any stage in
a site location search
5. Please indicate the three U.S. states with
business climates you perceive as MOST
FAVORABLE, and then briefly indicate why.
State #1 ____________________________
Reason for State #1 __________________
State #2 ___________________________
Reason for State #2 __________________
State #3 ___________________________
Reason for State #3 __________________
6. Please indicate the three U.S. states with
business climates you perceive as LEAST
FAVORABLE, and then briefly indicate why.
State #1 ____________________________
Reason for State #1 __________________
State #2 ___________________________
Reason for State #2 __________________
State #3 ___________________________
Reason for State #3 __________________
7. What part of the world represents
the best INTERNATIONAL
GROWTH opportunity for your company?
(please select one)
❍❍ Africa
❍❍ Asia/Pacific
❍❍ Eastern Europe
❍❍ Latin America
❍❍ Middle East
❍❍ Western Europe
8. If you are exploring international investment in the next three years, what COUNTRIES do you believe offer the strongest investment opportunities for your company?
1 __________________________________
2 __________________________________
3__________________________________
9. What are the primary drivers for your company’s INTERNATIONAL expansion? (check all that apply)
❍❍ Market access
❍❍ Cost savings
❍❍ Workforce/talent pool
❍❍ Technology/product partnership
❍❍ Other ______________________
❍❍ We don’t have any plans for international expansion
10. In light of your responses to the previous questions, what are the three leading sources of information influencing your perceptions of an area’s business climate?
❍❍ Advertising
❍❍ Articles in newspapers and magazines
❍❍ Business travel
❍❍ Dialogue with industry peers
❍❍ Direct mail
❍❍ Meetings with economic development groups
❍❍ Rankings/surveys
❍❍ Online sources
❍❍ Personal travel
❍❍ Social media
❍❍ TV and radio newscasts/shows
❍❍ Word of mouth
❍❍ Other ____________________
In light of your responses to the previous questions, please answer one or more of the following questions.
10a. What type of advertising do you view as the most effective?
❍❍ Online
❍❍ Radio
❍❍ Television

36
10b. What newspapers and magazines do you read most frequently?
1 __________________________________
2 __________________________________
3 __________________________________
10c. What specific rankings/surveys do you pay the most attention to?
1 __________________________________
2 __________________________________
3__________________________________
10d. What online sources do you view most frequently?
1 __________________________________
2 __________________________________
3__________________________________
10e. What television and radio newscasts do you listen to or view most frequently?
1 __________________________________
2 __________________________________
3__________________________________
11. Please check all social media channels that you currently use for business purposes.
❍❍ Blog forums
❍❍ YouTube
❍❍ Other ____________________
❍❍ I do NOT use social media for business purposes
12 . In your most recent site location search, how often did you use the Internet as a source of community information?
❍❍ 1 (Not at all)
❍❍ 2
❍❍ 3
❍❍ 4
❍❍ 5 (Often)
13. What is the likelihood that you will visit an economic development organization’s website during your next site location search?
❍❍ 1 (Not likely)
❍❍ 2
❍❍ 3
❍❍ 4
❍❍ 5 (Extremely likely)
14. Which of the following features do you consider most important to the utility of an economic development organization’s website? (Please select up to five responses)
❍❍ Comparisons to competitor locations (e.g. cost comparisons)
❍❍ Searchable database of available buildings and sites
❍❍ Demographic information (e.g. population, income, age distribution, educational attainment)
❍❍ Incentive information
❍❍ Major employer list
❍❍ Educational institution information (K-12 and post-secondary)
❍❍ Maps of the community/region
❍❍ Current press releases/announcements
❍❍ Quality of life information (e.g. cost of living, cultural/recreational opportunities)
❍❍ Staff contact information
❍❍ Target industries and related information
❍❍ Testimonials from local employers
❍❍ Video content
❍❍ Workforce statistics (e.g. labor force, employment by industry/occupation)
15. Please rate the effectiveness of the following marketing techniques as a means of influencing your opinion when considering a new location.
1 2 3 4 5 Don’t Know
POOR ↔ EXCELLENT
Advertising ❍ ❍ ❍ ❍ ❍ ❍
Direct Mail ❍ ❍ ❍ ❍ ❍ ❍
Internet/ Website
❍ ❍ ❍ ❍ ❍ ❍
Media Relations/ Publicity
❍ ❍ ❍ ❍ ❍ ❍

37
1 2 3 4 5 Don’t Know
Hosting Special Events
❍ ❍ ❍ ❍ ❍ ❍
Planned Visits to Corporate Executives
❍ ❍ ❍ ❍ ❍ ❍
Telemarketing ❍ ❍ ❍ ❍ ❍ ❍
Trade Shows ❍ ❍ ❍ ❍ ❍ ❍
Business Classification: The last few questions will help classify your business. All data will be confidential.
C1. Which of the following best describes your primary business?
❍❍ Manufacturing
❍❍ Services
C2. What was the gross revenue last year for your company, including all plants, divisions, branches and subsidiaries?
❍❍ Less than $25 million
❍❍ $25 - $49 million
❍❍ $50 - $99 million
❍❍ $100 - $249 million
❍❍ $250 million - $499 million
❍❍ $500 million and higher
C3. Will your company make a location decision (move, expansion, consolidation, etc.) in the next 24 months?
❍❍ Yes
❍❍ No
❍❍ Not sure
C4. Please provide your age.
❍❍ Under 30 years
❍❍ 30 - 39
❍❍ 40 - 49
❍❍ 50 - 59
❍❍ Over 60 years
C5. Gender
❍❍ Male
❍❍ Female
Thank you for completing this survey. All responses will be kept confidential and you are not required to provide your name. But should you wish to receive a $10 Starbucks or a $10 iTunes card, please provide your contact information and your choice of gift card below. If you do not wish to provide your contact information, simply submit your survey.
In addition to your gift card, we would also be happy to send you an executive summary of the results after the research has been released in October 2014. Simply check the box below if you would like to receive the results.
Name _________________________________
Title __________________________________
Organization ___________________________
Street Address _________________________
City __________________________________
State _________________________________
Zip Code ______________________________
Email Address __________________________
Please send me:
❍❍ $10 Starbucks Card
❍❍ $10 iTunes Card
Please send me:
❍❍ An executive summary of the report

38
Appendix BMost Favorable Business Climate Rankings for All States
%
Texas 49.7%
Florida 18.1%
Georgia 17.6%
North Carolina 17.6%
South Carolina 12.6%
Tennessee 11.6%
California 11.1%
Indiana 10.6%
New York 10.6%
Louisiana 9.0%
Virginia 9.0%
Utah 8.5%
Nevada 8.0%
Ohio 6.0%
Arizona 5.5%
New Jersey 5.0%
South Dakota 5.0%
Colorado 4.5%
Michigan 4.5%
Oklahoma 4.5%
Pennsylvania 4.5%
Delaware 4.0%
Alabama 3.0%
Kansas 3.0%
%
Massachusetts 3.0%
Missouri 3.0%
Washington 3.0%
Illinois 2.5%
Mississippi 2.5%
Oregon 2.0%
Connecticut 1.5%
North Dakota 1.5%
Wisconsin 1.5%
Wyoming 1.5%
Arkansas 1.0%
Idaho 1.0%
Iowa 1.0%
Kentucky 1.0%
Maryland 1.0%
Nebraska 1.0%
District of Columbia 0.5%
Hawaii 0.5%
Maine 0.5%
Minnesota 0.5%
Montana 0.5%
New Hampshire 0.5%
New Mexico 0.5%
Vermont 0.5%
Note: Three states were not named by any respondents as having the most favorable business climate .

39
Appendix CLeast Favorable Business Climate Rankings for All States
%
California 74.1%
New York 41.8%
Illinois 34.4%
New Jersey 15.9%
Massachusetts 10.6%
Michigan 6.9%
Connecticut 5.8%
Texas 5.8%
Florida 5.3%
Alaska 4.8%
Hawaii 4.8%
Arizona 4.2%
Rhode Island 4.2%
Mississippi 3.7%
North Dakota 3.7%
Maryland 3.2%
Oregon 3.2%
Washington 3.2%
Ohio 2.6%
Arkansas 2.1%
Minnesota 2.1%
Montana 2.1%
Pennsylvania 2.1%
Idaho 1.6%
%
Louisiana 1.6%
Nevada 1.6%
North Carolina 1.6%
Vermont 1.6%
West Virginia 1.6%
Wisconsin 1.6%
Alabama 1.1%
Colorado 1.1%
Iowa 1.1%
New Mexico 1.1%
Wyoming 1.1%
Georgia 0.5%
Kansas 0.5%
Kentucky 0.5%
Maine 0.5%
Nebraska 0.5%
New Hampshire 0.5%
South Carolina 0.5%
South Dakota 0.5%
District of Columbia 0.5%
Note: Seven states were not named by any respondents as having the least favorable business climate .
40
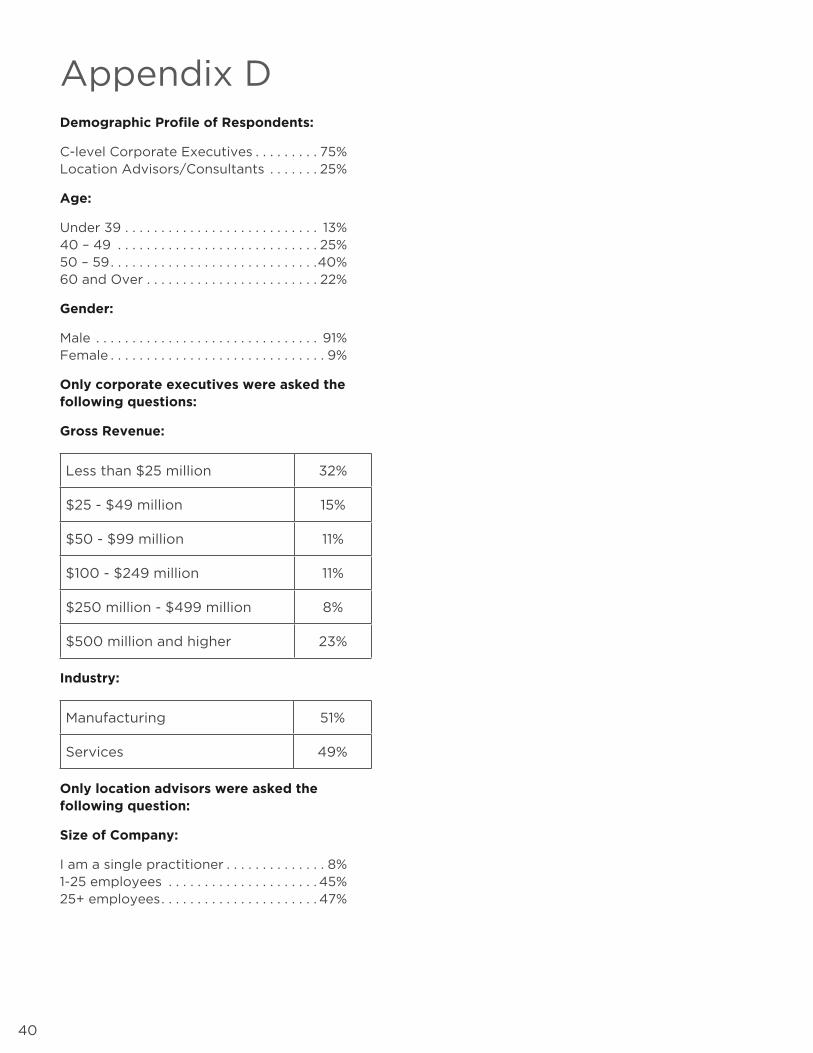
Appendix DDemographic Profile of Respondents:
C-level Corporate Executives . . . . . . . . . 75% Location Advisors/Consultants . . . . . . . 25%
Age:
Under 39 . . . . . . . . . . . . . . . . . . . . . . . . . . . 13%40 – 49 . . . . . . . . . . . . . . . . . . . . . . . . . . . . 25%50 – 59 . . . . . . . . . . . . . . . . . . . . . . . . . . . . .40%60 and Over . . . . . . . . . . . . . . . . . . . . . . . . 22%
Gender:
Male . . . . . . . . . . . . . . . . . . . . . . . . . . . . . . . 91%Female . . . . . . . . . . . . . . . . . . . . . . . . . . . . . . 9%
Only corporate executives were asked the following questions:
Gross Revenue:
Less than $25 million 32%
$25 - $49 million 15%
$50 - $99 million 11%
$100 - $249 million 11%
$250 million - $499 million 8%
$500 million and higher 23%
Industry:
Manufacturing 51%
Services 49%
Only location advisors were asked the following question:
Size of Company:
I am a single practitioner . . . . . . . . . . . . . . 8%1-25 employees . . . . . . . . . . . . . . . . . . . . . 45%25+ employees . . . . . . . . . . . . . . . . . . . . . . 47%

Development Counsellors International
NEW YORK
215 Park Avenue South
New York, NY 10003
(212) 725-0707
DENVER
1786 Platte Street
Denver, CO 80202
(303) 627-0272
TORONTO
243 Queen Street West
Toronto, ON M5V 1Z4
(416) 362-0808
LOS ANGELES
5670 Wilshire Boulevard
Los Angeles, CA 90036
(323) 648-6629
www.aboutdci.com