winning in january 2012 review
TRANSCRIPT

Efficient Consumer Response Australasia
Winning in January
2012 Review

Efficient Consumer Response Australasia
Winning in January 2012 Review
PAGE 2 OF 20
Contents
Acknowledgements………………………………………………………. 3
Introduction………………………………………………………………… 4
January 2012……………………………………………………………….. 5
Results – January 2012…………………………………………………….. 6
Feature: On Shelf Availability - Global Information…………………. 8
Next Steps…………………………………………………………………… 12
Appendix 1 – Winning in January Tools……………………………….. 13
Appendix 2 – Retailer Results Summer 2012……………………..…… 15

Efficient Consumer Response Australasia
Winning in January 2012 Review
Acknowledgements
The Secretariat would like to thank ECRA Board members for continuing to drive focus, deliver best practice and support the
Efficient Consumer Response Australasia
Winning in January 2012 Review
Acknowledgements
The Secretariat would like to thank ECRA Board members for continuing to drive focus, deliver best practice and support the Winning in January initiative.
PAGE 3 OF 20
The Secretariat would like to thank ECRA Board members for continuing to drive focus,

Efficient Consumer Response Australasia
Winning in January 2012 Review
PAGE 4 OF 20
Introduction
Product availability in January has been a challenge for the fast moving consumer goods industry for years for both retailers and suppliers. For many, January service levels have suffered in comparison to Christmas, and as a result have seen poor product availability; lost sales; stock outs on shelf and a less than satisfactory offering for the consumer. In early 2009, the Board of Efficient Consumer Response Australasia (ECRA) identified improving January service levels between suppliers and retailers and between retailers and their stores as a major opportunity for the industry players to collaborate under the banner of Winning in January. The following ECRA report is the culmination of the industry focus for 2009, 2010, 2011 and 2012 providing a fact based set of key industry results, findings and next steps. ECRA remains committed to working with industry to further improve On Shelf Availability (OSA) and as such we anticipate further reports to be generated in subsequent years. This year’s report should be used to inform your business, prepare for 2013 and act as a catalyst for further discussion with your trading partners.

Efficient Consumer Response Australasia
Winning in January 2012 Review
PAGE 5 OF 20
January 2012
Following some poor service and availability results in January 2011, albeit with significant impacts from the floods in virtually all states of Australia, retailers and their suppliers undertook planning initiatives in the lead-up to summer 2011-12, looking to return to the positive business results which flowed from the first season of Winning in January back in 2009-10. Trading conditions through the Christmas and January period continued to be driven by significant promotional activity in the supermarket channel. As detailed in the ECRA program Winning with Promotions in 2010, this promotion driven environment provides its own set of challenges in regards to achieving high service levels and on-shelf availability to shoppers. A general reduction in inventory levels over recent years, both at retailers and their suppliers, calls for greater agility in the supply chain with collaboration being critical to success. The weather was less of an operational issue than the previous year, though it varied considerably throughout the period making its impact on volumes tricky to manage. The southern and western areas of Australia started with a mild summer before becoming increasingly hot throughout January, whilst the north and east saw fine weather initially before deteriorating into cool and wet conditions, with some areas returning to floods. The service level to stores results can be seen in charts which follow. Summer 2011-12 saw performance return to levels similar to 2009-10, with many categories experiencing very strong service levels and others still experiencing some issues. With four years worth of data now available, some clear patterns are emerging for certain categories as the charts in Appendix 2 of this report show. This should provide a great catalyst for trading partners to rethink strategy in these categories in advance of next summer.
In summary, 2011-12 saw improved performance, however there is still a major opportunity going forward to close the residual gap that exists between service levels in the Christmas and January period versus those experienced at other times of the year. As such ECRA views Winning in January as an ongoing opportunity for collaboration to the benefits of suppliers, retailers and shoppers.

Efficient Consumer Response Australasia
Winning in January 2012 Review
PAGE 6 OF 20
Results -January 2012 ECRA has again this year undertaken a data based approach to reviewing service performance levels from retailer distribution centres to stores for the period over Christmas and New Year and the month of January 2012. The data capture was undertaken with the collaborative support of retailers; Coles Group, Metcash Trading and Woolworths Limited. The retailers have tracked outbound service levels (OBSL) from their distribution centres to their stores for 2008/09, 2009/10, 2010/11 and 2011/12 to facilitate performance comparisons. This data was provided for both high level business splits shown below (Ambient Grocery, General Merchandise, and Perishables) as well as for several specific categories which were of particular interest through the summer period (see appendix 2). Whilst results varied by retailer and by category, the consolidated data provides insight into the top-line results and industry trends. The legend for the charts is as follows: • Horizontal axis = week of year. Week 51 aligns to Christmas week, 52 to New Year
week and 4 to Australia Day week. • Vertical axis = percentage of cases ordered by stores which the retailers were able to
supply for the week in question.
*chart shows consolidated Ambient Grocery, GM & Tobacco and Perishables results
80%
82%
84%
86%
88%
90%
92%
94%
96%
98%
100%
week 51 week 52 week 1 week 2 week 3 week 4
Whole of Business
Jan-09
Jan-10
Jan-11
Jan-12
Key Results
• Strong
performance
compared to
previous year,
back to 2010
levels
• Christmas to New
Year remains an
opportunity
• Still a gap versus
balance of year,
but closed
significantly on
historical (2009)
levels

Efficient Consumer Response Australasia
Winning in January 2012 Review
PAGE 7 OF 20
80%
82%
84%
86%
88%
90%
92%
94%
96%
98%
100%
week 51 week 52 week 1 week 2 week 3 week 4
Ambient Grocery
Jan-09
Jan-10
Jan-11
Jan-12
80%
82%
84%
86%
88%
90%
92%
94%
96%
98%
100%
week 51 week 52 week 1 week 2 week 3 week 4
General Merchandise & Tobacco
Jan-09
Jan-10
Jan-11
Jan-12
80%
82%
84%
86%
88%
90%
92%
94%
96%
98%
100%
week 51 week 52 week 1 week 2 week 3 week 4
Perishables
Jan-09
Jan-10
Jan-11
Jan-12
Key Results
• High performance
compared with
previous year and
historical results
• Week 52 should be
a focus area of
opportunity
Key Results
• A poor week 52
followed by a
strong recovery
• Unable to match
2010 benchmark
• Week 52 needs
scrutiny
Key Results
• Significant gains
over previous year,
albeit not up to
2010 benchmark
• Service levels still
lower overall

Efficient Consumer Response Australasia
Winning in January 2012 Review
PAGE 8 OF 20
Feature: On-Shelf Availability – Global Information On-shelf availability (OSA) has been on the ECR agenda locally and globally for many years. A wealth of knowledge, best practice guides, methodologies and tools aimed at assisting companies to implement OSA programmes are available. The average out-of-stock rates across the industry have not improved over the last decade. The 2008 global study by Gruen and Corsten shows that the current average out of stock rate is still 8.3%, with notable exceptions in markets where local ECRs or companies have taken the lead in making a difference. The ECR Australasia Secretariat has put together the following resource document to assist you, your business and your trading partners in examining out of stocks, seeking to understand the causes and establishing best practice solutions based on global practices.
ECR Europe
On-Shelf Availability Reloaded 2011
OSA remains one of the main non-innovation-led growth engines for the industry. Experience by leading companies has indicated that each time we improve OSA by 3%; we can deliver at a minimum an additional 1% growth.
OSA Reloaded is a diagnostic self-assessment tool that reviews the key barriers that exist in addressing OSA. By using this tool and the associated case studies, steps can be taken in your own company to overcome the last remaining barriers to maximising OSA and thereby improving customer satisfaction.
Access the report: http://www.ecr-all.org/content/ecropedia_element.php?ID=13873
White paper - Approaches to Measuring On-shelf Availability at the Point of Sale - 2006
There are a number of reasons why on-shelf availability is not, or rarely, measured. Taking measurements is seen as complicated, expensive, and many companies shy away from ongoing out-of-stock (OOS) monitoring because they simply assume that they lack the detailed data to do so.
This white paper outlines a uniform measurement methodology that uses POS data. Based on an out-of-stock index, the methodology permits more accurate comparison of the OOS rate by different categories and sales channels. The method can be leveraged to initiate a continual improvement process that will ultimately increase on-shelf availability, improve the revenues of both manufacturers and retailers, and make customers happier.
Access the report: http://ecr-all.org/content/ecropedia_element.php?ID=12181

Efficient Consumer Response Australasia
Winning in January 2012 Review
PAGE 9 OF 20
Optimal Shelf Availability (OSA) - Increasing Shopper Satisfaction at the Moment of Truth - 2003
The ECR guidebook on optimal shelf availability shows retailers and manufacturers the importance of improving product availability and provided an approach to making significant improvements. A study of seven European countries showed that product on-shelf availability is between just 90 and 93 percent. At the same time, consumer surveys have shown that consumers consider product availability to be a very important factor. Poor availability affects both retailers and manufacturers and can potentially lead to considerable financial losses.
The report describes how a holistic approach can improve on-shelf availability by as much as 50 percent. The approach consists of seven improvement levers to address the specific root causes identified. The report discussed that for any approach to be successful, regular measurement and issue awareness on the part of store management is essential.
Access the report: http://ecr-all.org/ecropedia/Supply%20Chain/OSA?PAGEN_1=6#nav_start
ECR Asia Pacific
On-Shelf Availability Alignment Project 2011
ECR Asia Pacific’s OSA working group conducted an online survey between July and September 2011 aimed at gaining insights and measuring current attitudes towards OSA across the region.
The report highlights the growing importance of OSA which is being driven by an increase in competition for sales and demands for service levels. Over 80% of survey respondents believe there is a need for industry initiatives to drive OSA, including standard definitions and measures; sharing best practice process and outcomes; and greater collaboration between suppliers and retailers.
Access the report: http://www.ecraustralasia.org.au/storage/on-shelf-availability/ECR%20OSA%20Survey%20Results%202011.pdf
ECR United Kingdom
Availability 2007 (and subsequent years)
The 2007 report details research carried out by the ECR UK Availability Workgroup during 2007 and builds on many of the projects which have been completed since 2005.

Efficient Consumer Response Australasia
Winning in January 2012 Review
PAGE 10 OF 20
Driving improved on-shelf availability is a key goal for retailers, not only in the UK, but also globally, however results from ECR UK’s On-Shelf Availability Survey reveal that improvements are hard to achieve, with availability of 95.9% being achieved on average over 2007. This Availability report demonstrated the need for an availability benchmarking survey in the UK, resulting in an updated product list, the frequency of surveys being increased and the associated reporting tools being enhanced significantly. Access the report: http://ecr-all.org/ecropedia/Supply%20Chain/OSA?PAGEN_1=5#nav_start
Subsequent Availability UK reports, tracking industry performance across 200 products and 160 stores, are available at:
Access the report: http://www.igd.com/index.asp?id=1&fid=5&sid=43&tid=57
Promotional On-Shelf Availability – Insights and Be st Practice.
ECR United Kingdom has developed an online resource with the assistance Cranfield University. Working with representatives from the UK’s leading retailers and manufacturers, the aim of the Cranfield research was to produce a resource that:
• Identifies the weak points across the supply chain that impacted the availability of promoted products in store.
• Highlights best practice processes and activities to enable improved promotional availability.
Access the report: http://www.igd.com/index.asp?id=1&fid=5&sid=43&tid=57&foid=54#contents
ECR Australasia
On-Shelf Availability Reports
Access reports by clicking highlighted links, or at http://www.ecraustralasia.org.au/on-shelf-availability/
In 2001 ECRA developed A Guide to Efficient Replenishment and Reducing Stock Outs. The objective of the guide was to provide a useful reference point for companies to improve replenishment and product availability.
In 2008 the ECRA Board commissioned a survey of industry aimed at reporting on the current status of On-Shelf Availability (OSA) levels and the adoption of the 2001 report recommendations. The report that followed was entitled The OSA Challenge.
The OSA Challenge Report report acted as a catalyst to further work completed in 2009 providing companies with a framework, both for their organisation and with trading partners, to address out of stocks (OOS), by following The On-Shelf Availability Roadmap.

Efficient Consumer Response Australasia
Winning in January 2012 Review
PAGE 11 OF 20
During 2009 the focus was narrowed to a specifically Australian issue of product availability during the month of January, with a series of publications being released to support industry efforts under the banner Winning in January. In 2010 attention was turned to the availability of products on promotion, tagged Winning with Promotions, this project examined the impacts on the value chain of promoted products with the industry working collaboratively to find ways to maximise responsiveness and flexibility across the value chain.
The February 2011 release of the Winning in January 2011 Review was the culmination of the industry focus for 2009, 2010 and 2011 providing a fact based set of key industry results, findings and next steps.

Efficient Consumer Response Australasia
Winning in January 2012 Review
PAGE 12 OF 20
Next Steps
Retailers and manufacturers will continue to pursue improved availability, both within their own organisations and with each other. The following are several areas to consider during the review process and in preparation for the future. If industry partners are to be truly responsive to shoppers’ demands they need to work together to promote high service levels whilst delivering improved efficiencies. Improvement in supply does translate to improved in-stock position in retail stores and ultimately retailers and suppliers are all working towards the goals of - right stock, right place, right time. ECRA will again actively pursue industry level improvements, and intends to formally report January 2013 results as part of this continuum of effort.
Next steps for your business - Retail and Supply
� Review
o industry data against specific company information
o with key trading partners, upstream and downstream
� Identify
o internal weaknesses
o root causes
o trading partner issues
� Plan
o Use the 7 steps in planning
o Recognise the power of early engagement
o Collaborate before, during and after

Efficient Consumer Response Australasia
Winning in January 2012 Review
PAGE 13 OF 20
Appendix 1
Winning in January Tools
Throughout 2009 and 2010 ECRA worked with representatives from leading retailers, wholesalers, manufacturers and suppliers to create a range of user friendly tools to assist companies deliver improved service levels specific to January. Indeed the key learnings from this initiative can be equally applied to the other eleven months of the year. Key challenges, issues and opportunities were identified in How to Win in January. Within this report, seven key areas provide a broad framework on which to focus activities both within an organisation and between trading partners. These focus areas are explored in detail in the report which is available at www.ecraustralasia.org.au
To further support improvements, in 2009 the industry developed a toolkit to provide guidance for improvements. The toolkit is an adjunct, not an alternative, to detailed internal and trading partner planning. The toolkit, Winning in January 2010, still very relevant in 2012, can be downloaded from www.ecraustralasia.org.au

Efficient Consumer Response Australasia
Winning in January 2012 Review
PAGE 14 OF 20
The toolkit includes a roadmap, checklists, scheduling documents, contacts lists and a series of templates for capturing and tracking key business metrics and information.
Efficient Consumer Response Australasia
Winning in January 2012 Review
PAGE 15 OF 20
Appendix 2
Retailer Service Results for January 2012 – Category Level
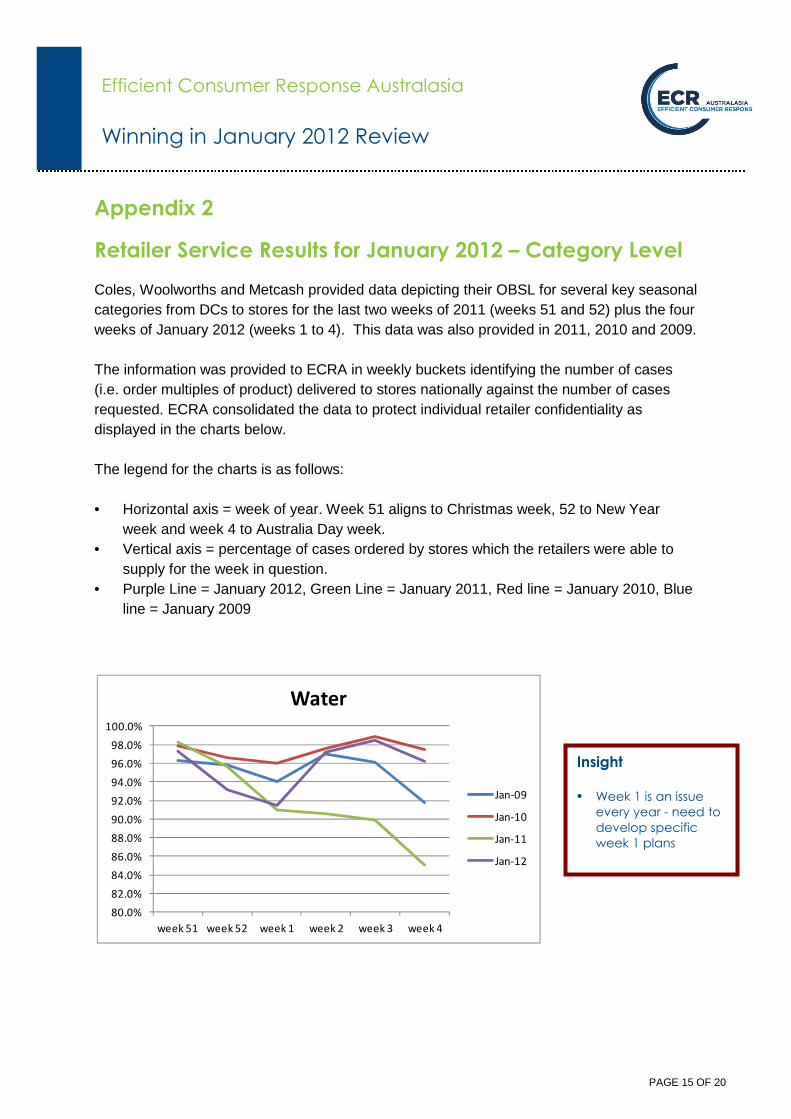
Coles, Woolworths and Metcash provided data depicting their OBSL for several key seasonal categories from DCs to stores for the last two weeks of 2011 (weeks 51 and 52) plus the four weeks of January 2012 (weeks 1 to 4). This data was also provided in 2011, 2010 and 2009. The information was provided to ECRA in weekly buckets identifying the number of cases (i.e. order multiples of product) delivered to stores nationally against the number of cases requested. ECRA consolidated the data to protect individual retailer confidentiality as displayed in the charts below. The legend for the charts is as follows: • Horizontal axis = week of year. Week 51 aligns to Christmas week, 52 to New Year
week and week 4 to Australia Day week. • Vertical axis = percentage of cases ordered by stores which the retailers were able to
supply for the week in question. • Purple Line = January 2012, Green Line = January 2011, Red line = January 2010, Blue
line = January 2009
80.0%
82.0%
84.0%
86.0%
88.0%
90.0%
92.0%
94.0%
96.0%
98.0%
100.0%
week 51 week 52 week 1 week 2 week 3 week 4
Water
Jan-09
Jan-10
Jan-11
Jan-12
Insight
• Week 1 is an issue
every year - need to
develop specific
week 1 plans

Efficient Consumer Response Australasia
Winning in January 2012 Review
PAGE 16 OF 20
80.0%
82.0%
84.0%
86.0%
88.0%
90.0%
92.0%
94.0%
96.0%
98.0%
100.0%
week 51 week 52 week 1 week 2 week 3 week 4
Carbonated Soft Drinks
Jan-09
Jan-10
Jan-11
Jan-12
80%
82%
84%
86%
88%
90%
92%
94%
96%
98%
100%
week 51 week 52 week 1 week 2 week 3 week 4
Long Life Juice / Cordials
Jan-09
Jan-10
Jan-11
Jan-12
80%
82%
84%
86%
88%
90%
92%
94%
96%
98%
100%
week 51 week 52 week 1 week 2 week 3 week 4
Breakfast Cereal
Jan-09
Jan-10
Jan-11
Jan-12
Insight
• A huge
opportunity if
week 52 can be
raised to level of
weeks 2-4
Insight
• First need to better
understand what is
driving the erratic
performance
week by week
each year
Insight
• Excellent
performance this
year. Opportunity
to reapply
learnings
Efficient Consumer Response Australasia
Winning in January 2012 Review
PAGE 17 OF 20
80%
82%
84%
86%
88%
90%
92%
94%
96%
98%
100%
week 51 week 52 week 1 week 2 week 3 week 4
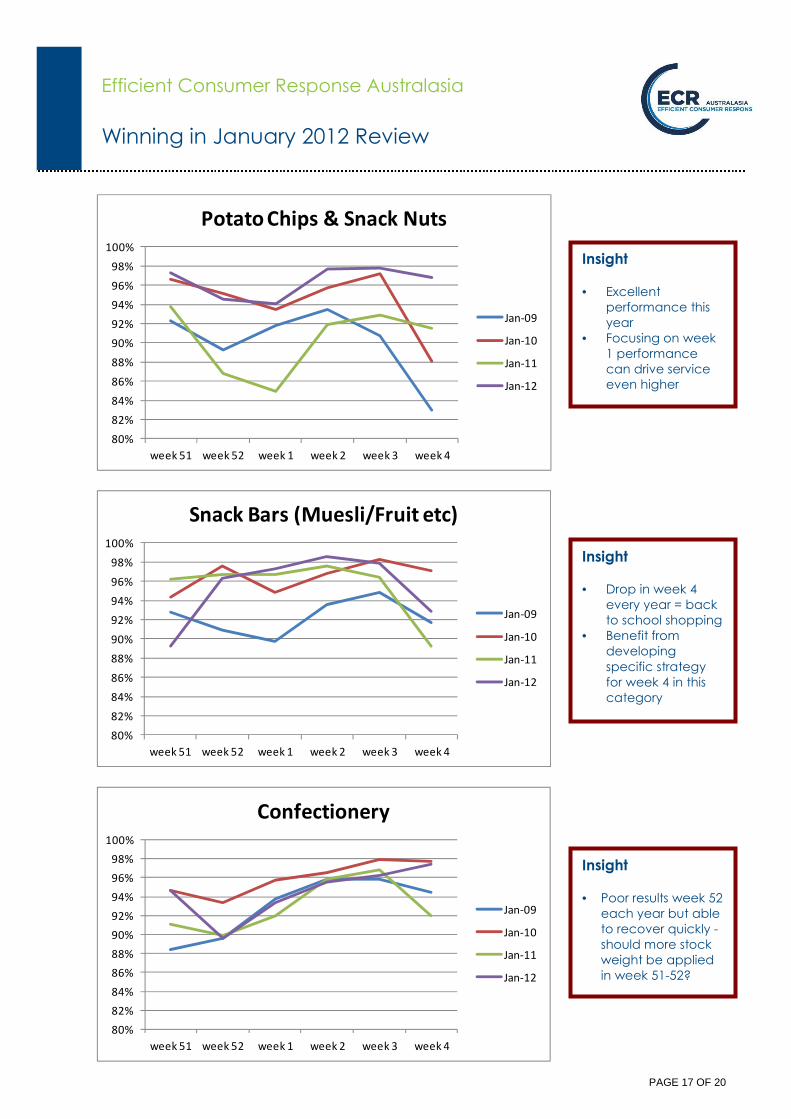
Potato Chips & Snack Nuts
Jan-09
Jan-10
Jan-11
Jan-12
80%
82%
84%
86%
88%
90%
92%
94%
96%
98%
100%
week 51 week 52 week 1 week 2 week 3 week 4
Snack Bars (Muesli/Fruit etc)
Jan-09
Jan-10
Jan-11
Jan-12
80%
82%
84%
86%
88%
90%
92%
94%
96%
98%
100%
week 51 week 52 week 1 week 2 week 3 week 4
Confectionery
Jan-09
Jan-10
Jan-11
Jan-12
Insight
• Excellent
performance this
year
• Focusing on week
1 performance
can drive service
even higher
Insight
• Drop in week 4
every year = back
to school shopping
• Benefit from
developing
specific strategy
for week 4 in this
category
Insight
• Poor results week 52
each year but able
to recover quickly -
should more stock
weight be applied
in week 51-52?

Efficient Consumer Response Australasia
Winning in January 2012 Review
PAGE 18 OF 20
80%
82%
84%
86%
88%
90%
92%
94%
96%
98%
100%
week 51 week 52 week 1 week 2 week 3 week 4
Biscuits
Jan-09
Jan-10
Jan-11
Jan-12
80%
82%
84%
86%
88%
90%
92%
94%
96%
98%
100%
week 51 week 52 week 1 week 2 week 3 week 4
Facial Tissues
Jan-09
Jan-10
Jan-11
Jan-12
80%
82%
84%
86%
88%
90%
92%
94%
96%
98%
100%
week 51 week 52 week 1 week 2 week 3 week 4
Toilet Rolls & Paper Towels
Jan-09
Jan-10
Jan-11
Jan-12
Insight
• Significant
improvement over
historical (2009)
Insight
• Poor performance
this summer – an
anomaly?
Insight
• Exceptional
performance this
summer
• Opportunity to
reapply learnings

Efficient Consumer Response Australasia
Winning in January 2012 Review
PAGE 19 OF 20
80%
82%
84%
86%
88%
90%
92%
94%
96%
98%
100%
week 51 week 52 week 1 week 2 week 3 week 4
Yoghurt / Cream/ Dairy Snacks
Jan-09
Jan-10
Jan-11
Jan-12
80%
82%
84%
86%
88%
90%
92%
94%
96%
98%
100%
week 51 week 52 week 1 week 2 week 3 week 4
Cheese
Jan-09
Jan-10
Jan-11
Jan-12
80%
82%
84%
86%
88%
90%
92%
94%
96%
98%
100%
week 51 week 52 week 1 week 2 week 3 week 4
Chilled Juice
Jan-09
Jan-10
Jan-11
Jan-12
Insight
• Exceptional
performance this
summer
• Opportunity to
reapply learnings
Insight
• Strong
performance this
summer
• Fixing week 52
would appear to
reap large reward
- an area worthy of
focus next summer
Insight
• Strong
performance this
summer
• Appears that week
1 is the challenging
week - an
opportunity

Efficient Consumer Response Australasia
Winning in January 2012 Review
PAGE 20 OF 20
80%
82%
84%
86%
88%
90%
92%
94%
96%
98%
100%
week 51 week 52 week 1 week 2 week 3 week 4
Ice Cream
Jan-09
Jan-10
Jan-11
Jan-12
Insight
• Outstanding
performance this
summer
• Services
performance has
greatly over past 3
years