wind tunnel tests on plate girder bridges · 2016-10-02 · plate girder bridges of various...
TRANSCRIPT

Wind tunnel tests on plate girder bridges
Prepared for Highways Agency
A F Daly (TRL Limited) and B W Smith (Flint and Neill Partnership)
TRL Report TRL530
First Published 2002ISSN 0968-4107Copyright TRL Limited 2002.
This report has been produced by TRL Limited, under/as partof a contract placed by the Highways Agency. Any viewsexpressed in it are not necessarily those of the Agency.
TRL is committed to optimising energy efficiency, reducingwaste and promoting recycling and re-use. In support of theseenvironmental goals, this report has been printed on recycledpaper, comprising 100% post-consumer waste, manufacturedusing a TCF (totally chlorine free) process.

CONTENTS
Page
Executive Summary 1
1 Introduction 3
2 Background 3
3 Wind tunnel test procedure 3
3.1 General 3
3.2 The models 6
3.3 The wind tunnels 6
3.4 Dynamic response measurements 7
4 Wind tunnel test results 7
5 Assessment of results 7
5.1 Vortex excitation 7
5.2 Divergent response 13
6 Application to design rules 13
6.1 General 13
6.2 Vortex excitation - critical wind speed 13
6.3 Vortex excitation - amplitudes 19
6.3.1 Bending 19
6.3.2 Torsion 19
6.4 Large amplitude instabilities 19
7 Amendments to the rules 19
7.1 Vortex excitation - critical wind speeds 19
7.2 Vortex excitation - amplitudes 27
7.3 General 28
8 Conclusions 30
9 References 30
Appendix A: Wind tunnel test results 31
Appendix B: Comparison between test results and design rules 67
Appendix C: Typical results from earlier studies on box girderbridges 102
Abstract 105
Related publications 105
iii

iv

1
Executive Summary
Summary
Over 60 wind tunnel tests were carried out on sectionmodels of bridge decks of various configuration and edgedetail. The tests covered a range of wind speeds and avariety of damping values. The models were mounted onelastic supports that enabled them to move in theirfundamental bending and torsional modes of vibration.The tests were mainly carried out in smooth flow since thisgives conservative estimates of vortex shedding responseand critical wind speeds. Some tests in turbulent flow wereincluded in the programme for reference.
The effect of different edge detail on the aerodynamicresponse was investigated using parapets of varying heightand solidity that could be attached to the different models.Two basic fascia beam configurations were tested, as well asvarious fascia beam depth and overhang values. Other edgedetails, such as ‘thickening’ of the slab were also included.
The models and test configuration are described fully inthis report. The report contains the data obtained from thewind tunnel tests and the main conclusions relevant to the1993 version of BD 49. The tests were subsequently usedto produce a revised version of BD 49 (published in 2001).The background to these revisions is presented in aseparate report (TRL528).
The data obtained from the wind tunnel tests presentedin this report can be used in conjunction with BD 49. Thiswill enable designers to use the data directly rather than inthe form of simplified rules, which are necessarilyconservative. The data for critical wind speeds, amplitudesof vibration, for both bending and torsion, should only beused where deck configuration and edge details are similar.This may avoid the need for re-design or expensive windtunnel tests.
Conclusion
The wind tunnel testing programme was used to providesimple rules to determine the aerodynamic behaviour ofplate girder bridges of various geometric configurations.These rules are applicable to typical situations and can beused to ascertain the stability of the structure or to identifythe situations were more sophisticated studies are required,eg, full dynamic analysis or wind tunnel tests. Whereappropriate, the wind tunnel data can be used directly forthe assessment of aerodynamic behaviour.
There are still many areas which have not been fullyinvestigated and it is important to note that the need forfull dynamic analysis or wind tunnel tests has not beeneliminated and is still required in certain situations.
Background
Simple criteria for assessing the susceptibility of bridges toaerodynamic effects first appeared in general form in apaper entitled ‘Proposed British Design Rules’ (Institutionof Civil Engineers, 1981). The rules presented equations fordetermining critical wind speeds at which vortex sheddingor aerodynamic instability (galloping, non-oscillatorydivergence) would occur. The critical wind speeds couldthen be compared with design wind speeds to determinewhether they were likely to occur. The rules also presentedsimplified formulae for the calculation of amplitudes ofvibration and loading for vortex excitation and gaveguidance on response to turbulence and fatigue assessment.
These simplified rules were used primarily to identifybridges that may be prone to aerodynamic effects withoutcarrying out sophisticated dynamic analysis. Shouldaerodynamic problems be indicated, then the designer hasthe option of re-designing or testing in a wind tunnel.
The rules applied to a limited range of bridge size andtypes, based on the knowledge that existed at that timeresulting from wind tunnel tests and practical experience.Further studies were subsequently carried out, including acalibration exercise to derive appropriate partial safetyfactors for vortex shedding loads, to make the rulesapplicable to a wider range of structures. The rules weremodified accordingly and made available in TRL ContractorReport CR36 (Flint and Neill Partnership 1986), which waswidely used in the assessment of bridge stability. The ruleswere developed further in TRL Contractor Report CR256(Flint and Neill Partnership 1991) and were eventuallypublished in Departmental Standard BD 49/93.
Scope of the project
Because of the lack of wind tunnel test results, certainbridge types were beyond the scope of BD 49/93. Oneimportant category of bridges was omitted, ie, plate girderbridges, for which much of the standard was notapplicable. It was also apparent from the many queriesposed by bridge engineers using BD 49/93 that thegeometric constraints imposed by the rules, particularlythose relating to leading edge details, eliminated manytypical structures from being covered by the standard. Towiden the range of bridge types and configuration coveredby the standard, a comprehensive wind tunnel testingprogramme was carried out. This report summarises theresults and conclusions derived from these tests.
The wind tunnel tests were carried out by Flint andNeill Partnership in collaboration with BMT FluidMechanics Limited. As well as examining the criticalwind speeds, vibration amplitudes and stability of plategirder bridges, other topics were investigated. Theseincluded the effect on aerodynamic behaviour of varyingedge beam dimensions, parapet height and solidity. Theeffect of presence of solid parapet over short lengths ofthe span, as is required for bridges over railway-lines,was also investigated.

2
3
1 Introduction
Flint and Neill Partnership (FNP) in association with BMTFluid Mechanics Limited (BMT) were awarded acommission by the Transport Research Laboratory (nowTRL Limited) to undertake studies and wind tunnel tests onplate girder bridges. The purpose of the investigation was toconfirm or extend the content of certain clauses in thesimplified design rules for bridge aerodynamics (hereinafterreferred to as the Rules), as published in BD 49/93(Highways Agency, 1993).
During the study it was found that the results wereparticularly sensitive to edge beam depth and overhang. Toaddress these problems a small programme of further testswas undertaken.
This report sets out the results of the study, proposedmodifications to the Rules and general conclusions andrecommendations regarding the Rules. As a consequenceof this study, the equations used to evaluate critical windspeeds and amplitudes of response were revised. Ruleswere revised and published as BD 49/01 (HighwaysAgency 2001). Background to other revisions of BD 49 ispresented by Smith et al. (2002)
2 Background
All the wind tunnel tests, upon which the aerodynamicRules have been based, were undertaken by BMT (formerlyNMI) and a significant part of the codification of the testresults was carried out by Flint and Neill Partnership. Theoriginal rules published by the Institution of Civil Engineers(1981) were extended as a result of a calibration studyundertaken by Flint and Neill Partnership (1986). A furtherinvestigation (Flint and Neill Partnership 1991) modifiedcertain clauses in the Rules and these were subsequentlypublished by the Highways Agency as BD 49/93.
It was recognised however that certain aspects of theRules required further investigation, particularly thoseassociated with plate girder bridges. Accordingly theseaspects were identified and formed the basis of the presentinvestigation.
3 Wind tunnel test procedure
3.1 General
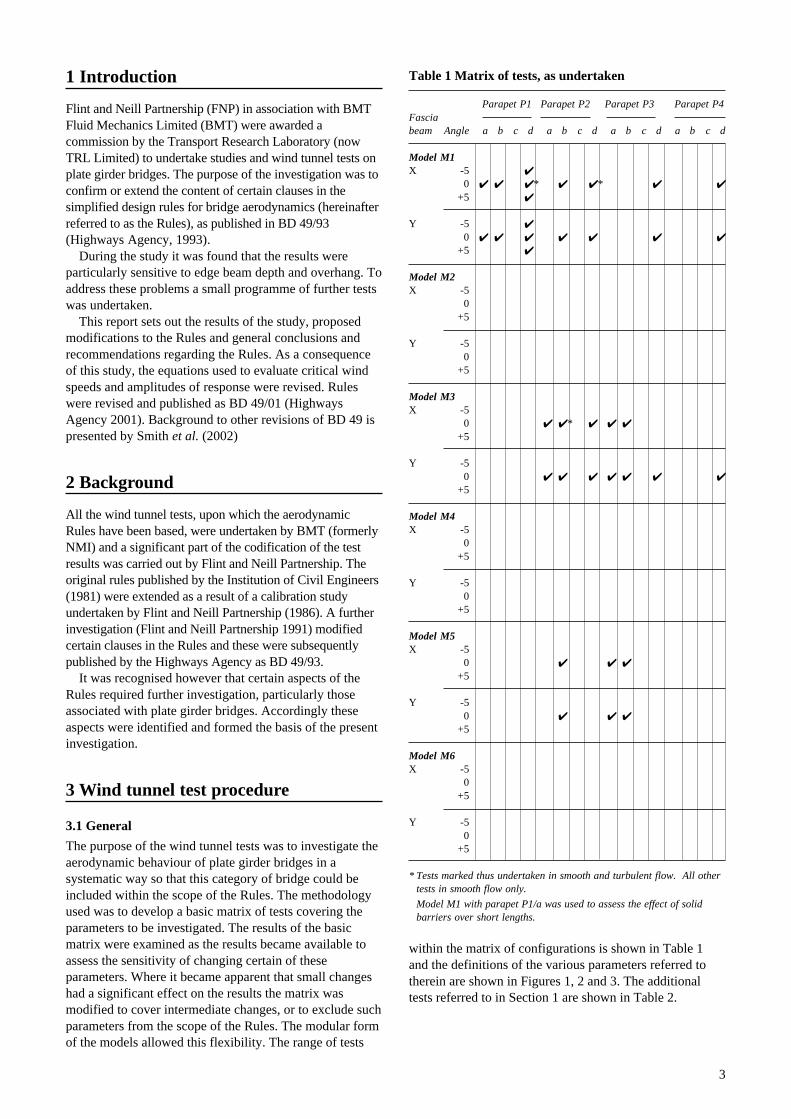
The purpose of the wind tunnel tests was to investigate theaerodynamic behaviour of plate girder bridges in asystematic way so that this category of bridge could beincluded within the scope of the Rules. The methodologyused was to develop a basic matrix of tests covering theparameters to be investigated. The results of the basicmatrix were examined as the results became available toassess the sensitivity of changing certain of theseparameters. Where it became apparent that small changeshad a significant effect on the results the matrix wasmodified to cover intermediate changes, or to exclude suchparameters from the scope of the Rules. The modular formof the models allowed this flexibility. The range of tests
within the matrix of configurations is shown in Table 1and the definitions of the various parameters referred totherein are shown in Figures 1, 2 and 3. The additionaltests referred to in Section 1 are shown in Table 2.
Table 1 Matrix of tests, as undertaken
Parapet P1 Parapet P2 Parapet P3 Parapet P4Fasciabeam Angle a b c d a b c d a b c d a b c d
Model M1X -5 ✔
0 ✔ ✔ ✔ * ✔ ✔ * ✔ ✔
+5 ✔
Y -5 ✔
0 ✔ ✔ ✔ ✔ ✔ ✔ ✔
+5 ✔
Model M2X -5
0+5
Y -50
+5
Model M3X -5
0 ✔ ✔ * ✔ ✔ ✔
+5
Y -50 ✔ ✔ ✔ ✔ ✔ ✔ ✔
+5
Model M4X -5
0+5
Y -50
+5
Model M5X -5
0 ✔ ✔ ✔
+5
Y -50 ✔ ✔ ✔
+5
Model M6X -5
0+5
Y -50
+5
* Tests marked thus undertaken in smooth and turbulent flow. All othertests in smooth flow only.
Model M1 with parapet P1/a was used to assess the effect of solidbarriers over short lengths.
4
L
M1
M2
M3
M4
M5
M6
1.0
1.5
1.0
1.5
1.0
1.5
1
1
2
2
3
3
4.5
5.5
9
10
13.5
14.5
3
3
7.5
7.5
12
12
Model
numberConfiguration
Number
of basic
types
OverhangL/d4
b/d4b*/d4
Joint in model deck formed by screwing through to stiff backing plate in shadow zone
4.5
2.5
3.0
1
Basic model unit
dimensions are relative only
h
d4
Overhang
Fascia beam
Parapet, solidity ratio φ
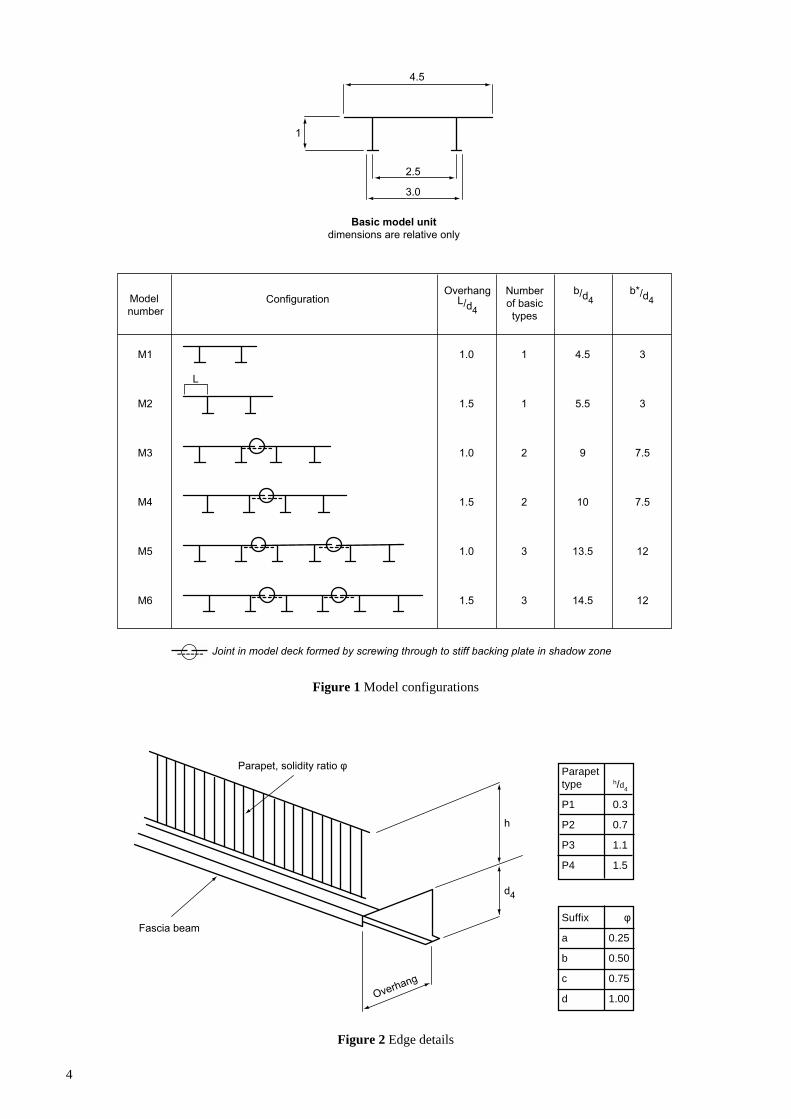
Figure 1 Model configurations
Figure 2 Edge details
------
Suffix φ
a 0.25
b 0.50
c 0.75
d 1.00
Parapettype h/d4
P1 0.3
P2 0.7
P3 1.1
P4 1.5
5
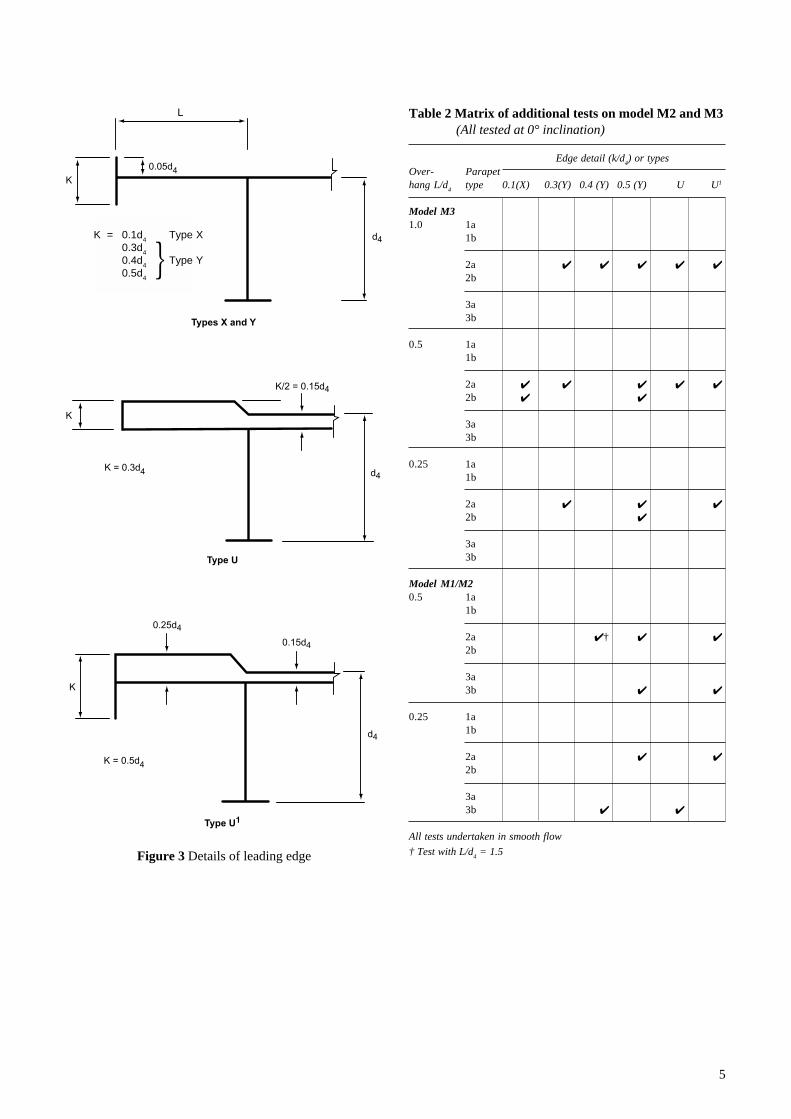
Table 2 Matrix of additional tests on model M2 and M3(All tested at 0° inclination)
Edge detail (k/d4) or types
Over- Parapethang L/d
4type 0.1(X) 0.3(Y) 0.4 (Y) 0.5 (Y) U U1
Model M31.0 1a
1b
2a ✔ ✔ ✔ ✔ ✔
2b
3a3b
0.5 1a1b
2a ✔ ✔ ✔ ✔ ✔
2b ✔ ✔
3a3b
0.25 1a1b
2a ✔ ✔ ✔
2b ✔
3a3b
Model M1/M20.5 1a
1b
2a ✔ † ✔ ✔
2b
3a3b ✔ ✔
0.25 1a1b
2a ✔ ✔
2b
3a3b ✔ ✔
All tests undertaken in smooth flow
† Test with L/d4 = 1.5
K
d4
0.05d4
I
K = 0.1d4 Type X
0.3d4 )
0.4d4 } Type Y
0.5d4 )
Types X and Y
Type U
Type U1
d4
K
K = 0.3d4
K/2 = 0.15d4
d4
K
K = 0.5d4
0.15d4
0.25d4
Figure 3 Details of leading edge
K = 0.1d4 Type X0.3d4
0.4d4 Type Y0.5d4
t
L

6
3.2 The models
The programme of wind tunnel tests was performed usinga series of section models of representative plate girderbridge decks. The models were manufactured by BMT’sworkshop facilities and were constructed, on the whole,from carbon fibre. Two basic units were designed andthese were assembled to give the family of models shownin Figure 1. This resulted in a series of deck configurationswith constant depth, two overhang details and variableoverall width.
Previous tests have shown that aerodynamic behaviourof bridge decks is very dependent on the leading edgedetail of the structure. For this reason, parapets of variousheight and solidity were provided and madeinterchangeable between the various model decks. Theseare shown in Figure 2. The solidity φ is defined as the ratioof solid area to overall area of the parapet.
In addition to parapet details, two basic fascia beamconfigurations were tested, named X and Y, as shown inFigure 3. The additional tests to investigate fascia beamdepth and overhang concentrated on model M3 withoverhangs varying from 0.25 to 1.0 times the depth of thebeams. In addition, two edge details, types U and U1,representing thickening of the slab at the edge, wereintroduced. These details are commonly found in existingbridges, but were beyond the scope of the aerodynamicRules due to the unavailability of wind tunnel test data.TRL was also concerned with a specific bridge whoseconfiguration was similar to model M2, when mountedwith one of the new edge details. Accordingly this wasincluded in the matrix of tests.
The scale of the models was 1:30 based on 1 unit = 1.5mfull scale or 1:40 for 1 unit = 2m full scale. A large scalemodel is essential in providing reliable results, not onlybecause of the need for sufficiently high Reynold’snumbers, but also to enable the accurate representation of
small features such as the fascia beam detail at modelscale. This is particularly important since slight changes infascia beam, for example, can have a profound effect onthe wind-induced response of a deck section.
However it was still found necessary to use light cross-bracing linking the bottom flanges of the beams, to preventthe sections from distorting.
3.3 The wind tunnels
The tests were undertaken in two of BMT’s tunnels:
1 BMT’s No 5 wind tunnel, which is regularly used forsection model testing of bridge decks and has a testsection of 2.74m wide, 2.14m high and 3.5m long and atop wind speed 65m/sec,
2 No 7 environmental wind tunnel, with a test section4.8m wide, 2.4m high and 15m long, and a top windspeed of 45m/s. Due to the greater width of this windtunnel, false walls were installed in the test section.These walls spanned the entire height of the test sectionand were located 2.74m apart. The front end of eachwall had a streamlined nose to avoid flow separation atthe leading edge. The walls were of suitable length toensure two-dimensional flow conditions for a sufficientdistance downstream of the model. The uniformity ofthe mean wind speed between the walls was generallybetter than ± 1%.
For both wind tunnels the dynamic test rig wasmounted on the outside surfaces of the walls. All thecomponents of the test rig were shielded from the flow toavoid any unwanted flow-induced excitation. The set upof the false walls and dynamic rig in wind tunnel No 7 isshown in Figure 4.
Cross-calibration of the two tunnels was undertaken toensure consistency of the results, by repeat testing some ofthe configurations and good agreement was obtained.
Figure 4 Test set-up in wind tunnel

7
3.4 Dynamic response measurements
The section models were elastically mounted in the windtunnel on a dynamic rig incorporating a system of springsto provide two degrees of freedom, ie, vertical bending andtorsion. The stiffness of the springs was carefully chosento provide model scale natural frequencies that result in aconvenient wind speed scaling in the wind tunnel. Thefrequency ratio was not set to a specific value since it wasbelieved that coupled instabilities were unlikely, based onprevious experience with plate girder bridge sections. Thetarget values for the mass and inertia were based on fullscale data for 22 existing steel plate girder bridges ofvarious widths and spans.
Incorporated in the dynamic rig was an eddy currentdamping system, which allows the structural damping inboth degrees of freedom to be controlled during the test.The dynamic rig also allowed the vertical angle ofincidence of the wind relative to the deck to be varied.
In all cases, the test procedure generally consisted of firstrunning through the required wind speed range to provide ageneral indication of the response. This was followed bymeasurements of the response amplitudes in bending andtorsion at a sufficient number of wind speeds to accuratelydefine any responses due to vortex shedding and the criticalwind speeds for the onset of any divergent aeroelasticinstabilities such as galloping or flutter. The response wasmeasured using accelerometers mounted on the dynamic rig.
Tests were conducted according to the test matrix definedin Tables 1 and 2. They were generally performed at a windincidence of 0°, although some measurements were made at±5°. Tests were performed at up to six levels of structuraldamping to cover the anticipated range of full scale values.
On the whole, measurements were made in lowturbulence flow (nominally smooth flow). Tests in smoothflow are generally recognised to give conservative estimatesof the vortex shedding responses and critical wind speedsfor divergent instabilities. However, some tests wereperformed in turbulent flow as defined in the test options todemonstrate the effects of turbulence. Turbulent flow wasgenerated in the wind tunnel using a grid of bars at theentrance to the working section of the wind tunnel.
For the smooth flow tests the longitudinal turbulenceintensity (defines as the root mean square of the fluctuatingcomponent of the wind divided by the mean wind speed)was less than 1% whereas for the turbulent flow tests thelongitudinal turbulence intensity was 7.6%. Thelongitudinal length scale was of the order of 0.30m.
4 Wind tunnel test results
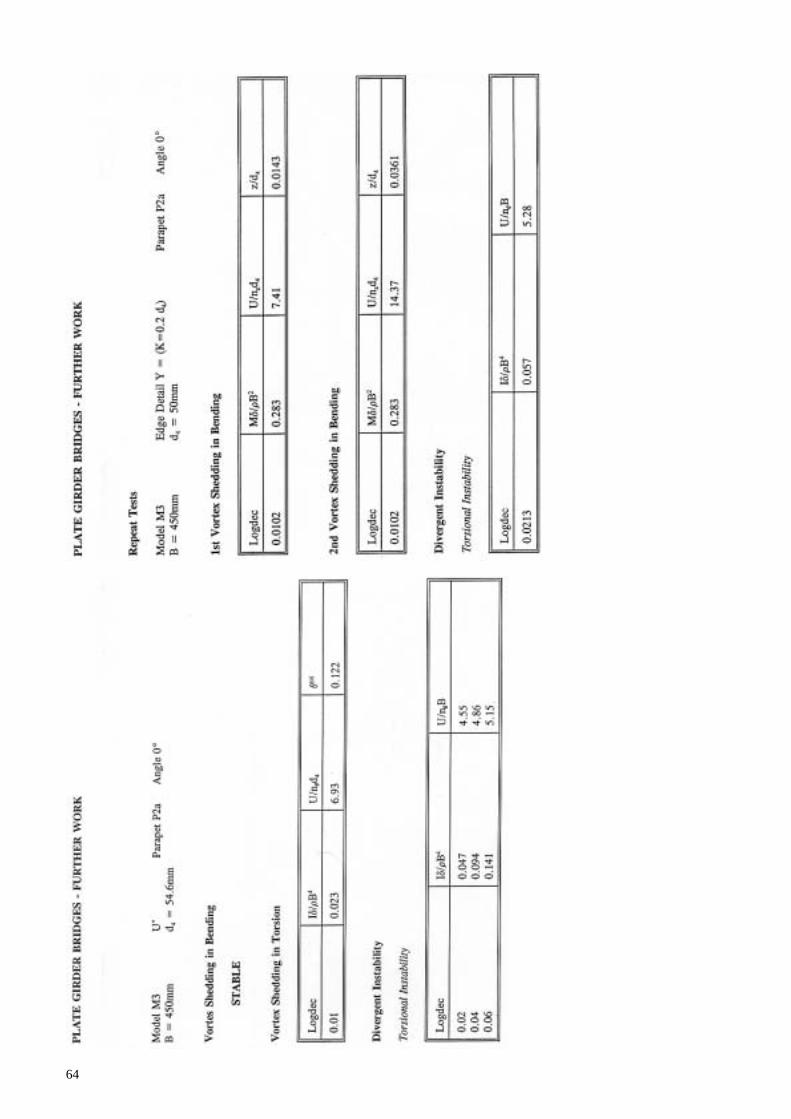
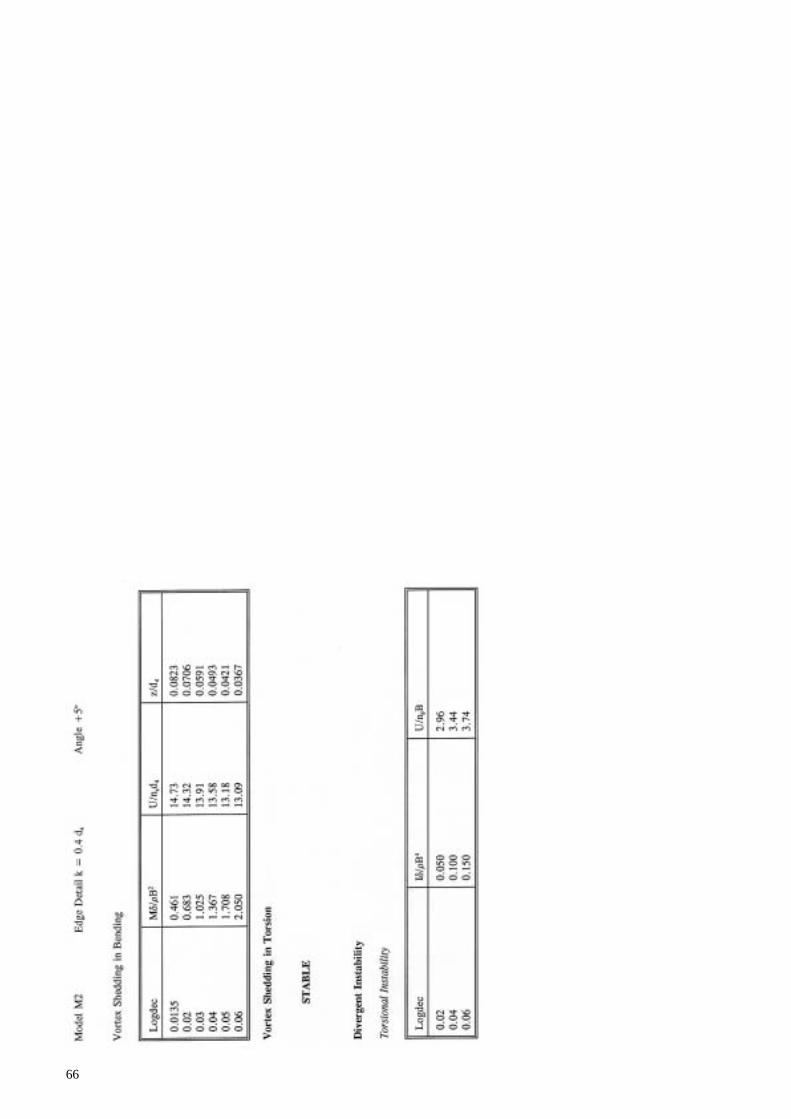
The results from the wind tunnel tests are presented in full inAppendix A. For each model, with its various fascia beamconfigurations, the results are tabulated for vortex shedding inbending, vortex shedding in torsion and divergent instability.
For vortex shedding the results are given for variousdamping values. These generally started at a logarithmicdecrement (δ) of 0.01 depending on the set up (eg,minimum δ in torsion for model M3 was 0.0138) andincreasing in 0.01 increments until no further response wasmeasured or a maximum logarithmic decrement of 0.06 was
reached. Both the non-dimensional critical wind speed andthe maximum root mean square amplitude are tabulated.
For divergent instability the non-dimensional windspeed at the onset of instability is tabulated.
5 Assessment of results
The matrix of tests was limited to three of the six possiblemodels (M1, M3 and M5) to enable general trends inaspect ratio of plate girder bridges to be determined.
The matrix also concentrated initially on solid parapets,which unless they are very low in height were excluded fromthe simplified formulae given in BD 49/93. It was hoped thatthe scope for plate girder bridges could be widened, as a resultof the tests, to enable such configurations to be assessed usingthe formulae in the Rules.
The tests pertaining to the effect of changes in the leadingedge detail focused on the requirement in the Rules forfactoring the predicted amplitudes by 3.0 (Clause 3.1.2 ofBD 49/93) for ‘bluff’ configurations. It was felt that this wassimplistic and over-conservative and that a factor dependenton edge detail parameters would be more realistic. Thesetests were used to develop such an approach.
5.1 Vortex excitation
The general trend of the results for model M1 mountedwith solid barriers (ie, parapets with suffix d denoting asolidity of 100%) is shown in Figure 5. In these plots thenon-dimensional amplitude for bending is plotted against
a) Model M1, fascia beam X
0 0.01 0.02 0.03 0.04 0.05 0.06 0.07
Damping (log dec)
Max
dis
plac
emen
t (z/
d 4)
0
0.02
0.04
0.06
0.08
0.1
0.12
Figure 5 Vortex shedding response in bending with solidparapets
b) Model M1, fascia beam Y
0
0.05
0.1
0.15
0.2
0 0.01 0.02 0.03 0.04 0.05 0.06 0.07
Damping (log dec)
Max
dis
plac
emen
t (z/
d 4)
P1d, 0 deg
P1d, -5 deg
P1d, +5 deg
P2d, 0 deg
P3d, 0 deg
P4d, 0 deg

8
the logarithmic decrement of damping. Figure 5a is forfascia beam X and Figure 5b is for fascia beam Y. Asexpected the amplitudes decrease with increasing damping.The initially surprising result was that the amplitudesdecreased with increasing height of barrier, apart from thesingle results for P2d at low values of damping. It shouldbe recognised that these results are for the model mountedwith solid parapets, a configuration that is outside thescope of the BD 49/93 Rules. The results can probably beexplained by the mechanism of vortex shedding whichmay create strong vortices due to the deep bluff leadingface, but a relatively smaller forcing mechanism for higherheight to in-wind depth ratios due to a reduction in theeffective after-body length.
This trend for reduced amplitudes for higher barrierswas reversed for the torsional response, which is plottedin Figure 6a for fascia beam X and in Figure 6b forfascia beam Y.
As may be seen from Figures 5 and 6, amplitudes werehigher for positive angles of inclination and lower fornegative angles, for an identical configuration (model P1d)for both bending and torsion. Wind inclination can becaused either by topographic effects or by super-elevationof the structure. The design rules have allowed for theeffects of up to ±5° inclination. Super-elevation beyondthat angle would be extremely unlikely to occur over along length of the bridge, particularly for the main span
which is of most concern. Wind inclination could occur forsites where an elevated bridge runs normal to the slope of ahill. Such cases are unlikely to occur in practice but bridgedesigners should be aware of such possibilities.
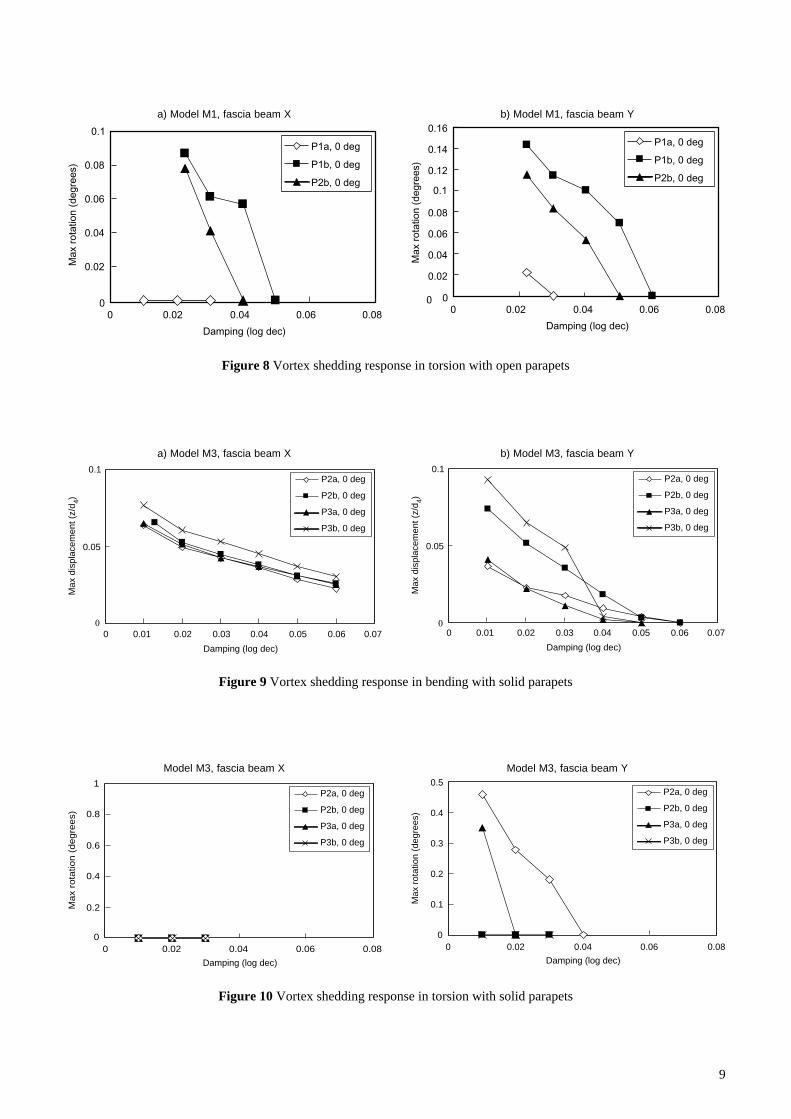
Results for bending, again for model M1, for openparapets (a and b with solidity 25% and 50% respectively)are given in Figures 7a for fascia beam X and 7b for fasciabeam Y which show increased response for increasedsolidity. Equivalent results for torsion are given inFigures 8a and 8b. It can be seen from Figures 7 and 8 thatincreasing the height of the 50% porous parapet decreasedboth the bending and torsional response.
Bending results for model M3 with open parapets aresummarised in Figure 9a (for fascia beam X) and Figure 9b(for fascia beam Y). For this model it can be seen that:
a the response increases with increasing height of parapet,although negligibly for the lower solidity parapets;
b the response increases with increasing solidity of parapet.
Both these trends are as expected, the width of the decknow probably providing an increased forcing mechanism.
Figure 10 shows the torsional results for model M3 withfascia beam Y where the response is higher for the lowestheight parapet. However it can be seen that at practical
a) Model M1, fascia beam X
Damping (log dec)
Max
dis
plac
emen
t (z/
d 4)
P1a, 0 deg
P1b, 0 deg
P2b, 0 deg
0
0.01
0.02
0.03
0.04
0.05
0.06
0.07
0 0.02 0.04 0.06 0.08
Damping (log dec)
Max
dis
plac
emen
t (z/
d 4)
P1a, 0 deg
P1b, 0 deg
P2b, 0 deg
0
0.01
0.02
0.03
0.04
0.05
0.06
0.07
0 0.02 0.04 0.06 0.08
Figure 7 Vortex shedding response in bending with openparapets
b) Model M1, fascia beam Y
a) Model M1, fascia beam X
0 0.01 0.02 0.03 0.04 0.05 0.06 0.07
Damping (log dec)
Max
rot
atio
n (d
egre
es)
P1d, 0 deg
P1d, -5 deg
P1d, +5 deg
P2d, 0 deg
P3d, 0 deg
P4d, 0 deg
0
0.5
1
1.5
2
2.5
3
3.5
4
4.5
Figure 6 Vortex shedding response in torsion with solidparapets
b) Model M1, fascia beam Y
0 0.01 0.02 0.03 0.04 0.05 0.06 0.07
Damping (log dec)
Max
rot
atio
n (d
egre
es)
P1d, 0 deg
P1d, -5 deg
P1d, +5 deg
P2d, 0 deg
P3d, 0 deg
P4d, 0 deg
0
1
2
3
4
5
6
9
Damping (log dec)
Max
rot
atio
n (d
egre
es)
P1a, 0 deg
P1b, 0 deg
P2b, 0 deg
00 0.02 0.04 0.06 0.08
0.02
0.04
0.06
0.08
0.1
Damping (log dec)
Max
rot
atio
n (d
egre
es)
P1a, 0 deg
P1b, 0 deg
P2b, 0 deg
00 0.02 0.04 0.06 0.08
0
0.02
0.04
0.06
0.08
0.1
0.12
0.14
0.16
Figure 8 Vortex shedding response in torsion with open parapets
a) Model M1, fascia beam X b) Model M1, fascia beam Y
Damping (log dec)
Max
dis
plac
emen
t (z/
d 4)
0.05
0.1
0 0.01 0.02 0.03 0.04 0.05 0.06 0.07
P2a, 0 deg
P2b, 0 deg
P3a, 0 deg
P3b, 0 deg
0
Damping (log dec)
Max
dis
plac
emen
t (z/
d 4)
0.05
0.1
0 0.01 0.02 0.03 0.04 0.05 0.06 0.07
P2a, 0 deg
P2b, 0 deg
P3a, 0 deg
P3b, 0 deg
0
Figure 9 Vortex shedding response in bending with solid parapets
a) Model M3, fascia beam X b) Model M3, fascia beam Y
Damping (log dec)
Max
rota
tion
(deg
rees
)
P2a, 0 deg
P2b, 0 deg
P3a, 0 deg
P3b, 0 deg
0
0.1
0.2
0.3
0.4
0.5
0 0.02 0.04 0.06 0.08
Figure 10 Vortex shedding response in torsion with solid parapets
Model M3, fascia beam Y
P2a, 0 deg
P2b, 0 deg
P3a, 0 deg
P3b, 0 deg
Damping (log dec)
Max
rota
tion
(deg
rees
)
0
0.2
0.4
0.6
0.8
1
0 0.02 0.04 0.06 0.08
Model M3, fascia beam X
10
levels of damping the response is negligible. No torsionalresponse was measured for model M3 with fascia beam X.
For model M3 with solid parapets, large amplitudes wererecorded due to vortex shedding in both bending andtorsion. For some configurations, the effects of vortexshedding in torsion merged with those of the divergenttorsional instability, making the definition of the vortexshedding response almost impossible. Following these initialmeasurements with model M3, no further configurationswere tested with solid parapets. For these reasons the resultshave not been plotted; the reader is referred to the data givenin Appendix A for further details.
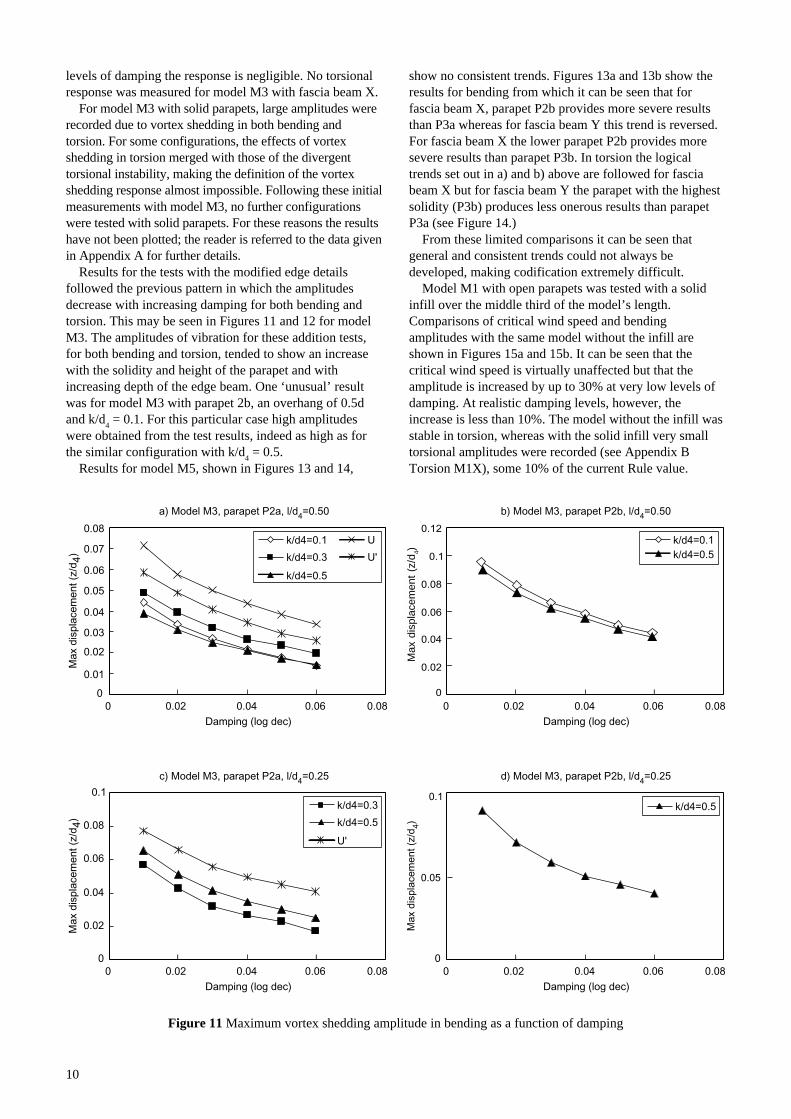
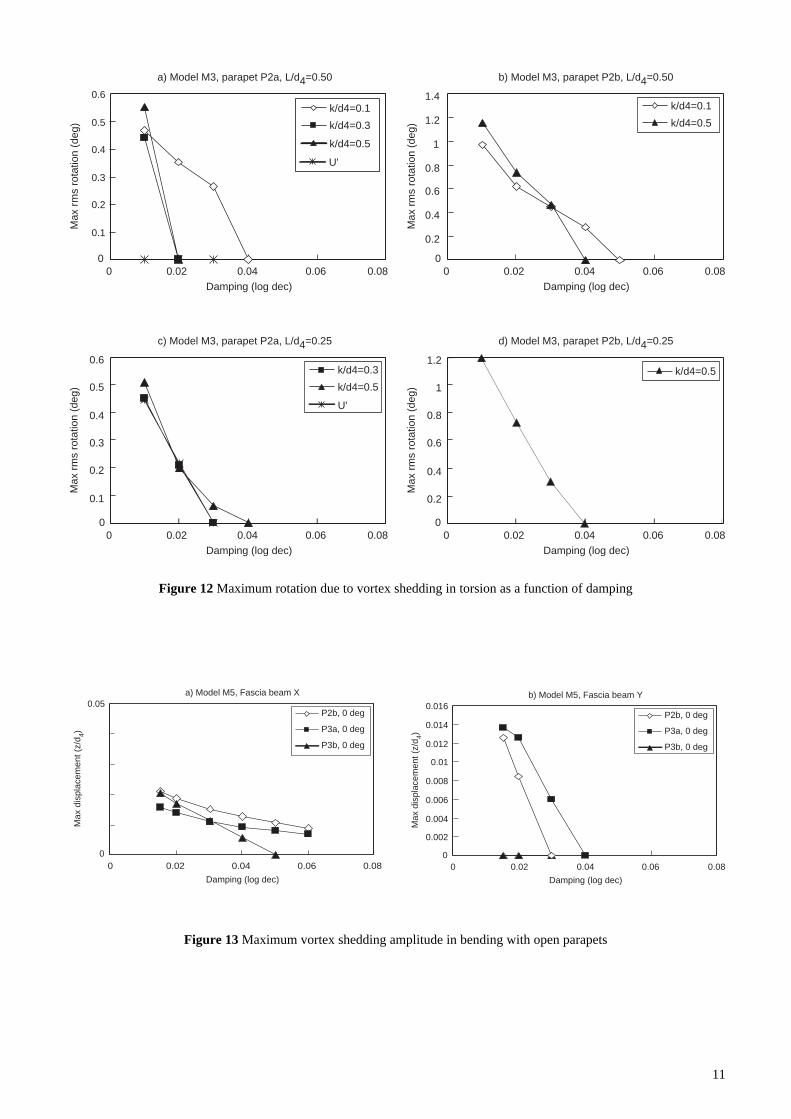
Results for the tests with the modified edge detailsfollowed the previous pattern in which the amplitudesdecrease with increasing damping for both bending andtorsion. This may be seen in Figures 11 and 12 for modelM3. The amplitudes of vibration for these addition tests,for both bending and torsion, tended to show an increasewith the solidity and height of the parapet and withincreasing depth of the edge beam. One ‘unusual’ resultwas for model M3 with parapet 2b, an overhang of 0.5dand k/d
4 = 0.1. For this particular case high amplitudes
were obtained from the test results, indeed as high as forthe similar configuration with k/d
4 = 0.5.
Results for model M5, shown in Figures 13 and 14,
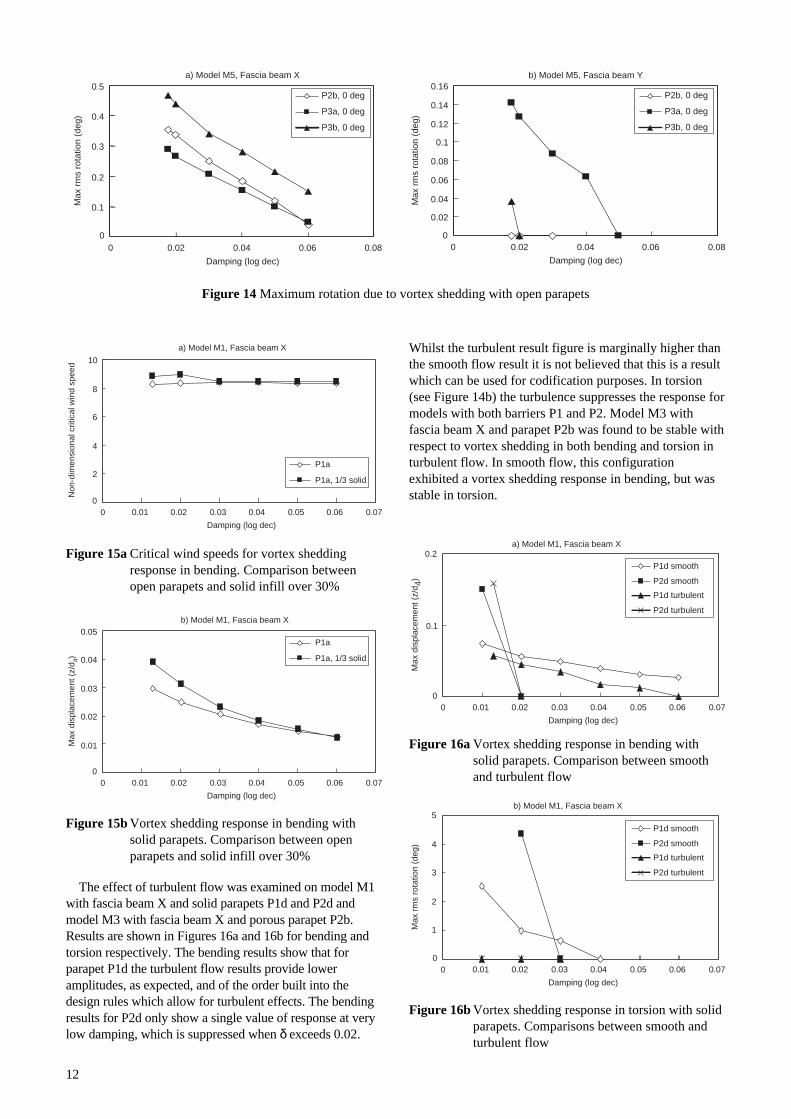
show no consistent trends. Figures 13a and 13b show theresults for bending from which it can be seen that forfascia beam X, parapet P2b provides more severe resultsthan P3a whereas for fascia beam Y this trend is reversed.For fascia beam X the lower parapet P2b provides moresevere results than parapet P3b. In torsion the logicaltrends set out in a) and b) above are followed for fasciabeam X but for fascia beam Y the parapet with the highestsolidity (P3b) produces less onerous results than parapetP3a (see Figure 14.)
From these limited comparisons it can be seen thatgeneral and consistent trends could not always bedeveloped, making codification extremely difficult.
Model M1 with open parapets was tested with a solidinfill over the middle third of the model’s length.Comparisons of critical wind speed and bendingamplitudes with the same model without the infill areshown in Figures 15a and 15b. It can be seen that thecritical wind speed is virtually unaffected but that theamplitude is increased by up to 30% at very low levels ofdamping. At realistic damping levels, however, theincrease is less than 10%. The model without the infill wasstable in torsion, whereas with the solid infill very smalltorsional amplitudes were recorded (see Appendix BTorsion M1X), some 10% of the current Rule value.
Figure 11 Maximum vortex shedding amplitude in bending as a function of damping
Damping (log dec)
Max
dis
plac
emen
t (z/
d 4)
00 0.02 0.04 0.06 0.08
0.01
0.02
0.03
0.04
0.05
0.06
0.07
0.08k/d4=0.1
k/d4=0.3
k/d4=0.5
U
U'
Damping (log dec)
Max
dis
plac
emen
t (z/
d 4)
00 0.02 0.04 0.06 0.08
Damping (log dec)
Max
rot
atio
n (d
egre
es)
0 0.02 0.04 0.06 0.08
k/d4=0.1k/d4=0.5
Damping (log dec)
Max
dis
plac
emen
t (z/
d 4)
00 0.02 0.04 0.06 0.08
k/d4=0.5
0.02
0.04
0.06
0.08
0.1k/d4=0.3
k/d4=0.5
U'
a) Model M3, parapet P2a, l/d4=0.50 b) Model M3, parapet P2b, l/d4=0.50
c) Model M3, parapet P2a, l/d4=0.25 d) Model M3, parapet P2b, l/d4=0.25
0.05
0.1
0
0.02
0.04
0.06
0.08
0.1
0.12
Max
dis
plac
emen
t (z
/d4)
11
Figure 12 Maximum rotation due to vortex shedding in torsion as a function of damping
Figure 13 Maximum vortex shedding amplitude in bending with open parapets
P2b, 0 deg
P3a, 0 deg
P3b, 0 deg
Damping (log dec)
Max
dis
plac
emen
t (z/
d 4)
0 0.02 0.04 0.06 0.080
0.05a) Model M5, Fascia beam X
Damping (log dec)
Max
dis
plac
emen
t (z/
d 4)
P2b, 0 deg
P3a, 0 deg
P3b, 0 deg
00 0.02 0.04 0.06 0.08
b) Model M5, Fascia beam Y
0.002
0.004
0.006
0.008
0.01
0.012
0.014
0.016
Damping (log dec)
00 0.02 0.04 0.06 0.08
k/d4=0.1k/d4=0.3
k/d4=0.5
U'
Damping (log dec)
Max
rms
rota
tion
(deg
)
00 0.02 0.04 0.06 0.08
Damping (log dec)
Max
rms
rota
tion
(deg
)
00 0.02 0.04 0.06 0.08
k/d4=0.1k/d4=0.5
Damping (log dec)
Max
rms
rota
tion
(deg
)
00 0.02 0.04 0.06 0.08
k/d4=0.5k/d4=0.3k/d4=0.5
U'
a) Model M3, parapet P2a, L/d4=0.50 b) Model M3, parapet P2b, L/d4=0.50
c) Model M3, parapet P2a, L/d4=0.25 d) Model M3, parapet P2b, L/d4=0.25
0.1
0.2
0.3
0.4
0.5
0.6
0.2
0.4
0.6
0.8
1
1.2
1.4
0.1
0.2
0.3
0.4
0.5
0.6
0.2
0.4
0.6
0.8
1
1.2
Max
rm
s ro
tatio
n (d
eg)
12
Whilst the turbulent result figure is marginally higher thanthe smooth flow result it is not believed that this is a resultwhich can be used for codification purposes. In torsion(see Figure 14b) the turbulence suppresses the response formodels with both barriers P1 and P2. Model M3 withfascia beam X and parapet P2b was found to be stable withrespect to vortex shedding in both bending and torsion inturbulent flow. In smooth flow, this configurationexhibited a vortex shedding response in bending, but wasstable in torsion.
Figure 14 Maximum rotation due to vortex shedding with open parapets
P2b, 0 deg
P3a, 0 deg
P3b, 0 deg
Damping (log dec)
Max
rms
rota
tion
(deg
)
0 0.02 0.04 0.06 0.080
a) Model M5, Fascia beam X
0.1
0.2
0.3
0.4
0.5
Damping (log dec)
Max
rms
rota
tion
(deg
)
P2b, 0 deg
P3a, 0 deg
P3b, 0 deg
00 0.02 0.04 0.06 0.08
b) Model M5, Fascia beam Y
0.02
0.04
0.06
0.08
0.1
0.12
0.14
0.16
Figure 15b Vortex shedding response in bending withsolid parapets. Comparison between openparapets and solid infill over 30%
P1a
P1a, 1/3 solid
Damping (log dec)
Non
-dim
ensi
onal
crit
ical
win
d sp
eed
00
2
4
6
8
10
0.01 0.02 0.03 0.04 0.05 0.06 0.07
a) Model M1, Fascia beam X
Figure 15a Critical wind speeds for vortex sheddingresponse in bending. Comparison betweenopen parapets and solid infill over 30%
P1a
P1a, 1/3 solid
Damping (log dec)
Max
dis
plac
emen
t (z/
d 4)
00
0.01 0.02 0.03 0.04 0.05 0.06 0.07
0.01
0.02
0.03
0.04
0.05b) Model M1, Fascia beam X
The effect of turbulent flow was examined on model M1with fascia beam X and solid parapets P1d and P2d andmodel M3 with fascia beam X and porous parapet P2b.Results are shown in Figures 16a and 16b for bending andtorsion respectively. The bending results show that forparapet P1d the turbulent flow results provide loweramplitudes, as expected, and of the order built into thedesign rules which allow for turbulent effects. The bendingresults for P2d only show a single value of response at verylow damping, which is suppressed when δ exceeds 0.02.
Figure 16b Vortex shedding response in torsion with solidparapets. Comparisons between smooth andturbulent flow
Figure 16a Vortex shedding response in bending withsolid parapets. Comparison between smoothand turbulent flow
Damping (log dec)
Max
rms
rota
tion
(deg
)
00
0.01 0.02 0.03 0.04 0.05 0.06 0.07
1
2
3
4
5P1d smooth
P2d smoothP1d turbulent
P2d turbulent
b) Model M1, Fascia beam X
Damping (log dec)
Max
dis
plac
emen
t (z/
d 4)
00
0.01 0.02 0.03 0.04 0.05 0.06 0.07
0.1
0.2P1d smooth
P2d smoothP1d turbulent
P2d turbulent
a) Model M1, Fascia beam X
13
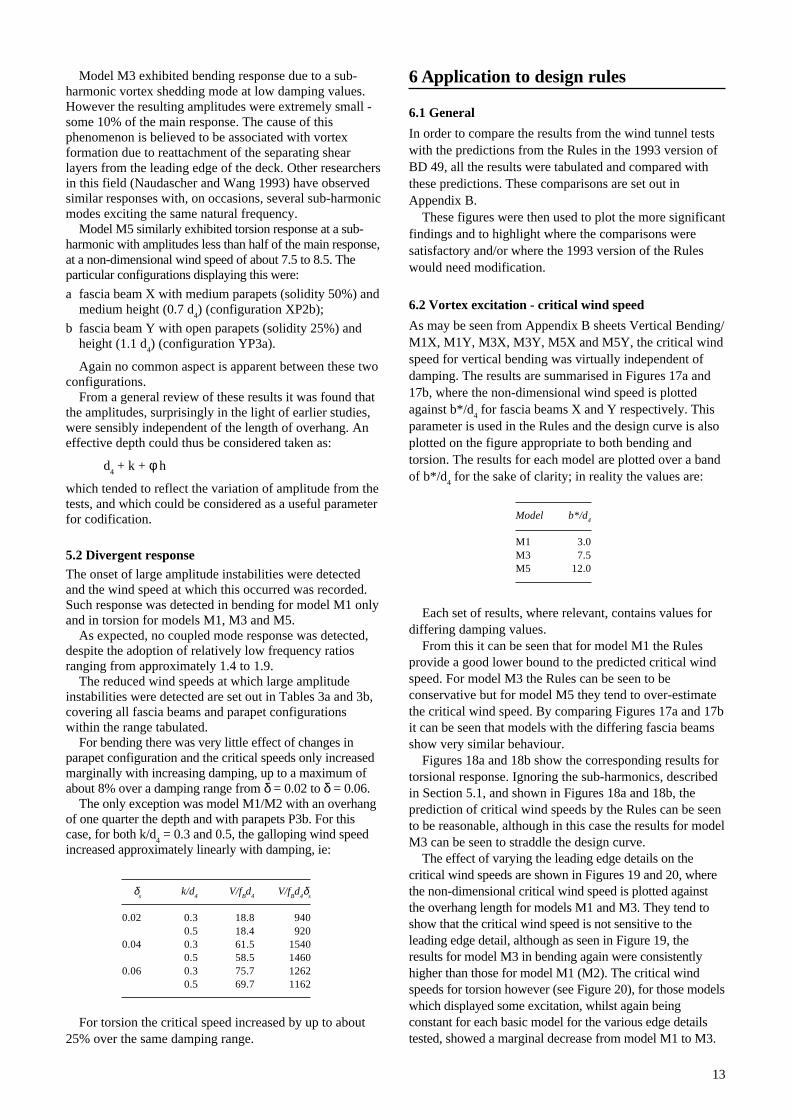
Model M3 exhibited bending response due to a sub-harmonic vortex shedding mode at low damping values.However the resulting amplitudes were extremely small -some 10% of the main response. The cause of thisphenomenon is believed to be associated with vortexformation due to reattachment of the separating shearlayers from the leading edge of the deck. Other researchersin this field (Naudascher and Wang 1993) have observedsimilar responses with, on occasions, several sub-harmonicmodes exciting the same natural frequency.
Model M5 similarly exhibited torsion response at a sub-harmonic with amplitudes less than half of the main response,at a non-dimensional wind speed of about 7.5 to 8.5. Theparticular configurations displaying this were:
a fascia beam X with medium parapets (solidity 50%) andmedium height (0.7 d
4) (configuration XP2b);
b fascia beam Y with open parapets (solidity 25%) andheight (1.1 d
4) (configuration YP3a).
Again no common aspect is apparent between these twoconfigurations.
From a general review of these results it was found thatthe amplitudes, surprisingly in the light of earlier studies,were sensibly independent of the length of overhang. Aneffective depth could thus be considered taken as:
d4 + k + φ h
which tended to reflect the variation of amplitude from thetests, and which could be considered as a useful parameterfor codification.
5.2 Divergent responseThe onset of large amplitude instabilities were detectedand the wind speed at which this occurred was recorded.Such response was detected in bending for model M1 onlyand in torsion for models M1, M3 and M5.
As expected, no coupled mode response was detected,despite the adoption of relatively low frequency ratiosranging from approximately 1.4 to 1.9.
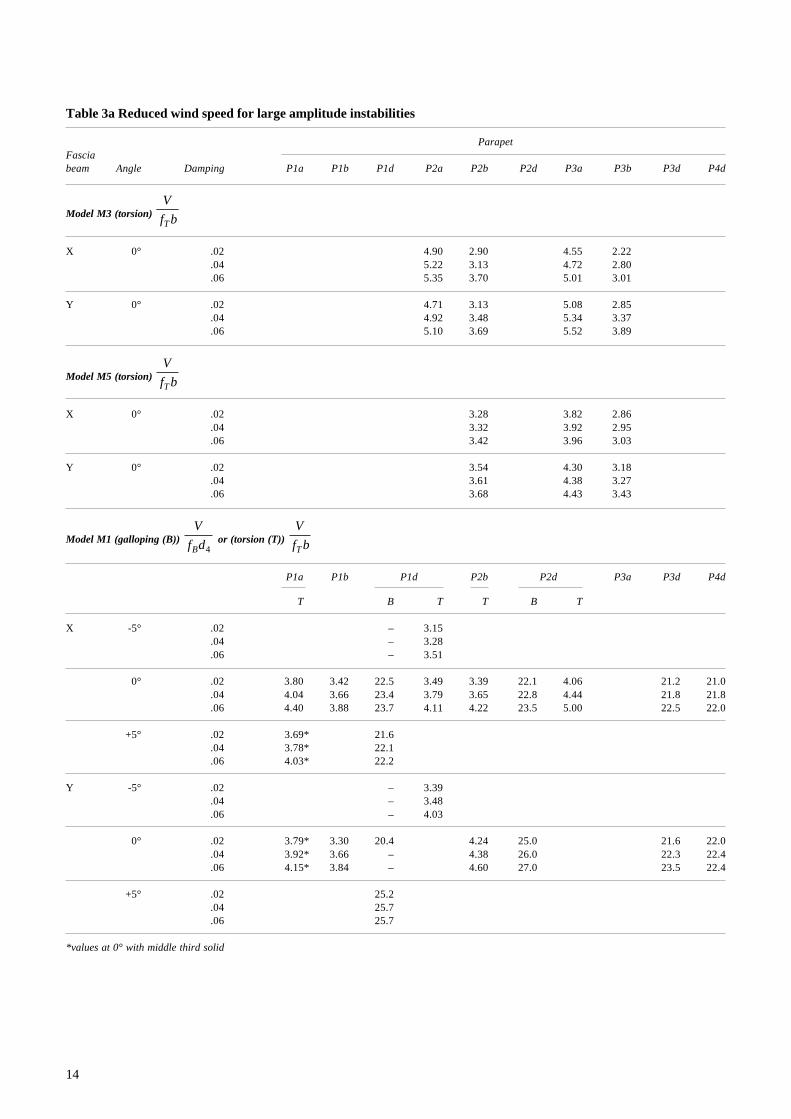
The reduced wind speeds at which large amplitudeinstabilities were detected are set out in Tables 3a and 3b,covering all fascia beams and parapet configurationswithin the range tabulated.
For bending there was very little effect of changes inparapet configuration and the critical speeds only increasedmarginally with increasing damping, up to a maximum ofabout 8% over a damping range from δ = 0.02 to δ = 0.06.
The only exception was model M1/M2 with an overhangof one quarter the depth and with parapets P3b. For thiscase, for both k/d
4 = 0.3 and 0.5, the galloping wind speed
increased approximately linearly with damping, ie:
6 Application to design rules
6.1 General
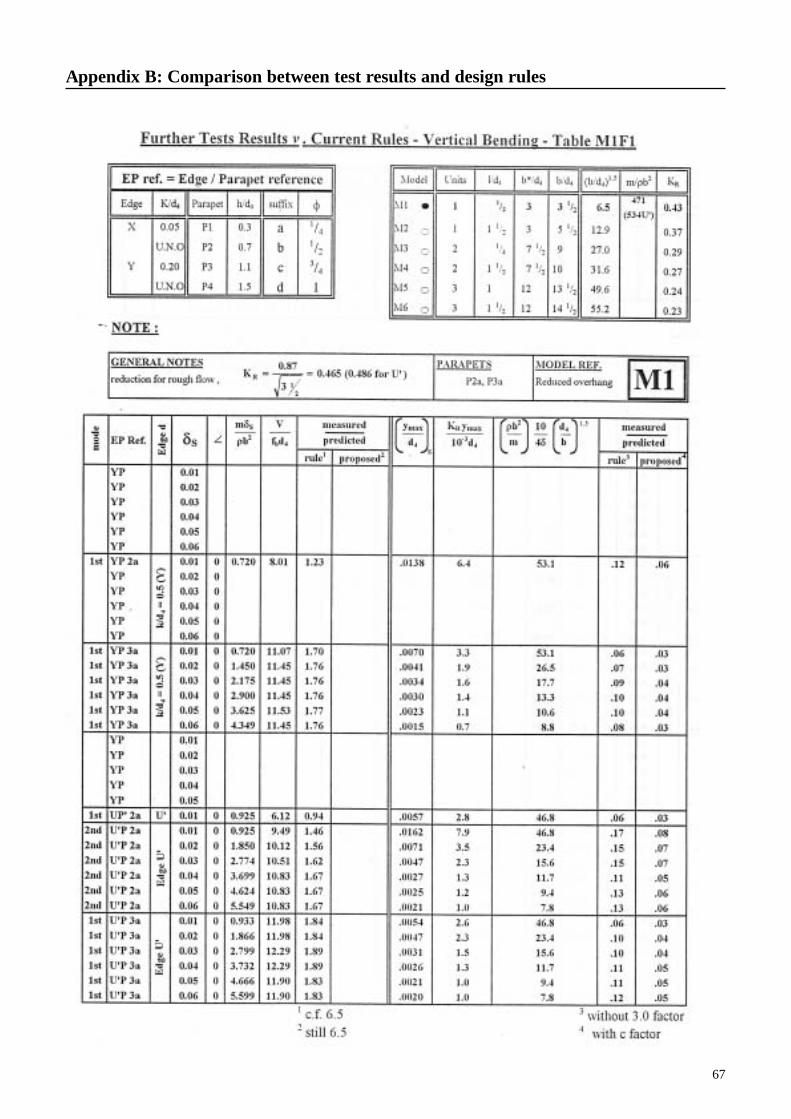
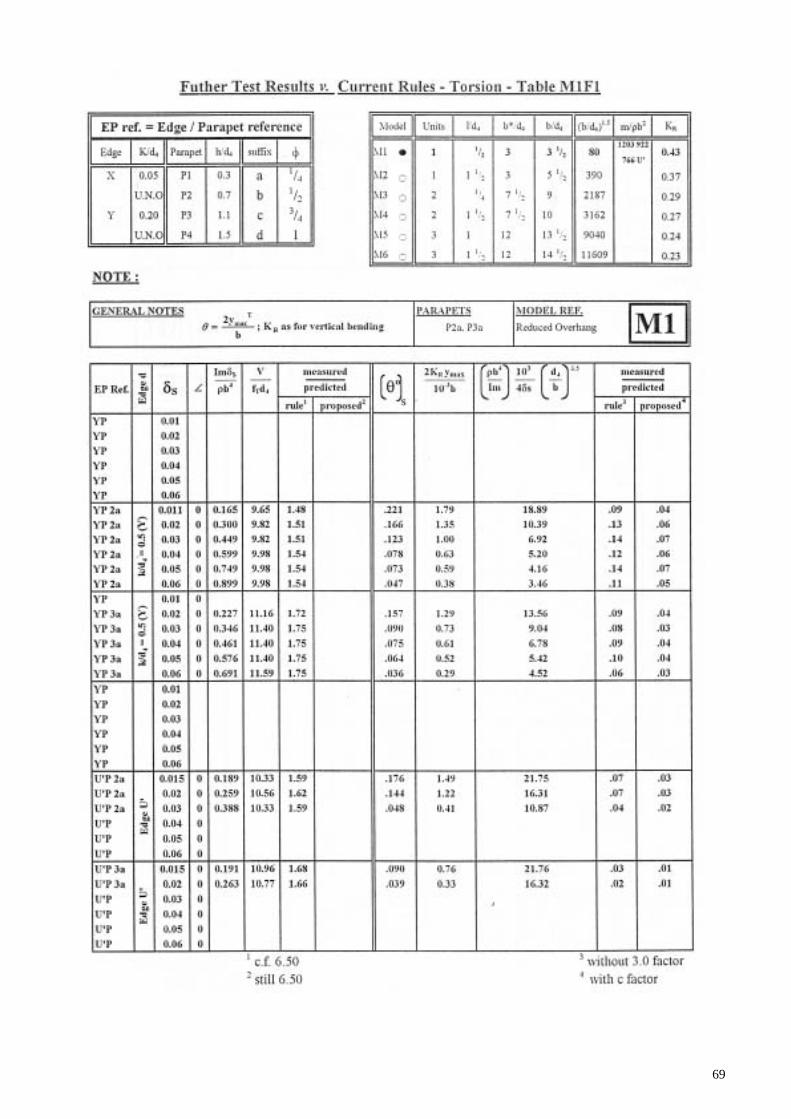
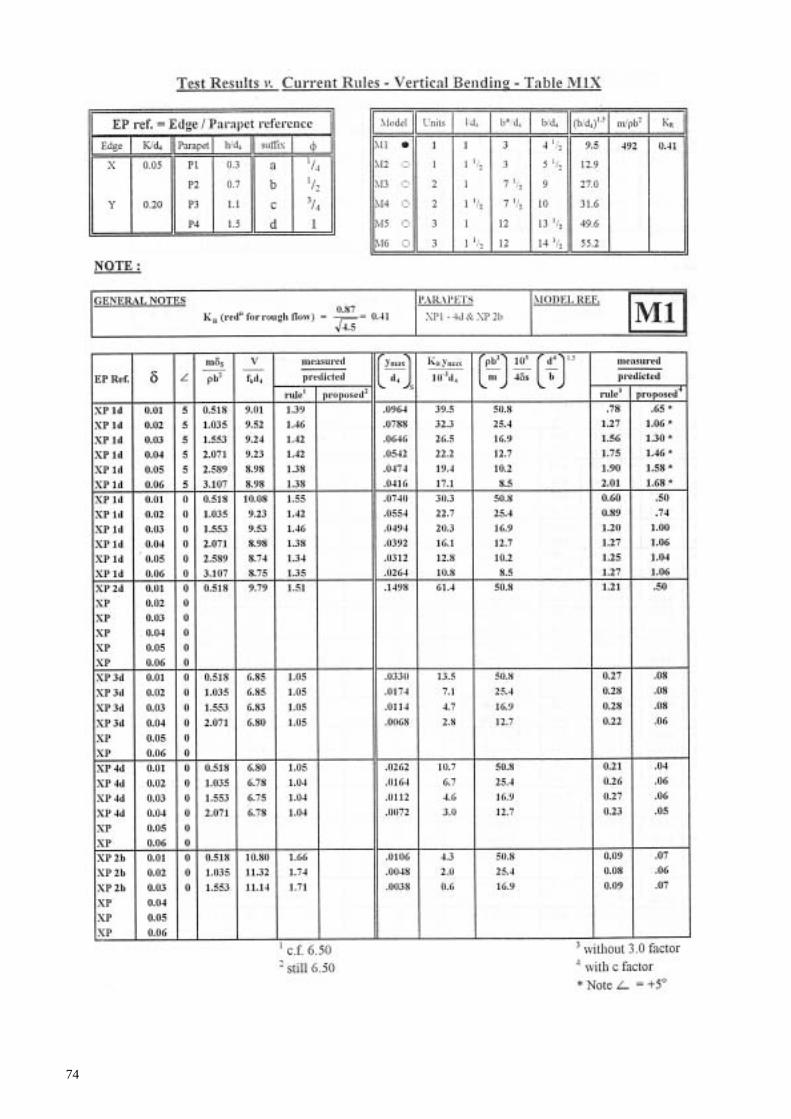
In order to compare the results from the wind tunnel testswith the predictions from the Rules in the 1993 version ofBD 49, all the results were tabulated and compared withthese predictions. These comparisons are set out inAppendix B.
These figures were then used to plot the more significantfindings and to highlight where the comparisons weresatisfactory and/or where the 1993 version of the Ruleswould need modification.
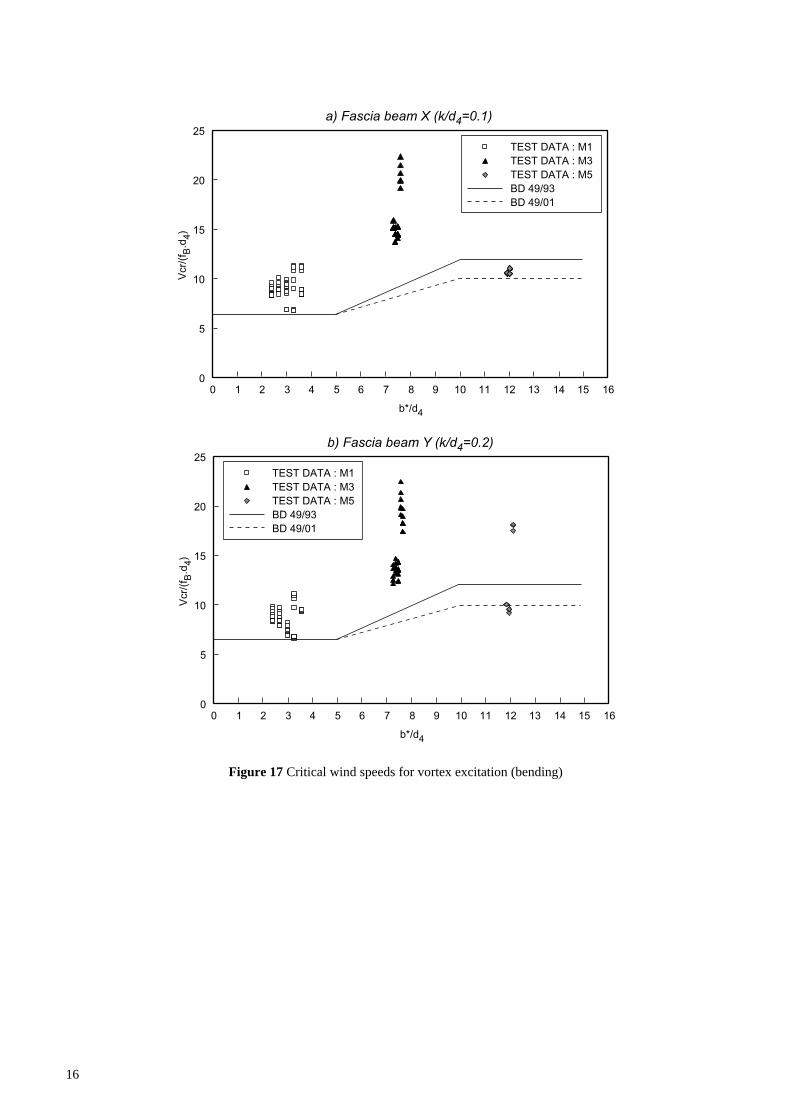
6.2 Vortex excitation - critical wind speed
As may be seen from Appendix B sheets Vertical Bending/M1X, M1Y, M3X, M3Y, M5X and M5Y, the critical windspeed for vertical bending was virtually independent ofdamping. The results are summarised in Figures 17a and17b, where the non-dimensional wind speed is plottedagainst b*/d
4 for fascia beams X and Y respectively. This
parameter is used in the Rules and the design curve is alsoplotted on the figure appropriate to both bending andtorsion. The results for each model are plotted over a bandof b*/d
4 for the sake of clarity; in reality the values are:
δs
k/d4
V/fBd
4V/f
Bd
4δ
s
0.02 0.3 18.8 9400.5 18.4 920
0.04 0.3 61.5 15400.5 58.5 1460
0.06 0.3 75.7 12620.5 69.7 1162
Model b*/d4
M1 3.0M3 7.5M5 12.0
Each set of results, where relevant, contains values fordiffering damping values.
From this it can be seen that for model M1 the Rulesprovide a good lower bound to the predicted critical windspeed. For model M3 the Rules can be seen to beconservative but for model M5 they tend to over-estimatethe critical wind speed. By comparing Figures 17a and 17bit can be seen that models with the differing fascia beamsshow very similar behaviour.
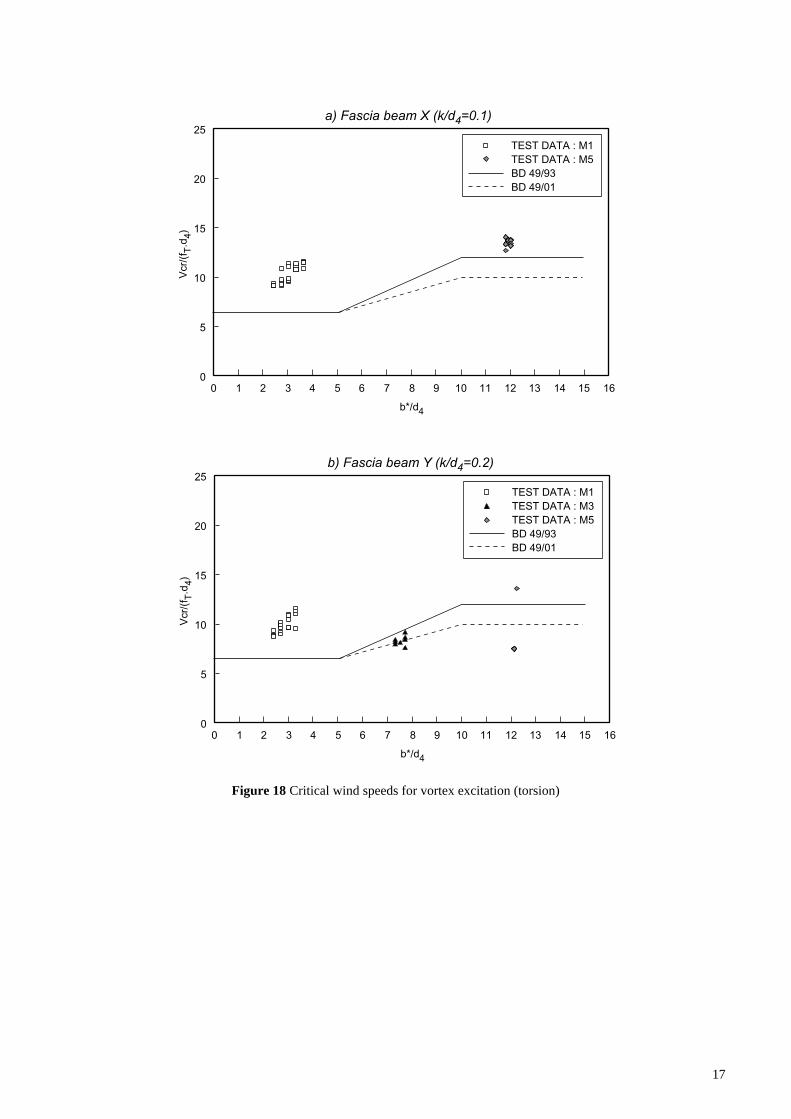
Figures 18a and 18b show the corresponding results fortorsional response. Ignoring the sub-harmonics, describedin Section 5.1, and shown in Figures 18a and 18b, theprediction of critical wind speeds by the Rules can be seento be reasonable, although in this case the results for modelM3 can be seen to straddle the design curve.
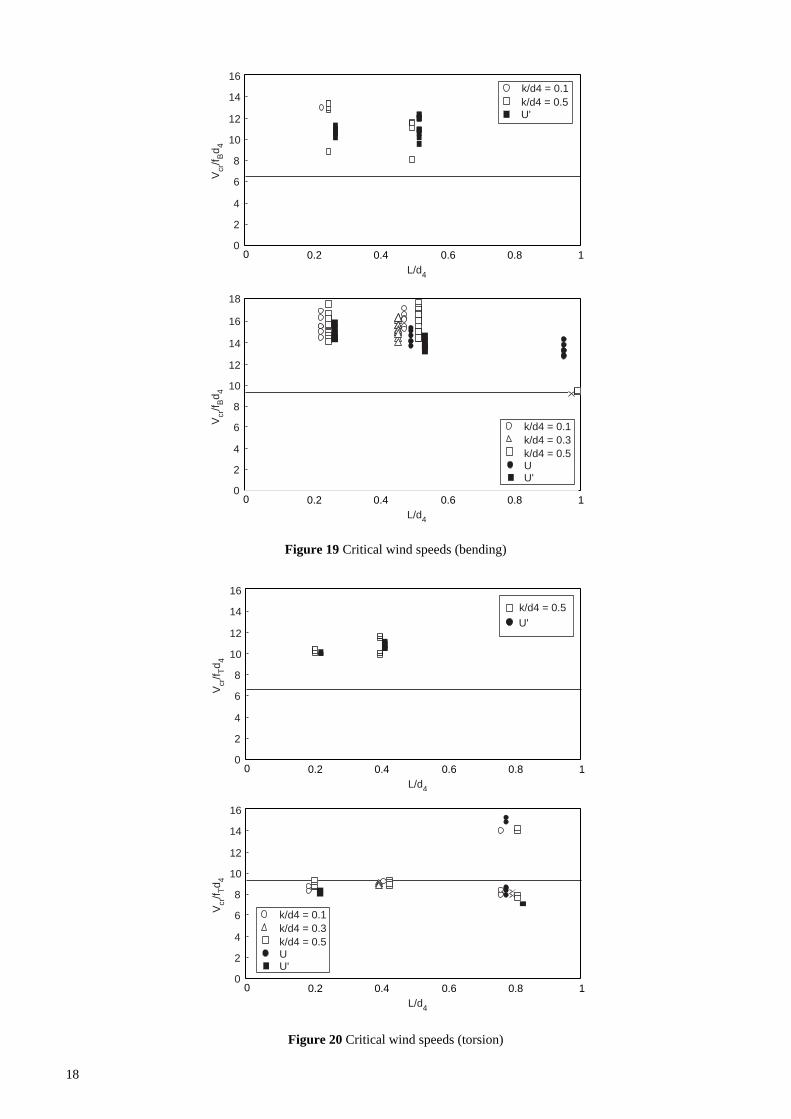
The effect of varying the leading edge details on thecritical wind speeds are shown in Figures 19 and 20, wherethe non-dimensional critical wind speed is plotted againstthe overhang length for models M1 and M3. They tend toshow that the critical wind speed is not sensitive to theleading edge detail, although as seen in Figure 19, theresults for model M3 in bending again were consistentlyhigher than those for model M1 (M2). The critical windspeeds for torsion however (see Figure 20), for those modelswhich displayed some excitation, whilst again beingconstant for each basic model for the various edge detailstested, showed a marginal decrease from model M1 to M3.
For torsion the critical speed increased by up to about25% over the same damping range.
14
Table 3a Reduced wind speed for large amplitude instabilities
ParapetFasciabeam Angle Damping P1a P1b P1d P2a P2b P2d P3a P3b P3d P4d
Model M3 (torsion) V
f bT
X 0° .02 4.90 2.90 4.55 2.22.04 5.22 3.13 4.72 2.80.06 5.35 3.70 5.01 3.01
Y 0° .02 4.71 3.13 5.08 2.85.04 4.92 3.48 5.34 3.37.06 5.10 3.69 5.52 3.89
Model M5 (torsion) V
f bT
X 0° .02 3.28 3.82 2.86.04 3.32 3.92 2.95.06 3.42 3.96 3.03
Y 0° .02 3.54 4.30 3.18.04 3.61 4.38 3.27.06 3.68 4.43 3.43
Model M1 (galloping (B)) V
fBd4 or (torsion (T))
V
f bT
P1a P1b P1d P2b P2d P3a P3d P4d
T B T T B T
X -5° .02 – 3.15.04 – 3.28.06 – 3.51
0° .02 3.80 3.42 22.5 3.49 3.39 22.1 4.06 21.2 21.0.04 4.04 3.66 23.4 3.79 3.65 22.8 4.44 21.8 21.8.06 4.40 3.88 23.7 4.11 4.22 23.5 5.00 22.5 22.0
+5° .02 3.69* 21.6.04 3.78* 22.1.06 4.03* 22.2
Y -5° .02 – 3.39.04 – 3.48.06 – 4.03
0° .02 3.79* 3.30 20.4 4.24 25.0 21.6 22.0.04 3.92* 3.66 – 4.38 26.0 22.3 22.4.06 4.15* 3.84 – 4.60 27.0 23.5 22.4
+5° .02 25.2.04 25.7.06 25.7
*values at 0° with middle third solid

15
Table 3b Reduced wind speed for large amplitude instabilities (All tested at 0o inclination)
Edge detail ( k/d4
) or typeOverhang DampingL/d
4Parapet δ
s0.1(X) 0.3(Y) 0.4(Y) 0.5(Y) U U1
Model M3 (torsion) V
fT b
FHG
IKJ
1.0 2a 0.02 4.5 4.9 4.5 3.7 4.60.04 4.7 5.2 4.8 3.9 4.90.06 5.0 5.3 4.9 4.1 5.2
0.5 2a 0.02 4.0 3.5 3.7 3.8 3.70.04 4.2 3.8 4.0 4.1 4.00.06 4.5 4.0 4.2 4.3 4.2
2b 0.02 2.9 3.20.04 3.5 3.60.06 3.8 3.8
0.25 2a 0.02 3.7 3.6 3.00.04 4.0 3.8 3.50.06 4.2 4.0 3.8
2b 0.02 3.20.04 3.80.06 4.1
M1/M2 (galloping) V
fBd4
FHG
IKJ
0.5 2a 0.02 22.2 20.10.04 22.5 21.00.06 23.1 22.0
3a 0.02 23.0 21.90.04 23.5 22.70.06 24.0 24.3
0.25 2a 0.02 17.5 14.90.04 17.6 15.10.06 17.8 15.2
3b 0.02 18.8 18.40.04 61.5 58.50.06 75.7 69.7
16
0
5
10
15
20
25
0 1 2 3 4 5 6 7 8 9 10 11 12 13 14 15 16
b*/d4
TEST DATA : M1TEST DATA : M3TEST DATA : M5BD 49/93BD 49/01
Vcr
/(f B
.d4)
a) Fascia beam X (k/d4=0.1)
0
5
10
15
20
25
0 1 2 3 4 5 6 7 8 9 10 11 12 13 14 15 16
b*/d4
TEST DATA : M1TEST DATA : M3TEST DATA : M5BD 49/93BD 49/01
Vcr
/(f B
.d4)
b) Fascia beam Y (k/d4=0.2)
Figure 17 Critical wind speeds for vortex excitation (bending)
17
0
5
10
15
20
25
0 1 2 3 4 5 6 7 8 9 10 11 12 13 14 15 16
b*/d4
TEST DATA : M1TEST DATA : M5BD 49/93BD 49/01
Vcr
/(f T
.d4)
a) Fascia beam X (k/d4=0.1)
0
5
10
15
20
25
0 1 2 3 4 5 6 7 8 9 10 11 12 13 14 15 16
b*/d4
Vcr
/(f T
.d4)
TEST DATA : M1TEST DATA : M3TEST DATA : M5BD 49/93BD 49/01
b) Fascia beam Y (k/d4=0.2)
Figure 18 Critical wind speeds for vortex excitation (torsion)
18
Figure 19 Critical wind speeds (bending)
Figure 20 Critical wind speeds (torsion)
0
2
4
6
8
10
12
14
16
0 0.2 0.4 0.6 0.8 1L/d4
k/d4 = 0.1
V cr/f Bd
4
k/d4 = 0.5U'
0
2
4
6
8
10
12
14
16
18
0 0.2 0.4 0.6 0.8 1L/d4
k/d4 = 0.1 k/d4 = 0.3 k/d4 = 0.5 U U'
V cr/f Bd
4
0
2
4
6
8
10
12
14
16
0 0.2 0.4 0.6 0.8 1L/d4
k/d4 = 0.1 k/d4 = 0.3 k/d4 = 0.5 U U'
V cr/f Td
4
0
2
4
6
8
10
12
14
16
0 0.2 0.4 0.6 0.8 1L/d4
V cr/f Td
4
k/d4 = 0.5 U'

19
These results suggest therefore that it may be prudent todecrease the prediction of critical wind speed, V
cr, in bending
and torsion for higher b*/d4 ratios for plate girders using:
Vcr
= 6.5fd4 for b*/d
4 < 5
Vcr
= fd4 (0.7 b*/d
4 + 3.0) for 5 ≤ b*/d
4 < 10
Vcr
= 10fd4 for b*/d
4 ≥ 10
These revised values are shown on Figures 19 and 20.
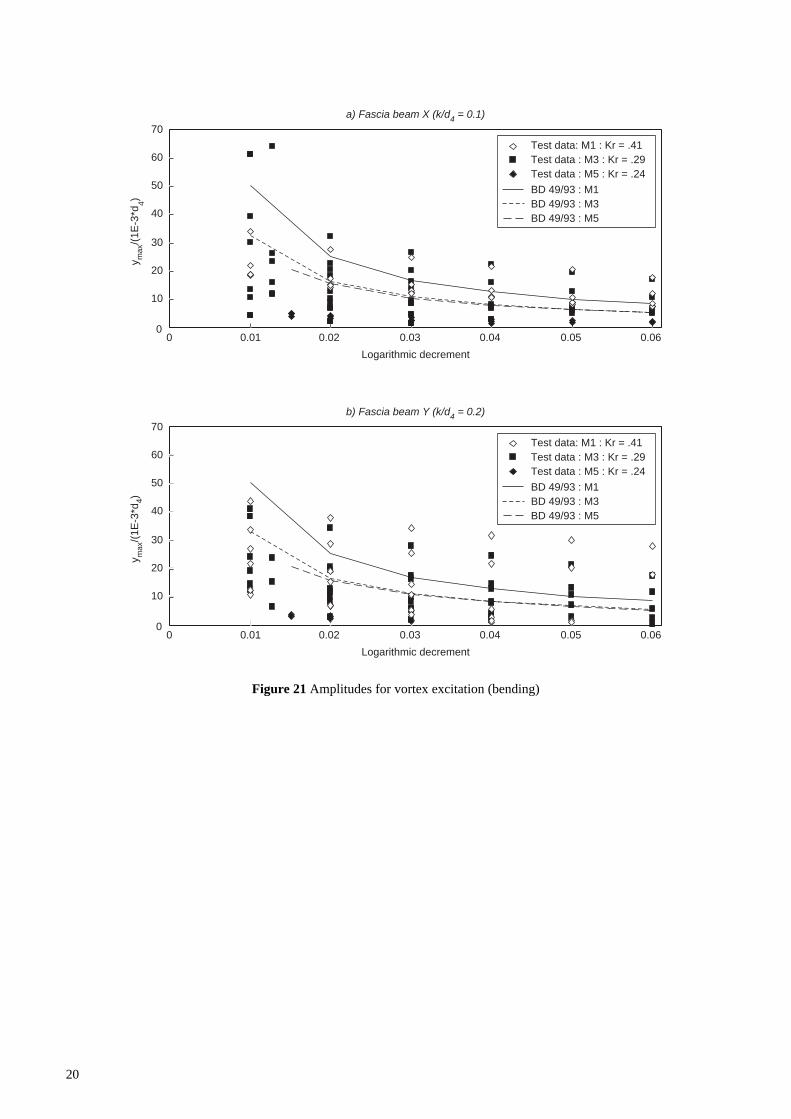
6.3 Vortex excitation - amplitudes
6.3.1 BendingThe vertical bending amplitudes for each model are shownin Figure 21a for fascia beam X and Figure 21b for fasciabeam Y, plotted against the logarithmic decrement ofdamping. The relevant curves from the design rules,appropriate to each model are also plotted.
From these figures it can be seen that the amplitudes frommany tests exceeded the predicted amplitudes, particularlyat the higher levels of damping. However these plots showthe results for all tests whereas many of the configurationsdo not comply with the restraints set out in the current Rulesfor edge geometry, and only within which the simplifiedformulae for amplitudes in the Rules apply.
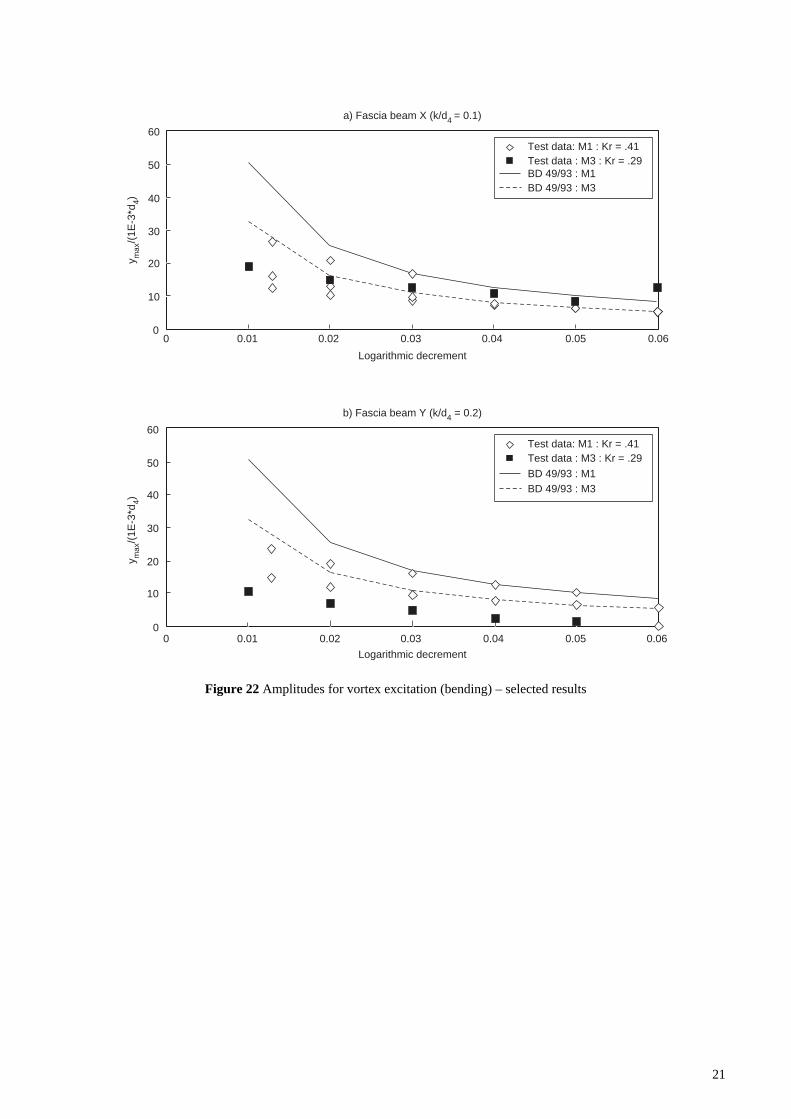
By omitting all those configurations that do not conformto these restraints, the Rules can be seen to apply moresatisfactorily, as shown in Figures 22a and 22b. Only themodel with parapet heights of 0.7 times the depth and lowsolidity exceed the design curve at damping values greaterthan 0.03.
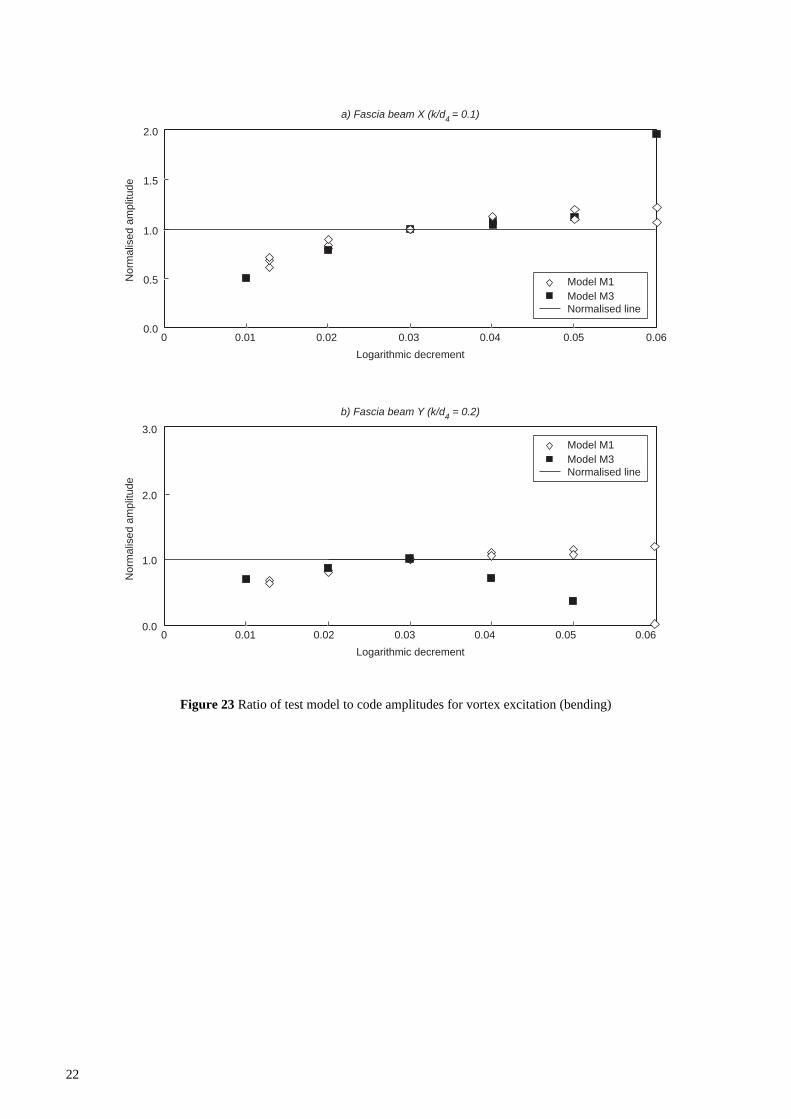
Figure 23 shows the ratio of measured amplitudes topredicted amplitudes for models M1 and M3 normalised to1.0 at δ = 0.03. This indicates the trend of the test results toincrease more rapidly than the accepted linear factoragainst damping, as incorporated in the Rules.
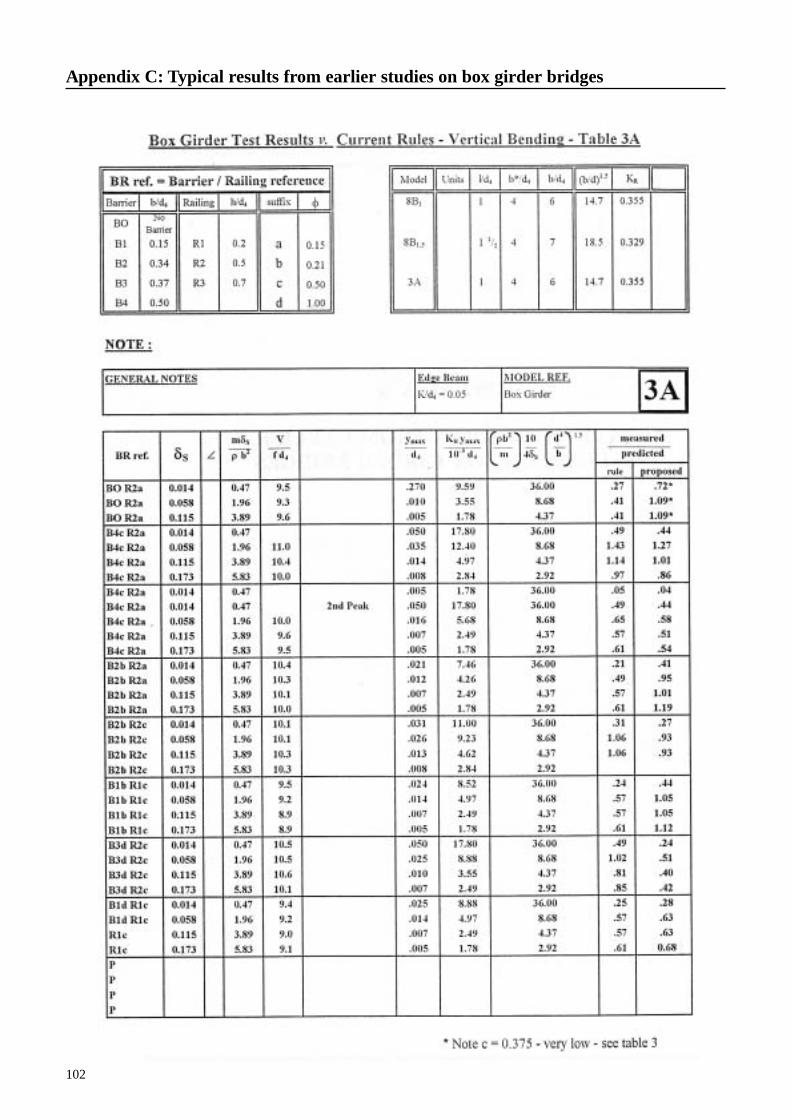
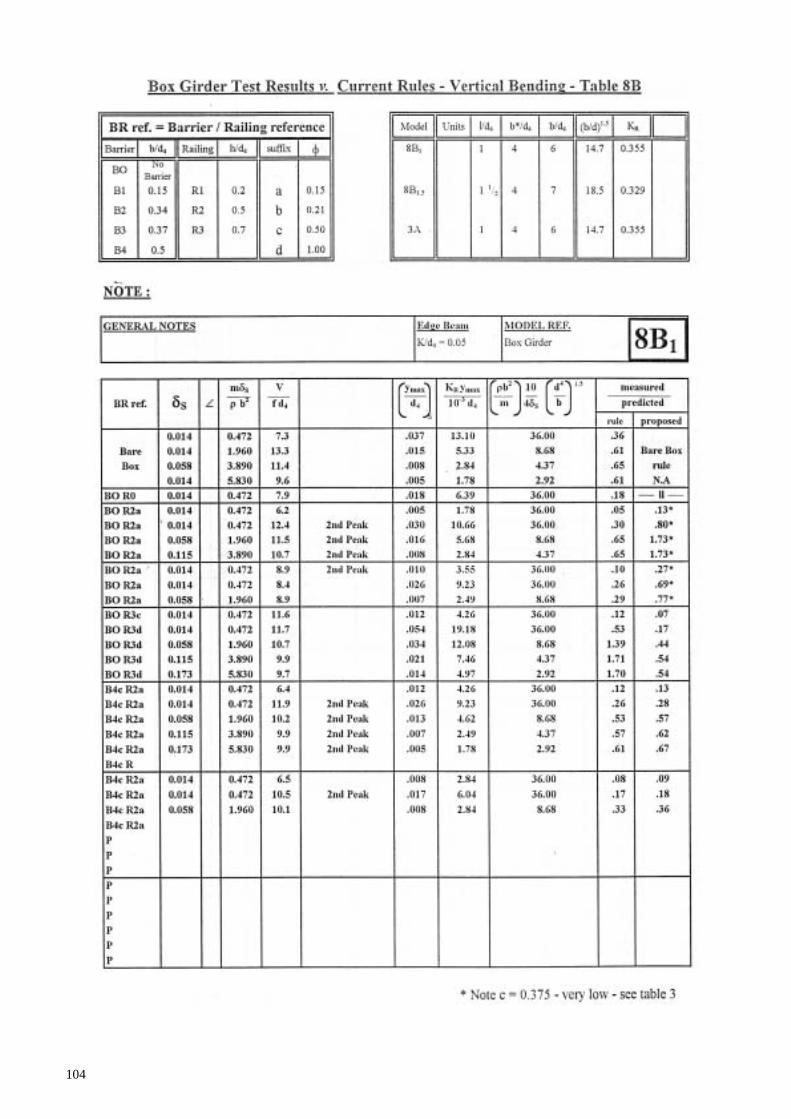
Comparisons have been made with the earlier tests carriedout at BMT (formerly NMI) on box girder bridges whichformed the basis of the Rules. These showed that the Rulesgenerally predicted amplitudes between about 100% and300% of the measured values for those configurationsmeeting the geometric criteria of the Rules. Typical results,in the form provided for the plate girder results in AppendixB, are given for three models tested in Appendix C.
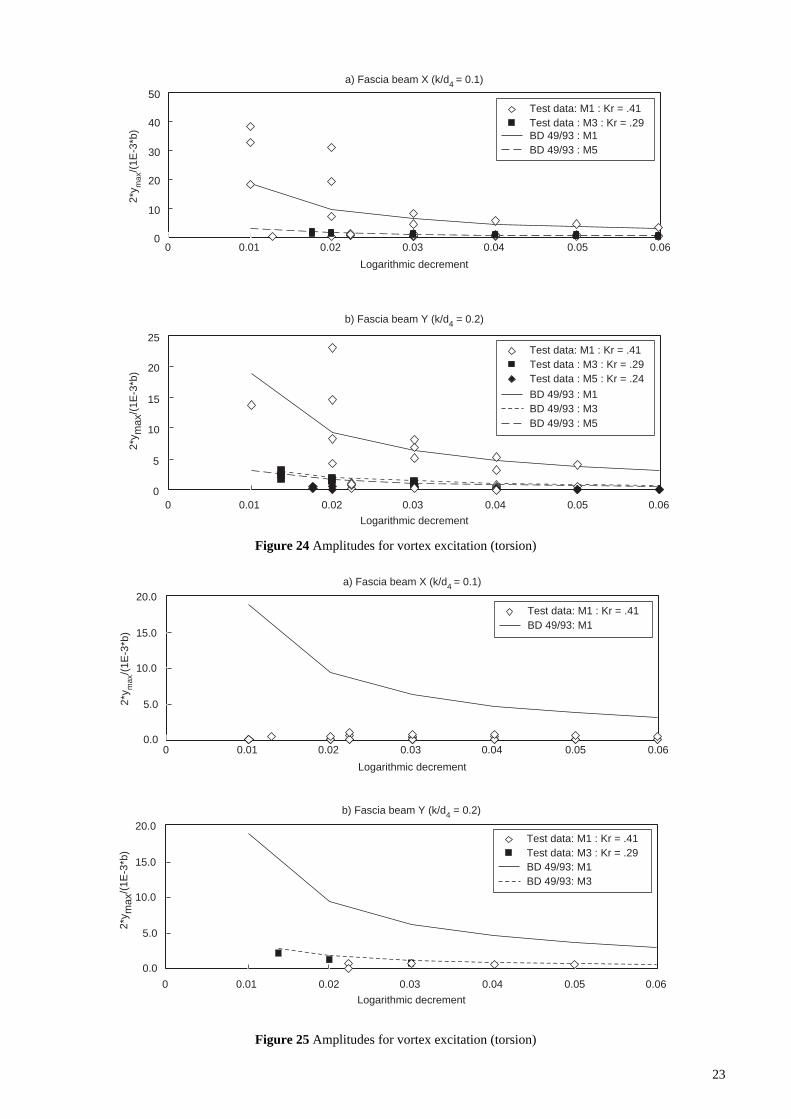
6.3.2 TorsionTorsional amplitudes for all test configurations are shownin Figure 24a for fascia beam X and Figure 24b for fasciabeam Y. Once again several results are above the curvefrom the design rules. However when those configurationswhich do not meet the criteria for edge geometry to theRules are omitted, as shown in Figures 25a and 25b, then itcan be seen that the Rules provide very conservativevalues of torsional amplitudes. Note that only models M1and M3 complied with the restraints, and for fascia beamX all the results showed stable behaviour.
6.4 Large amplitude instabilities
The Rules stipulate that plate girder bridges need not beconsidered for vertical galloping, the instability only
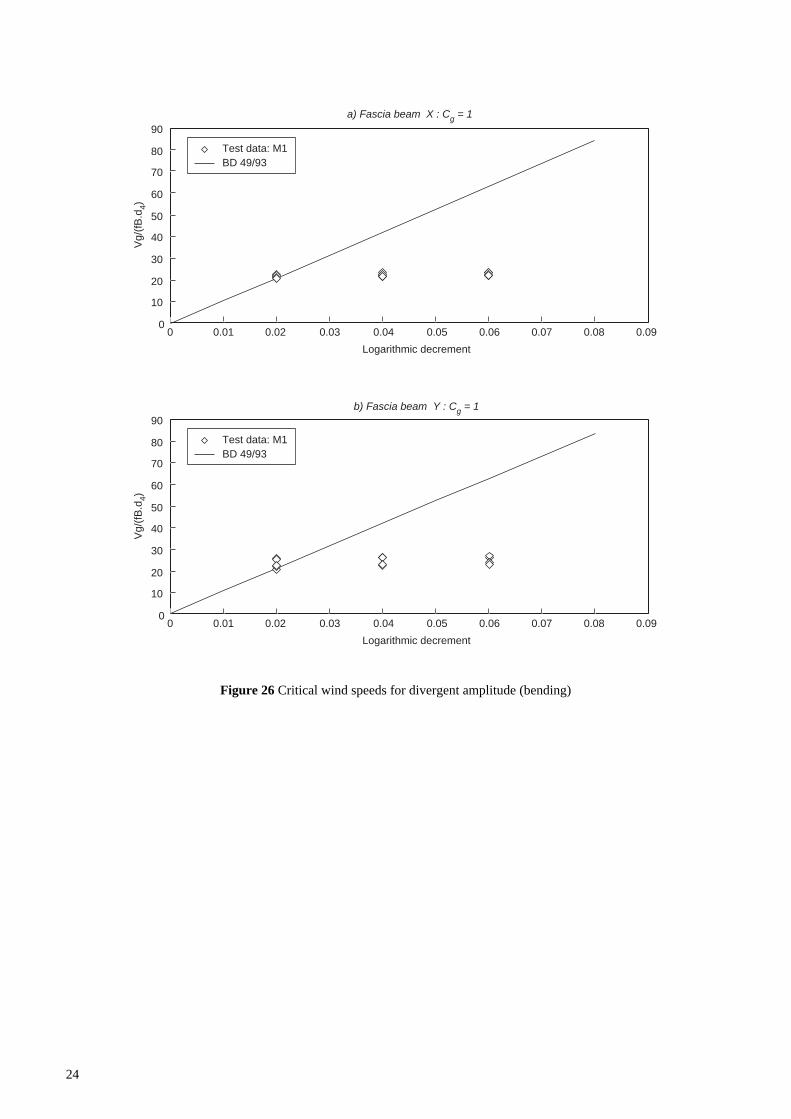
being considered appropriate for box girder sections ofrelatively narrow aspect ratio (b*/d < 4). However thetests showed that vertical bending instability did occurfor all configurations of model M1 with solid parapets asshown in Figure 26a for fascia beam X and Figure 26bfor fascia beam Y.
The Rules, when applied, assume that the critical windspeed increases with structural damping, but this was notreflected in the test results, as can be seen from thesefigures. However these models, with solid barriers, wouldnot conform with the geometric criteria of the Rules, sofrom the point of view of design this is irrelevant.Nevertheless this needs consideration and possibly furtherstudy to explain this apparently unexpected result.
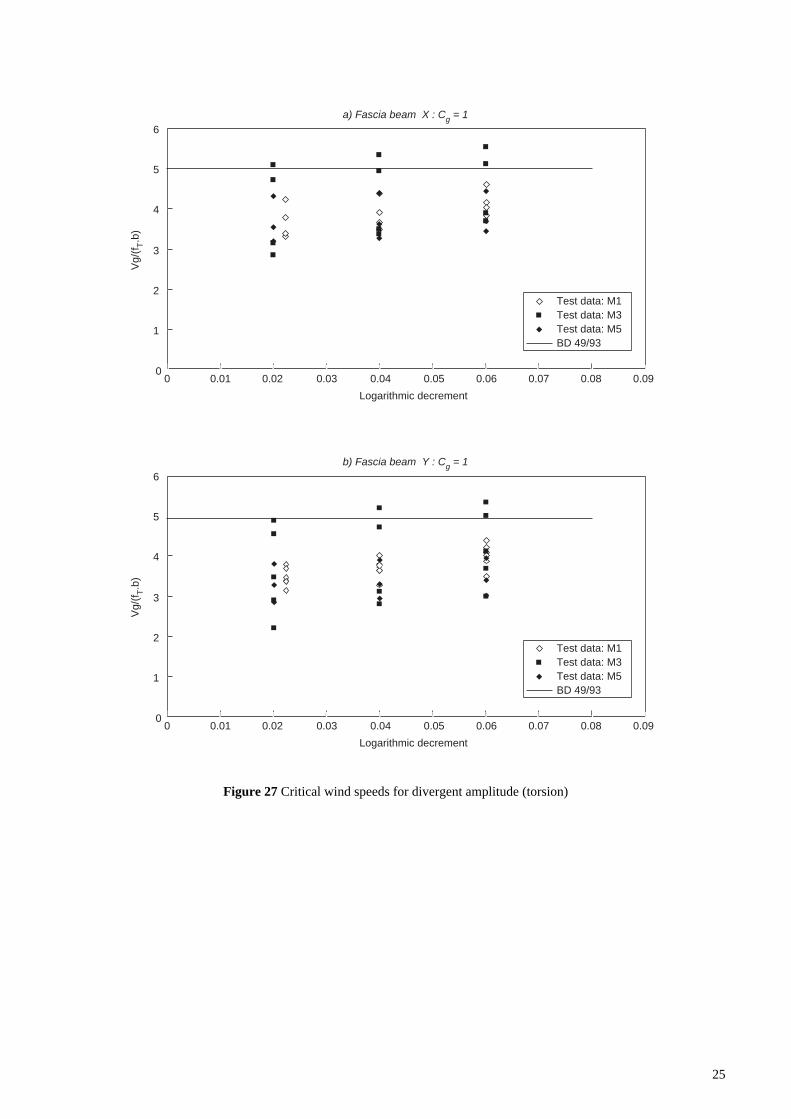
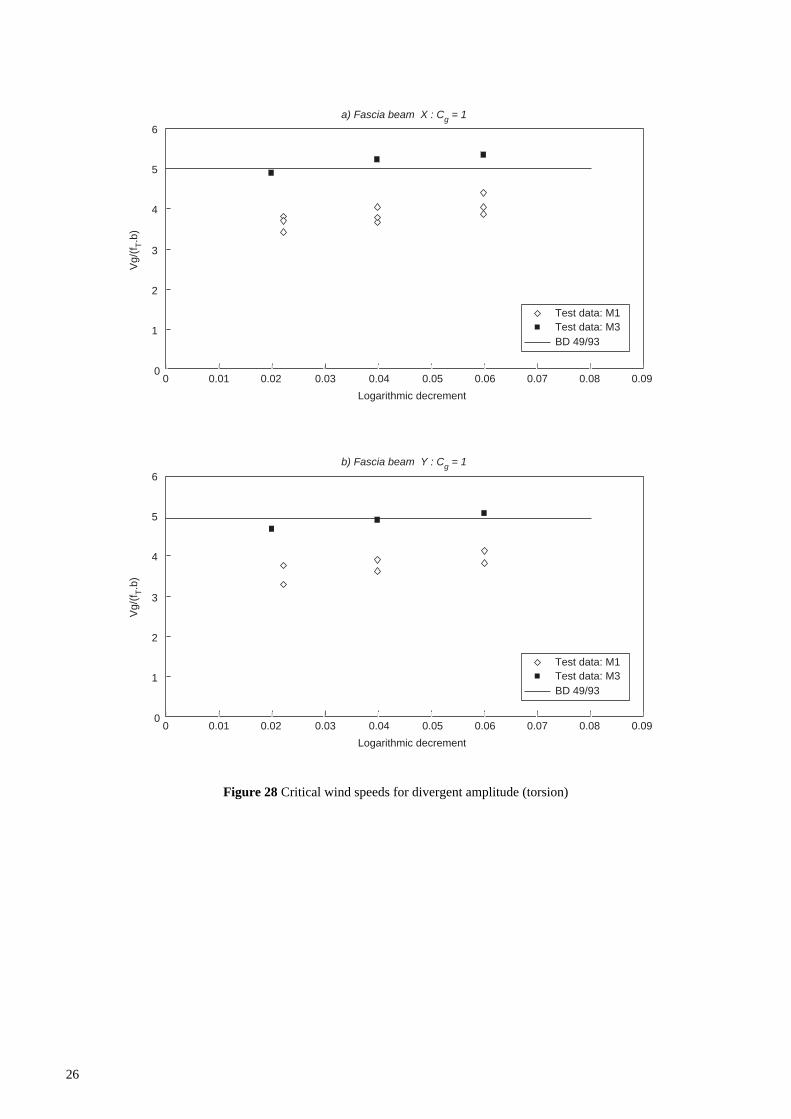
Torsional motion was detected in all three models, theresults for which are shown in Figures 27a and 27b, forfascia beams X and Y respectively. It can be seen that theRules overestimate the critical wind speed, which would benon-conservative. However again the edge geometry formany of the test configurations, including that for all ofmodel M5 sections, does not comply with the criteria in theRules for which the formulation for critical wind speedapplies. Figures 28a and 28b give the results for thoseconfigurations which do comply from which it can be seenthat whereas the results for model M3 are close to the Rules,those for model M1 are significantly below the Rule.
The Rules provide more onerous criteria for box girdersections - particularly for relatively shallow configurations.For model M1, if treated as a box girder, this wouldproduce a non-dimensional critical wind speed Vg/f
Tb of
2.6, thereby providing a lower bound to the measured windspeeds. However if applied to models M3 and M5, thevalues would be 1.3 and 0.9 thus providing verypessimistic estimates of critical wind speed.
In practice the Rules require the designer to undertake acalculation to predict the critical wind speed for classicalflutter for all bridge types (Clause 2.1.3.3).
The lower bound non-dimensional wind speed from thiscalculation is 2.5, so it is possible that the use of the non-conservative clause for the single degree of freedominstability in torsion would be prevented by the value fromClause 2.1.3.3. However, Clause 2.1.3.2(b) should bealtered to allow for plate girder bridges, with the value ofnon-dimensional wind speed obtained from Clause 2.1.3.3only being used if it is the lower of the two.
7 Amendments to the rules
7.1 Vortex excitation - critical wind speeds
For the plate girder bridge models tested, the critical windspeeds did not follow the trends of the Rules, although formodel M1 the Rules provided an excellent lower bound tothe results for bending and a reasonable lower bound fortorsion. For model M3 the Rules were conservative forbending but marginally non-conservative for torsion. Formodel M5 they provided over-estimates (that is non-conservative values), compared with the tests, for certainconfigurations in bending.
20
Figure 21 Amplitudes for vortex excitation (bending)
y max
/(1E-
3*d 4)
a) Fascia beam X (k/d4 = 0.1)
0
10
20
30
40
50
60
70
0 0.01 0.02 0.03 0.04 0.05 0.06Logarithmic decrement
Test data: M1 : Kr = .41Test data : M3 : Kr = .29Test data : M5 : Kr = .24BD 49/93 : M1BD 49/93 : M3BD 49/93 : M5
y max
/(1E-
3*d 4)
b) Fascia beam Y (k/d4 = 0.2)
0
10
20
30
40
50
60
70
0 0.01 0.02 0.03 0.04 0.05 0.06Logarithmic decrement
Test data: M1 : Kr = .41Test data : M3 : Kr = .29Test data : M5 : Kr = .24BD 49/93 : M1BD 49/93 : M3BD 49/93 : M5
21
Figure 22 Amplitudes for vortex excitation (bending) – selected results
y max
/(1E-
3*d 4)
a) Fascia beam X (k/d4 = 0.1)
0
10
20
30
40
50
60
0 0.01 0.02 0.03 0.04 0.05 0.06Logarithmic decrement
Test data: M1 : Kr = .41Test data : M3 : Kr = .29BD 49/93 : M1BD 49/93 : M3
y max
/(1E-
3*d 4)
b) Fascia beam Y (k/d4 = 0.2)
00 0.01 0.02 0.03 0.04 0.05 0.06
Logarithmic decrement
Test data: M1 : Kr = .41Test data : M3 : Kr = .29BD 49/93 : M1BD 49/93 : M3
10
20
30
40
50
60
22
Figure 23 Ratio of test model to code amplitudes for vortex excitation (bending)
Nor
mal
ised
am
plitu
dea) Fascia beam X (k/d4 = 0.1)
0 0.01 0.02 0.03 0.04 0.05 0.06Logarithmic decrement
Model M1Model M3Normalised line
Model M1Model M3Normalised line
Nor
mal
ised
am
plitu
de
b) Fascia beam Y (k/d4 = 0.2)
0 0.01 0.02 0.03 0.04 0.05 0.06Logarithmic decrement
0.0
0.5
1.0
1.5
2.0
0.0
1.0
2.0
3.0
23
Figure 24 Amplitudes for vortex excitation (torsion)
2*y m
ax/(1
E-3*
b)
a) Fascia beam X (k/d4 = 0.1)
0 0.01 0.02 0.03 0.04 0.05 0.06Logarithmic decrement
Test data: M1 : Kr = .41Test data : M3 : Kr = .29BD 49/93 : M1BD 49/93 : M5
0
10
20
30
40
50
2*y m
ax/(1
E-3*
b)
b) Fascia beam Y (k/d4 = 0.2)
0 0.01 0.02 0.03 0.04 0.05 0.06Logarithmic decrement
Test data: M1 : Kr = .41Test data : M3 : Kr = .29Test data : M5 : Kr = .24BD 49/93 : M1BD 49/93 : M3BD 49/93 : M5
0
5
10
15
20
25
Figure 25 Amplitudes for vortex excitation (torsion)
2*y m
ax/(1
E-3*
b)
a) Fascia beam X (k/d4 = 0.1)
0 0.01 0.02 0.03 0.04 0.05 0.06Logarithmic decrement
Test data: M1 : Kr = .41BD 49/93: M1
0.0
5.0
10.0
15.0
20.0
2*y m
ax/(1
E-3*
b)
b) Fascia beam Y (k/d4 = 0.2)
0 0.01 0.02 0.03 0.04 0.05 0.06Logarithmic decrement
Test data: M1 : Kr = .41Test data: M3 : Kr = .29BD 49/93: M1BD 49/93: M3
0.0
5.0
10.0
15.0
20.0
24
Figure 26 Critical wind speeds for divergent amplitude (bending)
Vg/(f
B.d 4)
a) Fascia beam X : Cg = 1
0 0.01 0.02 0.03 0.04 0.05 0.06 0.07 0.08 0.09Logarithmic decrement
Test data: M1BD 49/93
b) Fascia beam Y : Cg = 1
0
10
20
30
40
50
60
70
80
90Vg
/(fB.
d 4)
0 0.01 0.02 0.03 0.04 0.05 0.06 0.07 0.08 0.09Logarithmic decrement
Test data: M1BD 49/93
0
10
20
30
40
50
60
70
80
90
25
Figure 27 Critical wind speeds for divergent amplitude (torsion)
Vg/(f
T.b)
a) Fascia beam X : Cg = 1
0 0.01 0.02 0.03 0.04 0.05 0.06 0.07 0.08 0.09Logarithmic decrement
0
1
2
3
4
5
6
Test data: M1Test data: M3Test data: M5BD 49/93
Vg/(f
T.b)
b) Fascia beam Y : Cg = 1
0 0.01 0.02 0.03 0.04 0.05 0.06 0.07 0.08 0.09Logarithmic decrement
0
1
2
3
4
5
6
Test data: M1Test data: M3Test data: M5BD 49/93
26
Figure 28 Critical wind speeds for divergent amplitude (torsion)
Vg/(f
T.b)
a) Fascia beam X : Cg = 1
0 0.01 0.02 0.03 0.04 0.05 0.06 0.07 0.08 0.09Logarithmic decrement
0
1
2
3
4
5
6
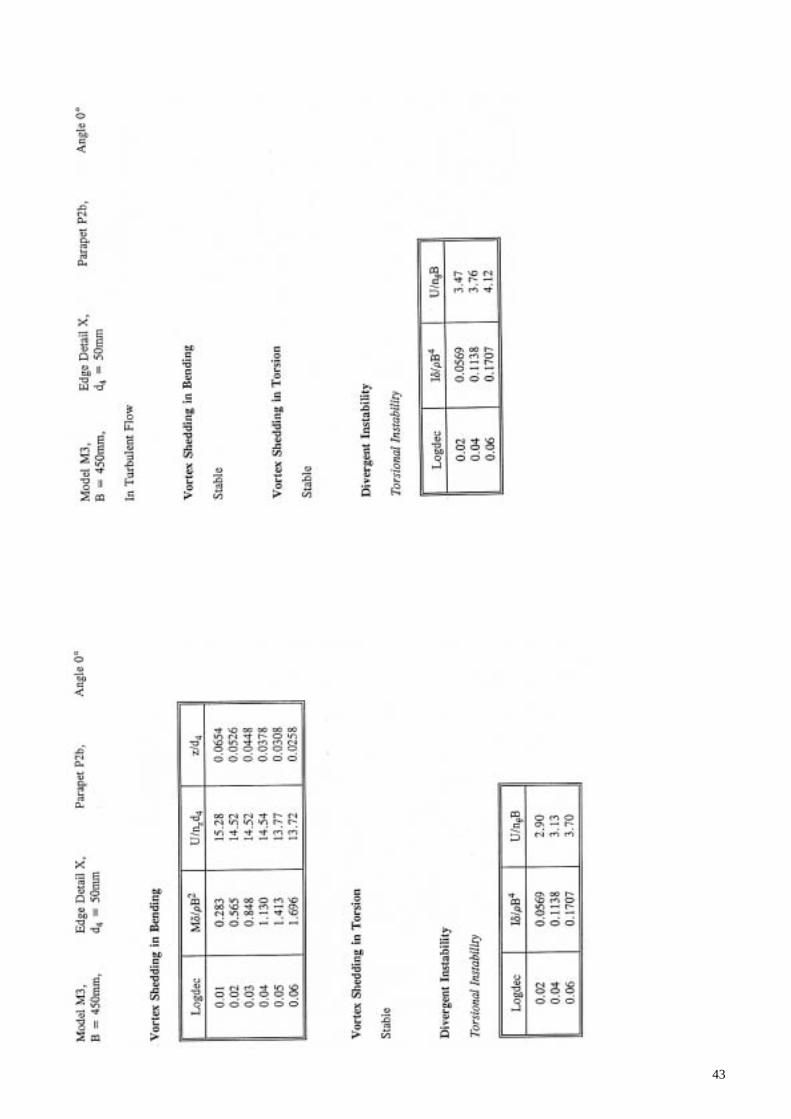
Test data: M1Test data: M3BD 49/93
Vg/(f
T.b)
b) Fascia beam Y : Cg = 1
0 0.01 0.02 0.03 0.04 0.05 0.06 0.07 0.08 0.09Logarithmic decrement
0
1
2
3
4
5
6
Test data: M1Test data: M3BD 49/93
27
0
10
20
30
40
50
60
0 10 20 30 40 50 60
Predicted amplitude
Equality lineBox girders - solid parapetsPlate girders - solid parapetsBox girders - open parapetsPlate Girders, Extra TestsPlate Girders, Further TestsPlate Girders - open parapets
Mea
sure
d am
plitu
de
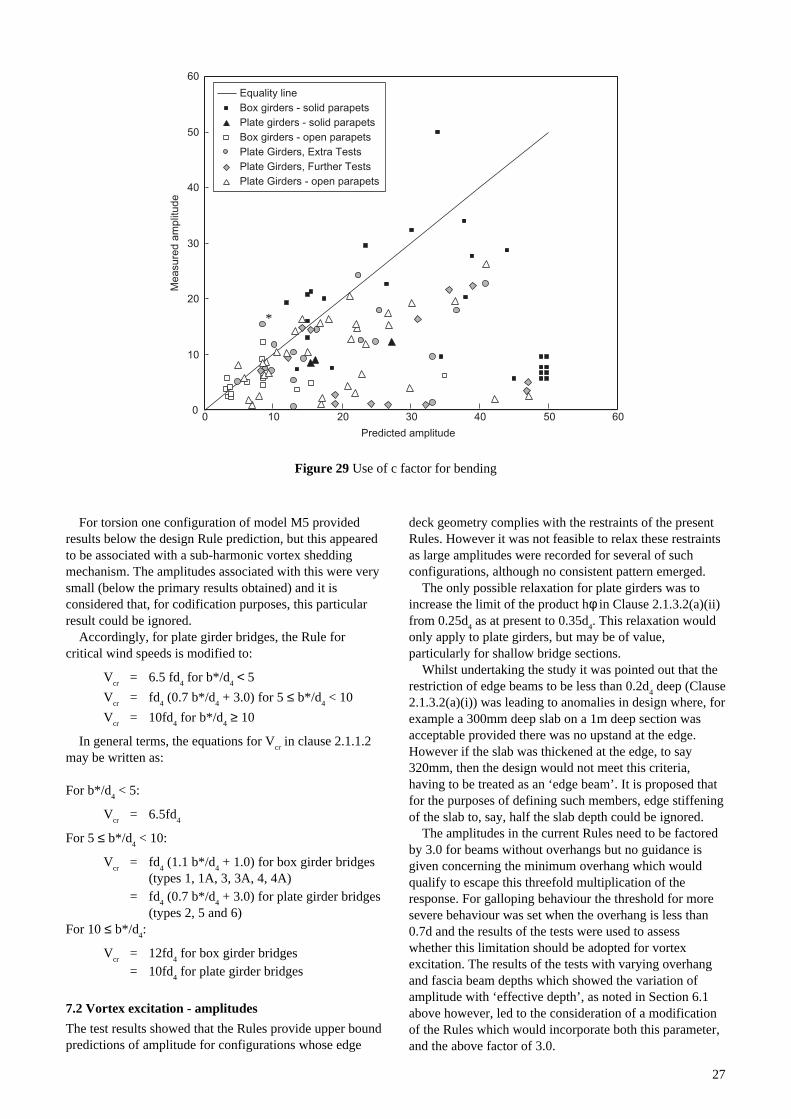
Figure 29 Use of c factor for bending
For torsion one configuration of model M5 providedresults below the design Rule prediction, but this appearedto be associated with a sub-harmonic vortex sheddingmechanism. The amplitudes associated with this were verysmall (below the primary results obtained) and it isconsidered that, for codification purposes, this particularresult could be ignored.
Accordingly, for plate girder bridges, the Rule forcritical wind speeds is modified to:
Vcr
= 6.5 fd4 for b*/d
4 < 5
Vcr
= fd4 (0.7 b*/d
4 + 3.0) for 5 ≤ b*/d
4 < 10
Vcr
= 10fd4 for b*/d
4 ≥ 10
In general terms, the equations for Vcr in clause 2.1.1.2
may be written as:
For b*/d4 < 5:
Vcr
= 6.5fd4
For 5 ≤ b*/d4 < 10:
Vcr
= fd4 (1.1 b*/d
4 + 1.0) for box girder bridges
(types 1, 1A, 3, 3A, 4, 4A)= fd
4 (0.7 b*/d
4 + 3.0) for plate girder bridges
(types 2, 5 and 6)For 10 ≤ b*/d
4:
Vcr
= 12fd4 for box girder bridges
= 10fd4 for plate girder bridges
7.2 Vortex excitation - amplitudes
The test results showed that the Rules provide upper boundpredictions of amplitude for configurations whose edge
deck geometry complies with the restraints of the presentRules. However it was not feasible to relax these restraintsas large amplitudes were recorded for several of suchconfigurations, although no consistent pattern emerged.
The only possible relaxation for plate girders was toincrease the limit of the product hφ in Clause 2.1.3.2(a)(ii)from 0.25d
4 as at present to 0.35d
4. This relaxation would
only apply to plate girders, but may be of value,particularly for shallow bridge sections.
Whilst undertaking the study it was pointed out that therestriction of edge beams to be less than 0.2d
4 deep (Clause
2.1.3.2(a)(i)) was leading to anomalies in design where, forexample a 300mm deep slab on a 1m deep section wasacceptable provided there was no upstand at the edge.However if the slab was thickened at the edge, to say320mm, then the design would not meet this criteria,having to be treated as an ‘edge beam’. It is proposed thatfor the purposes of defining such members, edge stiffeningof the slab to, say, half the slab depth could be ignored.
The amplitudes in the current Rules need to be factoredby 3.0 for beams without overhangs but no guidance isgiven concerning the minimum overhang which wouldqualify to escape this threefold multiplication of theresponse. For galloping behaviour the threshold for moresevere behaviour was set when the overhang is less than0.7d and the results of the tests were used to assesswhether this limitation should be adopted for vortexexcitation. The results of the tests with varying overhangand fascia beam depths which showed the variation ofamplitude with ‘effective depth’, as noted in Section 6.1above however, led to the consideration of a modificationof the Rules which would incorporate both this parameter,and the above factor of 3.0.
*
28
The result of this study is that a factor on the predictedamplitudes could be adopted for all sections of:
ck
d
h
d= +
LNM
OQP
34 4
φ but not less than 1.0
where k = depth of fascia beam, or edge slab;d
4= reference depth of the bridge;
h = height of parapet or other edge memberabove normal deck level;
φ = solidity ratio of parapet;
all as defined in Figures 2 and 3, with h, k and d4 in
consistent units.This would eliminate the necessity of the factor 3.0 and
would allow dense, and even solid, barriers to come withinthe scope of the Rules. However as the tests did notcomprehensively cover wind inclinations of up to ±5°,which on previous studies had been shown to be critical, it isproposed that solid barriers are still excluded for the present.
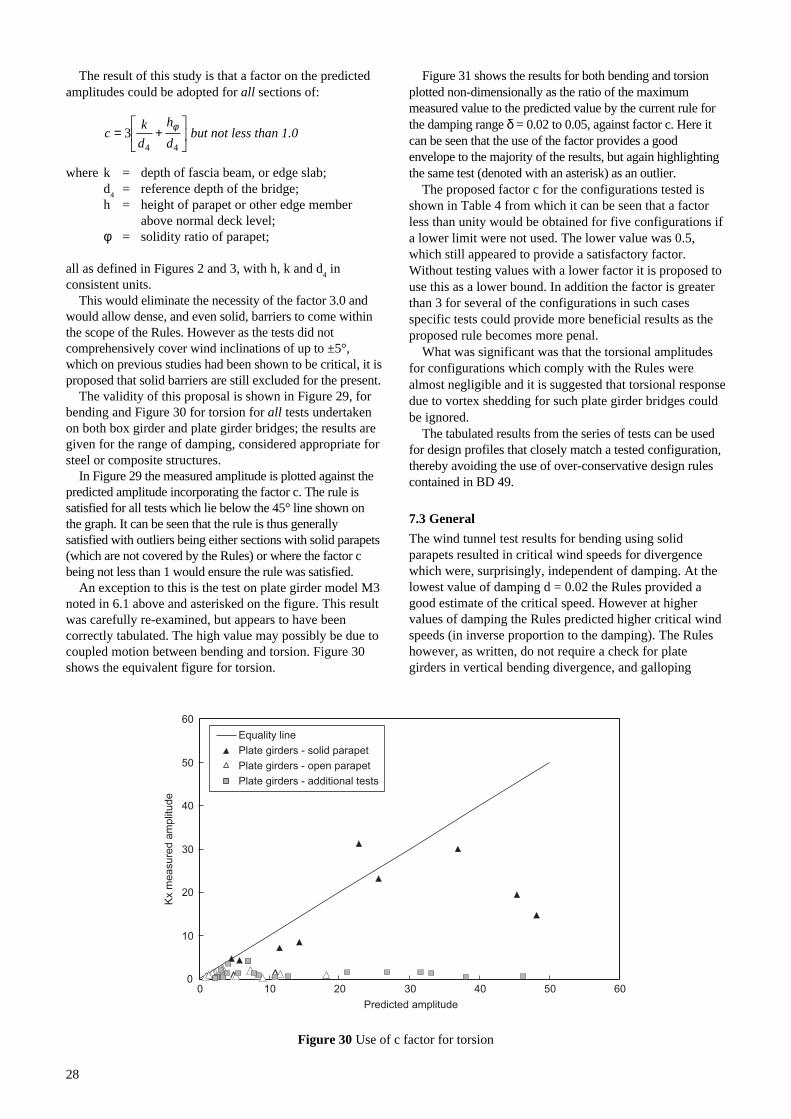
The validity of this proposal is shown in Figure 29, forbending and Figure 30 for torsion for all tests undertakenon both box girder and plate girder bridges; the results aregiven for the range of damping, considered appropriate forsteel or composite structures.
In Figure 29 the measured amplitude is plotted against thepredicted amplitude incorporating the factor c. The rule issatisfied for all tests which lie below the 45° line shown onthe graph. It can be seen that the rule is thus generallysatisfied with outliers being either sections with solid parapets(which are not covered by the Rules) or where the factor cbeing not less than 1 would ensure the rule was satisfied.
An exception to this is the test on plate girder model M3noted in 6.1 above and asterisked on the figure. This resultwas carefully re-examined, but appears to have beencorrectly tabulated. The high value may possibly be due tocoupled motion between bending and torsion. Figure 30shows the equivalent figure for torsion.
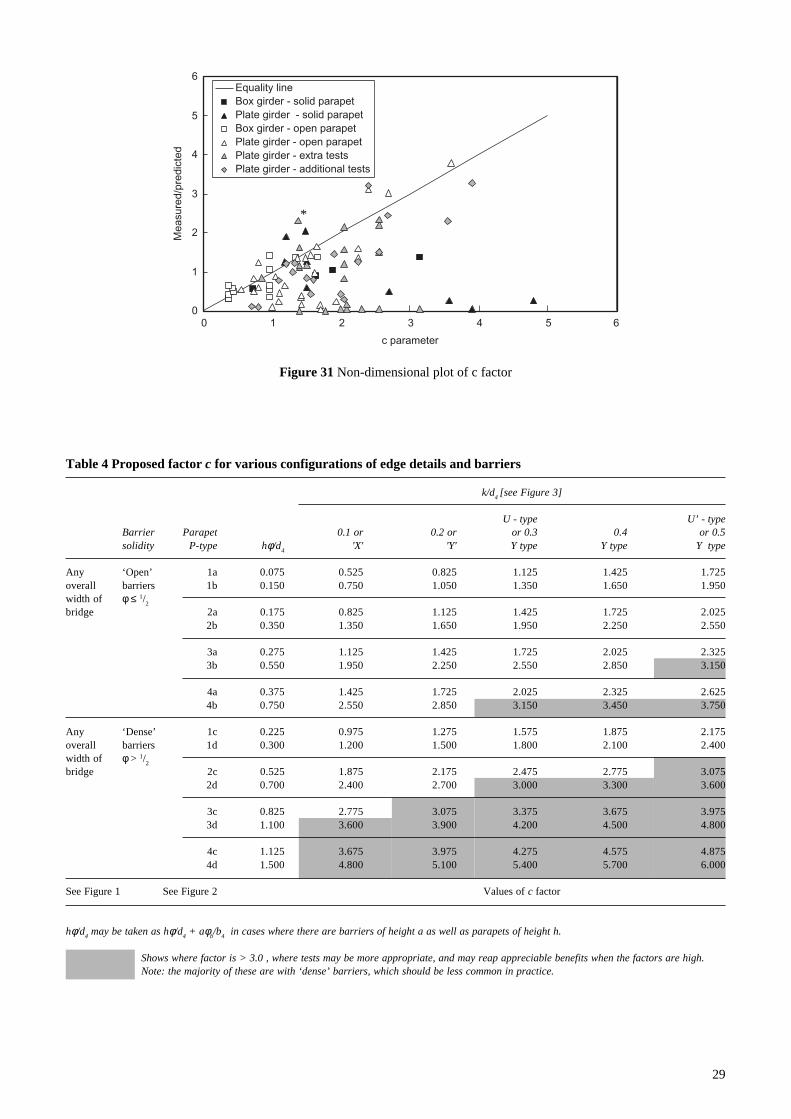
Figure 31 shows the results for both bending and torsionplotted non-dimensionally as the ratio of the maximummeasured value to the predicted value by the current rule forthe damping range δ = 0.02 to 0.05, against factor c. Here itcan be seen that the use of the factor provides a goodenvelope to the majority of the results, but again highlightingthe same test (denoted with an asterisk) as an outlier.
The proposed factor c for the configurations tested isshown in Table 4 from which it can be seen that a factorless than unity would be obtained for five configurations ifa lower limit were not used. The lower value was 0.5,which still appeared to provide a satisfactory factor.Without testing values with a lower factor it is proposed touse this as a lower bound. In addition the factor is greaterthan 3 for several of the configurations in such casesspecific tests could provide more beneficial results as theproposed rule becomes more penal.
What was significant was that the torsional amplitudesfor configurations which comply with the Rules werealmost negligible and it is suggested that torsional responsedue to vortex shedding for such plate girder bridges couldbe ignored.
The tabulated results from the series of tests can be usedfor design profiles that closely match a tested configuration,thereby avoiding the use of over-conservative design rulescontained in BD 49.
7.3 General
The wind tunnel test results for bending using solidparapets resulted in critical wind speeds for divergencewhich were, surprisingly, independent of damping. At thelowest value of damping d = 0.02 the Rules provided agood estimate of the critical speed. However at highervalues of damping the Rules predicted higher critical windspeeds (in inverse proportion to the damping). The Ruleshowever, as written, do not require a check for plategirders in vertical bending divergence, and galloping
0
10
20
30
40
50
60
0 10 20 30 40 50 60
Predicted amplitude
Equality linePlate girders - solid parapetPlate girders - open parapetPlate girders - additional tests
Kx
mea
sure
d am
plitu
de
Figure 30 Use of c factor for torsion
29
Table 4 Proposed factor c for various configurations of edge details and barriers
k/d4 [see Figure 3]
U - type U’ - typeBarrier Parapet 0.1 or 0.2 or or 0.3 0.4 or 0.5solidity P-type hφ/d
4'X' 'Y' Y type Y type Y type
Any ‘Open’ 1a 0.075 0.525 0.825 1.125 1.425 1.725overall barriers 1b 0.150 0.750 1.050 1.350 1.650 1.950width of φ ≤ 1/
2
bridge 2a 0.175 0.825 1.125 1.425 1.725 2.0252b 0.350 1.350 1.650 1.950 2.250 2.550
3a 0.275 1.125 1.425 1.725 2.025 2.3253b 0.550 1.950 2.250 2.550 2.850 3.150
4a 0.375 1.425 1.725 2.025 2.325 2.6254b 0.750 2.550 2.850 3.150 3.450 3.750
Any ‘Dense’ 1c 0.225 0.975 1.275 1.575 1.875 2.175overall barriers 1d 0.300 1.200 1.500 1.800 2.100 2.400width of φ > 1/
2
bridge 2c 0.525 1.875 2.175 2.475 2.775 3.0752d 0.700 2.400 2.700 3.000 3.300 3.600
3c 0.825 2.775 3.075 3.375 3.675 3.9753d 1.100 3.600 3.900 4.200 4.500 4.800
4c 1.125 3.675 3.975 4.275 4.575 4.8754d 1.500 4.800 5.100 5.400 5.700 6.000
See Figure 1 See Figure 2 Values of c factor
hφ/d4 may be taken as hφ/d
4 + aφ
b/b
4 in cases where there are barriers of height a as well as parapets of height h.
Shows where factor is > 3.0 , where tests may be more appropriate, and may reap appreciable benefits when the factors are high.Note: the majority of these are with ‘dense’ barriers, which should be less common in practice.
0
1
2
3
4
5
6
0 1 2 3 4 5 6
c parameter
Equality lineBox girder - solid parapetPlate girder - solid parapetBox girder - open parapetPlate girder - open parapetPlate girder - extra testsPlate girder - additional tests
Mea
sure
d/pr
edic
ted
Figure 31 Non-dimensional plot of c factor
*

30
(particularly for the wider sections) seems unlikely. In anyevent these results were with solid parapets and aretherefore outside the scope of the Rules. It is not believedat this stage that modifications to the Rules can be justifiedon the basis of these tests, but that further study of themechanism causing this divergence is recommended.
For torsion the Rules tend to provide a non-conservativeprediction of the critical wind speed. Whilst it is likely thatthis is being partly catered for by the need to calculate thewind speed for classical flutter (as detailed in Section 7.4),Clause 2.3.1.2(b) has been modified as follows:
Vg
= 3.3 fTb , for plate girder bridges
Vg
= 5.0 fTb , for all other bridges
8 Conclusions
The wind tunnel tests described have provided, for the firsttime, a parametric study of the aerodynamic behaviour ofplate girder bridges. Additional tests were undertaken onplate girder bridges with relatively short overhangs andedge details conforming more closely to typical highwaybridges and footbridges. The results of the wind tunneltests, whilst limited in scope from the complete matrix oftests for the models envisaged, have confirmed the generaltrend of the Rules and provided added confidence in theirwider use to plate girder bridges. However there have beenunexpected results and inconsistencies, making soundgeneral design guidance extremely difficult.
Whereas it was hoped that some relaxation of the Rulescould be produced for plate girder bridges, this has generallynot been the case, apart from torsional vibrations due tovortex shedding which it is proposed could be ignored.
As a result of these tests, modified rules have beendeveloped for the prediction of vortex excited amplitudeswhich provide better agreement with test results. Thesemodified rules have now been incorporated into therevised version of BD 49 (Highways Agency 2001).
It should be noted however that this form of response isvery sensitive to small changes in edge details, makingcodified rules very conservative in many cases. The BD 49clauses provide reasonable rules which the majority ofsections will satisfy. However, it must be recognised that afew sections which satisfy the rules may subsequentlyshow some signs of response in service.
The study has shown the inconsistent patterns that canbe obtained due to small changes in leading edge detail.Whilst some 61 different configurations were tested, thiscovered a wide range of parameters and frequently trendshad to be predicted from only two tests on the variation ofone of those parameters.
The matrix of tests undertaken as reported here providesa valuable set of data, which can be used in those caseswhere the design closely matches one of the testedconfigurations. This permits a much less conservativeanalysis to be used.
9 References
Flint and Neill Partnership (1986). Partial safetyfactors for bridge aerodynamic rules and requirementsfor wind tunnel testing. Contractor Report CR36.Crowthorne: TRL Limited.
Flint and Neill Partnership (1991). A re-appraisal ofcertain aspects of the design rules for bridgeaerodynamics. Contractor Report CR256. Crowthorne:TRL Limited.
Highways Agency (1993). BD 49/93. Design rules foraerodynamic effects on bridges. Design Manual for Roadsand Bridges. London: Highways Agency.
Highways Agency (2001). BD 49/01. Design rules foraerodynamic effects on bridges. Design Manual for Roadsand Bridges. London: Highways Agency.
Institution of Civil Engineers (1981). Bridgeaerodynamics. Proceedings of a Conference on BridgeAerodynamics at the Institution of Civil Engineers,London, 25-26 March 1981. London: Thomas Telford.
Naudascher E and Wang Y (1993). Flow-inducedvibration of prismatic bodies and grids of prisms. Journalof Fluids and Structures. No 9, pp 341-373.
Smith B W, Wyatt T A, McKenzie D K, Huband M Vand Daly A F (2002). Background to the development ofBD 49/01: Design rules for aerodynamic effects onbridges. TRL Report TRL528. Crowthorne: TRL Limited.

31
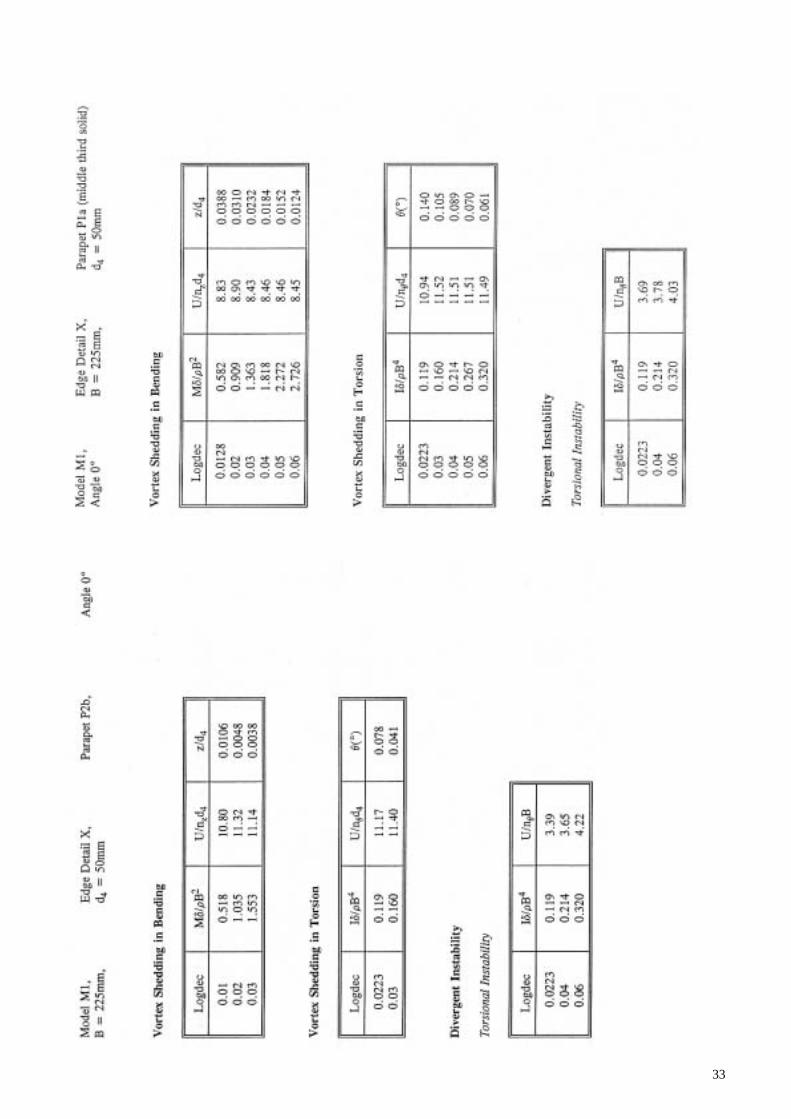
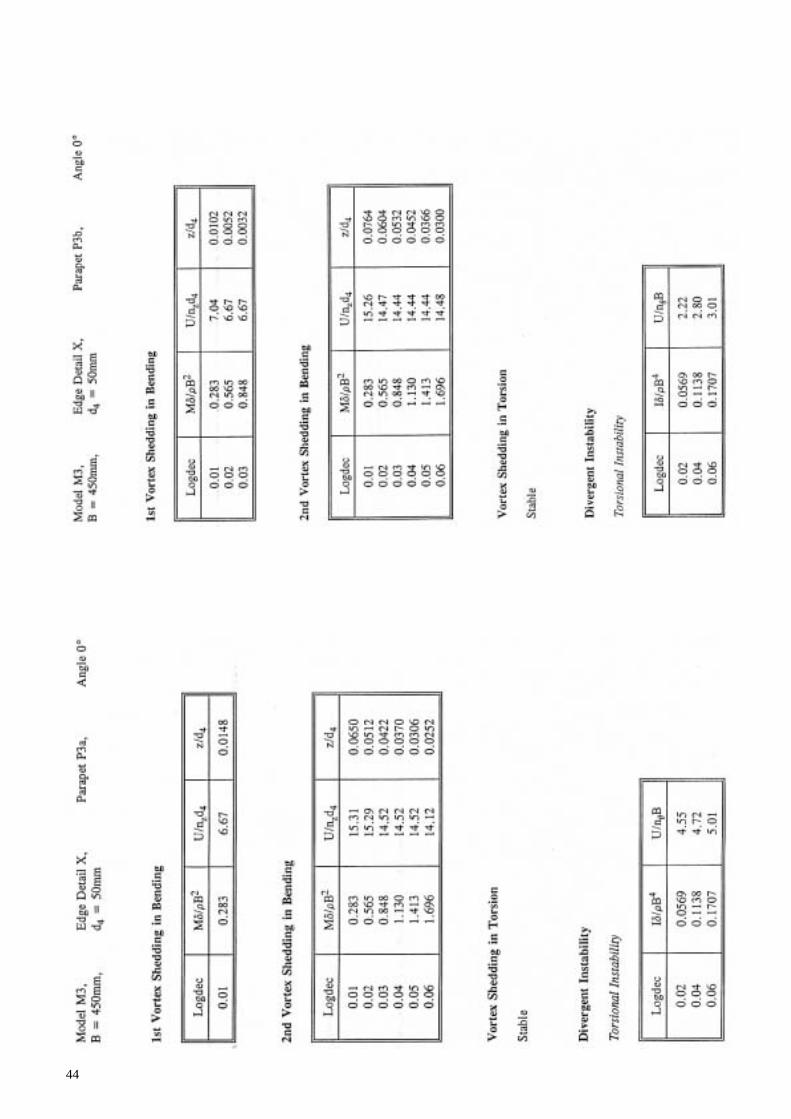
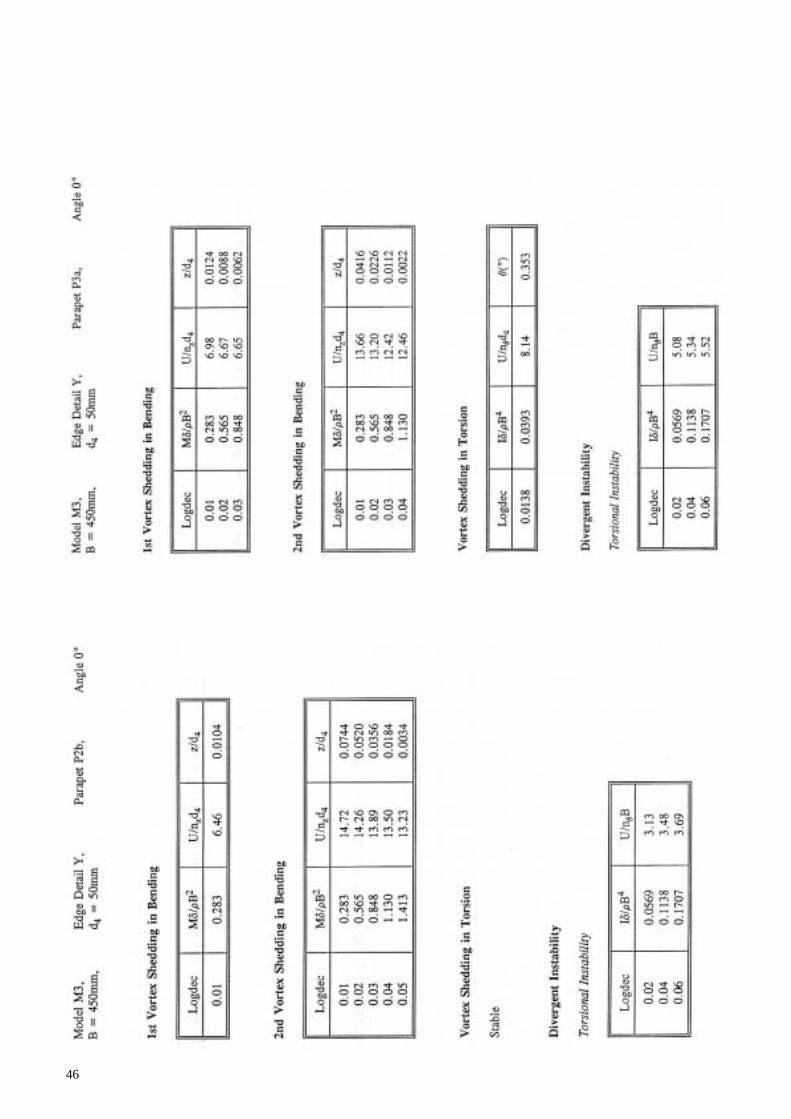
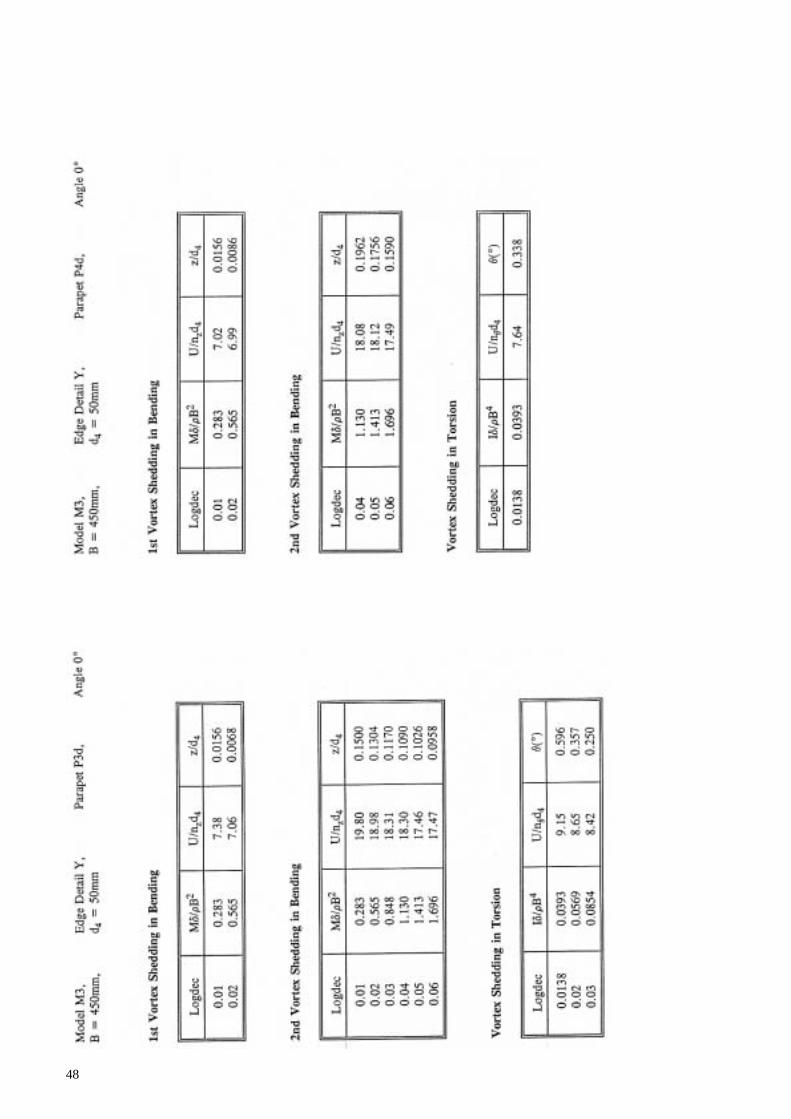
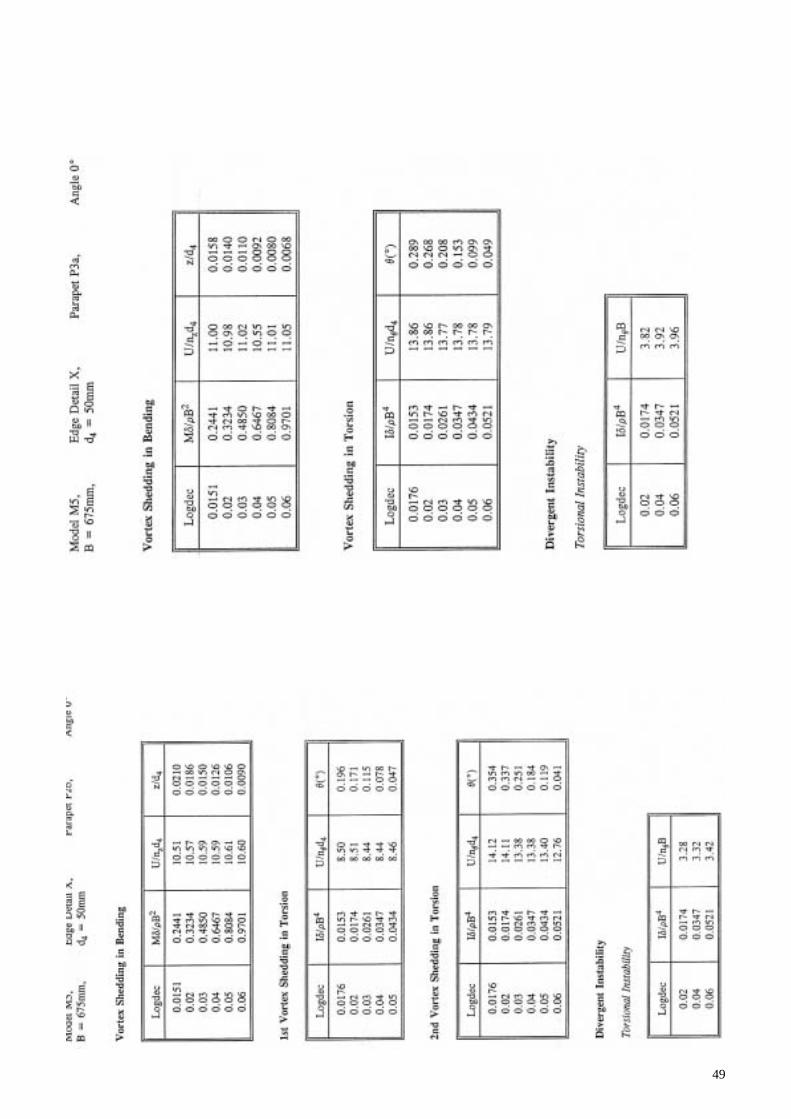
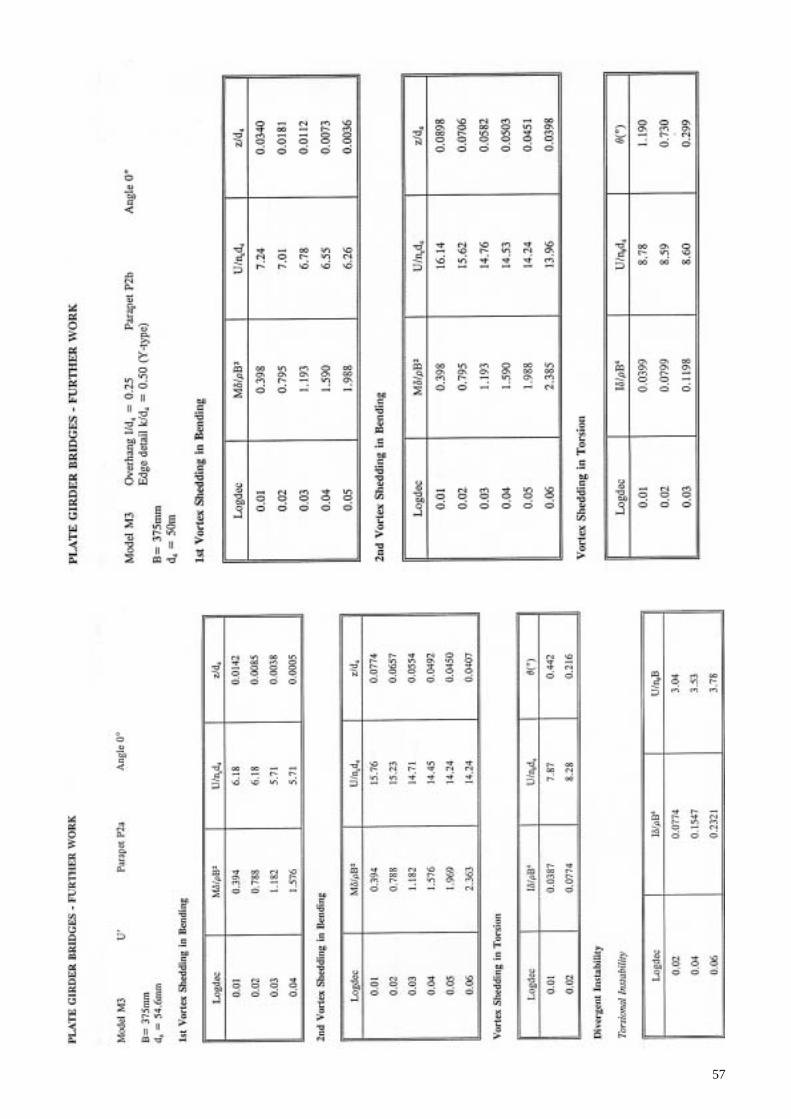
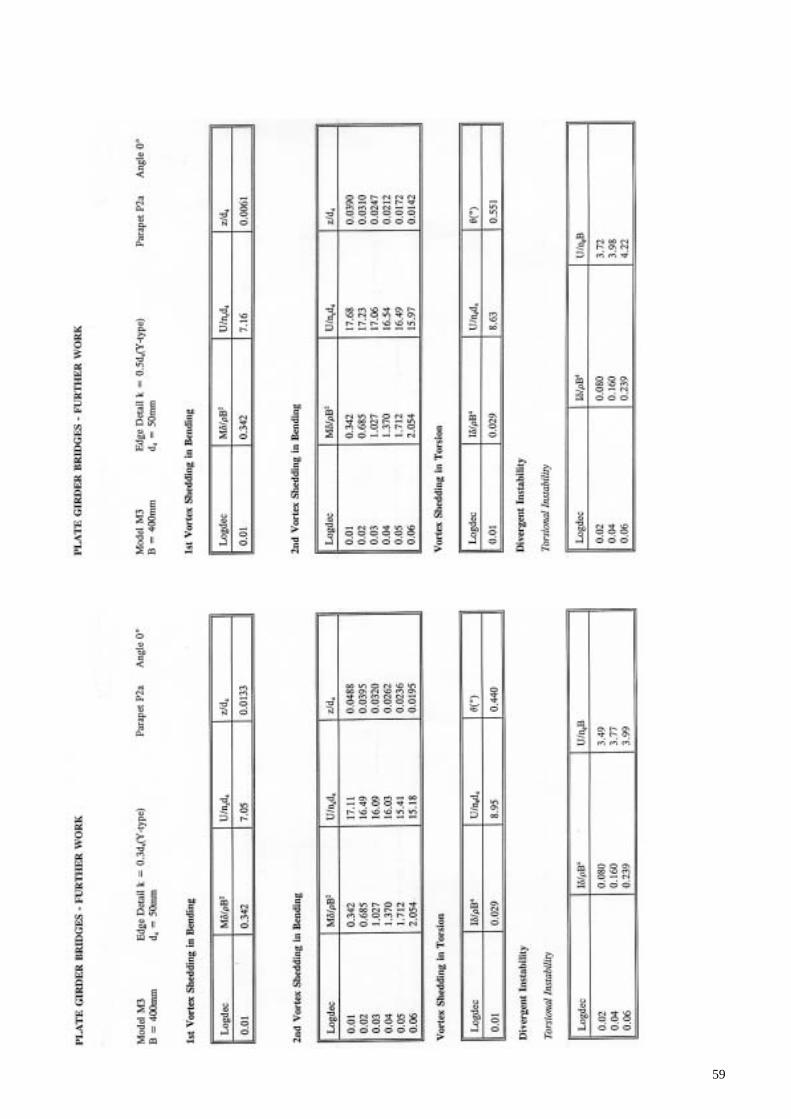
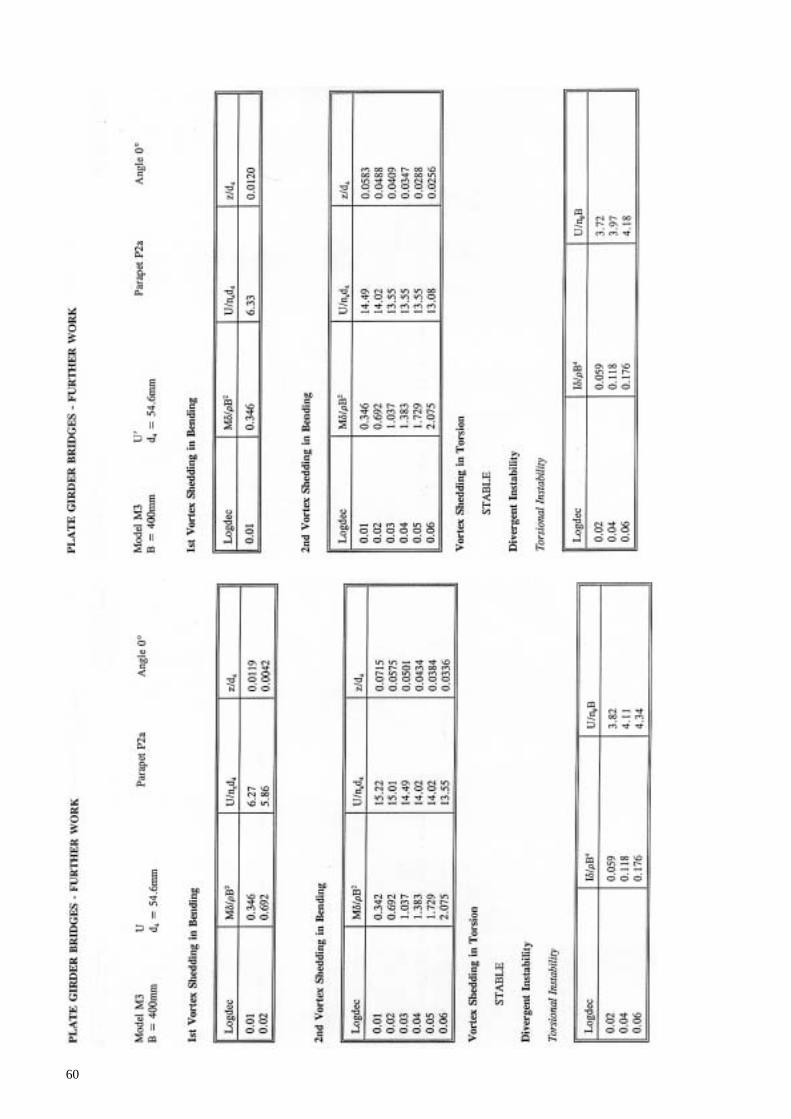
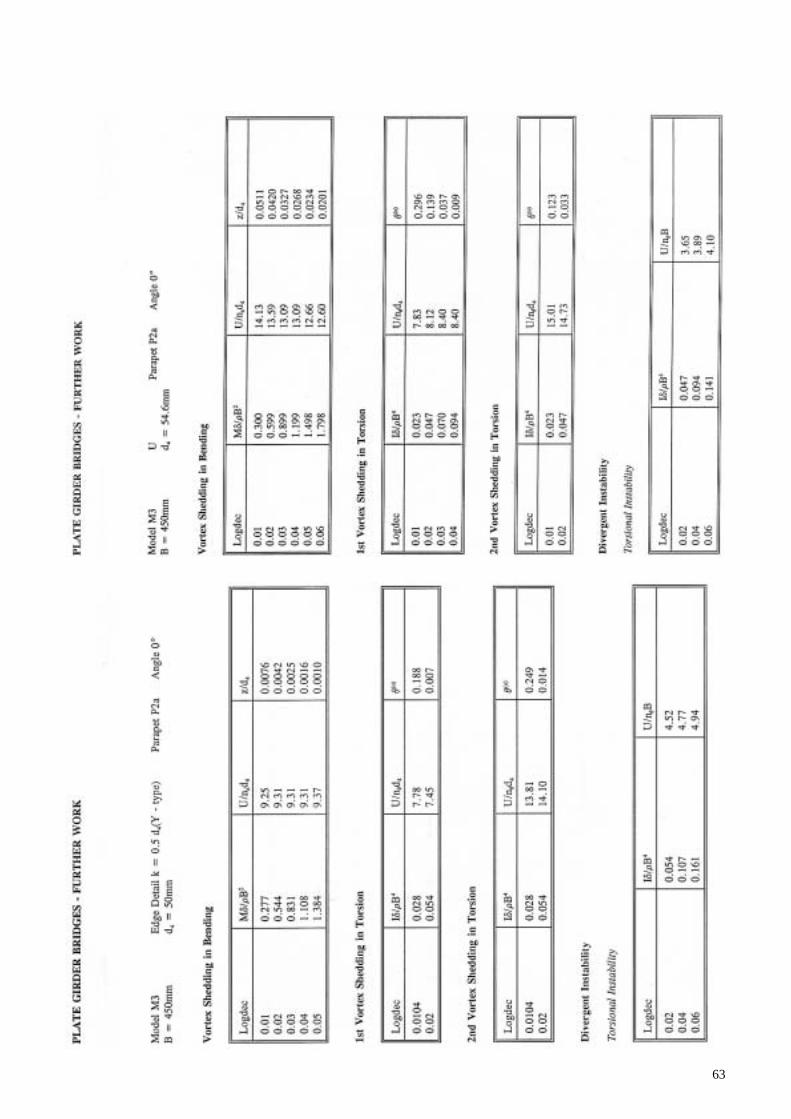
Appendix A: Wind tunnel test results
Definition of Terms
B – Overall width of model (b in rules)
d4
– Depth of girder (including deck slab)
M – Mass/m of model set-up (m in rules)
I – Mass moment of inertia/m of model set-up (equivalent to mr2 in rules)
U – Mean wind speed at model location (V in rules)
nz
– Natural frequency in bending (fB in rules)
nθ – Natural frequency in torsion (fT in rules)
z – Maximum rms deflection due to vortex shedding (ymax
in rules)
θ – Maximum rms rotation due to vortex shedding (expressed in terms of ymax
in rules)
δ – Logarithmic decrement of structural damping (δs in rules)
ρ – Density of air

32
33
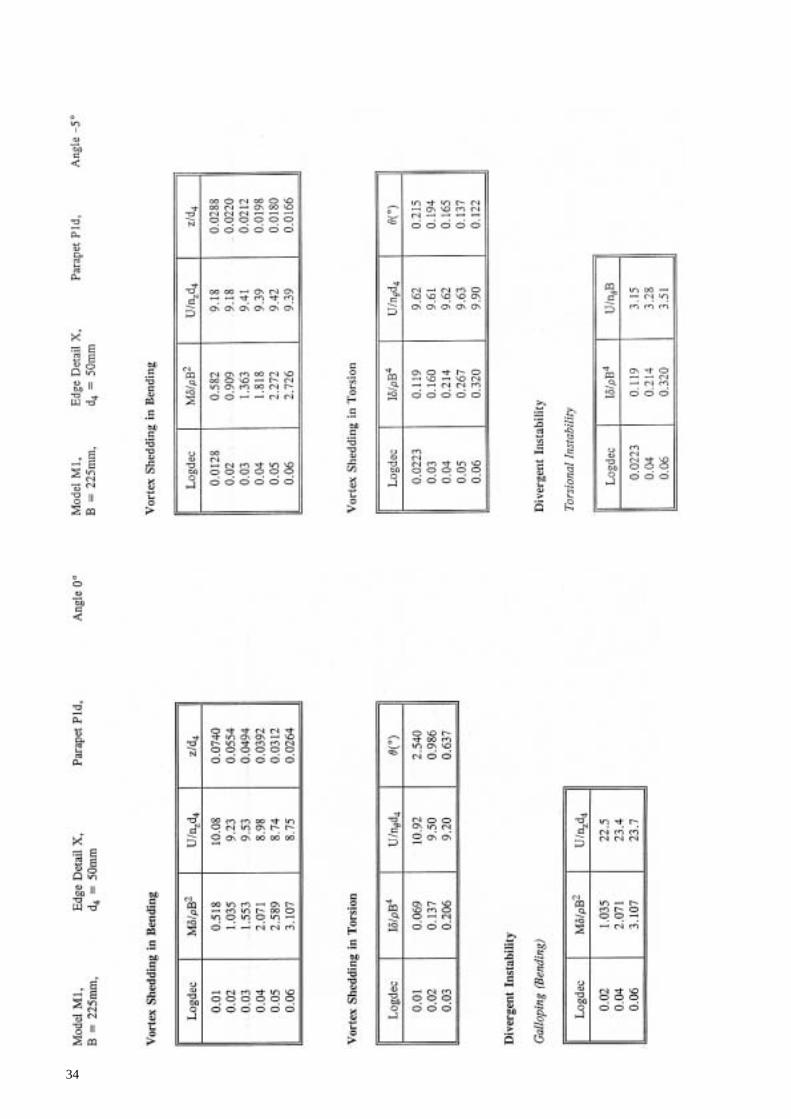
34

35
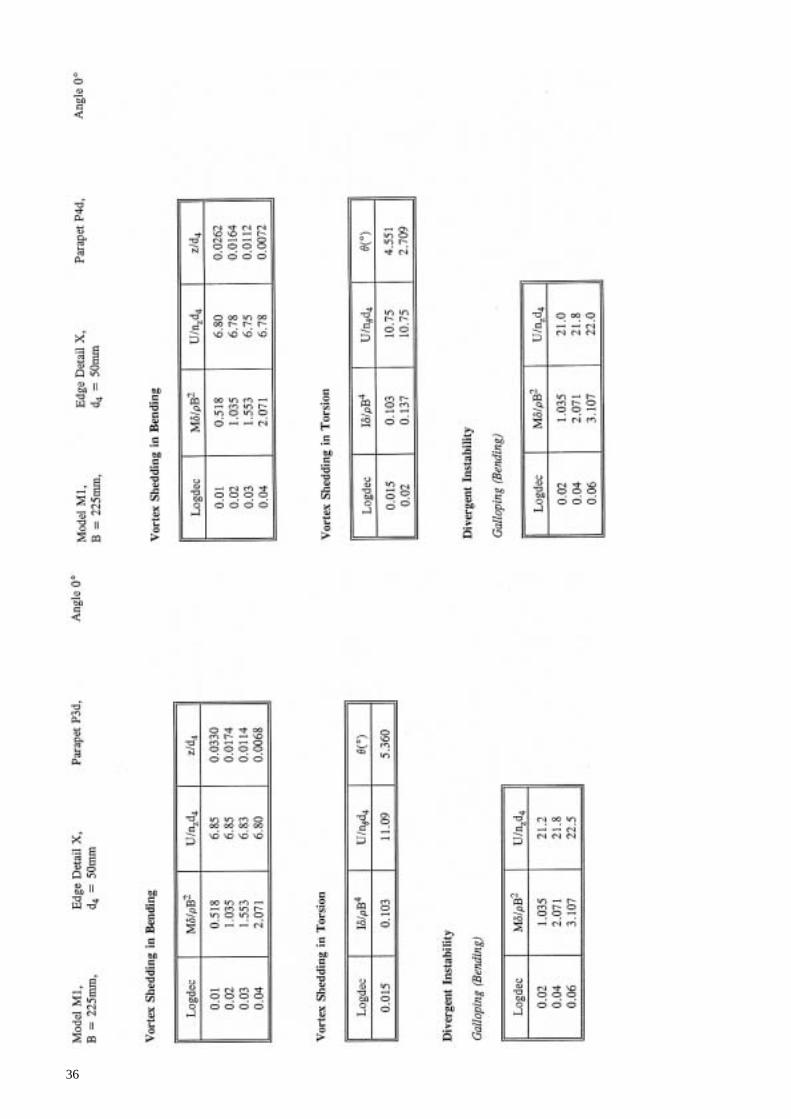
36

37

38

39

40
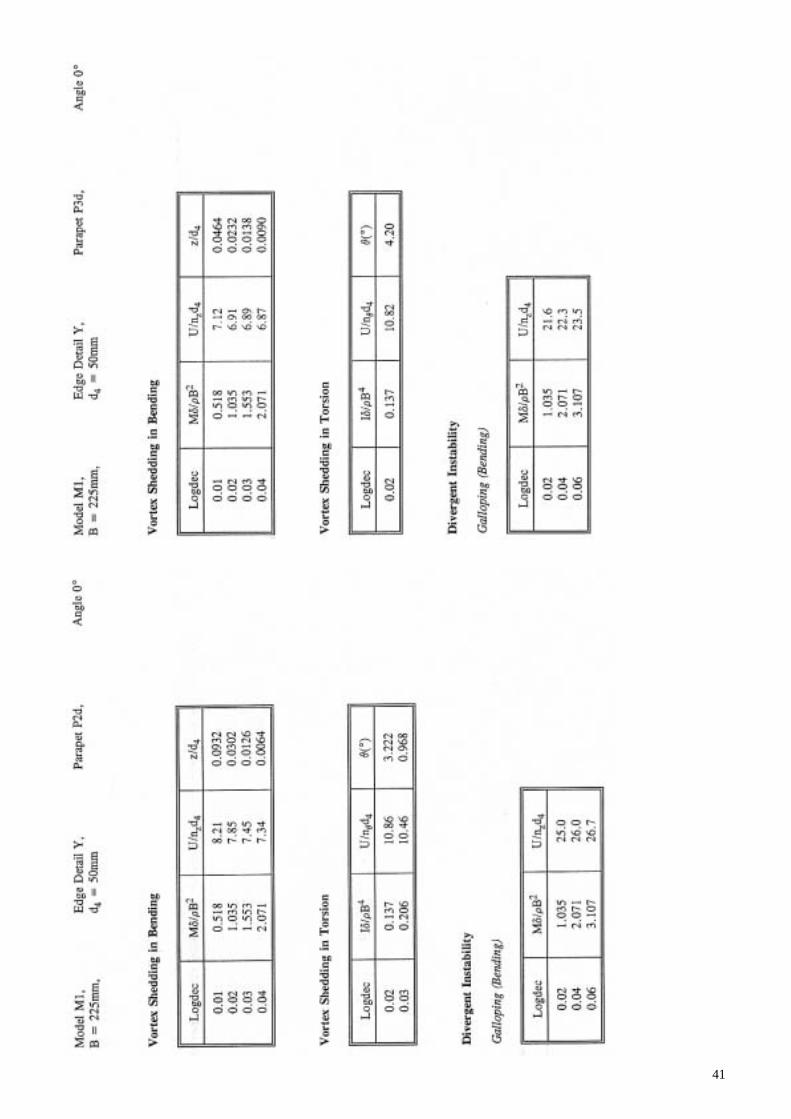
41
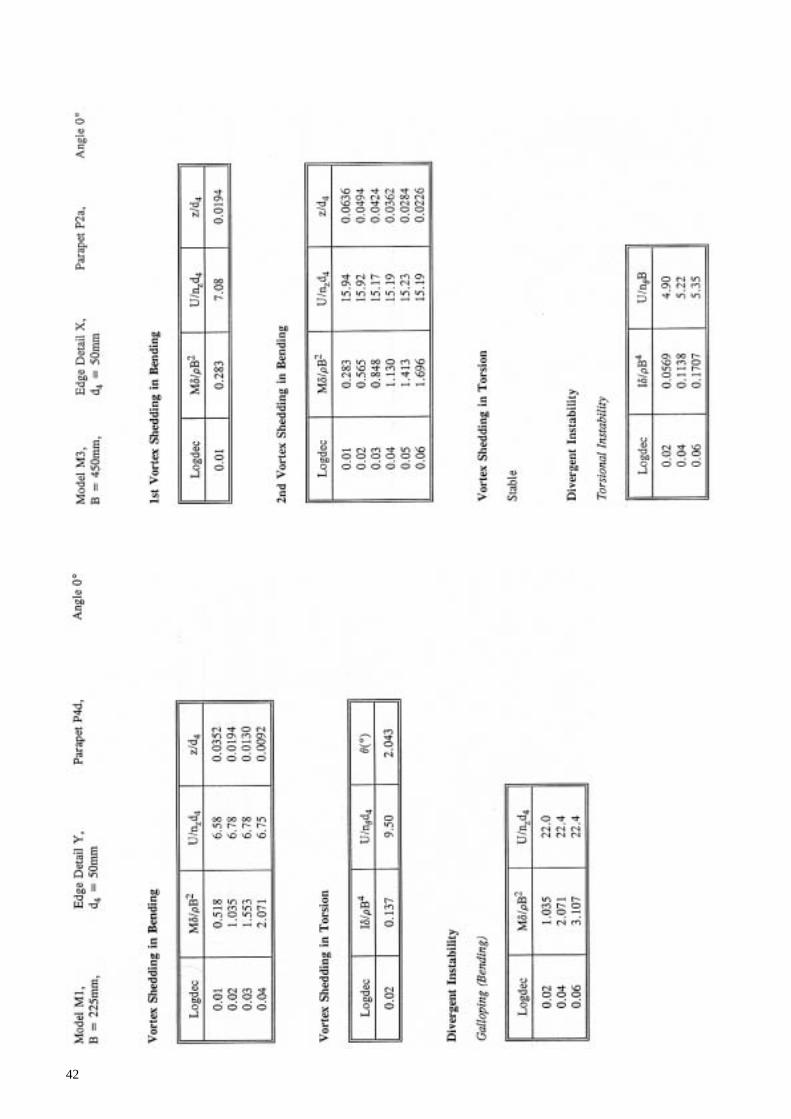
42
43
44

45
46

47
48
49

50
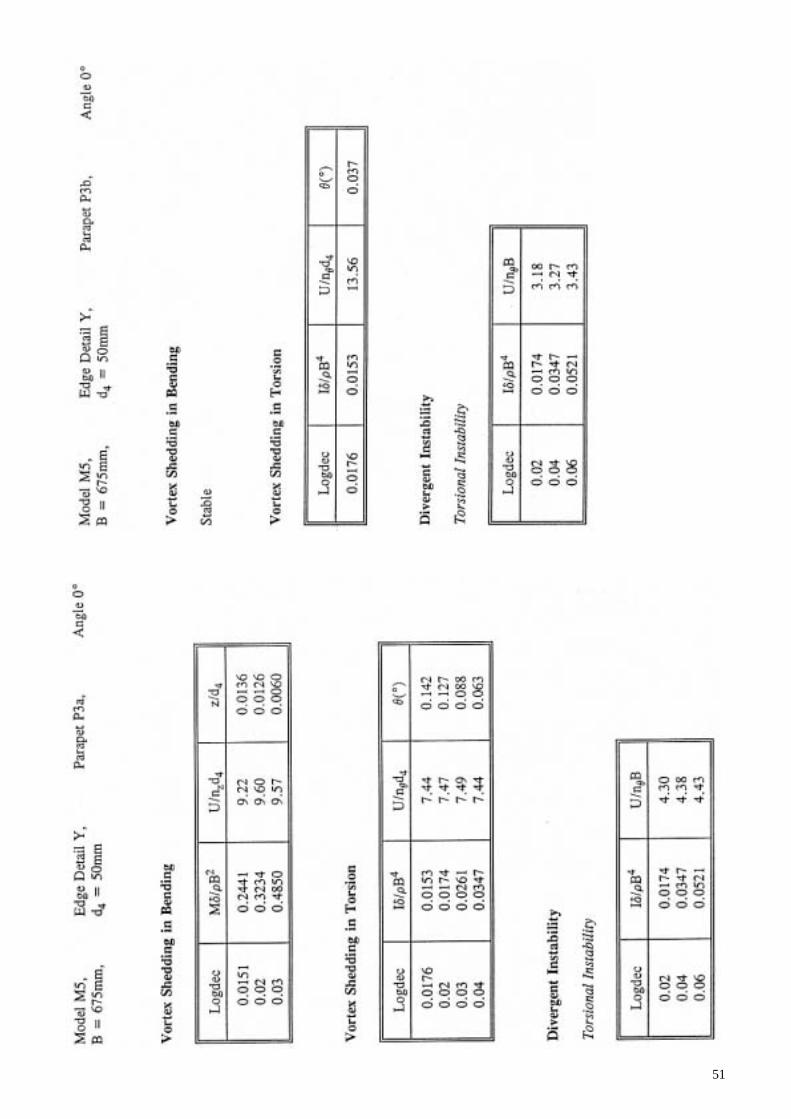
51

52

53
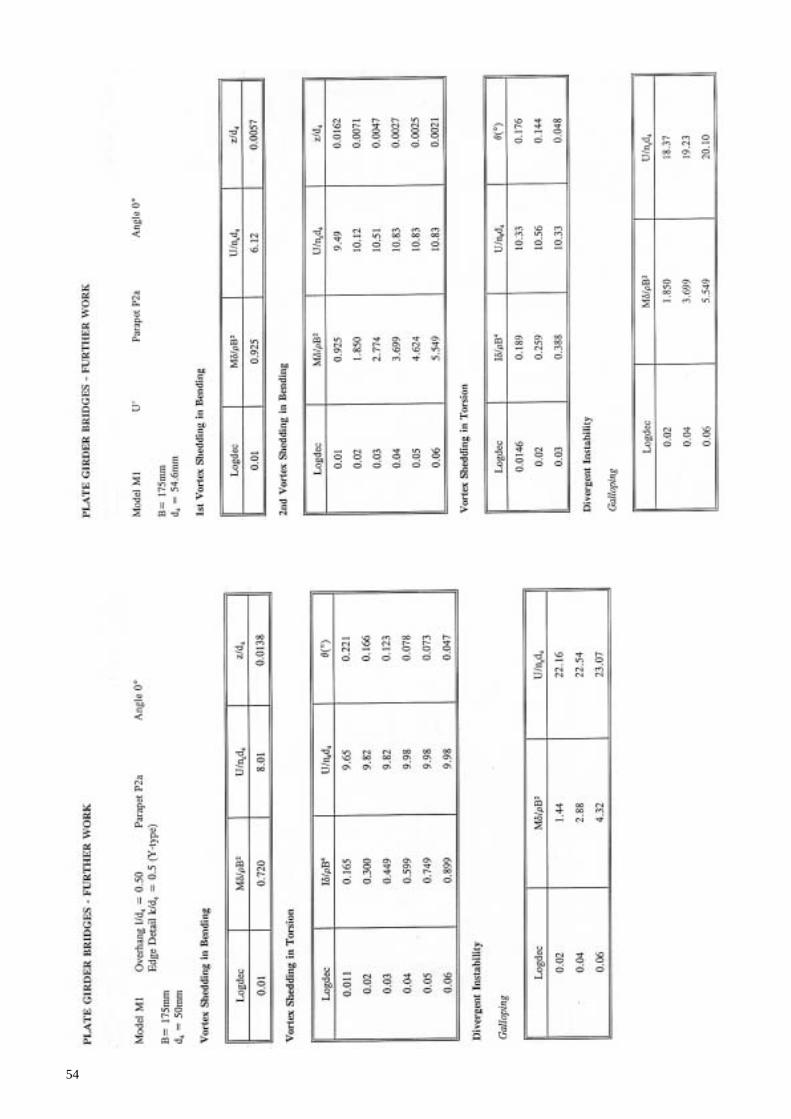
54

55
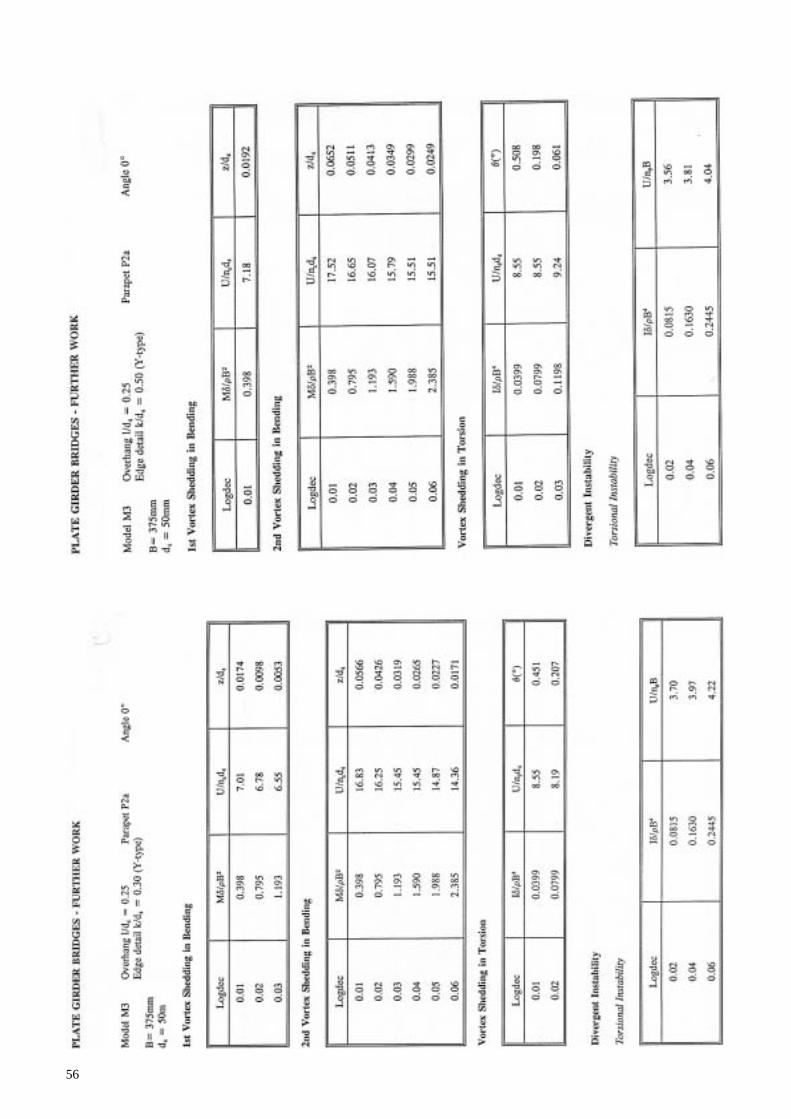
56
57

58
59
60

61

62
63
64

65
66
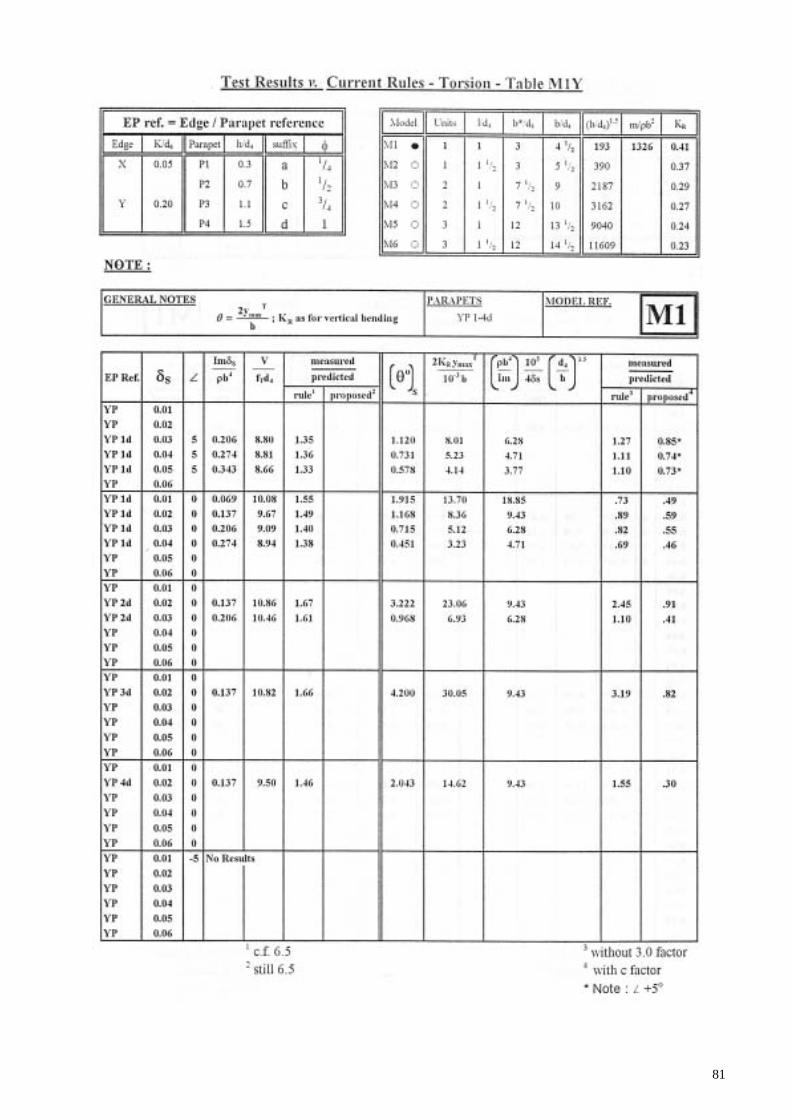
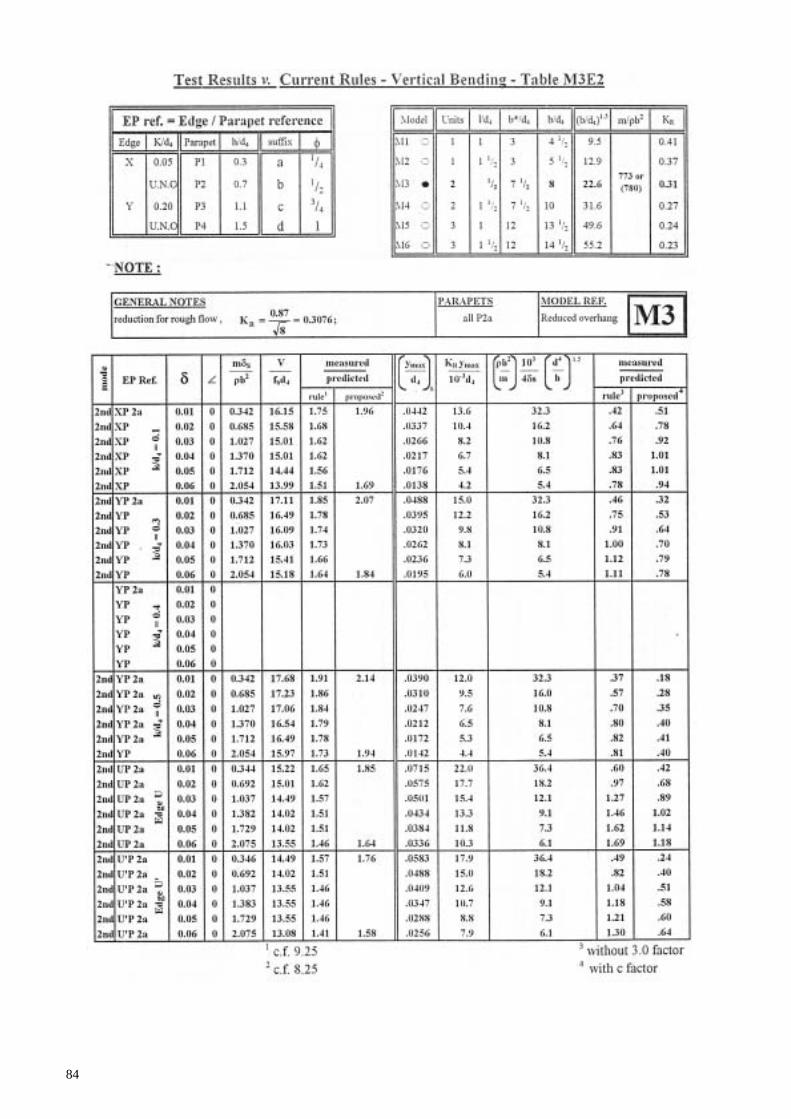
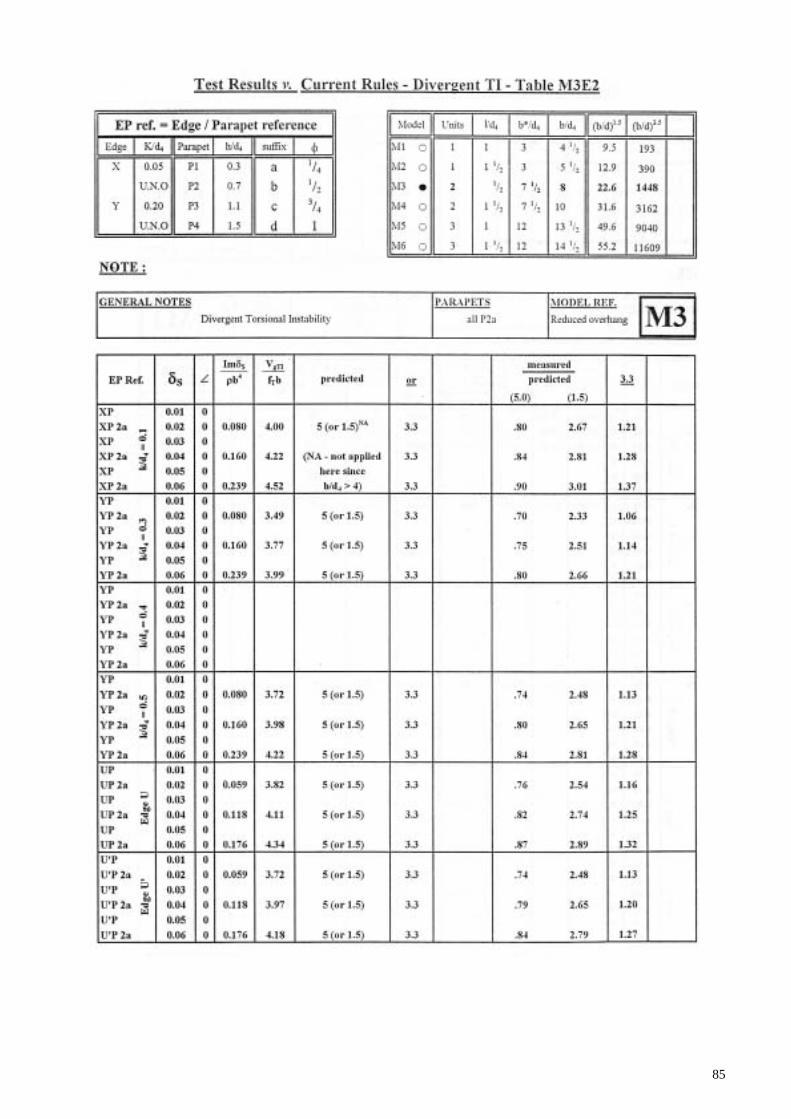
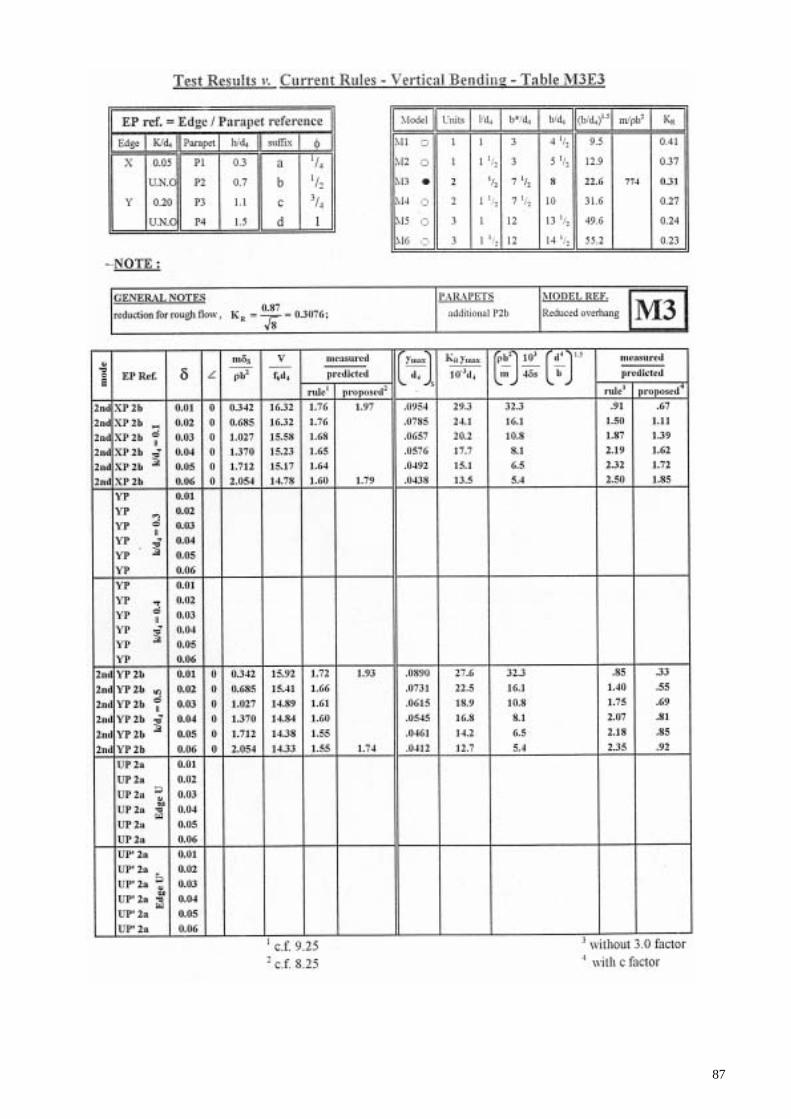
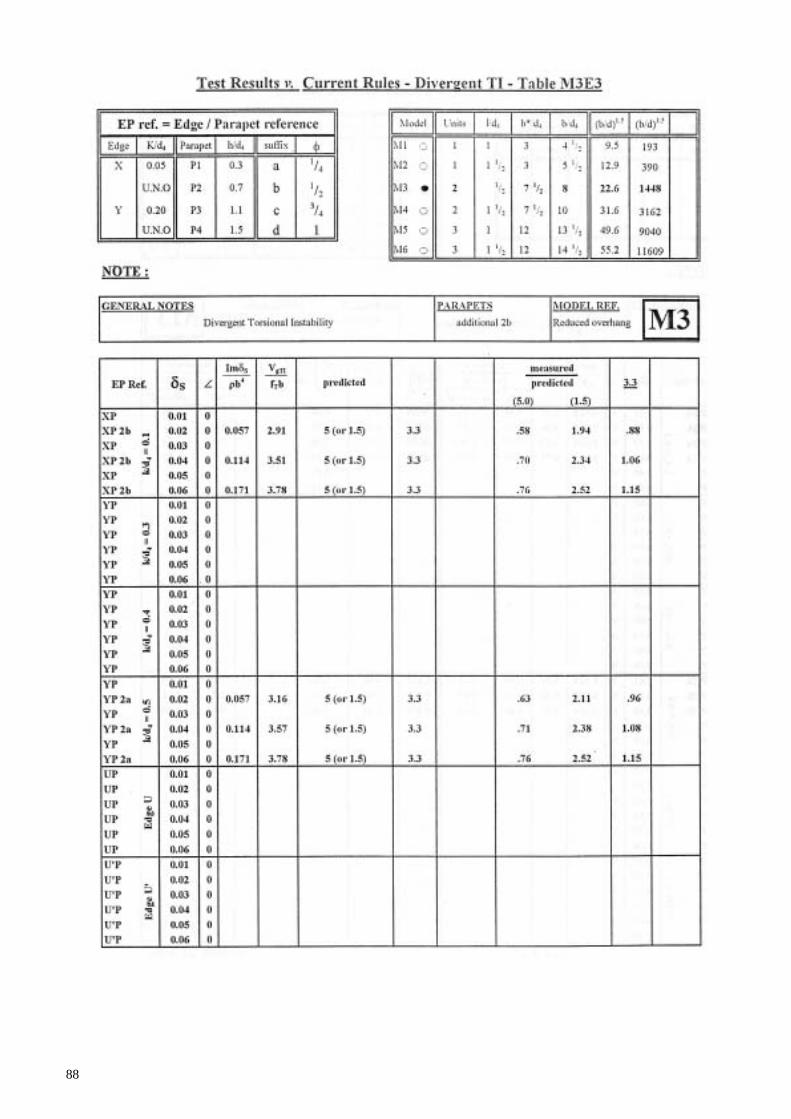
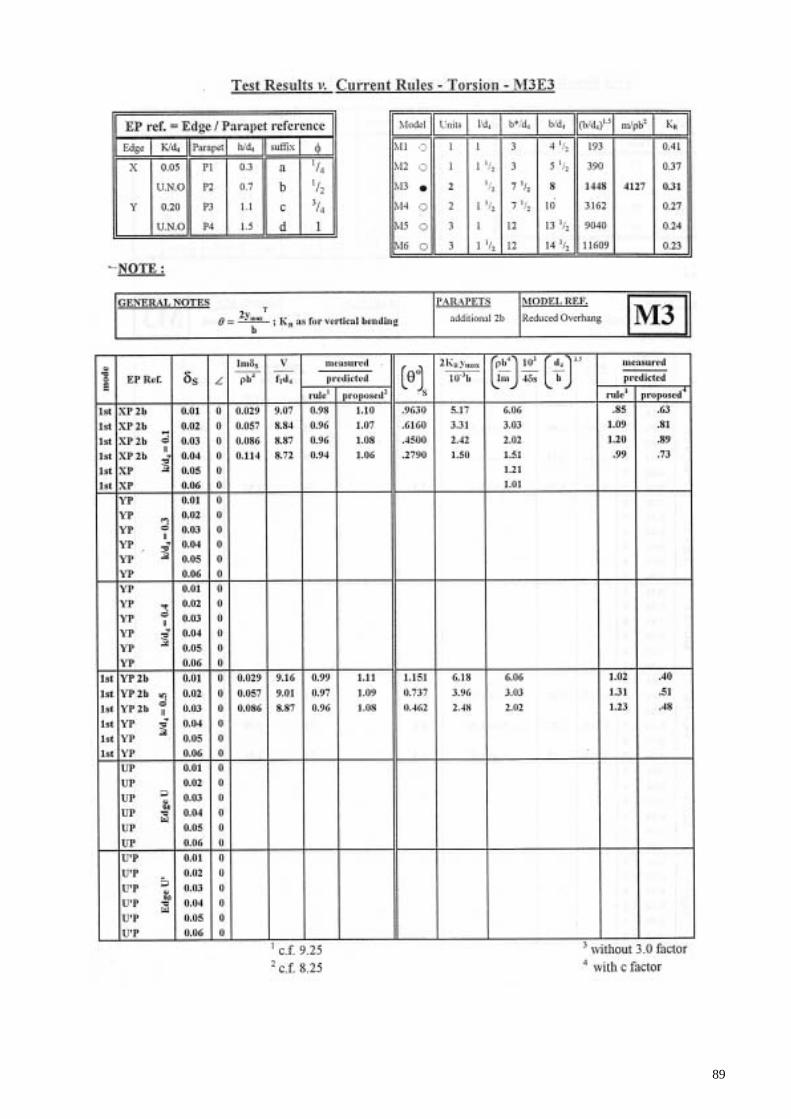
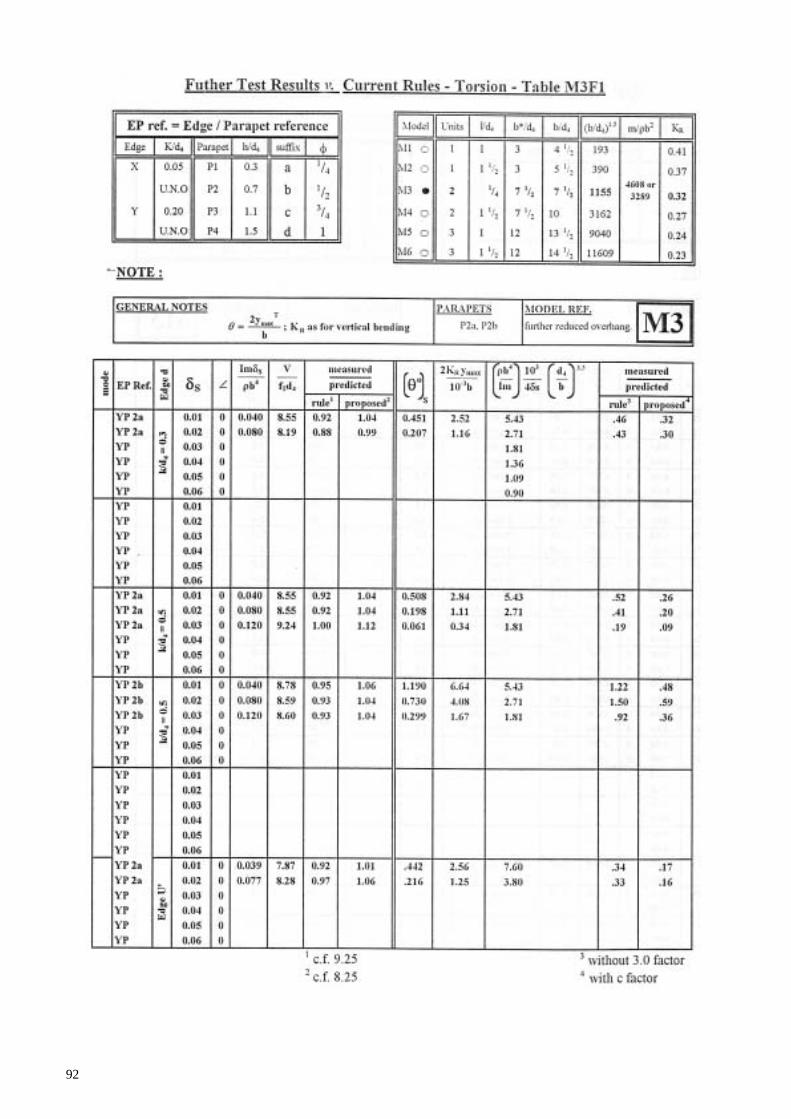
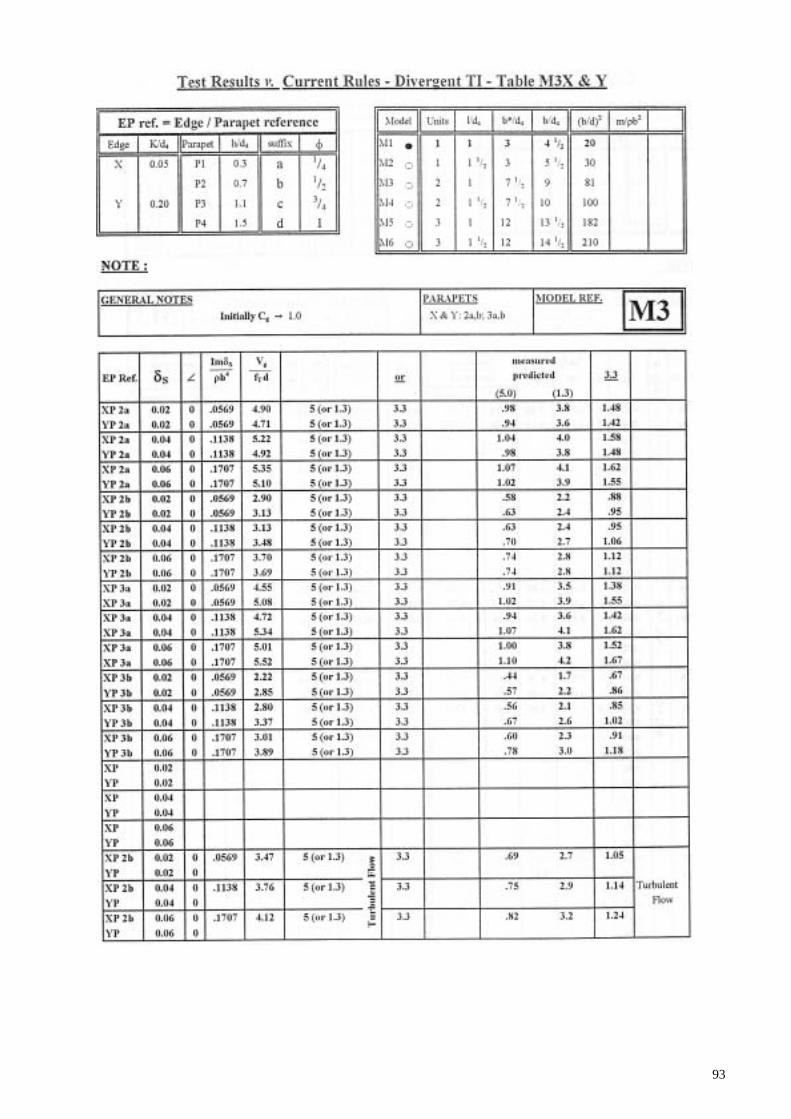
67
Appendix B: Comparison between test results and design rules

68
69
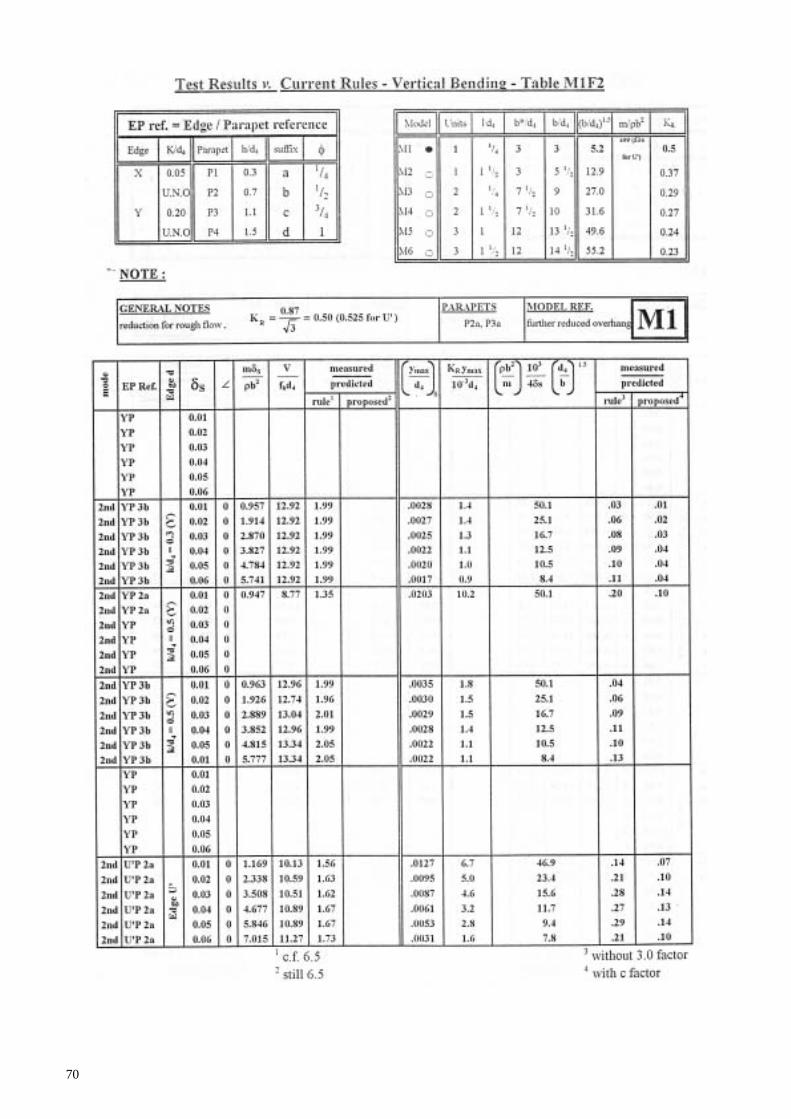
70
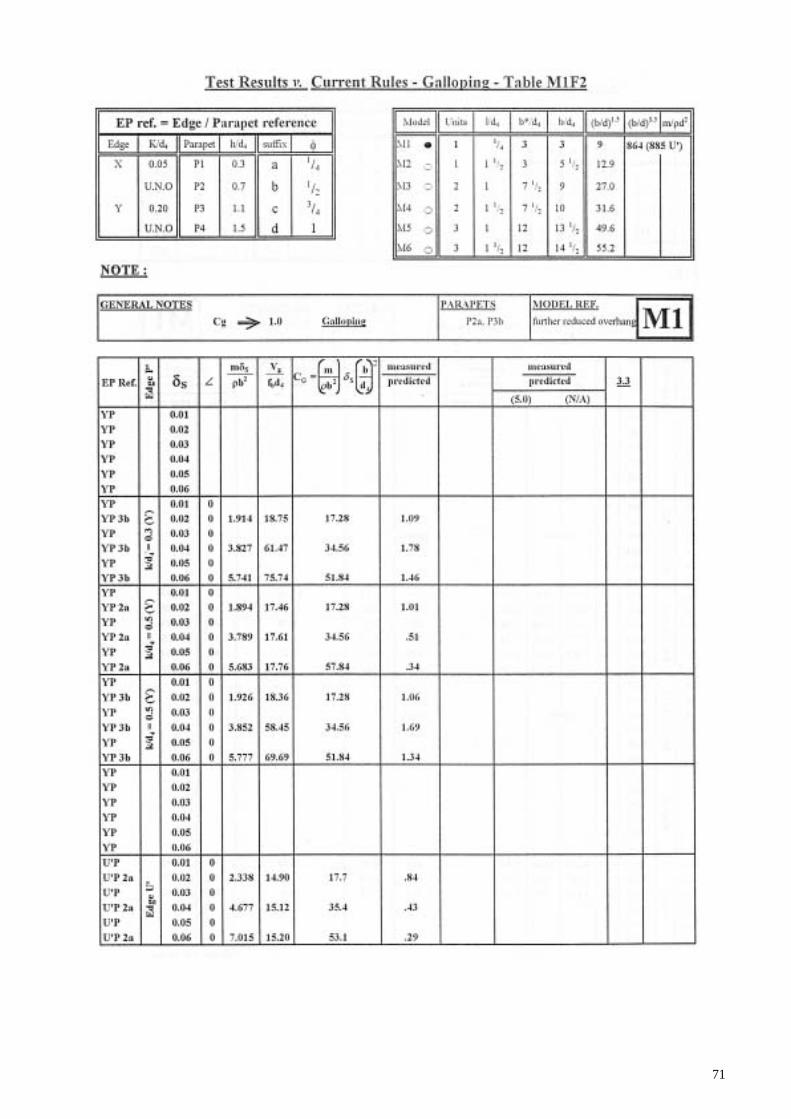
71
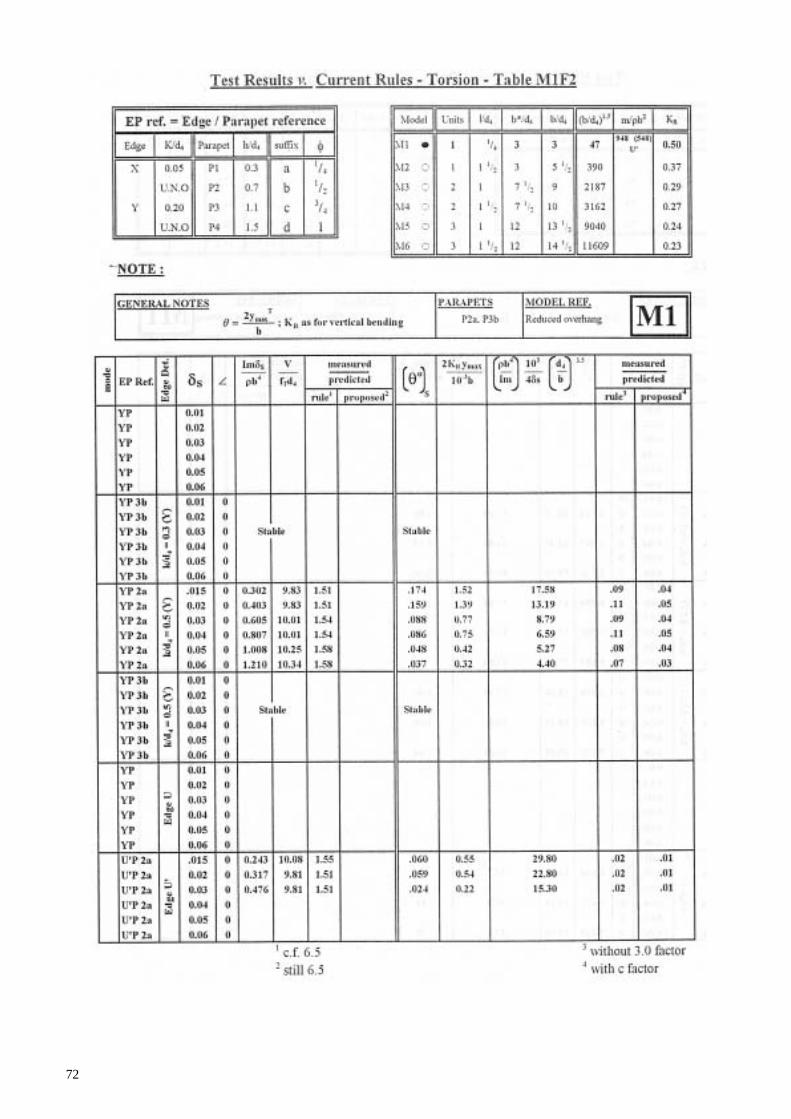
72

73
74
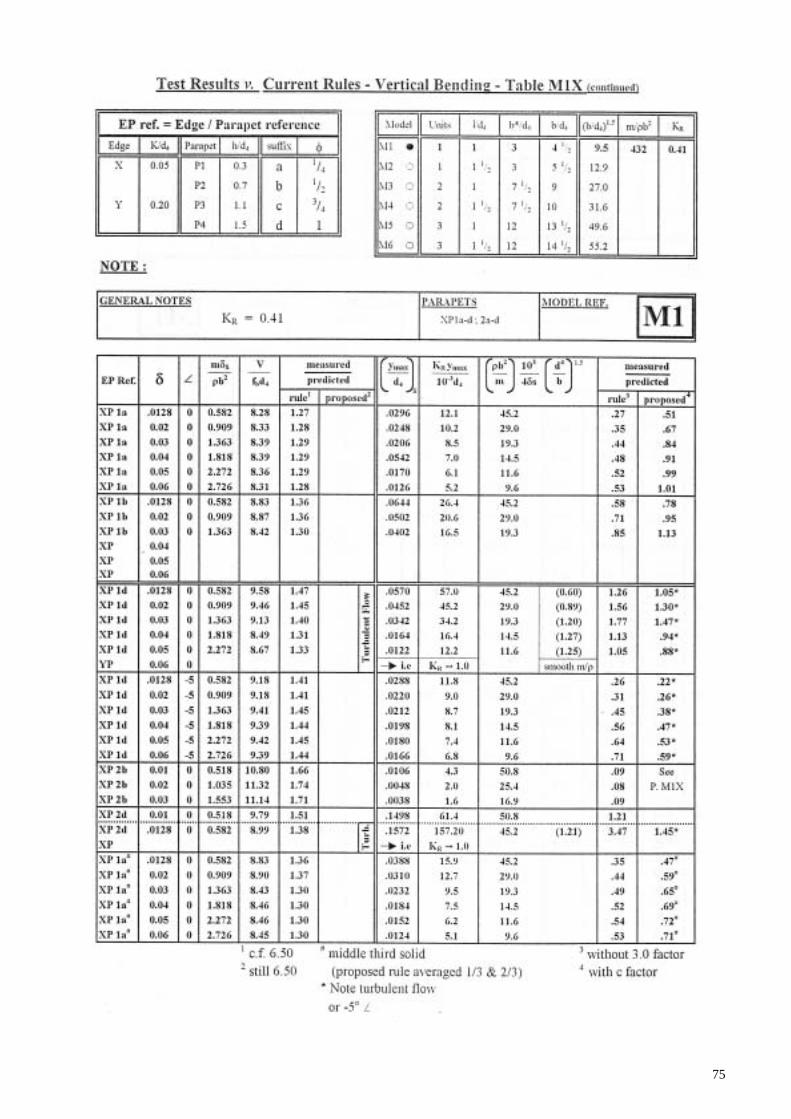
75

76
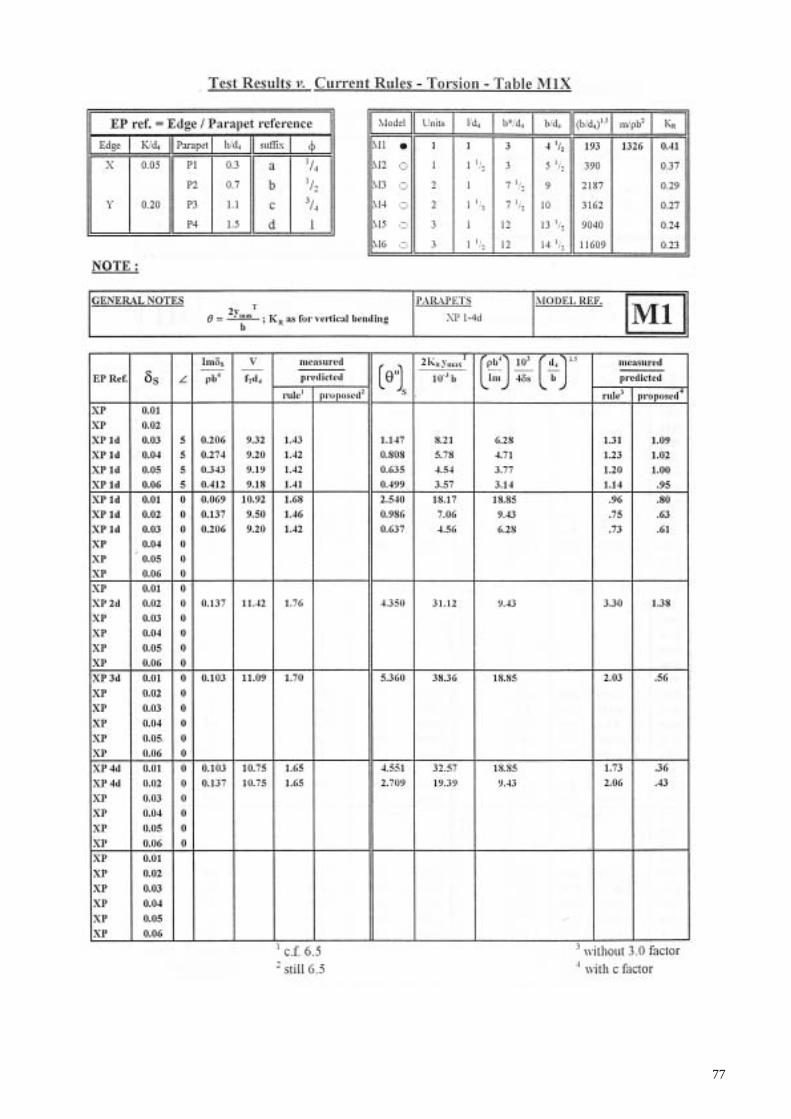
77

78
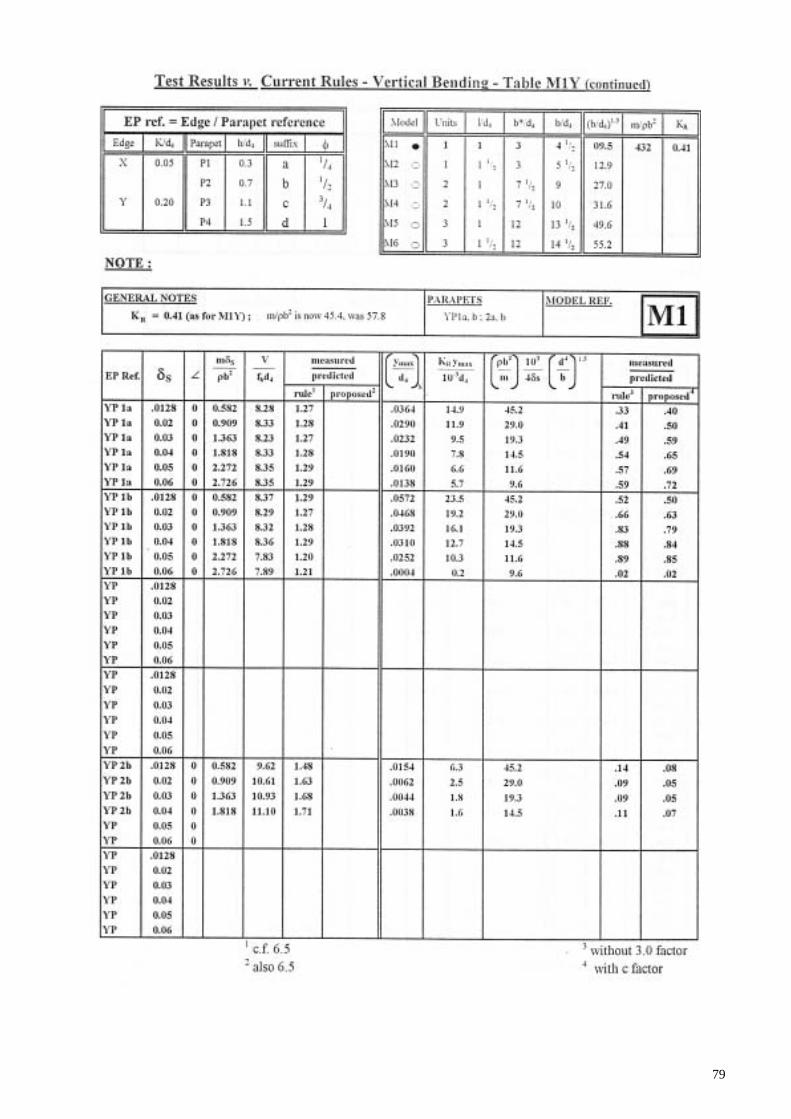
79
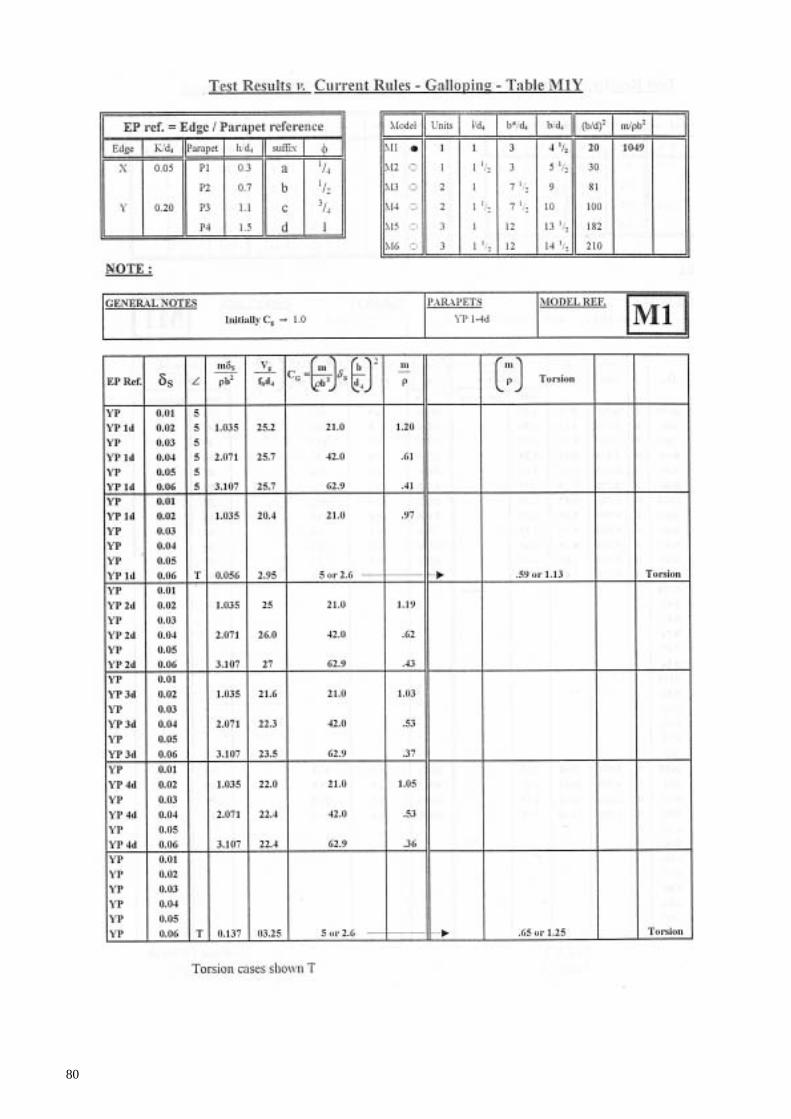
80
81

82

83
84
85

86
87
88
89

90

91
92
93

94
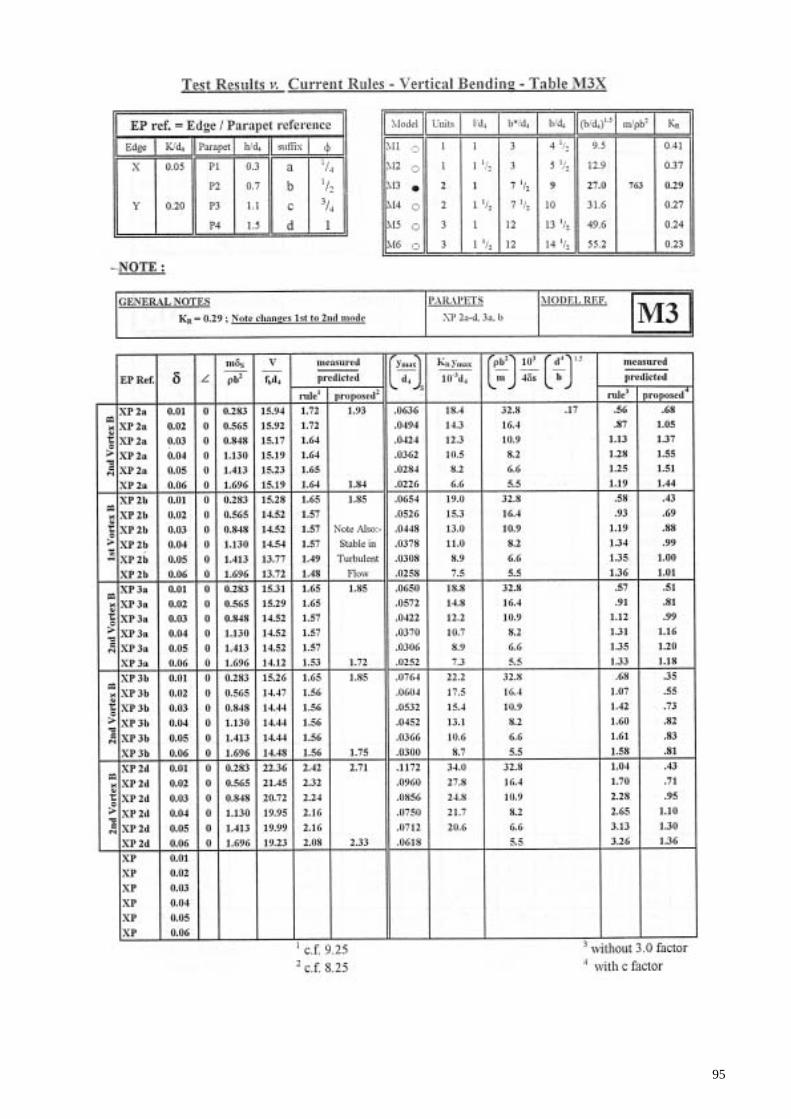
95

96
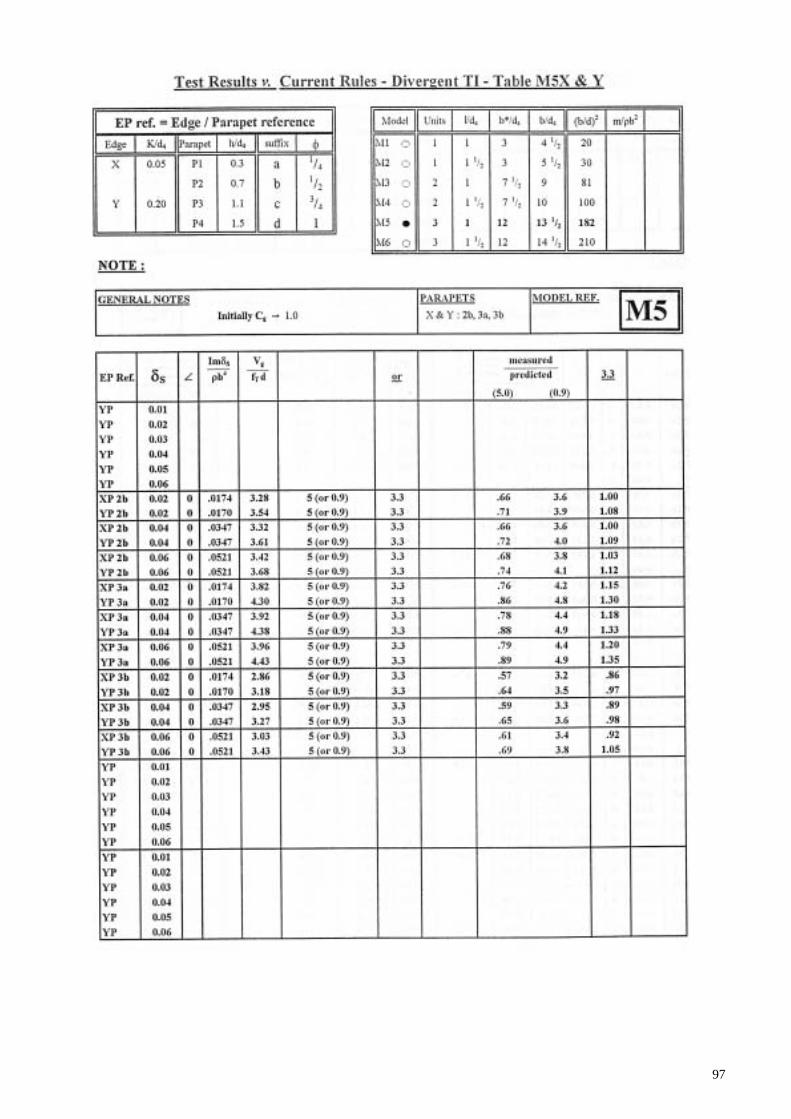
97
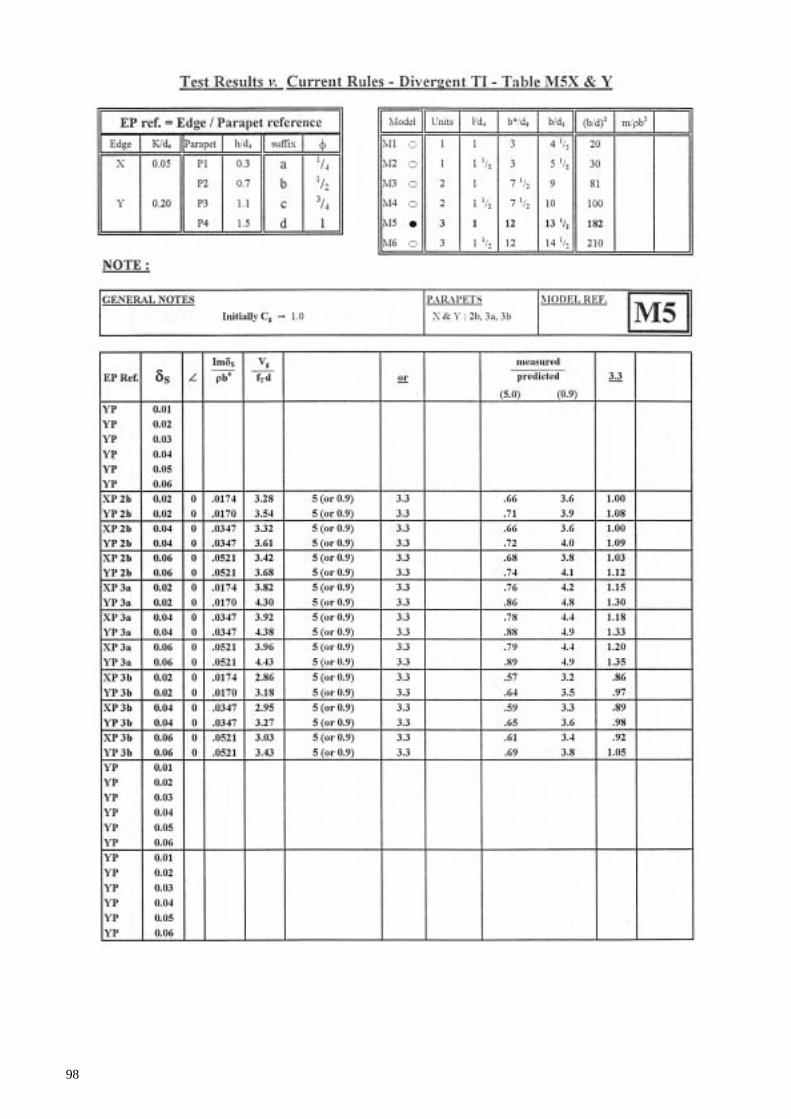
98
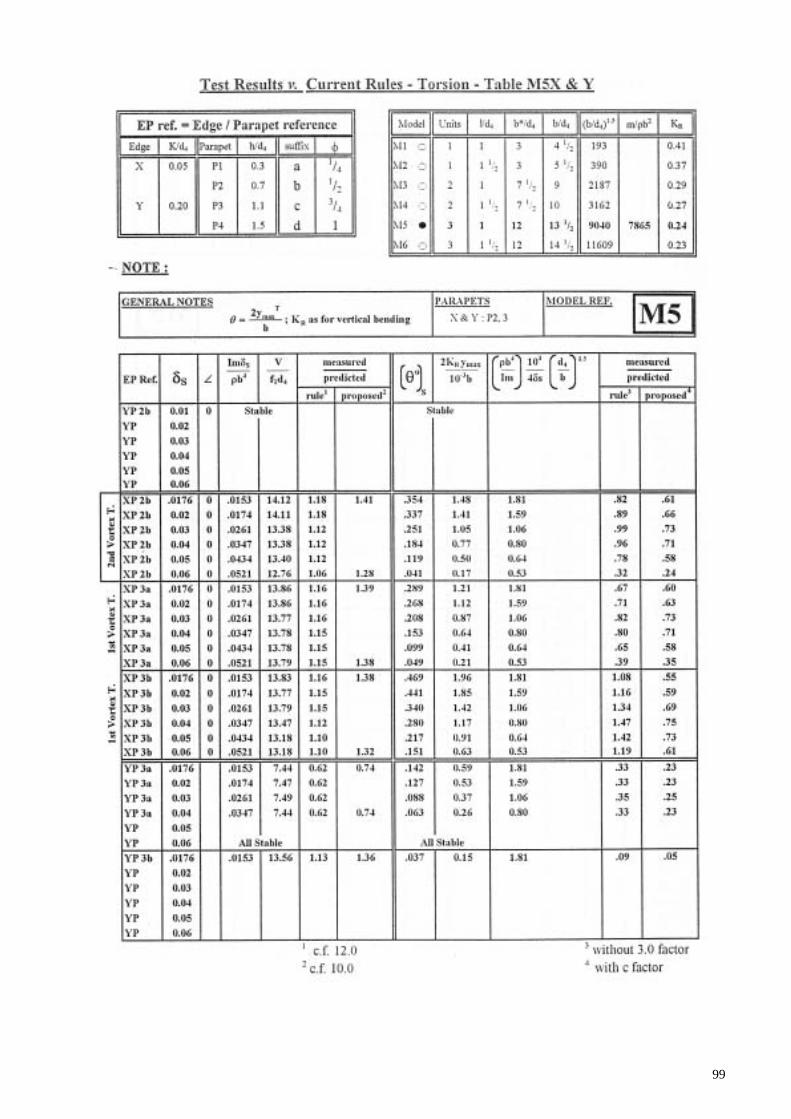
99
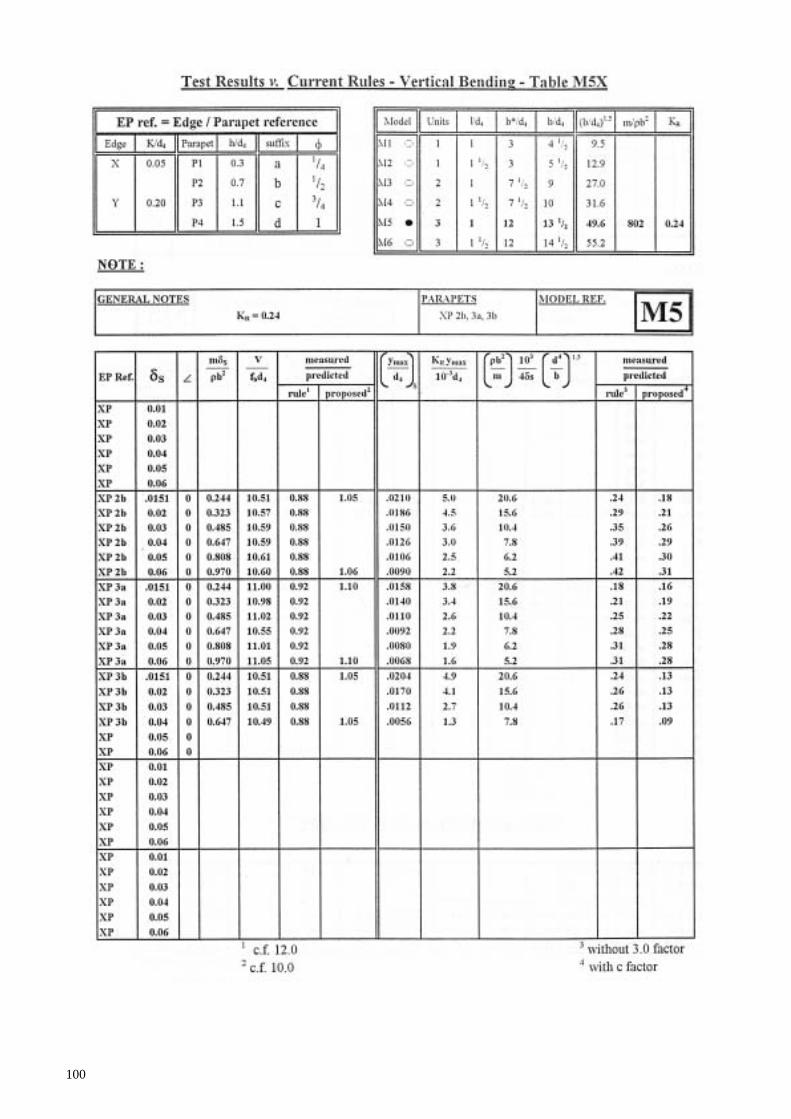
100

101
102
Appendix C: Typical results from earlier studies on box girder bridges
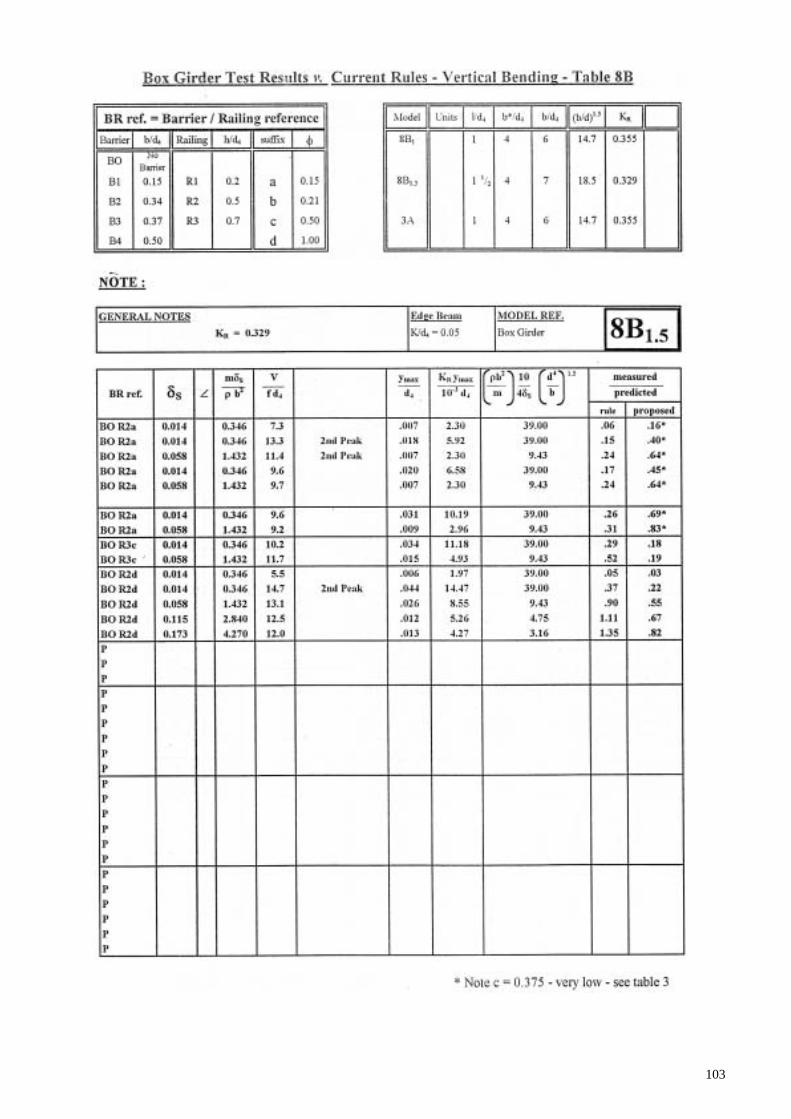
103
104

105
Abstract
Highways Agency Standard BD 49: Design rules for aerodynamic effects on bridges was first published in 1993 andcontains simplified methods for determining the susceptibility of bridge decks to aerodynamic instability. Thestandard was devised based on information available at that time. However, it contained a number of caveats forsome deck configurations and geometry, particularly in relation to plate girder bridges. Following later studies,experience of application and additional wind tunnel data, some of the clauses of BD 49 were revised and thedocument was re-published in 2001. The background to this update is reported in TRL Report TRL528.
This report describes a programme of wind tunnel tests that was carried out on plate girder bridges to provideinformation for this revision. Over 60 different configurations were tests, using different parapets and leading edgedetails. The report describes the models, the wind tunnel characteristics and the conclusions from the tests. Thewind tunnel data are presented in a form that can be used directly by engineers to assess the susceptibility differentbridge forms to aerodynamic instability in cases were the simplified rules in BD 49 indicate the possibility ofaerodynamic effects.
Related publications
TRL528 Background to the development of BD 49/01: Design rules for aerodynamic effects on bridgesby B W Smith, T A Wyatt, D K McKenzie, M V Hubband and A F Daly. 2002 (price £25, code E)
CR256 A re-appraisal of certain aspects of the design rules for bridge aerodynamicsby Flint and Neill Partnership. 1992 (price £25, code E)
CR36 Partial safety factors for bridge aerodynamics rules and requirements for wind tunnel testingby Flint and Neill Partnership. 1986 (price £35, code H)
Prices current at March 2002
For further details of these and all other TRL publications, telephone Publication Sales on 01344 770783, or visitTRL on the Internet at www.trl.co.uk.

106