wind resource data analysis - divakth.diva-portal.org/smash/get/diva2:633181/fulltext02.pdf · the...
TRANSCRIPT

Master of Science Thesis KTH School of Industrial Engineering and Management
Energy Technology EGI-2013-051MSC EKV953 Division of Heat & Power SE-100 44 STOCKHOLM
Wind Resource Data Analysis: The case of MYDERHU project site,
Tigray regional state, Ethiopia
Oumer Yissa Dawde

Master of Science Thesis EGI-2013-051MSC EKV953
Wind Resource Data Analysis:
The case of MYDERHU project site, Tigray regional state, Ethiopia
Oumer Yissa Dawde
Approved
2013-06-18
Examiner
Prof. Torsten Fransson
Supervisor
Miroslav Petrov Commissioner
Addis Ababa University
Contact person
Dr. Abebayehu Assefa
Abstract Ethiopia is a developing country and its major primary energy consumption is largely covered by
biomass and imported fossil fuels. Reliability of electricity supply varies widely across Ethiopia. Currently 65% of the population does not have access to electricity; 30 % of those without electricity live in village centers and 70% live in remote rural areas. However, the country is endowed with different renewable energy resources such as, hydro, wind, solar, geothermal and bioenergy. Wind energy is applicable for both power generation & water pumping applications for rural societies.
The purpose of this study it to analyze the wind energy resource potential at Myderhu, to model the wind data with different statistical methods and software, selecting wind turbine class, forecast site wind energy & power density, develop site wind resource map, preliminary wind turbine micro siting, estimating farm annual energy production (AEP) and the expected cost of electricity. Based on the analysis and site survey, the site roughness and power exponent factors are classified as class I. Detailed wind resource data analysis is performed for the proposed site by using Excel, MatLab and WAsP software, based on a wind mast of 50m with an average wind speed of 7 m/s & mean power density of about 287 W/m2, this is categorized as a class-III wind resource (fair potential).
Finally, wind resource mapping of 10km x 10km land area for a proposed wind farm is attempted at four different turbine hub heights of 30m, 50m, 80m and 100m. A supposed wind farm having 72 turbines with 82m rotor diameter at 80m hub height has been subjected to a simplified economy analysis by assuming investment costs of 1600 €/kW [38,400 birr/kW] and 1750 €/kW [42,000 birr/kW] and cost of energy estimated as 230.4 million € [5.53 billion birr], 0.028 €/kWhr [0.676 birr/kWhr] and 252 million € [6.05 billion birr], 0.031 €/kWhr [0.74 birr/kWhr] respectively. However, the Ethiopian FIT draft proclamation secure 0.073 €/kWhr [0.1 USD/kWhr] [1.75 birr/kWhr]. The calculation was done strictly by considering the power density at the site, and it didn’t address the issues of transportation and other installation related concerns and costs. Therefore, it is only applicable as a benchmark for future investigation work.
As per this preliminary analysis the farm installed capacity is 144 MW, gross AEP is estimated about 593 GWhr, considering a wake loss of average 4.4% the net AEP is 567 GWhr and the average power density at the wind farm is estimated at 446 W/m2. The average capacity factor is estimated at 45%. The mean wind speed at hub height is 8.07 m/s. The Weibull shape factor (k) ranges from 2.8 to 3.3 with total average of 3.17.

i Prepared by: Oumer Issa Local Advisor: Dr.-Ing. Abebayehu Assefa
PREFACE
Ethiopia is a developing country and its major primary energy consumption is largely covered by biomass and imported fossil fuels. Reliability of electricity supply varies widely across Ethiopia and it is worst in the poorest villages, which are not connected to the grid. Currently 65% of the population does not have access to electricity; 30 % of those without electricity live in village centers and 70% live in remote rural area (EEPCo). However, the country is endowed with different renewable energy resources such as, hydro, wind, solar, geothermal and bioenergy.
Wind energy is applicable for both power generation & water pumping application for rural societies. In the planning of utilizing wind energy resource, the very crucial thing is to undertake assessment works.
The purpose of this study is to analyze the wind energy resource potential at Myderhu site, model the wind data with different statistical methods and software products, selecting IEC wind turbine class, forecast site wind energy & power density, develop site wind resource map, preliminary wind turbine micro siting, estimating farm AEP and its expected cost of energy.
Chapter three is basically concentrating on the basics with a literature review and theoretical background of the wind data analysis.
Regarding data validation and site climate classification, they are discussed in detail under chapter four. Based on the analysis and site survey, the roughness and power exponent factors of the site are classified as class I. The average turbulence intensity at 10m height is 23% and it is 17% at 30m. Site annual average ambient temperature is 13.47oC.
Detailed resource data analysis is presented under chapter 5. The wind mast site resource is analyzed by using Excel, MatLab and WAsP softwares. As per the result at 50m of the wind mast site has an average wind speed of 7 m/s & mean power density of about 287 W/m2, this is categorized as a class-III wind resource (fair potential).
Chapter six is all about the supposed wind farm wind resource mapping, 10km x 10km land area. It is attempted to present the resource potential at four different turbine hub heights of 30m, 50m, 80m and 100m. The plots are for mean speed, power density and annual energy potentials at each height.

Wind Resource Data Analysis: The Case of MYDERHU Project Site
ii Prepared by: Oumer Issa Advisors: Dr.-Ing. Abebayehu Assefa
The supposed wind farm with 72 turbines having 82m rotor diameter & 80m hub height analysis result has been presented under chapter seven. At this point there is one important remark to be considered by readers, the turbine siting was done strictly by considering the power density of the site, and it didn’t address the issues of transportation and other installation related concerns. Therefore, it is only applicable as a benchmark for future investigation work. As per this preliminary analysis the farm installed capacity is 144 MW, gross AEP is estimated about 593 GWhr, considering the wake loss of average 4.4% the net AEP is 567 GWhr and the average power density is estimated at 446 W/m2. The proposed wind farm CF is estimated at 45%. The mean wind speed at each turbine hub height ranges from 7.32 m/s to 9.68 m/s with average of 8.07 m/s. The Weibull shape factor (k) ranges from 2.8 to 3.3 with total average of 3.17, the altitudes for the proposed wind turbines installation ranges from 2236 m.a.s.l. to 2750 m.a.s.l. with an average of 2563 m.a.s.l.
Finally, an economy analysis is attempted by assuming investment costs of 1600 €/kW [38,400 birr/kW] and 1750 €/kW [42,000 birr/kW] and cost of energy estimated as 230.4 million € [5.53 billion birr], 0.028 €/kWhr [0.676 birr/kWhr] and 252 million € [6.05 billion birr], 0.031 €/kWhr [0.74 birr/kWhr] respectively. However, the Ethiopian FIT draft proclamation secure 0.073 €/kWhr [0.1 USD/kWhr] [1.75 birr/kWhr] for the energy generated from wind resource.
KEYWORDS: Wind resource assessment, WAsP, surface roughness, wind frequency rose, wind climate, energy production, power density, wind turbines, Ethiopia, Myderhu wind mast site, Wind resource Map, wind farm

iii Prepared by: Oumer Issa Local Advisor: Dr.-Ing. Abebayehu Assefa
ACKNOWLEDGMENT
At first place I would like to give a bigger credit for KTH, Sida & AAU facilitators for giving me the opportunity to study my M.Sc. in Sustainable Energy Engineering. My two years study as well as this project facility requirements has been fully funded by the tax payers of Sweden’s, couldn’t giving credit for those people is a question of moral and selfishness. Therefore, my great thanks & wishes of prosperity should pass specifically to the SIDA coordinators in particular and to the Sweden’s people in general.
I would like to express my gratitude to my advisors Dr.-Ing. Abebayehu Assefa from Addis Ababa institute of Technology, Addis Ababa University and Dr. Babak from KTH for their review and helpful comments on the different level of draft preparation of this report as well as to finalize this project as per the specific objective and given time frame.
My special thank will go to Dr. Mulu B. as well as his staff members from Ethiopian institute of Technology, Mekelle university for facilitating to get the wind resource data measured by his department at Myderhu wind mast site, northern Ethiopia, near to capital city of the regional state.
I was also greatly impressed on the cooperation’s done by my friends Mr. Muaz B., Ato Elias G. and his friend Ato Assfaw Desta working in Tigray Regional State Water resource Bureau, on searching the site digital map including its coding software.
Last but not least I would like to express my hottest gratitude for my family & friends especially my wife Ms. Habiba B., I don’t have words to express your commitment and efforts undertaken for handling every family burdens with the absence of mine as well as busy times on preparing this document.

iv Prepared by: Oumer Issa Local Advisor: Dr.-Ing. Abebayehu Assefa
TABLE OF CONTENTS
PREFACE…………………………………………………………………………………………………I
ACKNOWLEDGMENT………………………………………………………………………………..III
LIST OF FIGURES ................................................................................................................... VII
LIST OF TABLES ........................................................................................................................ X
NOMENCLATURE AND ABBREVIATIONS ...................................................................... XII
CHAPTER ONE ............................................................................................................................ 1
INTRODUCTION AND PROJECT RATIONALE .................................................................. 1
1.1 INTRODUCTION ....................................................................................................................... 1
1.2 PROBLEM BACKGROUND AND IDENTIFICATION ....................................................................... 2
1.3 PROJECT OBJECTIVE ............................................................................................................... 3
1.3.1 General Objective ........................................................................................................ 3
1.3.2 Specific Objective ........................................................................................................ 3
1.4 DESCRIPTION OF THE STUDY AREA ............................................................................. 4
1.5 METHODOLOGY ....................................................................................................................... 8
CHAPTER TWO .......................................................................................................................... 10
LITERATURE REVIEW AND THEORETICAL BACKGROUND ..................................... 10
2.1 AVERAGE WIND SPEED .......................................................................................................... 10
2.2 DISTRIBUTION OF WIND VELOCITY ........................................................................................ 11
2.3 FREQUENCY DISTRIBUTION .................................................................................................. 11
2.4 STATISTICAL MODELS FOR WIND DATA ANALYSIS ................................................................. 11
2.5 WEIBULL DISTRIBUTION METHODS ....................................................................................... 13
2.6 EXTRAPOLATING AND NATURE OF WIND SPEED WITH HEIGHT .............................................. 15
2.7 TURBULENCE INTENSITY ...................................................................................................... 17
2.8 WIND TURBINE SELECTION AS PER IEC STANDARDS ....................................................... 19
2.9 ESTIMATION OF ANNUAL ENERGY PRODUCTION (AEP) ................................................... 20
2.10 LOSS ESTIMATION ................................................................................................................. 22
CHAPTER THREE ..................................................................................................................... 24
DATA VALIDATION AND SITE CLIMATOLOGY .............................................................. 24
3.1 DATA VALIDATION AND VERIFICATION .................................................................... 24
3.1.1 Negative wind shear values ...................................................................................... 24
3.1.2 Undefined power exponent values ............................................................................ 25

Wind Resource Data Analysis: The Case of MYDERHU Project Site
v Prepared by: Oumer Issa Advisors: Dr.-Ing. Abebayehu Assefa
3.1.3 Missing measured data values ................................................................................. 25
3.2 ROUGHNESS FACTOR AND POWER EXPONENT ......................................................... 26
3.3 TURBULENCE INTENSITY ............................................................................................. 28
3.4 TEMPERATURE AND DENSITY DISTRIBUTION ........................................................................ 31
CHAPTER FOUR........................................................................................................................ 32
ANALYSIS FOR SITE WIND RESOURCE POTENTIAL ................................................... 32
4.1 MEASURED AND WEIBULL DISTRIBUTION FOR WIND SPEED .................................................. 32
4.2 SITE WIND POWER AND ENERGY DENSITY POTENTIALS .......................................... 37
4.3 SITE ENERGY DENSITY AND CUMMULATIVE PLOTS ............................................................... 39
4.4 SITE WIND BLOW DIRECTION AND ITS DENSITY .................................................................... 40
4.5 POWER AND ENERGY DESNITY ANALYSIS USING SOFTWARE WASP .................................... 41
4.6 WIND TURBINE SELECTION AS PER IEC STANDARD .............................................................. 46
4.7 ESTIMATED ANNUAL ENERGY PRODUCTION (AEP), CAPACITY FACTOR AND UNIT ENERGY
COST WITH SELECTED TURBINE TYPES .................................................................................. 49
CHAPTER FIVE ......................................................................................................................... 54
SITE WIND MAP (RESOURCE GRID) PREPARATION USING WASP SOFTWARE . 54
5.1 REFERENCE CONDITIONS ......................................................................................................... 54
5.2 SITE WIND CLIMATE SUMMARY ................................................................................................ 54
5.3 WIND RESOURCE MAPING FOR 30M WIND TURBINE HUB HEIGHT ............................................. 55
5.3.1 Grid Setup ................................................................................................................. 55
5.3.2 WAsP analysis Results ............................................................................................ 55
5.4 WIND RESOURCE MAPING FOR 50M WIND TURBINE HUB HEIGHT .......................................... 57
5.4.1 Grid Setup .............................................................................................................. 57
5.4.2 WAsP analysis Results ............................................................................................. 57
5.5 WIND RESOURCE MAPING FOR 80M WIND TURBINE HUB HEIGHT .......................... 59
5.5.1 Grid Setup ................................................................................................................. 59
5.5.2 WAsP analysis Results ............................................................................................. 60
5.6 WIND RESOURCE MAPING FOR 100M WIND TURBINE HUB HEIGHT ................... 62
5.6.1 Grid Setup ................................................................................................................ 62
5.6.2 WAsP analysis Results ............................................................................................. 62
CHAPTER SIX ............................................................................................................................ 65
TURBINE SITING USING WASP SOFTWARE AND ESTIMATED ENERGY COST .. 65
6.1 GENERAL ABOUT MYDERHU WIND FARM................................................................. 65
6.2 SUMMARY OF FARM ANALYSIS RESULTS ................................................................................ 66
6.3 SOME OF THE 3D VIEWS OF MYDERHU WIND FARM ............................................................... 70
6.4 ESTIMATED FARM AEP AND CAPACITY FACTOR .................................................................... 74

Wind Resource Data Analysis: The Case of MYDERHU Project Site
vi Prepared by: Oumer Issa Advisors: Dr.-Ing. Abebayehu Assefa
6.5 ESTIMATED ENERGY COST ................................................................................................ 75
CHAPTER SEVEN ..................................................................................................................... 77
DISCUSSION ON THE ANALYSIS RESULTS ..................................................................... 77
CHAPTER EIGHT ...................................................................................................................... 80
CONCLUSIONS AND RECOMMENDATIONS .................................................................... 80
BIBLIOGRAPHY ........................................................................................................................ 81
APPENDIX ................................................................................................................................... 82

vii Prepared by: Oumer Issa Local Advisor: Dr.-Ing. Abebayehu Assefa
LIST OF FIGURES
Fig.1-1: Location map of the study site (left) and photo for wind measuring mast (right) ......................................................................................... 4
Fig.1 -2: General project site location with reference to Mekelle and Adigudom towns (GE©) ...................................................................... 5
Fig. 1-4 Gravel road to access the wind mast site, 16km from main asphalt road of Addis Ababa to Mekelle town (GE ©) .................................... 5
Fig. 1-5 Area considered for the construction of wind farm (10kmx10km) (GE ©) .................................................................................................. 6
Fig. 1-6 3D view for the selected wind farm site (GE ©) ................................ 6
Fig. 1-7 Project site and the nearby mountain Amba Aradom and related
issues of obstacle (GE ©) .................................................................... 7
Fig. 1-8 Planned wind farm project topographic map (Scale; 1:6000) (MU, GIS Department) ................................................................................ 7
Fig. 2-1 Energy flow through the mechanical-electrical energy conversion
chain at nominal operating point, (Erich H., 2006) ........................ 23
Fig. 3-1 Wind shears cumulative Weibull distribution curves ..................... 27
Fig. 3-2 Turbulence intensity probability density curves at both heights ... 29
Fig. 3-3 Turbulence intensity cumulative distribution curves at both heights ............................................................................................... 29
Fig. 3-4 Hourly average turbulence intensity for comparison purpose ....... 30
Fig. 3-5 Hourly average turbulence intensity ............................................... 30
Fig. 3-6 Impact of temperature difference on air density ............................. 31
Fig. 4-1 Measured wind speed ....................................................................... 32
Fig. 4-2 Weibull probability density curves for both heights (10 minutes average) ............................................................................................. 32
Fig. 4-3 Weibull cumulative distribution curves for both heights (10 minutes average) .............................................................................. 33

Wind Resource Data Analysis: The Case of MYDERHU Project Site
viii Prepared by: Oumer Issa Advisors: Dr.-Ing. Abebayehu Assefa
Fig. 4-4 Hourly average velocity distribution curves (for both heights) ...... 34
Fig. 4-5 Hourly average wind speed (10m height) ........................................ 34
Fig. 4-6 Wind speed hourly average (30m height) ........................................ 35
Fig. 4-7 Difference of annual daily average wind speeds (both heights) ..... 35
Fig. 4-8 Comparison of Daily average wind speed with Months (a) ............ 36
Fig. 4-9 Comparison of Daily average wind speed with Months (b) ............ 36
Fig. 4-10 Power curve with respect to wind speed .......................................... 37
Fig. 4-11 Weibull Power probability density ................................................... 38
Fig. 4-12 Weibull Power cumulative distribution ........................................... 38
Fig. 4-13 Weibull Energy curves with respect to wind speed ........................ 39
Fig. 4-14 Weibull Energy cumulative distribution curves ............................. 40
Fig. 4-15 Myderhu wind mast site wind rose. ................................................. 41
Fig. 4-16 Site roughness estimations .............................................................. 42
Fig. 4-17 Mountains considered as an obstacles for the current wind mast as
well as future wind farm (GE©) ....................................................... 42
Fig. 4-18 Obstacle groups, considering the two big mountains around the site as an obstacle .................................................................................... 43
Fig. 4-19 Vector map consisting of topographic train, roughness and obstacle groups ................................................................................................ 43
Fig. 4-20 Observed wind frequency (left) and Power density (right) ............. 44
Fig. 4-21 Typical demonstration for obstacle effects for the turbine located at
current wind mast site ..................................................................... 44
Fig. 4-22 E33 wind turbine performance curves ............................................. 47
Fig. 4-23 E53 wind turbine performance curves ............................................. 48
Fig. 4-24 E82 wind turbine performance curves ............................................. 48
Fig. 4-25 E101wind turbine performance curves ............................................ 48

Wind Resource Data Analysis: The Case of MYDERHU Project Site
ix Prepared by: Oumer Issa Advisors: Dr.-Ing. Abebayehu Assefa
Fig. 4-26 Weibull distribution for Observed Wind Climate (30m) ................. 49
Fig. 4-27 30m turbine height wind speed distribution (30m wind atlas) ...... 49
Fig. 4-28 50m turbine height wind speed distribution (50m wind atlas) ...... 50
Fig. 4-29 80m turbine height wind speed distribution (80m wind atlas) ...... 50
Fig. 4-30 100m turbine height wind speed distribution (100m wind atlas) .. 50
Fig. 4-31 E33 turbine AEP (at Myderhu wind mast site) .............................. 51
Fig. 4-32 E53 turbine AEP (at Myderhu wind mast site) .............................. 51
Fig. 4-33 E82 turbine AEP (at Myderhu wind mast site) .............................. 52
Fig. 4-34 E101 turbine AEP (at Myderhu wind mast site) ............................. 52
Fig. 5-1 Wind speed Resource Map at 30m wind turbine heights ............... 56
Fig. 5-2 Power density Map at 30m wind turbine hub heights .................... 56
Fig. 5-3 Annual energy production at 30m wind turbine hub heights ........ 57
Fig. 5-4 Wind speed Resource Map at 50m wind turbine heights ............... 58
Fig. 5-5 Power density Map at 50m wind turbine hub heights .................... 58
Fig. 5-6 Annual energy production at 50m wind turbine hub height .......... 59
Fig. 5-7 Wind speed Resource Map at 80m wind turbine hub heights ........ 60
Fig. 5-8 Power density Map at 80m wind turbine hub heights .................... 61
Fig. 5-9 Annual energy production at 80m wind turbine hub heights ........ 61
Fig. 5-10 Wind speed Resource Map at 100m wind turbine hub heights ...... 62
Fig. 5-11 Power density Map at 100m wind turbine hub heights .................. 63
Fig. 5-12 Annual energy production at 100m wind turbine hub heights ...... 64
Fig. 6.1 General overview for Myderhu wind farm sectioning and turbine sitting ................................................................................................ 66
Fig. 6.2 Turbine sitting and wind speed frequency rose using power density as a background ................................................................................ 69
Fig. 6.3 RIX map for Myderhu wind farm project at 80m turbine height ... 69

Wind Resource Data Analysis: The Case of MYDERHU Project Site
x Prepared by: Oumer Issa Advisors: Dr.-Ing. Abebayehu Assefa
Fig. 6.4 Number of turbines at each section ................................................. 70
Fig. 6.5 Turbines site and power density ...................................................... 70
Fig. 6.6 3D veiw for Section-A- Wind turbines sitting ........................................................................................................... 71
Fig. 6.7 3D veiw for for some of Section-A- Wind turbines sitting with site power density and wind frequency rose .......................................... 71
Fig. 6.8 3D veiw for Section-B- Wind turbines sitting ................................. 72
Fig. 6.9 3D veiw for Section-B- Wind turbines sitting with site power density and wind frequency rose ..................................................... 72
Fig. 6.10 3D veiw for Section-C- Wind turbines sitting arround the mountain ........................................................................................................... 73
Fig. 6.11 3D veiw for Section-C- Wind turbines sitting to the south of
mountain ........................................................................................... 73
Fig. 6.12 3D veiw for Section-C- Wind turbines sitting arround the mountain
with site power density and wind frequency rose ........................... 73
Fig. 6.13 3D veiw for Section-C- Wind turbines sitting to the south of mountain with site power density as a background and wind
frequency rose ................................................................................... 74
Fig. 6.14 3D veiw for Section-C- Wind turbines sitting to the east of the mountain with site power density and wind frequency rose .......... 74

xi Prepared by: Oumer Issa Local Advisor: Dr.-Ing. Abebayehu Assefa
LIST OF TABLES
Table 3.1 Typical negative wind shear values ............................................... 24
Table 3.2 Typical results for undefined power exponent values .................. 25
Table 3.3 Missing data values date and time ................................................ 25
Table 3.4 Representative data sets for higher values of power exponent and roughness factors ............................................................................ 26
Table 4.1 30m-Wind atlas summery statistics .............................................. 44
Table 4.2 Typical site effect demonstration for turbine installed at current wind mast site (Turbine-001 at wind farm) .................................. 44
Table 2.3 One year and fifty year estimated extreme wind speeds .............. 46
Table 4.4 Selected turbine models and its brief information ........................ 47
Table 4.5 Summary of predicted wind climate for each turbine hub heights
at Myderhu wind data measuring siteError! Bookmark not
defined.
Table 4.6 Summarized AEP, Capacity factor and unit energy cost ............. 53
Table 5.1: Project Site wind climate summary (regional wind climate) ........ 54
Table 5.2: Summery for Myderhu wind resource grid analysis ..................... 64
Table 6.1: Summary for some of the parameters at 80m wind turbine hub height .............................................................................................. 65
Table 6.2 Summary of Myderhu wind power generation farm general parameters ...................................................................................... 66
Table 6.3 Myderhu Wind farm overall result and wind climate
characteristics ................................................................................. 67

xii Prepared by: Oumer Issa Local Advisor: Dr.-Ing. Abebayehu Assefa
NOMENCLATURE AND ABBREVIATIONS
Α : Area (m2)
AEP : Annual energy production c : Weibull scale parameter or factor (m/s) EEPCo : Ethiopian Electric Power Corporation EiT-M : Ethiopian Institute of Technology-Mekelle EnPe : Norway Energy and Petroleum f (v) : Probability of observing wind speed F (v) : Cumulative distribution function FIT : Feed-in-tariff GDP : Gross domestic product GE © : background copied from Google Earth GW/GWhr : Giga Watt / Giga Watt hour h : Height (m) k : Weibull shape parameter or factor kW/kWhr : Kilo Watt / Kilo Watt hour M.Sc. : Master of Science MU-GIS : Mekelle university, GIS department MW/MWhr : Mega Watt / Mega Watt hour n : Number of constants N : Number of observations P : Power of wind per unit area (W/m
2)
P/A : Power/Area (power density) R : Correlation coefficient RIX : Ruggedness index RMSE : Root mean square error v : Wind speed (m/s) Vm : Mean wind speed (m/s) Ρ(v) : Mean power density
Greek symbols: ρ : Air density (kg/m
3)
σ : Standard deviation

1 Prepared by: Oumer Issa Local Advisor: Dr.-Ing. Abebayehu Assefa
CHAPTER ONE
INTRODUCTION AND PROJECT RATIONALE
1.1 INTRODUCTION
For every day to day activity, the current society strongly relies on the applications of modern electronics and technologies. These technologies are driven by consuming different types of energy. From these many types of energy demand, the role of electricity is significantly increasing.
Electricity greatly influences the growth rate of developing countries as well as the developed. When considering the country Ethiopia, it is essential needed as the source of energy for different manufacturing industries, lighting, for mass communication when people get useful information through radio or TV and of course for numerous agricultural and industrial applications that greatly affect the socio-economic systems like municipal water supply, crop milling and the likes.
A stable electric power supply is a prerequisite for the economic growth of a nation. It also enables the community to get income from a side jobs such as processing agricultural products, producing handicrafts, working on beauty salons, small wood works and welding workshops, working under the light at the night, etc.
The reliability of electricity supply varies widely across Ethiopia and is worst in the poorest villages, which are not connected to the grid. Currently 65% of the population does not have access to electricity; 30 % of those without electricity live in village centers and 70% live in remote rural areas, (EEPCo, 2010). However, the country is endowed with different renewable energy resources such as hydro, wind, solar, geothermal and bio-energy which are not yet properly utilized.
Considering the country’s wind resource potential, whose assessment is the main objective of this paper, the country has enormous untapped potential. As estimated by EEPCo, the exploitable potential is around 5 GW. It is also concentrated in the north and eastern regions of the country. It can be applicable for both remote-village water pumping and/or power development and for large-scale grid-connected electricity production. Currently two wind farms - one at Ashegoda with installed capacity of 120MW and another at Adama with installed capacity of 51MW are been constructed.

Wind Resource Data Analysis: The Case of MYDERHU Project Site
2 Prepared by: Oumer Issa Advisors: Dr.-Ing. Abebayehu Assefa
1.2 PROBLEM BACKGROUND AND IDENTIFICATION
Generally the rural community of Ethiopian people has heavy reliance on biomass fuels. This has detrimental impact specifically for the consumers’ direct health and work burden issues and also its large consequence on the local environment such as deforestation, endangering biodiversity, depletion of water quality, soil degradation, erosion, etc. It is known from the history of Ethiopian forest coverage was about 35 to 40% of the total area. However, the current studies show that forest coverage is estimated below 2.7%.
As a typical consideration, it is enough to see the impact of deforestation and its consequence. Some of the influences can be seen from the declining of agricultural yields due to soil degradation. This greatly influences the country’s annual GDP growth and challenge farmer’s livelihood. The second issue is hydro-dams. It has a great problem of siltation on the dams and reducing the energy producing capacity of the power plants. The third issue might be seen in the direction of rainfall shortage. This also greatly affects the country’s strongly rain dependent agricultural sector as well as the productivity of hydropower plants. Last but not least, it’s consequence on the larger earth’s environment and global warming issues can be considered as the impact of deforestation.
Therefore, leaving rural inhabitants to continue on the course of the current traditional energy use pattern is bound to have highly negative consequences for the rural economy at large, as well as the environment and the ecosystem balance in particular.
Ethiopian electric power generation is largely dependent on hydropower resources. The problem of power shedding that the country faces is due to lack of energy resource mix. Therefore, to explore the opportunity for wider energy mix, wind energy will be one of the best possible options. Since the country has enormous potential and a competitive technology as well as attractive foreign government’s support for the sector, wind energy is an attractive renewable option for the Ethiopian energy system. From the many reasons for the attractiveness of wind energy, its huge resource potential, steadily falling costs of system equipment and accessories as the technology advances, etc. are worth mentioning. During the summer season, when the volume of the hydro-dams drops and subsequently when the hydro power generation is reduced, wind energy can be used to back-up the energy drop of the hydropower plants.
In addition to power generation, wind energy is an option for water pumping applications for rural societies, especially in Tigray regional state. Wind energy is chosen because of the huge potential of discrete wind resource in the region and the opportunity of financial funding from donors for such kinds of projects.

Wind Resource Data Analysis: The Case of MYDERHU Project Site
3 Prepared by: Oumer Issa Advisors: Dr.-Ing. Abebayehu Assefa
As far the Ethiopian electricity supply is concerned it is heavily dependent on hydropower resources. The country faces the problem of power blackouts due to decrease of the water levels in hydro-dams. The implementation of a wider energy mix is very important. When considering energy mix options wind power has an interesting resource potential as well as technology and experience.
Therefore, once it is decided to utilize the wind energy resource, the very crucial thing is to undertake as accurate as possible site data assessment works. The available wind resource is basically governed by the site topographical and weather conditions. It has also a large variability from one location to the other, and also from season to season at any fixed location.
To utilize the maximum possible output of power for a given type of wind electric generator, an assessment of the wind resource available at any proposed potential site is an essential factor.
As far as wind energy is concerned, the most crucial characteristics is its potential based on wind speed as well as its direction and the situation of the degree of variation with a given location for a given period of time. Those parameters are strongly dependent on geographical location, time of the day, climate condition as well as season of the year for the particular proposed potential site. The relationship between wind speed and its ability to generate power is amplified by a cube rate. This shows the very high sensitivity of power production to wind speed variation.
1.3 PROJECT OBJECTIVE
1.3.1 General Objective
The overall objective of this paper is to conduct wind resource data analysis for Myderhu site. In addition, the study explores the option of having wind energy as a complement to the energy mix strategy of the Country in general.
1.3.2 Specific Objectives
• To analyze the wind energy resource potential at Myderhu site, • To model the wind data with different statistical methods and software, • To forecast site wind power and energy density by using one year wind data, • To generate site wind resource map using WAsP software, • To select IEC wind turbine class as per the site wind resource map, • To conduct preliminary wind farm micro turbine sitting and estimate the
farm annual energy production (AEP), and • To perform preliminary estimates of the investment cost and cost of energy.

Wind Resource Data Analysis: The Case of MYDERHU Project Site
4 Prepared by: Oumer Issa Advisors: Dr.-Ing. Abebayehu Assefa
1.4 DESCRIPTION OF THE STUDY AREA
The project site is located at Myderhu village, found in Tigray regional state, Northern Ethiopia. More specifically, it is found closer to Adigudem town which is located some 40 km from the capital town of the region, Mekelle and 740 km from Addis Ababa, Fig.1. The wind mast site is about 47km from Mekelle City. Access road to the site is about 31km asphalt road from Mekelle city and about 16 km gravel road with many smaller bridges and curves.
The wind mast geographical location is Zone 37 UTM 0543023 Easting and 1469531 Northing or Latitude 13.2926O and Longitude 39.3972O and elevation of 2513 meters above sea level. The topography around the wind mast could be summarized as a gorge from North-East to South-East direction, flat land from South-East to the West direction and smaller mountainous in the direction from the West to North-east of the mast.
Figures 1.1 to 1.7 show the site physical location and some of the topographic properties of the area.
Fig.1-1: Location map of the study site (left) and a photo of the wind measuring mast (right).

Wind Resource Data Analysis: The Case of MYDERHU Project Site
5 Prepared by: Oumer Issa Advisors: Dr.-Ing. Abebayehu Assefa
Fig.1 -2: General project site location with reference to Mekelle and Adigudom towns (GE©)
Fig. 1-3: Gravel road to access the wind mast site, 16km from main asphalt road of Addis Ababa to Mekelle town (GE ©)

Wind Resource Data Analysis: The Case of MYDERHU Project Site
6 Prepared by: Oumer Issa Advisors: Dr.-Ing. Abebayehu Assefa
Fig. 1-4: Area considered for the construction of wind farm (10kmx10km) (GE ©)
Fig. 1-5: 3D view for the selected wind farm site (GE ©)

Wind Resource Data Analysis: The Case of MYDERHU Project Site
7 Prepared by: Oumer Issa Advisors: Dr.-Ing. Abebayehu Assefa
Fig. 1-6: Project site and the nearby mountain Amba Aradom and related issues of obstacle (GE ©)
Fig. 1-7: Planned wind farm project topographic map (Scale; 1:6000) (MU, GIS Department)

Wind Resource Data Analysis: The Case of MYDERHU Project Site
8 Prepared by: Oumer Issa Advisors: Dr.-Ing. Abebayehu Assefa
1.5 METHODOLOGY
Step by step work methodologies and required resources for the finalization of this analysis work, starting with a literature review on previous similar works and ending with compiled report preparation, are described here.
1. Literature review on previous works including but not limited to books, publications, journals, manuals, reports, etc.,
2. Two field trips were conducted to Myderhu wind mast site. The surveys were done to study the situation of the available obstacles that are expected to have sheltering effect on the wind measuring mast. The field trips have also been conducted to assess the condition of access roads to the site.
Site visits and data collection were carried out using the following tools and instruments: o Site topographical map o Global Positioning System (GPS) o Photo camera o Compass o Tape meter
3. Data analysis and system accessories selection:
o The data analysis was started by downloading and utilizing the measured wind data from the data logger of the Myderhu wind mast site installed by Mekelle University in collaboration with Norad and EnPe of Norway non-governmental organizations.
o Data validation (Wind data summary) have been done through the following processes: • Data screening which was done by:
Arranging as per their category Check for the availability of missed data
• Data verification which was done by: Range test Relational test Trend test
• Finally, validated data file was created for next processes.
o Site topographical map was obtained from the Institute of Geo-science, Mekelle University (in softcopy)
o Input data and map have been prepared to be used for software application, especially for MatLab, WAsP-10 and WAsP Engineerinig.

Wind Resource Data Analysis: The Case of MYDERHU Project Site
9 Prepared by: Oumer Issa Advisors: Dr.-Ing. Abebayehu Assefa
• The software that have been utilized are: MS Excel, Global Mapper, WAsP Map editor and WAsP turbine
editor, • The activities that have been carried out under this step include
the following: Data validation (as per the above procedures) Site vector map preparation Site obstacle vector map preparation Selected turbines power and performance curves preparation
• The Weibull statistical models and software Excel and MatLab
have been implemented for the wind mast site data analysis to determine and plot the following parameters:
• Daily, monthly and annual average wind speeds and standard deviation
• Wind speed frequency distribution • Wind rose diagram • Wind power density • Turbulence intensity
Finally, the following activities have been undertaken:
o Determination of site wind shear from the available data sets o Extrapolating of the wind speed for 50m, 80m and 100m wind turbine
hub heights o Plotting of wind resource map for 10km x 10km wind farm size o Selection of wind turbine class as per IEC standard o Preparation of turbine power curve with the help of turbine editor
tools to feed for WAsP o Assumption of number of turbines for power generation o Prediction of Gross and Net Annual Energy Production (AEP) from
the proposed farm o Estimation of preliminary gross investment and cost of energy for the
proposed wind farm
4. Finally, the site wind resource potential analysis was compiled and submitted to the Department of Sustainable Energy Engineering, Royal Institute of Technology (KTH), Sweden.

10 Prepared by: Oumer Issa Local Advisor: Dr.-Ing. Abebayehu Assefa
CHAPTER TWO
LITERATURE REVIEW AND THEORETICAL BACKGROUND
For estimating the wind energy potential of any proposed site, the wind data collected from the location should be properly analyzed, correlated and predicted. As many literatures recommend, using the available long term wind data from the meteorological stations near to the candidate site can be used for making preliminary estimates of wind resource potential for the proposed site. This metrological data, which may be available for long periods, should be carefully extrapolated to estimate the wind profile of the candidate site. This preliminary investigation gives a clue to undertake field measurements or to terminate the assessment further works, the field measurements are generally made at the prospective location for shorter periods.
One year wind data recorded at the site is sufficient to represent the long term variations in the wind profile within an accuracy level of 10 per cent, (Sathyajith M., 2006).
Modern wind measurement systems provide the average wind speed, standard deviation, wind direction, temperature, and site solar radiation for a pre-fixed time intervals. The commonly applied measurements are ten minutes interval. This short term wind data are further grouped over time spans in which the researchers interested in and analyzed with the help of statistical models and software to make precise estimates on the energy available in the wind.
2.1 AVERAGE WIND SPEED
One of the most important information on the wind spectra available at a location is its average velocity. In simple terms, the average velocity (Vm) is given by:
𝑉 = 1𝑛∑ 𝑉𝑖𝑛𝑖=1 (2.1)
where Vi is the wind velocity and n is the number of wind data.
However, as represented in Appendix-B, for calculating the average wind speed and subsequently to estimate the site power generation potential the above method, Eq.(2.1), of averaging the velocity is misleading, i.e., since, the relation of wind speed and power is in a cube rate, it may significantly underestimate the wind power potential. Thus, as recommended by (Sathyajith M., 2006), averaging wind speed for wind energy calculations, the velocity should be weighed for its power content. Thus, the average wind velocity on this paper has been done by using the following equation:

Wind Resource Data Analysis: The Case of MYDERHU Project Site
11 Prepared by: Oumer Issa Advisors: Dr.-Ing. Abebayehu Assefa
𝑉 = (1𝑛∑ 𝑉𝑖3)𝑛𝑖=1
3 (2.2)
2.2 DISTRIBUTION OF WIND VELOCITY
In addition to the average wind speed property of the site, one important factor is the so called standard variation; it indicates the rate of variation of wind speed over the time period. Standard deviation indicates the deviation of individual velocities from the mean value. Analysis of wind velocity distribution is a critical factor in wind resource assessment.
Due to the difference in velocity distribution and similar average velocity the turbines will produce entirely different energy output. This shows that, along with the mean wind velocity over a period, the distribution of velocity within the regime is also an important parameter in the wind energy analysis. It is given by:
𝜎𝑣 = �∑ (𝑣𝑖−𝑣𝑚)2𝑛𝑖=1
𝑛 (2.3)
Lower values of σv indicate the uniformity of the site wind speed data.
2.3 FREQUENCY DISTRIBUTION
Frequency distribution is also another way of presenting wind speed. It provides important information on the range of specified wind velocity potential for a specific range of time.
For developing the frequency distribution, the wind speed domain is divided into equal intervals, say 0-1, 1-2, 2-3, etc., (Sathyajith M., 2006), and the number of times the wind record is within this intervals is counted.
As stated by (Sathyajith M., 2006), if the velocity is presented in the form of frequency distribution, the average velocity and standard deviation of the velocity can be calculated by the following equations:
𝑉𝑚 = �∑ 𝑓𝑖𝑉𝑖3𝑛
𝑖=1∑ 𝑓𝑖𝑛𝑖=1
�1/3
and 𝜎𝑣 = �∑ 𝑓𝑖(𝑉𝑖−𝑉𝑚)2𝑛𝑖=1
∑ 𝑓𝑖𝑛𝑖=1
(2.4)
where fi is the frequency and Vi is the mid value of the corresponding intervals.
2.4 STATISTICAL MODELS FOR WIND DATA ANALYSIS
Site wind resource potential as well as its estimated capacity to power generation can be done in different statistical models before the actual implementation of the project. To

Wind Resource Data Analysis: The Case of MYDERHU Project Site
12 Prepared by: Oumer Issa Advisors: Dr.-Ing. Abebayehu Assefa
implement a specific statistical model, it needs the availability of the time series measured data for specified height at the desired location. Using these data, the commonly accepted statistical models such as Rayleigh and Weibull are implemented for the wind data distribution analyses. These models are important tools to determine the resource probability density and cumulative frequency functions and subsequently to plot their respective graphs. These models can also be applied for the projection of measured data from one location to another desired site.
This kind of analysis strongly depends on the utilization of probability density function, f(V) and cumulative frequency function, F(V) of wind speed data.
As presented in (Manwell J.F., 2002), the probability of a wind speeds occurring between Va and Vb, is given by:
𝑓(𝑉) = 𝑓(𝑉𝑎 ≤ 𝑉 ≤ 𝑉𝑏) = ∫ 𝑓(𝑉).𝑑𝑉𝑉𝑏𝑉𝑎
(2.5)
And also, the total area under the probability distribution curve is given by:
∫ 𝑓(𝑉).𝑑𝑉∞𝑐 (2.6)
Once the value or relation for f(v) is known , it is possible to calculate for mean speed and standard deviation values as below:
𝑉� = ∫ 𝑉.𝑓(𝑉).𝑑𝑉∞𝑐 and 𝜎𝑣 = �∫ (𝑉 − 𝑉�)2𝑓(𝑉).𝑑𝑉∞
𝑐 (2.6)
The available mean wind power density,( 𝑃�
𝐴) can be determined from:
𝑃�
𝐴= 1
2𝑓 ∫ 𝑉3. 𝑓(𝑉).𝑑𝑉∞
𝑐 = 12𝑓𝑉�3 (2.7)
Where: 𝑉�3= Cubed of mean wind speed.
Same for above analysis, the cumulative distribution function F(V), can also computed using the following relations and it represents the time fraction or probability that the wind speed is smaller or equal to a given wind speed, V’.
F (V) = Probability (𝑉�3 < V), mathematically expressed as;
𝐹(𝑉) = ∫ 𝑓(𝑉).𝑑𝑉𝑉𝑐 (2.8)

Wind Resource Data Analysis: The Case of MYDERHU Project Site
13 Prepared by: Oumer Issa Advisors: Dr.-Ing. Abebayehu Assefa
Finally, the probability density function is equal to the slope of the cumulative distribution function:
𝑓(𝑉) = 𝑑𝐹(𝑉)𝑑𝑉
(2.9)
The commonly applicable models for analyzing the above probability density and cumulative distribution functions can be done by (1) Rayleigh and (2) Weibull. The Rayleigh distribution uses one parameter, the mean wind speed, whereas, the Weibull distribution is based on two parameters, thus, it can better represent a wider variety of wind regimes.
This paper is fully done by considering the Weibull distribution methods only. The basic approach for the model is demonstrated in the next section.
2.5 WEIBULL DISTRIBUTION METHODS
The probability density and cumulative distribution functions are modeled for the desired site wind speed analysis as presented in (Sathyajith M., 2006) below:
The probability density function (f(V)) indicates the fraction of time (or probability) for which the wind is at a given velocity V. It is given by:
𝑓(𝑉) = 𝑘𝑐�𝑉𝑐�𝑘−1
𝑒�−𝑉𝑐�𝑘
(2.10)
where k is the Weibull shape factor and c is scale factor.
The cumulative distribution function, F(V), of the velocity V gives the fraction of time (or probability) that the wind velocity is equal or lower than V. Thus the cumulative distribution F(V) is the integral of the probability density function. It is also given by:
𝐹(𝑉) = ∫ 𝑓(𝑉)𝑑𝑉 = 1 − 𝑒�−𝑉𝑐�𝑘
𝛼0 (2.11)
Average wind velocity (Vm) of the given data set, following the Weibull distribution, can be calculated from:
𝑉𝑚 = ∫ 𝑉𝑓(𝑉)𝑑𝑉∞0 (2.12)
Applying gamma function, the average velocity Vm, can be simplified as:
𝑉𝑚 = 𝑐Γ [1 + 1𝑘
] (2.13)

Wind Resource Data Analysis: The Case of MYDERHU Project Site
14 Prepared by: Oumer Issa Advisors: Dr.-Ing. Abebayehu Assefa
The standard deviation, (σv), of wind velocity following the Weibull distribution is given by:
𝜎𝑣 = 𝑐 �Γ �1 + 2𝑘� − Γ2(1 + 1
𝑘)�1/2
(2.14)
For analyzing a wind data set by the Weibull distribution methods, it needs to estimate the Weibull parameters k (shape factor) and c (scale factor). Determining these two parameters is not straight forward; there are different methods. The commonly practiced methods include:
1. Graphical method 2. Standard deviation method 3. Moment method 4. Maximum likelihood method and 5. Energy pattern factor method
In this paper, the standard deviation and energy pattern factor methods have been utilized for their acceptable accuracy range and ease of utilization.
i). Estimating c and k by standard deviation method
This is one way of estimating Weibull factors c and k from already calculated values of mean and standard deviation of wind data sets.
Factor k, can be determined by dividing standard deviation with average velocity from the relation:
�𝜎𝑣𝑉𝑚�2
= Γ(1+2𝑘)
Γ2(1+1𝑘)− 1 (2.15)
k can be easily determined from the values for σv and Vm which are calculated from the given wind speed data set.
Once k is determined by solving the above expression numerically, the scale factor c can be computed by rearranging the equation of Vm (Eq.2.13) as:
𝑐 = 𝑉𝑚Γ(1+1𝑘)
(2.16)
In a simpler approach, an acceptable approximation for k and c as presented by (Sathyajith M., 2006) refering from (Boweden G.J., 1983) and (Garcia A., 1998):
Wind Resource Data Analysis: The Case of MYDERHU Project Site
15 Prepared by: Oumer Issa Advisors: Dr.-Ing. Abebayehu Assefa
𝑘 = �𝜎𝑣𝑉𝑚�−1.090
and 𝑐 = 2𝑉𝑚√𝜋
(2.17)
However, a more accurate approximation value for c can be found using the expression as presented by (Sathyajith M., 2006) as refering from (Garcia A., 1998):
𝑐 = 𝑉𝑚𝑘2.6674
0.184+0.816𝑘2.73855 (2.18)
Since some literatures express the second relation as more accurate, it has been utilized in this paper.
ii). Estimating c and k by energy pattern factor method
Energy pattern factor (EPF) is the ratio between the total power available in the wind and the power corresponding to the cube of the mean wind speed, mathematically expressed as: (Sathyajith M., 2006)
𝐸𝑃𝐹 = 1𝑛∑ 𝑉𝑖
3𝑛𝑖=1
�1𝑛∑ 𝑉𝑖𝑛𝑖=1 �
3 (2.19)
Once the energy pattern factor for a regime is found from the wind data, an approximate solution for k and c can be determined as:
𝑘 = 3.957 𝐸𝑃𝐹−0.898 and 𝐶 = Vm0.89
(2.20)
2.6 EXTRAPOLATING AND NATURE OF WIND SPEED WITH HEIGHT
Due to the naturally available terrain effect or the presence of dense vegetations like forests, bushes, crops, buildings and other related structures will have a significant impact on the flow property of air over the ground as well as the design of the different structures of wind turbine. Theoretically, the velocity of wind right over the ground surface is assumed as zero, and then it is increased with height up to a certain elevation. Generally the rate of reduction on wind speed depends on site terrain type. It is commonly represented by the roughness class or roughness height (log law) and power law exponent. The choice from the above approaches depends on the interest of the users, however, for its simplicity of analysis researchers mostly preferred to use the second approach (Manwell J.F., 2002).
Wind shear or surface roughness factor (log law)
The calculation can be done by the following relation:

Wind Resource Data Analysis: The Case of MYDERHU Project Site
16 Prepared by: Oumer Issa Advisors: Dr.-Ing. Abebayehu Assefa
ln(Zo) = V(ZR)∗ln(Z)−V(Z)∗ln(ZR)𝑉(𝑍𝑅)−𝑉(𝑍)
(2.21.1)
𝑉(𝑍𝑅) =𝑉(𝑍) ln�𝑍𝑅𝑍𝑜�
ln� 𝑍𝑍𝑜� (2.21.2)
where:
o V (ZR) : velocity at heights ZR o V(Z) : velocity at heights Z o Z0 : Roughness factor
Once it is known for the site roughness height, it has the opportunity to extrapolate and determine the wind velocity using Eq.2.26.2 at any desired heights.
Exponent (power law)
Different researchers and wind energy experts uses different approach to determine power low factor ( ) such as using the parameters found from log law calculation and develop the methods for calculating is one approach, however, for reducing complexity calculations many researchers recommend to use available empirical formulas that have appropriate property of site wind speed data (Manwell J.F., 2002).
From those different kinds of approaches to estimate power law factor ( ), here below
some of the commonly applicable empirical formulas:
The basic formula is given as:
𝑈(𝑍)𝑈(𝑍𝑟) = � 𝑧
𝑍𝑟�𝛼
(2.22)
where:
U(Z) = wind speed at height Z,
U(Zr) = reference wind speed at height Zr and
α = power law exponent

Wind Resource Data Analysis: The Case of MYDERHU Project Site
17 Prepared by: Oumer Issa Advisors: Dr.-Ing. Abebayehu Assefa
Power law exponent as a function of velocity and height as proposed by Justus (1978) (Manwell J.F., 2002):
𝛼 = 0.37−0.088 ln(𝑉𝑟𝑒𝑓)
1−0.088 ln (𝑧𝑟𝑒𝑓10 )
(2.23)
where: U is given in m/s and Zref in m.
Power law exponent as a function of surface roughness as proposed by Counihan (1975) (Manwell J.F., 2002):
𝛼 = 0.096𝑙𝑜𝑔10𝑍𝑜 + 0.016(𝑙𝑜𝑔10𝑍𝑜)2 + 0.24 (2.24)
Valid for surface roughness values in the interval [0.001m < Zo < 10m],
Power law exponent as a function of surface roughness, reference height and the desired height level as expressed in (Det Norske Veritas and Risø National Laboratory, 2002):
𝛼 =𝑙𝑛�
ln� 𝑧𝑧𝑜
�
ln�𝐻𝑧𝑜��
ln�𝑧𝐻� (2.25)
where:
o Z0 (m) : Roughness parameter o H (m) : Reference height. o Z(m) : Height interested in
For this paper case it is preferred to use Eq.(2.2.1) to determine surface roughness factor and Eq.(3.21) for power law factor, and then presented the difference on the result of extrapolated wind speed to the height of turbine hub by utilizing both approach.
2.7 TURBULENCE INTENSITY
It is also important to understand the site turbulence intensity especially to predict the maximum load, structural excitation, fatigue issues, turbine control mechanisms and for the purpose of quality power output from turbines. It changes with the mean wind speed, surface roughness, atmospheric stability and topographic features. When selecting the sites for wind farm it is crucial to know the turbulence intensity of the location for purpose of power production stability as well as the life time of system accessories (Tong, 2010) (Manwell J.F., 2002).
Basically the turbulence intensity (IT) is defined as the ratio between the standard deviation ( u) of the wind speed, and the 10-minute mean wind speed (V10m), i.e.:

Wind Resource Data Analysis: The Case of MYDERHU Project Site
18 Prepared by: Oumer Issa Advisors: Dr.-Ing. Abebayehu Assefa
𝐼𝑇 = 𝜎𝑢𝑉10𝑚
(2.26.1)
If there is more than one turbine at the site, it needs to consider the wake effects for wind turbines installed behind other turbines with a distance of less than 20 rotor diameters. Here below is the basic approach to estimate the turbulence intensity as expressed in (Tong, 2010) for turbines separated with a distance of less than 20D:
𝐼𝑇,𝑡𝑜𝑡𝑎𝑙 = �(1 − 𝑁.𝑃𝑤)𝐼𝑇𝑚 + 𝑃𝑤 ∑ 𝐼𝑇,𝑤𝑚 𝑆𝑖𝑁
𝑖=1𝑚
𝑃𝑤 = 0.06 and 𝑆𝑖 = 𝑥𝑖𝐷
𝐼𝑇,𝑊 = � 1(1.5+0.3∗𝑆𝑖∗√𝑉)2
+ 𝐼𝑇2 (2.26.2)
Where:
o N = number of closest neighboring wind turbines o m = Wöhler curve exponent corresponding to the
material of the considered structural component o v( Vm) = free flow mean wind speed at hub height o pw = probability of wake condition o xi = distance to the i'th wind turbine o D = rotor diameter o IT = free flow turbulence intensity o IT,w = maximum turbulence intensity at hub height in the
centre of the wake
The value for parameter ‘N’ can be determined as follows:
o N = 1 ; 2 wind turbines o N = 2 ; 1 row o N = 5 ; 2 rows o N = 8 ; farm with more than 2 rows
For the case of wind farm having more than five rows and more than five turbines within a row, and/or for less than 3D of distance between the turbines in the rows that are located perpendicular to the predominant wind direction strongly needs to consider the increase in turbulence intensity. This increment can be done by substituting the free flow turbulence IT with IT
* as follows:
𝐼𝑇∗ = 12�𝐼𝑤2 + 𝐼𝑇2 + 𝐼𝑇

Wind Resource Data Analysis: The Case of MYDERHU Project Site
19 Prepared by: Oumer Issa Advisors: Dr.-Ing. Abebayehu Assefa
𝐼𝑤 = 0.361+0.08�𝑠𝑟𝑠𝑓𝑉
𝑠𝑟 = 𝑥𝑟𝐷
and 𝑠𝑓 = 𝑥𝑓𝐷
(2.26.3)
Where; xr is the distance within a row, and xf is the distance between rows.
The lowest values are measured over the open sea (5% and less) whereas the highest values (20% and more) occur over densely settled areas or forest areas. In the load assumptions for wind turbines, values of between 16 and 18% are assumed depending on wind turbine classes (Erich H., 2006).
2.8 WIND TURBINE SELECTION AS PER IEC STANDARDS
Since the wind speed is variable from poor wind speed (0 m/s) to strong wind speed such as hurricane, which implies the variable wind load to the wind turbine this may affect the turbine mode of operation or it may result for the total damage of the system. The typical damages arises due to high speed as referenced by (Det Norske Veritas and Risø National Laboratory,, 2002) is included under Appendix D.
Therefore, it has tried to follow the IEC standard for selecting the proposed wind farm appropriate wind turbine types.
According to IEC 61400-1, Rev-3 wind turbines are classified with respect to their ability to withstand the extreme wind speed at 50m hub height, mean wind speed and turbulence intensity. Summery as shown below at Table of IEC wind turbine class.
Table 2.1: IEC Wind turbine Classes (Erich H., 2006)
WT Class I II III IV S
Ve ref (m/s) 50 42.5 37.5 30
Values to be specified by the designer
Vm (m/s) 10 8.5 7.5 6.0
VG50 = 1.4Ve ref 70 59.5 52.5 42
VG1 = 1.05VG50 52.5 44.6 39.4 31.5
A I15 0.18 0.18 0.18 0.18
a 2 2 2 2
B I15 0.16 0.16 0.16 0.16
a 3 3 3 3

Wind Resource Data Analysis: The Case of MYDERHU Project Site
20 Prepared by: Oumer Issa Advisors: Dr.-Ing. Abebayehu Assefa
Since the available data for this paper was not more than one year, therefore, it is preferred to use the following correlations for determining the site 50-year guest (extreme) wind speed as expressed in (Erich H., 2006):
𝑉𝑒 𝐺50(ℎ) = 1.4𝑉𝑒 𝑟𝑒𝑓 � ℎℎℎ𝑢𝑏
�0.11
(2.27)
And for estimating the expected annual guest wind speed can be done same with the following relation:
𝑉𝑒𝐺1(ℎ) = 0.75𝑉𝑒𝐺50(ℎ) (2.28)
where:
- Vw : mean annual wind speed, - Ve ref : maximum (extreme reference) wind speed to be expected
as a mean value over 10 min, - VG50 : maximum (extreme wind) speed expected within 50 years - VG1 : maximum (extreme wind) speed expected within 1 year - I15 : characteristic turbulence intensity at a wind speed of 15 m/s
As the recommendation from IEC (1999) standard, ‘reference wind speed’ Vref can be estimated as five times the annual mean wind speed.
2.9 ESTIMATION OF ANNUAL ENERGY PRODUCTION (AEP)
In evaluating the wind resource potential of the prospective site determining the available as well as extractable power/energy density in addition to wind speed are important parameters. The wind energy density (ED) is the energy available in the regime for a unit rotor area and time.
When selecting the proposed wind farm wind turbines and estimating its power generation potential it needs to know and differentiate the most frequent wind velocity (VF-max) and the velocity contributing the maximum energy (VE-max) to the regime. Peak of the wind speed probability density curve represents VF-max where as can be read from the peak of energy probability density curve.
Due to the cubic relationship of velocity and power, the contribution of VE-max for power generation is usually higher than VF-max. Therefore, for selecting turbines, in addition to IEC classification, it was tried to found the turbine which has rated wind speed (Vd) as close as possible for the site VE-max value, selecting this kind of turbine will be advantageous to maximize farm power factor. Here below is some of the analytical estimation of power and energy densities.

Wind Resource Data Analysis: The Case of MYDERHU Project Site
21 Prepared by: Oumer Issa Advisors: Dr.-Ing. Abebayehu Assefa
a) The average wind power density, P/A, is the average available wind power per unit area and is given by:
𝑃𝐴
= 12𝜌 1𝑁∗ ∑ 𝑉𝑖3𝑁
𝑖=1 (2.29)
b) Similarly, the average wind energy density per unit area for a given time period NΔt is given by:
𝐸𝐴
= 12𝜌 ∑ 𝑉𝑖3𝑁
𝑖=1 = �𝑃𝐴� (𝑁∆𝑡) (2.30)
Using the following ideal gas relation tried to consider the impact of environment on the change of density and its consequence on energy density. Since the resource data has only reading for the site ambient temperatures, it was assumed the standard atmospheric conditions for values of pressure and specific gas constants.
𝜌 = 𝑃𝑅∗𝑇
(2.31)
where:
o ρ = Density (kg/m3) = to be calculated (Eq. 2.36) o P = Pressure (Pa) = 101325 Pa o R = Specific gas constant = 287 J/kg.K o T = Air temperature (K) = 10 min. interval
Capacity factor
Another important factor for evaluating the performance of prospective wind power farm is Capacity factor. It is defined as the ratio of the actual energy produced to that of the potential of energy that could have been produced by the system (rated energy). Mathematically given as:
𝐶𝐹 = 𝐸𝑇𝑇.𝑃𝑅
(2.32)
Where:
o T= Time duration o ET = Energy actually produced o PR=Rated power

Wind Resource Data Analysis: The Case of MYDERHU Project Site
22 Prepared by: Oumer Issa Advisors: Dr.-Ing. Abebayehu Assefa
2.10 LOSS ESTIMATION
As far as the mechanical systems are concerned there are some kinds of unavoidable causes for power losses such as bearings frictional losses, efficiency of gearbox, generator, loss on transmission power cables and other mechanical as well as electrical system accessories.
In addition to losses there are also issues related to uncertainties arising from some inconveniencies such as from wind measurement system accessories, statistical models for correlations and extrapolations, software or analysis tools input file accuracy problems for data sets, Orography, Roughness, turbine power curve preparation, selection and feeding etc. related may have a significant effect on the energy density estimation and needs to take considerations.
Besides the above uncertainty and loss issues from system accessories, there is also a considerable power demand with the farm auxiliary equipment, as per the total amount value it is also recommended to consider as a loss or operating cost.
For estimating actual power/energy generation, it has been considered the losses as a typical value as presented by (Erich H., 2006) from below figure. Such as:
a- Rotor efficency = 44.00% b- Bearing efficency = 99.60% c- Gearbox efficiency = 97.20% d- Generator eff. = 96.50% e- Efficiency of Frequency converter = 97.50% f- Reactive power compensation and harmonic filters = 98.30% g- Transformer and other transmission accessories = 98.00%
Therefore, the estimated total system efficiency would be 38.61%.
In addition to losses, there is a must to consider the auxiliary power consumptions for calculating the project/farm energy cost. Same with above, it was taken as 28% of the power will be utilized within the farm as presented by (Erich H., 2006).

Wind Resource Data Analysis: The Case of MYDERHU Project Site
23 Prepared by: Oumer Issa Advisors: Dr.-Ing. Abebayehu Assefa
Fig. 2-1: Energy flow through the mechanical-electrical energy conversion
chain at nominal operating point, (Erich H., 2006).

24 Prepared by: Oumer Issa Advisors: Dr.-Ing. Abebayehu Assefa
CHAPTER THREE
DATA VALIDATION AND SITE CLIMATOLOGY
3.1 DATA VALIDATION AND VERIFICATION
The value for wind shear (power exponent) is negative for about 2,552 data sets, this is to mean about 5.35% of the total data has wind speed for higher height (30m) measuring sensor has lower measurement than lower height (h=10m). This kind of situations are happening when the site wind speed is lower, as shown in Table 3.1, and also the time intervals are in between late night and early morning. The average of this total data is 2.37m/s for 30m height and it is 2.57m/s for 10m sensor, this shows that, the situation is happening when the site wind speed is lower. The general hypothesis is then going in two directions; the first might be the sensitivity difference of anemometers for lower wind speeds and the second it might be due to the site turbulence effect.
3.1.1 Negative wind shear values
Table 3.1 Typical negative wind shear values Date H:M Avg30 (m/s) Avg10 (m/s) Wind Shear exp.
18-1-11 7:21 0.72 0.84 -0.1369 19-1-11 3:01 0.54 0.78 -0.3444 25-1-11 2:51 0.43 0.59 -0.2718 25-1-11 3:01 0.03 0.23 -1.9009 25-1-11 3:11 0.19 0.66 -1.1507 25-1-11 4:11 0.22 0.50 -0.7372 25-1-11 4:31 1.49 1.75 -0.1464
Therefore, by considering the theoretical principle of wind speed relations with height, for this paper case, it is assumed the wind speeds at 30meter height are at least equal with that of 10meter height measurements, it means wind shear (power exponent) factor will not be less than zero. And those data values are adjusted.
There are also undefined values for some periods of wind shear (Power exponent) values, which is about 225 data sets, it represents 0.47% of the total data set, typical values as represented on Table-3.2; it is also the consequences of zero velocity reading for the 30m height sensor. This situation is also happen at the conditions of poor velocity periods. Same with the above theoretical reasoning and the insignificant impact on the total data sets due to their smaller value, it is also assumed as 30m reading has equal measurements with 10m height.

Wind Resource Data Analysis: The Case of MYDERHU Project Site
25 Prepared by: Oumer Issa Advisors: Dr.-Ing. Abebayehu Assefa
3.1.2 Undefined power exponent values
Table 3.2 Typical results for undefined power exponent values
Date H:M Avg30 Avg10 Wind Shear 18-1-11 5:21 0.00 0.30 #NUM!
1/2/2011 0:51 0.00 0.34 #NUM! 1/2/2011 2:21 0.00 0.82 #NUM! 1/2/2011 6:11 0.00 0.10 #NUM! 1/2/2011 6:41 0.00 0.05 #NUM!
3.1.3 Missing measured data values
The errors happened by this kind of problems are very small, it was accounted about 8 readings as represented in the next table.
Table 3.3 Missing data values date and time
SN Date Time
1 20-05-2011 14:21 2 20-05-2011 14:31 3 05-08-2011 12:22 4 05-08-2011 12:32 5 05-08-2011 12:42 6 05-08-2011 12:52 7 05-08-2011 13:02 8 23-10-2011 12:17
As it is seen from the above table for the times of the missed data periods as well as its time interval it looks as happened due to data downloading by removing memory stick from the data logger. Since they are small in number and happen for shorter time periods, it is filled by averaging of the prevailing and their next reading data sets.
Generally the errors or inconveniencies arise due the above situations incorporate about 5.82% of the total data sets. It is to mean that about 94.18% data are acceptable readings, therefore, in most literatures this kind of reading is considered as acceptable.
After preparing the data set with the above assumptions and working with wind shear (log law), there are about 400 (0.84%) data sets having the roughness values (Zo) greater than 5, all the periods are mostly in the intervals of mid night to the early morning measurements and also the wind speed is poor strength. This kind of problems are also happening when the wind resource are poor, however, this kinds of roughness values are less in number and their influence on the overall values of roughness factor is insignificant.

Wind Resource Data Analysis: The Case of MYDERHU Project Site
26 Prepared by: Oumer Issa Advisors: Dr.-Ing. Abebayehu Assefa
Generally, as it has seen from the above two ways of wind shear results, looks some problem on accuracy or sensitivity difference on the instruments when the wind speed strength is poor.
3.2 ROUGHNESS FACTOR AND POWER EXPONENT
By using equations 2.21 through 2.25, some of the values for the wind shear parameters are in the two extreme intervals starting from zero to the bigger results. The values of less than zero are considered as a measurement error and adjusted as per the above assumptions to zero, which are assuming equal reading measurements from both sensors. And the zero values are due to equal reading measurements from both measuring units where as the bigger values are arising due the very small readings from both instruments and the logarithmic property of small values. Sample data sets for higher power exponent and roughness factors as shown below Table 3.4.
Table 3.4 Representative data sets for higher values of power exponent and roughness factors
H:M Avg30 Avg10 Tur30 Tur10 Zo 5:11 0.24 0.05 1.8494 3.7917 1.4612 7.587438 5:01 0.17 0.05 2.3916 4.1489 1.1486 6.479734
23:51 0.23 0.01 1.7289 10.8333 3.2990 9.703495 8:01 0.14 0.02 2.5556 6.5000 1.9413 8.626790 2:11 0.21 0.01 1.9206 10.6667 3.2534 9.688061 1:21 0.02 0.00 6.5556 20.0000 2.0000 8.716855
Therefore, due to those inconveniencies it is difficult to expect a consistence values for those two types of wind shears such as log law and exponent laws. For this paper case, first plot the probability density curves for both factors and select the frequently available values to consider as the site wind shear value.

Wind Resource Data Analysis: The Case of MYDERHU Project Site
27 Prepared by: Oumer Issa Advisors: Dr.-Ing. Abebayehu Assefa
Fig. 3-1: Wind shears cumulative Weibull distribution curves
Reading from above plots for probability density and cumulative distribution curves for power law (exponent) and log law (surface roughness) factors with greater frequency of occurrences and considering the maximum value for the 90% of the data sets and concluded as below:
Power law coefficient ( ) = 0.15
Roughness length (Zo) = 0.025
Determining roughness class as per recommendation from (Eng. Ashour Abdelsalam, 2010) as below:
If Roughness Length <= 0.03
Class = 1.699823015 + ln (length)/ln(150)
If Roughness Length > 0.03
Class=3.91248929+ln(length)/ln(3.3333333)
Therefore, this project site roughness class could be calculated as:
Class = 1.699823015 + ln (length)/ln(150)
= 1.699823015 + ln (0.015)/ln(150) = 0.862

Wind Resource Data Analysis: The Case of MYDERHU Project Site
28 Prepared by: Oumer Issa Advisors: Dr.-Ing. Abebayehu Assefa
Using the above values and refereeing from tables under Appendix-C, by considering the roughness class as equal to one, it is to mean that the area is considered as open farmland with no crossing hedge and with scattered buildings. Open country without significant buildings and vegetation. Only small hills are available. This implies, it confirms with the site survey conditions.
3.3 TURBULENCE INTENSITY
By using Eq.2.26.1 for free turbulence intensity, formulas Eq.2.26.2 and Eq.2.26.3 for farm turbulence intensity analysis.
Here below is Weibull probability density and cumulative distributions for free turbulence intensity of both heights. And to estimate the site turbulence intensity it was considered the value for most frequent occurrences as well as the average of both heights as below:
For 10m measurement the most frequent turbulence intensity is about 0.1252 and its occurrence is 45%. The average is also 0.2300.
For 30m measurement the most frequent turbulence intensity is about 0.1351 and its occurrence is 64.06%. The average is also 0.1691.
And as specified in (Eng. Ashour Abdelsalam, 2010) for clasification of Turbulence intensity as below:
Low < 0.1
Medium 0.1 ~ 0.25
Large > 0.25
Therefore, Myderhu wind mast site is considered as moderate turbulence intensity site.
Here below figures are to show the turbulence intensities of both heights.

Wind Resource Data Analysis: The Case of MYDERHU Project Site
29 Prepared by: Oumer Issa Advisors: Dr.-Ing. Abebayehu Assefa
Fig. 3-2: Turbulence intensity probability density curves at both heights
Fig. 3-3: Turbulence intensity cumulative distribution curves at both heights

Wind Resource Data Analysis: The Case of MYDERHU Project Site
30 Prepared by: Oumer Issa Advisors: Dr.-Ing. Abebayehu Assefa
Fig. 3-4: Hourly average turbulence intensity for comparison purpose
Fig. 3-5: Hourly average turbulence intensity
From the above graphs, it is easy to understand that, even if the cumulative average of the hourly turbulence intensity is higher in the time intervals of 7:30 to 15:00 with turbulence intensities of 20% to 22%. However, there is higher instant turbulence intensities in the night times starting from 22:00 (10:00PM) to 6:00(6:00AM).

Wind Resource Data Analysis: The Case of MYDERHU Project Site
31 Prepared by: Oumer Issa Advisors: Dr.-Ing. Abebayehu Assefa
3.4 TEMPERATURE AND DENSITY DISTRIBUTION
The parameters for calculating power generation potential are rotor swept area, air density and wind speed. Hence, site air density is also estimated based on site ambient temperature and pressure. The available measurement is only for temperature at about 2.5 meters above ground. Since there is not measured data for the site atmospheric pressure, it was considered the value for the standard condition as 101325 Pa for pressure and 287 J/kg.K for specific gas constant, and by utilizing the ideal gas law of Eq.2.31 to determine the 10min interval air density values. This is important to estimate more accurate values of site available potentials of power and energy densities.
Fig. 3-6: Impact of temperature difference on air density
The site annual average ambient temperature is 13.47oC and density is 1.232 kg/m3.

32 Prepared by: Oumer Issa Advisors: Dr.-Ing. Abebayehu Assefa
CHAPTER FOUR
ANALYSIS FOR SITE WIND RESOURCE POTENTIAL
This chapter covers the wind analysis results for measured and Weibull distribution of the wind mast site. It is used Microsoft excel spreadsheet, MatLab and WaSP-10 for the analysis and presentation site wind power and energy density. It is also done the turbine selection as per IEC standard and tried to estimate annual energy production (AEP), capacity factor and unit energy cost with selected turbine types.
4.1 MEASURED AND WEIBULL DISTRIBUTION FOR WIND SPEED
The wind speed plot for the actual measured data presented under Fig.4.1, it shows the probability density of the measured wind speed plot for the wind mast site. It also presents the comparisons of the natures of the wind speeds at 30m and 10m heights of wind measuring sensors.
Fig. 4-1: Measured wind speed
Fig. 4-2: Weibull probability density curves for both heights (10 minutes average)

Wind Resource Data Analysis: The Case of MYDERHU Project Site
33 Prepared by: Oumer Issa Advisors: Dr.-Ing. Abebayehu Assefa
Fig.4.1 shows raw measured data and Fig.4.2 the synthesized Weibull probability density. The most frequent occurrence for 30m height is 6.8m/s with 13.15% occurrence, and for 10 m height it is 6.24m/s with 14.03%.
Fig. 4-3: Weibull cumulative distribution curves for both heights (10 minutes average)
From this cumulative distribution plot, it is understood that:
• 90% of the speeds are below 11m/s, 82.5% are below 10m/s and 50% are above 7.1m/s for 30m sensor,
• 90% of the speeds are below 10.3m/s, 88.2% are below 10m/s and 50% are above 6.52m/s for 10m sensor,
• The maximum speed is 16.8m/s with 0.1% occurrence for 30m and 15.78m/s with 0.1% occurrence for 10m and
• The mean speed at 30m height is 6.2m/s and it is 5.7m/s at 10m height.
Fig. 4.4 to Fig.4.12 show the different wind strengths based on hours of a day, days of a year and also months of a year.

Wind Resource Data Analysis: The Case of MYDERHU Project Site
34 Prepared by: Oumer Issa Advisors: Dr.-Ing. Abebayehu Assefa
Fig. 4-4: Hourly average velocity distribution curves (for both heights)
Fig. 4-5: Hourly average wind speed (10m height)

Wind Resource Data Analysis: The Case of MYDERHU Project Site
35 Prepared by: Oumer Issa Advisors: Dr.-Ing. Abebayehu Assefa
Fig. 4-6: Wind speed hourly average (30m height)
Fig. 4-7: Difference of annual daily average wind speeds (both heights)
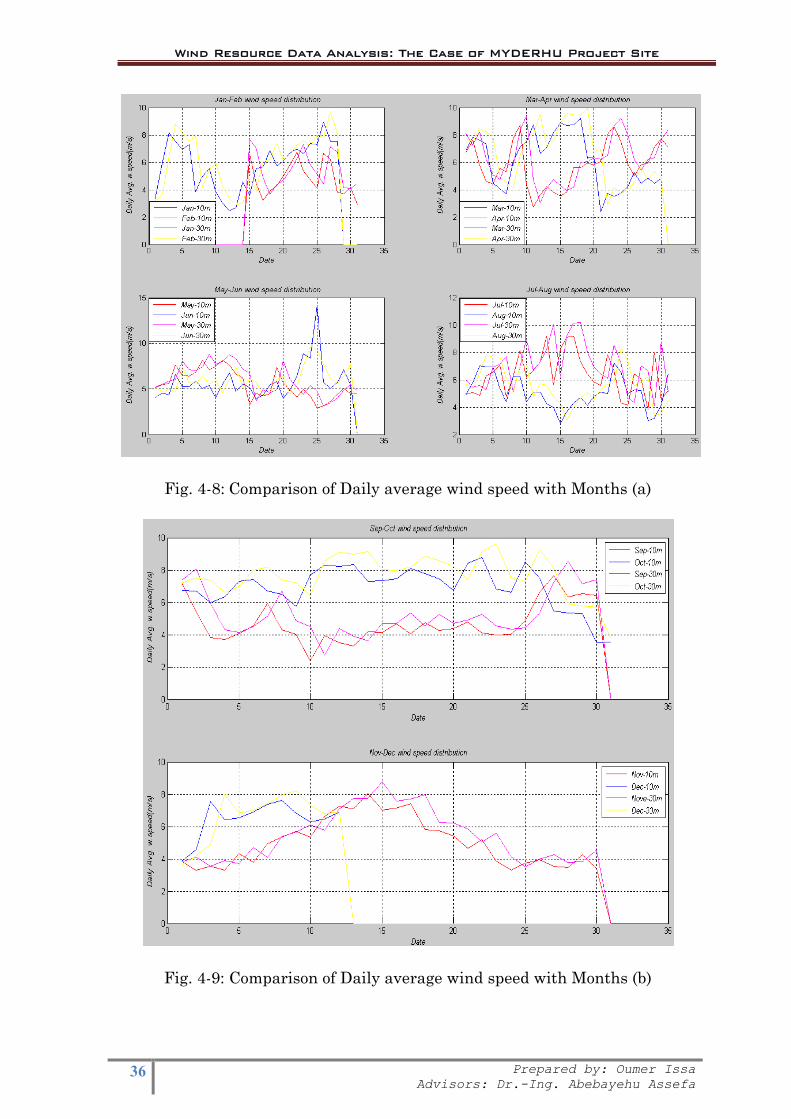
Wind Resource Data Analysis: The Case of MYDERHU Project Site
36 Prepared by: Oumer Issa Advisors: Dr.-Ing. Abebayehu Assefa
Fig. 4-8: Comparison of Daily average wind speed with Months (a)
Fig. 4-9: Comparison of Daily average wind speed with Months (b)
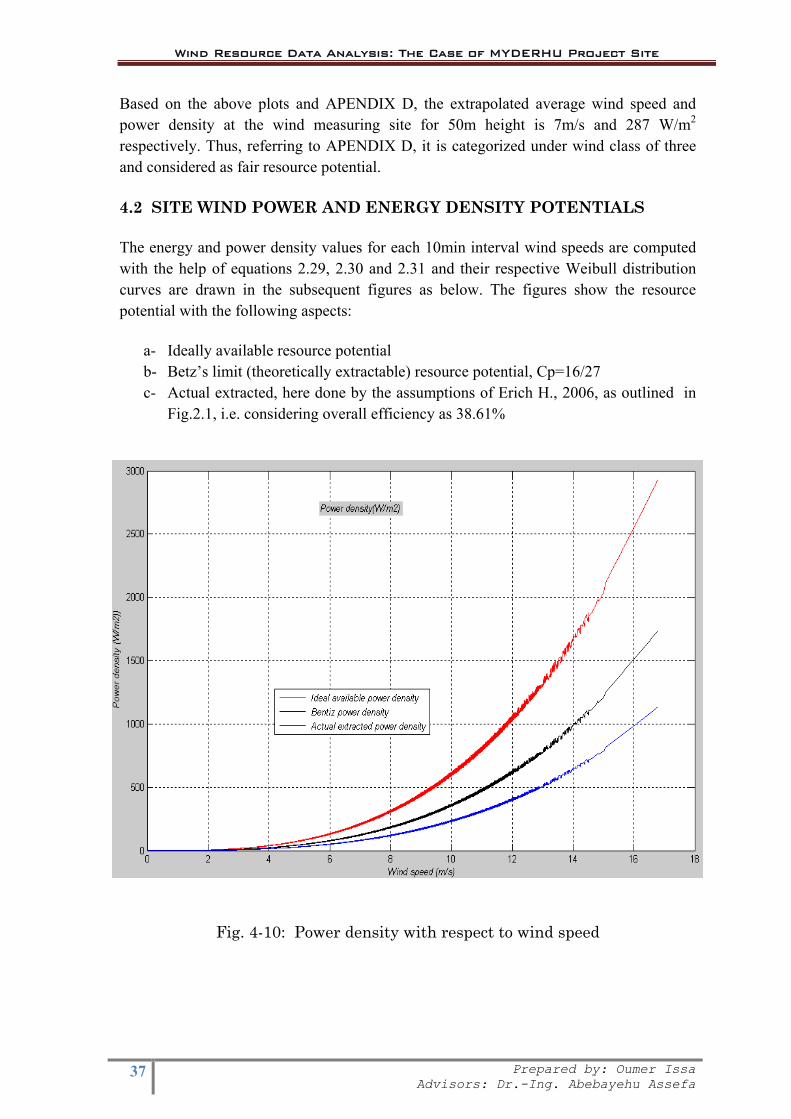
Wind Resource Data Analysis: The Case of MYDERHU Project Site
37 Prepared by: Oumer Issa Advisors: Dr.-Ing. Abebayehu Assefa
Based on the above plots and APENDIX D, the extrapolated average wind speed and power density at the wind measuring site for 50m height is 7m/s and 287 W/m2 respectively. Thus, referring to APENDIX D, it is categorized under wind class of three and considered as fair resource potential.
4.2 SITE WIND POWER AND ENERGY DENSITY POTENTIALS
The energy and power density values for each 10min interval wind speeds are computed with the help of equations 2.29, 2.30 and 2.31 and their respective Weibull distribution curves are drawn in the subsequent figures as below. The figures show the resource potential with the following aspects:
a- Ideally available resource potential b- Betz’s limit (theoretically extractable) resource potential, Cp=16/27 c- Actual extracted, here done by the assumptions of Erich H., 2006, as outlined in
Fig.2.1, i.e. considering overall efficiency as 38.61%
Fig. 4-10: Power density with respect to wind speed

Wind Resource Data Analysis: The Case of MYDERHU Project Site
38 Prepared by: Oumer Issa Advisors: Dr.-Ing. Abebayehu Assefa
Fig. 4-11: Weibull Power probability density
Fig. 4-12: Weibull Power cumulative distribution
Refereeing to the above power density and cumulative distributions graphs, the site annual average power density at 30m tower height is about:
Ideally available power density = 230 W/m2 Bentz limit power density = 136 W/m2 ,and Actually extracted (considering 38.61% system eff.) = 89 W/m2

Wind Resource Data Analysis: The Case of MYDERHU Project Site
39 Prepared by: Oumer Issa Advisors: Dr.-Ing. Abebayehu Assefa
- And referring to the cumulative graph, 50% of the resource has the capacity to generate 145.6 W/m2.
4.3 SITE ENERGY DENSITY AND CUMMULATIVE PLOTS
The site energy density and cumulative distribution plots have been done by utilizing the available 10min average wind speeds of wind mast site, and the computation was done by the theoretical principles of equations 2.29, 2.30 and 2.31. Therefore, Fig. 4.13 and 4.14 are the presentations of the analysis results for the energy density and cumulative distribution plots. The figures show the resource potential with the following aspects:
a- Ideally available wind energy resource potential b- Betz’s limit (theoretically extractable) wind energy resource potential, that is to
mean Cp=16/27 c- Actual extractable wind energy resource potential, here it is done by the
assumptions of Erich H., 2006, as outlined in fig.3.1, i.e. considering overall turbine efficiency as 38.61%
Fig. 4-13: Weibull Energy curves with respect to wind speed

Wind Resource Data Analysis: The Case of MYDERHU Project Site
40 Prepared by: Oumer Issa Advisors: Dr.-Ing. Abebayehu Assefa
Fig. 4-14: Weibull Energy cumulative distribution curves
4.4 SITE WIND BLOW DIRECTION AND ITS DENSITY
Wind rose, it is a tool or system of determination of the direction of site wind blow. Plotting this wind rose helps the researchers or engineers to know the number of data sets to each of sectors, for this case, there is 12 sector ( it is divided with 30 degree intervals). This kind of plot to determine:
- The number of data sets to each intervals of direction (sectors), - It also helps to roughly check the impacts of the site possible obstacles due to
mountains, buildings etc., - The comparisons of wind speed values within each sector, it isn’t presented here.
Fig. 4.15 shows that the majority of the wind direction is concentrated around the east (E) and north-east (NE) directions, such as, about 21,000 data sets are blown from the eastern
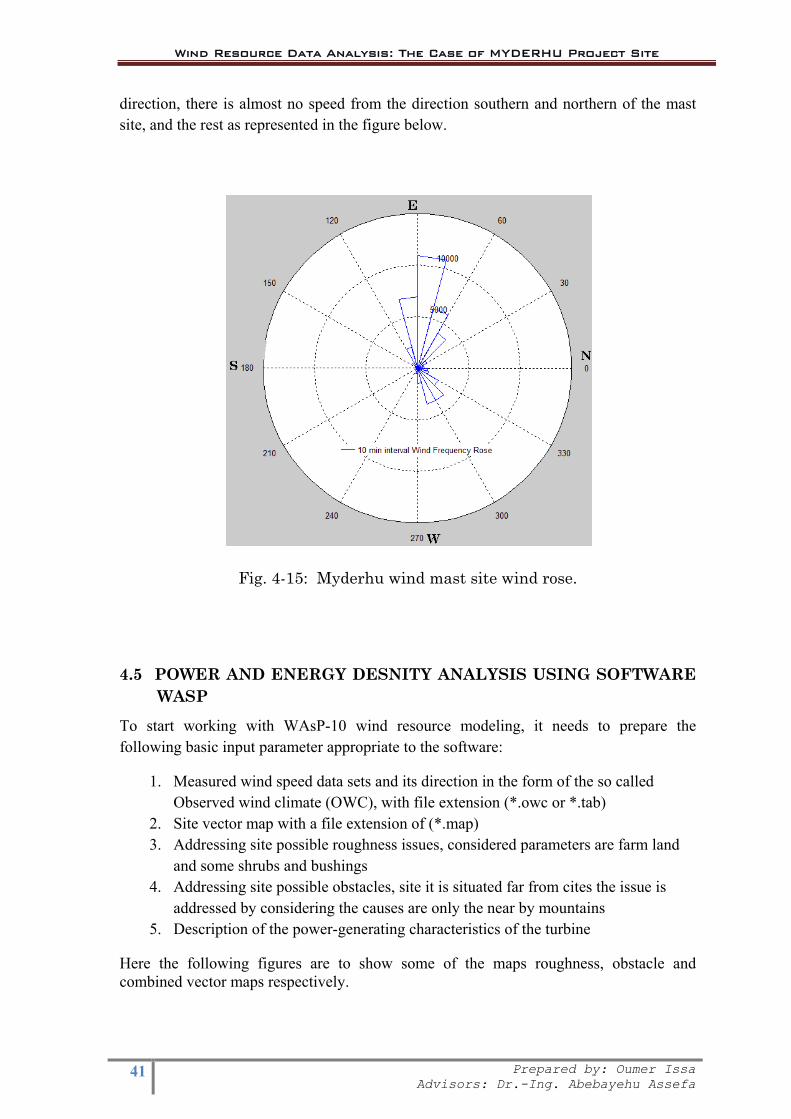
Wind Resource Data Analysis: The Case of MYDERHU Project Site
41 Prepared by: Oumer Issa Advisors: Dr.-Ing. Abebayehu Assefa
direction, there is almost no speed from the direction southern and northern of the mast site, and the rest as represented in the figure below.
Fig. 4-15: Myderhu wind mast site wind rose.
4.5 POWER AND ENERGY DESNITY ANALYSIS USING SOFTWARE WASP
To start working with WAsP-10 wind resource modeling, it needs to prepare the following basic input parameter appropriate to the software:
1. Measured wind speed data sets and its direction in the form of the so called Observed wind climate (OWC), with file extension (*.owc or *.tab)
2. Site vector map with a file extension of (*.map) 3. Addressing site possible roughness issues, considered parameters are farm land
and some shrubs and bushings 4. Addressing site possible obstacles, site it is situated far from cites the issue is
addressed by considering the causes are only the near by mountains 5. Description of the power-generating characteristics of the turbine
Here the following figures are to show some of the maps roughness, obstacle and combined vector maps respectively.

Wind Resource Data Analysis: The Case of MYDERHU Project Site
42 Prepared by: Oumer Issa Advisors: Dr.-Ing. Abebayehu Assefa
Fig. 4-16: Site roughness estimations
(a): to the north east direction (b): to the south west direction
Fig. 4-17: Mountains considered as an obstacles for the current wind mast as well as future wind farm (GE©)

Wind Resource Data Analysis: The Case of MYDERHU Project Site
43 Prepared by: Oumer Issa Advisors: Dr.-Ing. Abebayehu Assefa
Fig. 4-18: Obstacle groups, considering the two big mountains around the site as an obstacle
Note: The effect of nearby obstacle extends vertically to approximately three times the height of the obstacle, and downstream to 30 to 40 times the height. (WAsP v.10 help documentation).
Fig. 4-19: Vector map consisting of topographic terrain, roughness and obstacle groups

Wind Resource Data Analysis: The Case of MYDERHU Project Site
44 Prepared by: Oumer Issa Advisors: Dr.-Ing. Abebayehu Assefa
Therefore, the site summarized wind resource as predicted by WAsP presented as below:
Table 4.1: 30m-Wind atlas summery statistics
Fig. 4-20: Observed wind frequency (left) and Power density (right)
Fig. 4-21: Typical demonstration for obstacle effects for the turbine located at current wind mast site
Table 4.2: Typical site effect demonstration for turbine installed at current wind mast site (Turbine-001 at wind farm)
where: Ch : Change ref : Reference roughness sp [%] : Percentage of Speed change tu[o] : Degree of direction turned RIX : Ruggedness index

Wind Resource Data Analysis: The Case of MYDERHU Project Site
45 Prepared by: Oumer Issa Advisors: Dr.-Ing. Abebayehu Assefa
Sector Roughness Obst. Orography
# ang.[°] Ch ref.[m] sp[%] sp[%] sp[%] tu[°] RIX
1 0 0 0.041 0.00 0.00 -0.18 -6.2 13.6
2 15 0 0.040 0.00 0.00 -4.65 -2.4 13.1
3 30 0 0.040 0.00 0.00 -4.68 2.3 0.5
4 45 0 0.040 0.00 0.00 -0.26 6.2 0.0
5 60 0 0.044 0.00 0.00 7.02 7.9 0.0
6 75 0 0.044 0.00 0.00 14.86 7.4 0.6
7 90 0 0.042 0.00 0.00 21.22 5.1 2.7
8 105 0 0.040 0.00 0.00 24.72 1.8 3.7
9 120 0 0.041 0.00 0.00 24.79 -1.8 1.9
10 135 0 0.041 0.00 0.00 21.28 -5.1 3.6
11 150 0 0.041 0.00 0.00 14.91 -7.4 4.7
12 165 0 0.040 0.00 0.00 7.09 -7.9 0.0
13 180 0 0.040 0.00 0.00 -0.19 -6.2 0.7
14 195 0 0.040 0.00 0.00 -4.65 -2.4 4.6
15 210 0 0.040 0.00 0.00 -4.68 2.3 1.7
16 225 0 0.040 0.00 0.00 -0.26 6.2 2.6
17 240 0 0.021 0.00 0.00 6.87 7.7 0.0
18 255 0 0.040 0.00 0.00 14.81 7.4 0.0
19 270 0 0.041 0.00 0.00 21.21 5.1 0.0
20 285 0 0.041 0.00 0.00 24.75 1.8 0.0
21 300 0 0.041 0.00 0.00 24.77 -1.8 0.0
22 315 2 0.038 0.35 0.00 21.21 -5.1 0.7
23 330 0 0.042 0.00 0.00 14.93 -7.4 1.2
24 345 0 0.041 0.00 0.00 7.10 -7.9 3.5

Wind Resource Data Analysis: The Case of MYDERHU Project Site
46 Prepared by: Oumer Issa Advisors: Dr.-Ing. Abebayehu Assefa
4.6 WIND TURBINE SELECTION AS PER IEC STANDARD
The wind turbine is selected under the consideration of the following parameters resulted from the project site data analysis:
a- Annual mean wind speed b- Wind speed for maximum occurrence energy generation c- Maximum frequently occurred wind speed d- Cut-in and cut-out wind speed e- Annual guest wind speed f- Annual mean turbulence g- And finally selecting hub height from the available turbine catalogues.
By eq. 2.27 and 2.28, the site extreme wind speed values are estimated in below table.
Table 4.3: One year and fifty year estimated extreme wind speeds
Parameters H30(m) H50(m) H80(m) H100(m)
Height(m) 30 50 80 100
Vmean (m/s) 6.48 6.94 7.56 7.84
Ve ref(@30)(m/s)
32.4 34.7 37.8 39.2
VeG50 (m/s) 45.36 48.58 52.92 54.88
VeG1(h) (m/s) 34.02 36.44 39.69 41.16
P/Amean (w/m2)
246 287 360 397
Therefore the site wind class can be classified by using the values for mean speed and power density and then referring Appendix-D, it is considered as class-III.
By using Table-2.1 for the selection IEC wind turbine class in consideration of the site mean, reference, and extreme wind speeds read from the above table. The recommended IEC wind turbine class could be class-III for 30m and 50m heights and class-II for 80m and 100m hub heights.
Besides the wind class it is also important to give attention for wind resource frequently occurred wind speeds. The project site appropriate cut-in, rated and cut-out wind speeds should be 3m/s, 10 to 12m/s, and 25m/s respectively and the available documentations of turbines from WAsP is not appropriate especially the rated speeds for the majority of the

Wind Resource Data Analysis: The Case of MYDERHU Project Site
47 Prepared by: Oumer Issa Advisors: Dr.-Ing. Abebayehu Assefa
turbines are above 15m/s, this leads a lower capacity factor. Therefore, the turbine selections are done from other source with the following models and rated capacities:
Table 4.4: Selected turbine models and their main parameters Manufacturer and Turbine
Model
Rotor diameter
(m)
Hub height
(m)
Cut-in speed (m/s)
Rated Speed (m/s)
Cut-out speed (m/s)
Rated power (kw)
IEC wind class
IEC turbine class
ENERCON: E33
33 30 3 12.5 28 330 III IEC/NVN III A
ENERCON: E53
53 60 2 12.5 28 800 III IEC/NVN Class S
(with vav = 7.5 m/s, vext = 57 m/s)
ENERCON: E82
82 80 2 12.5 28 2000 II IEC/NVN IIA
ENERCON: E101
101 100 2 12 28 3000 II IEC/NVN IIA
Here below the following figures are to show the selected wind turbines performance curves:
Fig. 4-22: E33 wind turbine performance curves

Wind Resource Data Analysis: The Case of MYDERHU Project Site
48 Prepared by: Oumer Issa Advisors: Dr.-Ing. Abebayehu Assefa
Fig. 4-23: E53 wind turbine performance curves
Fig. 4-24: E82 wind turbine performance curves
Fig. 4-25: E101 wind turbine performance curves

Wind Resource Data Analysis: The Case of MYDERHU Project Site
49 Prepared by: Oumer Issa Advisors: Dr.-Ing. Abebayehu Assefa
4.7 ESTIMATED ANNUAL ENERGY PRODUCTION (AEP), CAPACITY FACTOR AND UNIT ENERGY COST WITH SELECTED TURBINE TYPES
The mast site predicted Weibull wind speed distribution (wind atlas) at each selected turbine hub height (30m, 50m, 80m and 100m) are presented below:
Table 4.5: Summary of predicted wind climate for different turbine hub heights at Myderhu wind data measuring site
Hub height
Mean wind speed (m/s)
Mean power density (W/m²)
Wind speed at Max. power density (m/s)
Max. power density
(W/m²)/(m/s)
Net AEP [GWh]
30 6.48 246 8.87 41 0.858 50 6.94 287 9.21 49 2.485 80 7.56 360 9.84 60 7.277 100 7.84 397 10.13 66 11.792
Fig. 4-26: Weibull distribution for Observed Wind Climate (30m)
Fig.4-27: 30m turbine height wind speed distribution (30m wind atlas)

Wind Resource Data Analysis: The Case of MYDERHU Project Site
50 Prepared by: Oumer Issa Advisors: Dr.-Ing. Abebayehu Assefa
Fig. 4-28: 50m turbine height wind speed distribution (50m wind atlas)
Fig. 4-29: 80m turbine height wind speed distribution (80m wind atlas)
Fig. 4-30: 100m turbine height wind speed distribution (100m wind atlas)

Wind Resource Data Analysis: The Case of MYDERHU Project Site
51 Prepared by: Oumer Issa Advisors: Dr.-Ing. Abebayehu Assefa
In addition to site wind climate curves, it is also important to know the site potential of annual energy generation with the help of different turbines. Here the following figures are the AEP plots of ENERCON E33, E53, E82 and E101 respectively installed at Myderhu wind mast site.
Fig. 4-31: E33 turbine AEP (at Myderhu wind mast site)
Fig. 4-32: E53 turbine AEP (at Myderhu wind mast site)

Wind Resource Data Analysis: The Case of MYDERHU Project Site
52 Prepared by: Oumer Issa Advisors: Dr.-Ing. Abebayehu Assefa
Fig. 4-33: E82 turbine AEP (at Myderhu wind mast site)
Fig. 4-34: E101 turbine AEP (at Myderhu wind mast site)
Preliminary estimate of energy cost, capacity factor (CF) and turbines comparison:
Considering the investment cost of Ashegoda wind farm as a reference for investment cost/kW installed, i.e., the total investment cost is about 210 million euro (Source: Contractor’s leaflet and friends working there) for installation of 120 MW wind farm having 120 turbines with rated capacity of 1 MW each. It is simply assumed to the higher side as 2000 Euro per kW, and the following assumptions are considered:
a- Plant life time : 15 years b- Estimation is by using simple interest methods c- Annual Operating cost is 4% of the total depreciation cost per year

Wind Resource Data Analysis: The Case of MYDERHU Project Site
53 Prepared by: Oumer Issa Advisors: Dr.-Ing. Abebayehu Assefa
d- Considering Ashegoda investment cost as a benchmarking, and assuming the investment cost increased by 15% for smaller turbines (like E33), same for E53, and reduced by 20% and 35% for larger turbines E82 and E101 respectively
e- Currency exchange rate from euro to birr is equal to 24.00
Table 4.6: Summarized AEP, Capacity factor and unit energy cost
Turbine Net AEP (GWhr)
Rated power (kW)
Rated AEP
(GWhr)
CF (%)
Estimated investment and operation cost
(Euro)
Estimated investment and operation cost
(ETB)
Estimated cost of energy
(Euro/kWhr)
Estimated cost of energy
(birr/kWhr)
E33 0.858 330 2.8908 29.68 € 52,624.00 1,262,976.00 € 0.06 1.47
E53 2.485 800 7.008 35.46 € 110,933.33 2,662,400.00 € 0.04 1.07
E82 7.277 2000 17.52 41.54 € 221,866.67 5,324,800.00 € 0.03 0.73
E101 11.792 3000 26.28 44.87 € 270,400.00 6,489,600.00 € 0.02 0.55
Therefore, if there is no limitation for the system accessories transportation and installation it is more recommended investing in larger scale turbines for the sake of reduced energy cost. However, for simplicity of manufacturing, transportation and installation the interest is inclined to the smaller scales with significant increase of energy cost that needs extended period of operations for investment payback.

54 Prepared by: Oumer Issa Advisors: Dr.-Ing. Abebayehu Assefa
CHAPTER FIVE
SITE WIND MAP (RESOURCE GRID) PREPARATION USING WASP SOFTWARE
This chapter starts with the determination of reference conditions and presentation for the analysis result of the site wind climate summary. Wind resource map is the map done for the wind speed, power density or energy density of the site considering a specified hub height. For this paper case, it is attempted to analyzed and presented wind resource maps by considering hub heights of 30m, 50m, 80m and 100m. It is presented wind resource maps for mean speed, power density and density of annual energy generation separately for each of the considered hub heights.
5.1 REFERENCE CONDITIONS
The analysis and prediction of the regional wind climate have been done by considering 5 reference roughness lengths (0.000 m, 0.030 m, 0.090 m, 0.400 m, 1.000 m) and 5 reference heights (10 m, 30 m, 50 m, 80 m, 100 m) above ground level.
5.2 SITE WIND CLIMATE SUMMARY
Table 5.1: Project Site wind climate summary (regional wind climate)
Height Parameter 0.00 m 0.03 m 0.09 m 0.40 m 1.00 m
10 m Weibull A [m/s]
Weibull k
Mean speed [m/s]
Power density [W/m²]
7.0
2.92
6.22
210
5.0
2.58
4.42
82
4.4
2.57
3.89
56
3.4
2.55
2.99
25
2.6
2.54
2.32
12
30 m Weibull A [m/s]
Weibull k
Mean speed [m/s]
Power density [W/m²]
7.8
3.03
6.94
286
6.2
2.83
5.49
147
5.6
2.79
4.98
111
4.7
2.74
4.14
64
4.0
2.71
3.52
40
50 m Weibull A [m/s]
Weibull k
Mean speed [m/s]
Power density [W/m²]
8.2
3.08
7.33
333
6.8
3.07
6.12
194
6.3
3.00
5.60
151
5.3
2.92
4.76
94
4.7
2.87
4.15
63

Wind Resource Data Analysis: The Case of MYDERHU Project Site
55 Prepared by: Oumer Issa Advisors: Dr.-Ing. Abebayehu Assefa
80 m Weibull A [m/s]
Weibull k
Mean speed [m/s]
Power density [W/m²]
8.7
3.03
7.73
395
7.6
3.29
6.83
261
7.0
3.29
6.28
203
6.0
3.17
5.41
132
5.4
3.09
4.80
93
100 m Weibull A [m/s]
Weibull k
Mean speed [m/s]
Power density [W/m²]
8.9
3.00
7.94
431
8.1
3.26
7.24
312
7.4
3.26
6.65
243
6.4
3.26
5.76
158
5.7
3.23
5.13
112
5.3 WIND RESOURCE MAPING FOR 30M TURBINE HUB HEIGHT
This analysis is done by considering the possibilities of 30m, 50m, 80m and 100m turbine hub heights. The presentations for all heights are:
1- Grid setup 2- Results
a. Mean speed (m/s) b. Power density (w/m2) c. Annual energy production (AEP) (GWhr/year)
5.3.1 Grid Setup
Structure: 397 columns and 395 rows at 25 resolutions give 156815 calculation sites.
Boundary: (538062.5, 1464588) to (547987.5, 1474462.5)
Nodes: (538075, 1464600) to (547975, 1474450)
Height a.g.l.: 30m
5.3.2 WAsP analysis Results
5.3.2.1 Mean Speed [m/s]
Here below to show the wind speed resource map at 30m hub height, the first figure with contour lines and the second is without contour lines.

Wind Resource Data Analysis: The Case of MYDERHU Project Site
56 Prepared by: Oumer Issa Advisors: Dr.-Ing. Abebayehu Assefa
Fig. 5-1: Wind speed Resource Map at 30m wind turbine heights
Maximum Value: 9.32 m/s at (539625, 1467700)
Minimum Value: 3.43 m/s at (540725, 1471850)
Mean Value: 5.52 m/s
5.3.2.2 Power Density [w/m²]
Similar to the wind speed resource map here below is the analysis result for the site power density at 30m hub height, the first figure with contour lines and the second is without contour lines.
Fig. 5-2: Power density Map at 30m wind turbine hub heights
Maximum Value: 736 W/m² at (539625, 1467700) Minimum Value: 42 W/m² at (547350, 1474375)
Mean Value: 162 W/m²

Wind Resource Data Analysis: The Case of MYDERHU Project Site
57 Prepared by: Oumer Issa Advisors: Dr.-Ing. Abebayehu Assefa
5.3.2.3 AEP [GWh]
Similar to the wind speed and power density resource maps here below is the analysis result for the site Annual energy production at 100m hub height.
Fig. 5-3: Annual energy production at 30m wind turbine hub heights
5.4 WIND RESOURCE MAPING FOR 50M TURBINE HUB HEIGHT
5.4.1 Grid Setup
Structure: 393 columns and 395 rows at 25 resolutions give 155235 calculation sites.
Boundary: (538117.5, 1464621) to (547942.5, 1474495.5)
Nodes: (538130, 1464633) to (547930, 1474483)
Height a.g.l.: 50m
5.4.2 WAsP analysis Results
5.4.2.1 Mean Speed [m/s]
Here below is to show the wind speed resource map at 50m hub height, the first figure with contour lines and the second is without contour lines.
Maximum Value: 1.711 GWh at (544775, 1473175)
Minimum Value: 0.136 GWh at (547350, 1474375)
Mean Value: 0.563 GWh

Wind Resource Data Analysis: The Case of MYDERHU Project Site
58 Prepared by: Oumer Issa Advisors: Dr.-Ing. Abebayehu Assefa
Fig. 5-4: Wind speed Resource Map at 50m wind turbine heights
Maximum Value: 9.47 m/s at (539630, 1467708)
Minimum Value: 4.31 m/s at (540655, 1472058)
Mean Value: 6.11 m/s
5.4.2.2 Power Density [w/m²]
Similar to the wind speed resource map here below is the analysis result for the site power density at 50m hub height, the first figure with contour lines and the second is without contour lines.
Fig. 5-5: Power density Map at 50m wind turbine hub heights

Wind Resource Data Analysis: The Case of MYDERHU Project Site
59 Prepared by: Oumer Issa Advisors: Dr.-Ing. Abebayehu Assefa
Maximum Value: 734 W/m² at (539630, 1467708)
Minimum Value: 76 W/m² at (547330, 1474383)
Mean Value: 205 W/m²
5.4.2.3 AEP [GWh]
Similar to the wind speed and power density resource maps here below is the analysis result for the site Annual energy production at 50m hub height.
Fig. 5-6: Annual energy production at 50m wind turbine hub height
Maximum Value: 4.363 GWh at (539605, 1467708)
Minimum Value: 0.695 GWh at (547330, 1474383)
Mean Value: 1.798 GWh
5.5 WIND RESOURCE MAPING FOR 80M TURBINE HUB HEIGHT
5.5.1 Grid Setup

Wind Resource Data Analysis: The Case of MYDERHU Project Site
60 Prepared by: Oumer Issa Advisors: Dr.-Ing. Abebayehu Assefa
Structure: 397 columns and 395 rows at 25 resolutions gives 156815 calculation sites.
Boundary: (538062.5, 1464588) to (547987.5, 1474462.5)
Nodes: (538075, 1464600) to (547975, 1474450)
Height a.g.l.: 80m
5.5.2 WAsP analysis Results
5.5.2.1 Mean Speed [m/s]
Here below is to show the results for wind speed resource map at 80m hub height, the first figure with contour lines and the second is without contour lines.
Fig. 5-7: Wind speed Resource Map at 80m wind turbine hub heights
Maximum Value: 9.88 m/s at (539600, 1467725)
Minimum Value: 5.36 m/s at (540650, 1472075)
Mean Value: 6.85 m/s
5.5.2.1 Power Density [w/m²]
Similar to the wind speed resource map here below is the analysis result for the site power density at 80m hub height, the first figure with contour lines and the second is without contour lines.

Wind Resource Data Analysis: The Case of MYDERHU Project Site
61 Prepared by: Oumer Issa Advisors: Dr.-Ing. Abebayehu Assefa
Fig. 5-8: Power density Map at 80m wind turbine hub heights
Maximum Value: 811 W/m² at (539600, 1467725)
Minimum Value: 132 W/m² at (547350, 1474375)
Mean Value: 277 W/m²
5.5.2.2 AEP [GWh]
Similar to the wind speed and power density resource maps here below is the analysis result for the site Annual energy production at 80m hub height.
Fig. 5-9: Annual energy production at 80m wind turbine hub heights
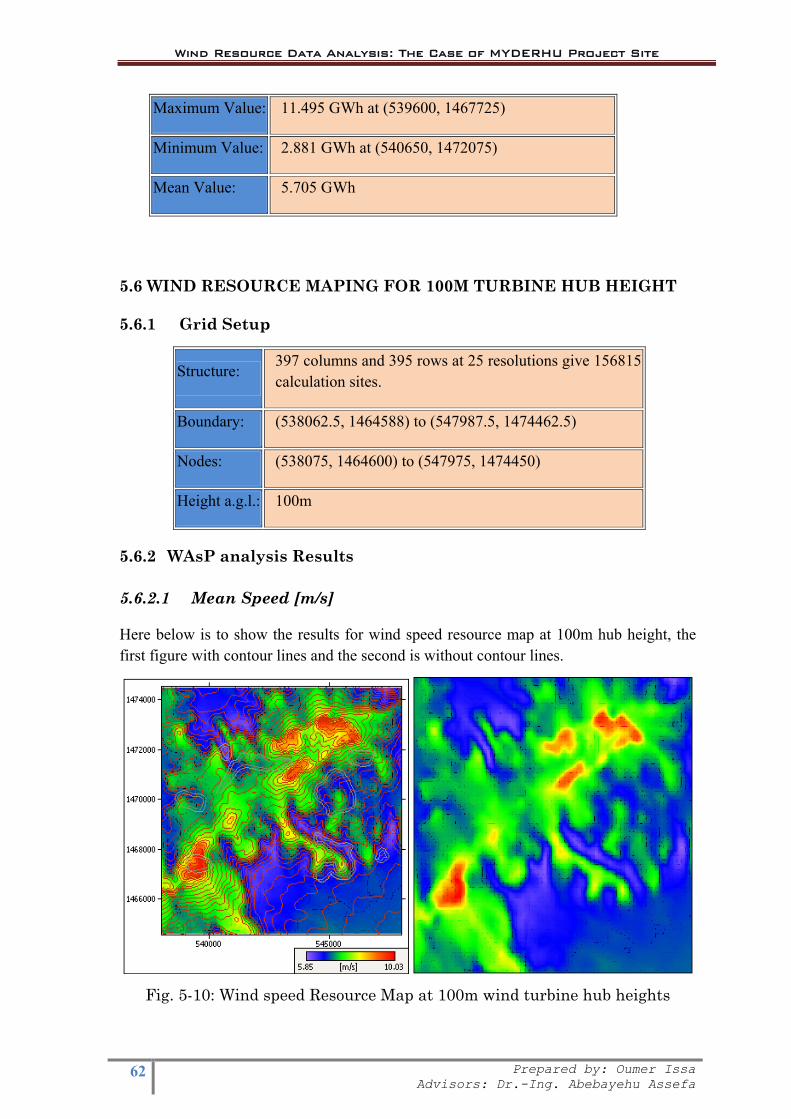
Wind Resource Data Analysis: The Case of MYDERHU Project Site
62 Prepared by: Oumer Issa Advisors: Dr.-Ing. Abebayehu Assefa
Maximum Value: 11.495 GWh at (539600, 1467725)
Minimum Value: 2.881 GWh at (540650, 1472075)
Mean Value: 5.705 GWh
5.6 WIND RESOURCE MAPING FOR 100M TURBINE HUB HEIGHT
5.6.1 Grid Setup
Structure: 397 columns and 395 rows at 25 resolutions give 156815 calculation sites.
Boundary: (538062.5, 1464588) to (547987.5, 1474462.5)
Nodes: (538075, 1464600) to (547975, 1474450)
Height a.g.l.: 100m
5.6.2 WAsP analysis Results
5.6.2.1 Mean Speed [m/s]
Here below is to show the results for wind speed resource map at 100m hub height, the first figure with contour lines and the second is without contour lines.
Fig. 5-10: Wind speed Resource Map at 100m wind turbine hub heights

Wind Resource Data Analysis: The Case of MYDERHU Project Site
63 Prepared by: Oumer Issa Advisors: Dr.-Ing. Abebayehu Assefa
Maximum Value: 10.03 m/s at (539600, 1467725)
Minimum Value: 5.85 m/s at (547625, 1468775)
Mean Value: 7.20 m/s
5.6.2.2 Power Density [w/m²]
Similar to the wind speed resource map here below is the analysis result for the site power density at 100m hub height, the first figure with contour lines and the second is without contour lines.
Fig. 5-11: Power density Map at 100m wind turbine hub heights
Maximum Value: 842 W/m² at (539600, 1467725)
Minimum Value: 168 W/m² at (547350, 1474375)
Mean Value: 316 W/m²
5.6.2.3 AEP [GWh]
Similar to the wind speed and power density resource maps here below is the analysis result for the site Annual energy production at 100m hub height.

Wind Resource Data Analysis: The Case of MYDERHU Project Site
64 Prepared by: Oumer Issa Advisors: Dr.-Ing. Abebayehu Assefa
Fig. 5-12: Annual energy production at 100m wind turbine hub heights
Maximum Value: 17.720 GWh at (539575, 1467125)
Minimum Value: 5.455 GWh at (547350, 1474375)
Mean Value: 9.580 GWh
Table 5.2: Summary for Myderhu wind resource grid analysis
Height (m)
Wind Speed (m/s) Power density (W/m2) AEP(GWh)
Max. Min. Mean Max. Min. Mean Max. Min. Mean
30 9.32 3.43 5.52 736 42 162 1.711 0.136 0.563
50 9.47 4.31 6.11 734 76 205 4.363 0.695 1.798
80 9.88 5.36 6.85 811 132 277 11.495 2.881 5.705
100 10 5.85 7.2 842 168 316 17.72 5.455 9.58
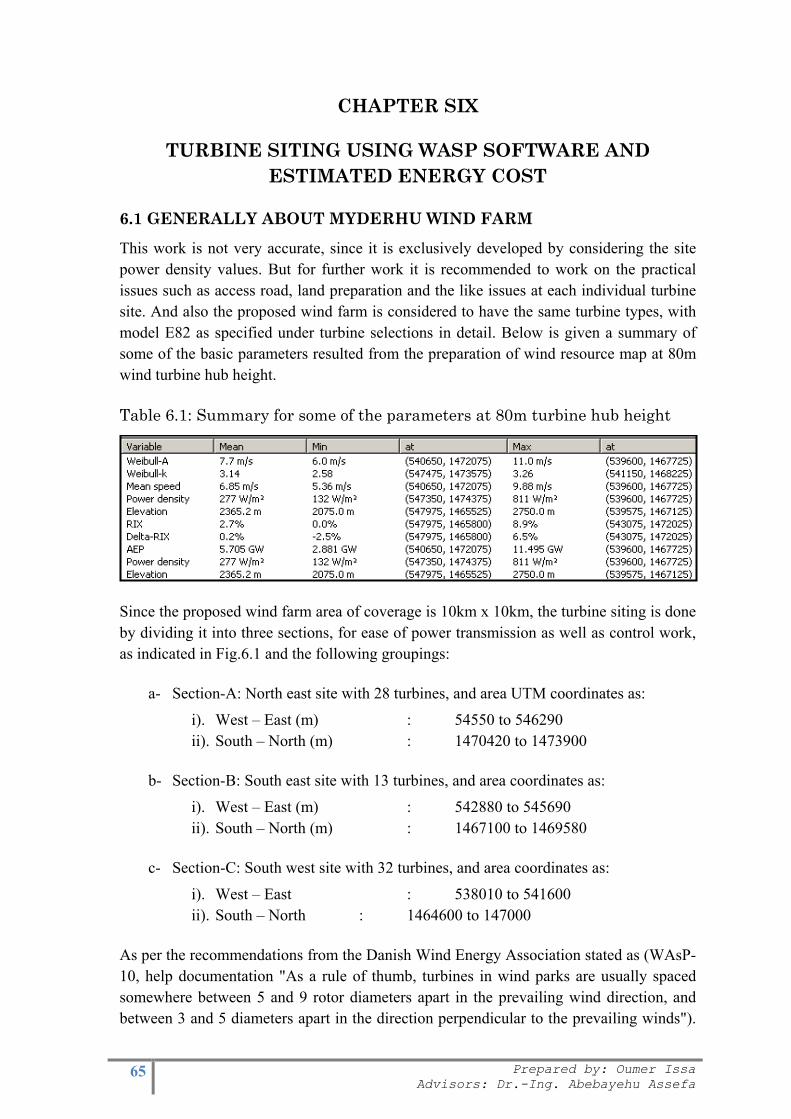
65 Prepared by: Oumer Issa Advisors: Dr.-Ing. Abebayehu Assefa
CHAPTER SIX
TURBINE SITING USING WASP SOFTWARE AND ESTIMATED ENERGY COST
6.1 GENERALLY ABOUT MYDERHU WIND FARM
This work is not very accurate, since it is exclusively developed by considering the site power density values. But for further work it is recommended to work on the practical issues such as access road, land preparation and the like issues at each individual turbine site. And also the proposed wind farm is considered to have the same turbine types, with model E82 as specified under turbine selections in detail. Below is given a summary of some of the basic parameters resulted from the preparation of wind resource map at 80m wind turbine hub height.
Table 6.1: Summary for some of the parameters at 80m turbine hub height
Since the proposed wind farm area of coverage is 10km x 10km, the turbine siting is done by dividing it into three sections, for ease of power transmission as well as control work, as indicated in Fig.6.1 and the following groupings:
a- Section-A: North east site with 28 turbines, and area UTM coordinates as:
i). West – East (m) : 54550 to 546290 ii). South – North (m) : 1470420 to 1473900
b- Section-B: South east site with 13 turbines, and area coordinates as:
i). West – East (m) : 542880 to 545690 ii). South – North (m) : 1467100 to 1469580
c- Section-C: South west site with 32 turbines, and area coordinates as:
i). West – East : 538010 to 541600 ii). South – North : 1464600 to 147000
As per the recommendations from the Danish Wind Energy Association stated as (WAsP-10, help documentation "As a rule of thumb, turbines in wind parks are usually spaced somewhere between 5 and 9 rotor diameters apart in the prevailing wind direction, and between 3 and 5 diameters apart in the direction perpendicular to the prevailing winds").

Wind Resource Data Analysis: The Case of MYDERHU Project Site
66 Prepared by: Oumer Issa Advisors: Dr.-Ing. Abebayehu Assefa
Therefore, for this project case turbines are sited with average values as 550m of spacing in prevailing wind direction and 325m of spacing in direction perpendicular to prevailing winds.
Fig. 6.1: General overview for Myderhu wind farm sectioning and individual turbine siting
6.2 SUMMARY OF FARM ANALYSIS RESULTS
The following two tables show the results of the wind farm in general and the basic information for each of the turbine’s sites.
Table 6.2: Summary of Myderhu wind power generation farm general parameters
Parameter Total Avg. Min. Max. Turbine site(min) Turbine site (max)
Gross AEP [GWh]
593.143 8.238 6.671 11.290 88 63
Net AEP [GWh] 567.133 7.877 6.300 10.926 88 63
P/A [W/m²] 445.82 334 742 88 63
Wake loss [%] 4.39 0.65 10.62 39 52
Eff. [%] 95.58 89.38 99.35 52 39
Elevation [m a.s.l]
2,563 2236.2 2750.0 25 62/63

Wind Resource Data Analysis: The Case of MYDERHU Project Site
67 Prepared by: Oumer Issa Advisors: Dr.-Ing. Abebayehu Assefa
k 3.17 2.8 3.3 60 53/67/85/92/94/95
Umean [m/s] 8.07 7.32 9.68 88 63
RIX [%] 4.36 0.7 8.3 74 27
Table 6.3: Myderhu Wind farm overall result and wind climate characteristics Turbine Site
Geographical Location [m]
Elevation [m a.s.l]
Gross AEP [MWh]
Net AEP [MWh]
Wake loss [%]
Eff. [%]
k U [m/s]
P/A [W/m²]
RIX [%]
001 (543023.0, 1469531) 2481.4 7,177.33 7,089.64 1.22 98.78 3.3 7.52 350 2.5 003 (543063.5,1469062) 2476.1 8,430.59 8,335.79 1.12 98.88 3.2 8.12 445 3.5 007 (543209.8,1468580) 2450.0 8,422.90 8,147.59 3.27 96.73 3.2 8.12 443 3.9 009 (543640.6,1468532) 2411.9 7,582.71 7,437.58 1.91 98.09 3 7.74 396 4.4 013 (543985.4,1468330) 2378.2 7,526.08 7,385.19 1.87 98.13 2.9 7.73 403 5.3 016 (544295.9,1468117) 2336.4 7,278.43 7,132.14 2.01 97.99 2.9 7.58 385 3.6 017 (544469.1,1467674) 2325.0 7,990.94 7,481.97 6.37 93.63 3.2 7.9 409 4.7 018 (544502.4,1467304) 2291.0 7,787.36 7,420.66 4.71 95.29 3.3 7.8 389 4.2 019 (544728.9,1467967) 2325.0 7,355.30 7,210.61 1.97 98.03 3.2 7.62 370 4.3 022 (545072.4,1467788) 2304.4 6,979.64 6,833.10 2.10 97.90 3.1 7.47 351 3.4 024 (545417.8,1467550) 2274.5 7,646.64 7,518.03 1.68 98.32 3 7.75 400 1.4 025 (545480.7,1467142) 2236.2 7,408.06 7,260.47 1.99 98.01 3.2 7.63 368 1.1 026 (543360.1,1470943) 2700.0 10,048.58 9,661.06 3.86 96.14 3.2 9.02 615 7.7 027 (543686.0,1471188) 2700.0 9,832.13 9,348.96 4.91 95.09 3.1 8.94 607 8.3 028 (544196.2,1471201) 2611.3 7,821.06 7,398.12 5.41 94.59 3.3 7.86 397 6.7 029 (544631.8,1471545) 2601.0 7,365.17 7,095.51 3.66 96.34 3.1 7.67 383 5.5 030 (544843.9,1471930) 2625.0 7,862.74 7,271.65 7.52 92.48 3.3 7.87 403 5.5 031 (545184.4,1472136) 2650.9 8,110.27 7,513.57 7.36 92.64 3.2 8.01 425 5.1 032 (545601.9,1472349) 2700.0 9,356.74 8,811.58 5.83 94.17 3.2 8.66 544 6.6 033 (546010.8,1472455) 2700.0 10,400.28 10,193.8
2 1.99 98.01 3.2 9.21 654 7.5
034 (545793.0,1472784) 2682.0 9,417.25 9,239.95 1.88 98.12 3.1 8.66 545 5.7 035 (545491.6,1473049) 2719.0 10,442.06 10,338.4
3 0.99 99.01 3.2 9.2 643 6.7
036 (545022.6,1472892) 2725.0 9,872.66 9,413.79 4.65 95.35 3.2 8.91 591 6 037 (544642.9,1473032) 2725.0 10,759.15 10,473.4
2.66 97.34 3.3 9.35 671 7.1
038 (544860.6,1473488) 2551.7 7,987.83 7,893.10 1.19 98.81 3.2 7.89 409 4.5 039 (544419.6,1473672) 2494.5 7,329.38 7,281.48 0.65 99.35 3.1 7.58 366 3.6 040 (544330.2,1472516) 2655.2 7,710.73 7,134.73 7.47 92.53 3.2 7.82 396 5.1 041 (543844.5,1472661) 2641.1 7,314.62 6,849.22 6.36 93.64 3 7.69 392 5.9 042 (543475.9,1472469) 2700.0 10,055.63 9,545.85 5.07 94.93 3.3 8.98 597 7.1 043 (543392.2,1472887) 2537.7 7,317.60 7,052.25 3.63 96.37 3.3 7.58 360 5.4 044 (543023.2,1472253) 2661.8 8,632.20 8,094.13 6.23 93.77 3.1 8.32 491 7.7 045 (542655.2,1472058) 2609.3 7,780.90 7,204.64 7.41 92.59 3.2 7.88 410 4.7 046 (542895.4,1470702) 2629.1 7,959.42 7,534.22 5.34 94.66 3.2 7.95 420 2.5 051 (544949.6,1472494) 2676.7 8,522.61 7,834.17 8.08 91.92 3.3 8.17 446 5.7 052 (544665.2,1472255) 2633.0 7,169.11 6,407.61 10.62 89.38 3.3 7.55 354 5 053 (543626.8,1472083) 2657.0 8,629.98 8,084.29 6.32 93.68 3.3 8.22 453 7.2 054 (543202.4,1471857) 2605.4 7,653.16 7,012.56 8.37 91.63 3.3 7.75 380 7.9

Wind Resource Data Analysis: The Case of MYDERHU Project Site
68 Prepared by: Oumer Issa Advisors: Dr.-Ing. Abebayehu Assefa
055 (545370.9,1472667) 2667.2 8,067.62 7,503.26 7.00 93.00 3.2 7.98 419 6.7 056 (543537.4,1470574) 2582.6 7,969.55 7,725.63 3.06 96.94 3.3 7.89 401 5.4 057 (544000.8,1471558) 2662.7 9,185.48 8,701.65 5.27 94.73 3.2 8.52 511 7.9 058 (538076.7,1466452) 2725.0 7,735.68 7,281.89 5.87 94.13 3.1 7.87 411 3.4 059 (538506.6,1466372) 2657.3 7,718.92 7,231.05 6.32 93.68 3.1 7.86 410 4.2 060 (538807.1,1466713) 2665.1 7,032.56 6,538.07 7.03 92.97 2.8 7.59 393 2.9 062 (539133.1,1466997) 2750.0 10,242.13 9,568.79 6.57 93.43 3.1 9.15 646 5.8 063 (539549.6,1467098) 2750.0 11,289.64 10,926.4
3.22 96.78 3.3 9.68 742 6.4
064 (539249.6,1467319) 2705.1 9,908.84 9,333.68 5.80 94.20 3.3 8.87 571 5.1 065 (538818.8,1467268) 2661.8 8,385.87 7,705.21 8.12 91.88 3.3 8.13 442 5.3 066 (539886.2,1466748) 2578.6 7,739.27 7,428.56 4.01 95.99 3.1 7.81 399 3 067 (539424.2,1466721) 2624.9 7,999.12 7,388.71 7.63 92.37 3.3 7.91 404 4.4 068 (540223.1,1466334) 2506.0 7,595.89 7,323.68 3.58 96.42 3.2 7.73 383 2.7 069 (540520.5,1466037) 2439.1 7,265.58 6,984.60 3.87 96.13 3.1 7.55 365 2.4 070 (540740.4,1465686) 2406.2 7,440.37 7,067.84 5.01 94.99 3.1 7.63 378 2 071 (541249.5,1465997) 2366.6 7,142.72 6,969.54 2.42 97.58 3.2 7.49 352 3.1 072 (541123.3,1465181) 2375.0 8,132.53 8,020.53 1.38 98.62 2.9 7.96 441 2.3 074 (541685.4,1464648) 2351.7 7,829.18 7,689.02 1.79 98.21 3 7.82 415 0.7 075 (541379.9,1464884) 2358.3 7,854.98 7,703.91 1.92 98.08 2.9 7.82 419 1.1 076 (540972.6,1464770) 2355.9 7,394.28 6,869.82 7.09 92.91 2.9 7.6 382 1.5 078 (539738.0,1467437) 2694.7 11,079.35 10,778.1
2.72 97.28 3.3 9.54 717 5.2
079 (538966.2,1467595) 2617.9 7,979.09 7,472.82 6.34 93.66 3.3 7.9 404 4.9 080 (539536.8,1467738) 2700.0 10,950.57 10,653.4
2.71 97.29 3.2 9.5 713 4.5
081 (539756.4,1468110) 2656.0 9,693.67 9,415.37 2.87 97.13 3.1 8.82 579 3.2 084 (540106.9,1468416) 2581.7 7,534.30 7,226.85 4.08 95.92 3.1 7.72 392 1.5 085 (539323.3,1468007) 2614.5 8,044.26 7,537.28 6.30 93.70 3.3 7.94 408 4 086 (539665.8,1468459) 2568.5 7,751.52 7,249.74 6.47 93.53 3.2 7.79 390 2 088 (540318.9,1468743) 2556.8 6,671.05 6,299.75 5.57 94.43 3 7.32 334 2 089 (540766.4,1469044) 2600.0 8,308.51 8,054.09 3.06 96.94 3.3 8.08 434 1.9 090 (541030.6,1469363) 2588.6 8,000.20 7,708.65 3.64 96.36 3.3 7.93 410 2 092 (540723.2,1469600) 2552.0 7,241.08 7,060.98 2.49 97.51 3.3 7.56 353 2 094 (540946.1,1468728) 2551.9 7,371.26 7,044.25 4.44 95.56 3.3 7.62 361 2.5 095 (541195.0,1468367) 2520.6 7,509.19 7,173.00 4.48 95.52 3.3 7.68 369 3.5 099 (542869.8,1470040) 2532.4 6,989.94 6,856.16 1.91 98.09 3.3 7.45 338 2.7 100 (539614.9,1466263) 2531.1 7,151.39 6,700.03 6.31 93.69 3.2 7.52 352 2.7
Wind farm
- 2,563.02 593,142.7 567,133.3 95.61 3.17 8.07 445.8 4.36
The following figures show some of the properties of Myderhu wind farm project micro turbine siting such as predicted wind speed frequency rose, power density and ruggedness index (RIX):

Wind Resource Data Analysis: The Case of MYDERHU Project Site
69 Prepared by: Oumer Issa Advisors: Dr.-Ing. Abebayehu Assefa
Fig. 6.2: Turbine siting and wind speed frequency rose using power density as a
background
Fig. 6.3: RIX map for Myderhu wind farm project at 80m turbine height
Summery for the site RIX
Maximum Value: 8.9% at (543075, 1472025) Minimum Value: 0.0% at (547975, 1465800) Mean Value: 2.7%

Wind Resource Data Analysis: The Case of MYDERHU Project Site
70 Prepared by: Oumer Issa Advisors: Dr.-Ing. Abebayehu Assefa
6.3 SOME OF THE 3D VIEWS OF MYDERHU WIND FARM
The following figures are copied from the synchronization results of WAsP with Google Earth to show the reader the 3D representations of the proposed wind farm:
Fig. 6.4: Number of turbines at each section
Fig. 6.5: Turbines’ positioning and power density

Wind Resource Data Analysis: The Case of MYDERHU Project Site
71 Prepared by: Oumer Issa Advisors: Dr.-Ing. Abebayehu Assefa
Fig. 6.6: 3D veiw for Section-A- Wind turbines siting
Fig. 6.7: 3D veiw for for some of Section-A - Wind turbines siting with site power density and wind frequency rose

Wind Resource Data Analysis: The Case of MYDERHU Project Site
72 Prepared by: Oumer Issa Advisors: Dr.-Ing. Abebayehu Assefa
Fig. 6.8: 3D veiw for Section-B - Wind turbines siting
Fig. 6.9: 3D veiw for Section-B - Wind turbines siting with site power density and wind frequency rose

Wind Resource Data Analysis: The Case of MYDERHU Project Site
73 Prepared by: Oumer Issa Advisors: Dr.-Ing. Abebayehu Assefa
Fig. 6.10: 3D veiw for Section-C - Wind turbines siting arround the mountain
Fig. 6.11: 3D veiw for Section-C - Wind turbines siting to the south of mountain
Fig. 6.12: 3D veiw for Section-C - Wind turbines siting arround the mountain with site power density and wind frequency rose

Wind Resource Data Analysis: The Case of MYDERHU Project Site
74 Prepared by: Oumer Issa Advisors: Dr.-Ing. Abebayehu Assefa
Fig. 6.13: 3D veiw for Section-C - Wind turbines siting to the south of mountain with site power density as a background and wind frequency rose
Fig. 6.14: 3D veiw for Section-C - Wind turbines sitting to the east of the mountain with site power density and wind frequency rose
6.4 ESTIMATED FARM AEP AND CAPACITY FACTOR
As indicated above, the wind turbines are all similar types with the following parameters:

Wind Resource Data Analysis: The Case of MYDERHU Project Site
75 Prepared by: Oumer Issa Advisors: Dr.-Ing. Abebayehu Assefa
Manufacturer : ENERCON Model : E82 Rated power : 2000 kW Rated AEP : 17.52 GWhr Tower height : 80 m Rotor diameter : 82 m
Other details for the selected turbines are enclosed under APPENDIX - G
The site actual performance parameters, as indicated in Table 6.3 are:
Myderhu wind farm gross total AEP : 593.14 GWhr
Myderhu wind farm gross avg. AEP/turbine : 8.24 GWhr
Myderhu wind farm net total AEP : 567.13 GWhr
Myderhu wind farm net avg. AEP/turbine : 7.877 GWhr
Myderhu wind farm avg. power density P/A : 445.82 W/m²
Myderhu wind farm total number of turbines : 72 Pcs
ENERCON E82 total 72 turbines rated AEP : 1,261.44 GWhr
Therefore, using the formula for capacity factor calculation as specified by Eq.2.32:
CF = Net AEP (Actual)/Turbines rated AEP = 44.96%
As per the different methods of wind class classifications, CF 44.96%, classified under high windy or economically attractive site. For this site case, the reason for attaining this much CF is due to the sitting of turbines have been done only by considering the theoretically higher power density sites, however, it is a must to consider the challenges of practical installation of the turbines at the specified turbine locations. Therefore, the actual CF would be lower than the above calculated result.
6.5 ESTIMATED ENERGY COST
Here all the assumptions are same with that considered under the turbine selection chapter. i.e.:
1. Plant life time : 15 years 2. Estimation is by using simple interest methods 3. Annual operating cost is 4% of the total depreciation cost per year 4. Considering Ashegoda investment cost as a benchmarking, as 2000 Euro/kW.
Since the installed turbines are 1MW each, implies 2 million Euro per turbine.

Wind Resource Data Analysis: The Case of MYDERHU Project Site
76 Prepared by: Oumer Issa Advisors: Dr.-Ing. Abebayehu Assefa
However, the selection of turbine has a bigger rated power, thus it is assumed a 20% reduction from overall investment, and this also implies a 20% reduction from the cost of unit power production (cost/kW). Therefore, the unit investment cost will be 1600 Euro/kW for first and 1750 Euro/kW for second calculations.
5. Currency exchange rate from Euro to Birr is equal to 24.00
Simple Calculations -1:
Unit MYDERHU wind turbine rated power (E82) : 2000 kW Total number of turbines (all are similar) : 72 pcs Total MYDERHU wind farm rated power : 144MW Estimated unit investment cost : 1600 Euro/kW[38,400 Birr/kW] Estimated total investment cost : 230.4 million €[5.53 billion Birr] Estimated plant life time : 15 years Estimated annual depreciation cost (simple interest rate): 15.36 million €[368.640million Birr] Annul operating cost (4% of depreciation) : 0.6144 million €[14.746million Birr] Total annual cost (capital + operating) : 15.9744 million €[383.4 million Birr] Myderhu wind farm net total AEP : 567.13 GWhr Estimated unit energy cost : 0.028€ [0.676 Birr]
Simple Calculations -2:
If AHEGODA investment cost is considered directly, i.e. 1750€/kW [42,000 Birr/kW] Unit MYDERHU wind turbine rated power (E82) : 2000 kW Total number of turbines (all are similar) : 72 pcs Total MYDERHU wind farm rated power : 144MW Estimated unit investment cost : 1750€/kW [42,000 Birr/kW] Estimated total investment cost : 252 million € [6.05 billion Birr] Estimated Plant life time : 15 years Estimated annual depreciation cost (simple interest rate): 16.8 million € [403.2 million Birr] Annul operating cost (4% of depreciation) : 0.672 million € [16.128 million Birr] Total annual cost (capital + operating) : 17.472 million € [419.33 million Birr] Myderhu wind farm net total AEP : 567.13 GWhr Estimated unit energy cost : 0.031€/kWhr [0.74 Birr/kWhr]

77 Prepared by: Oumer Issa Advisors: Dr.-Ing. Abebayehu Assefa
CHAPTER SEVEN
DISCUSSION ON THE ANALYSIS RESULTS
General
The analysis in Chapter 5 is performed with the help of different software such as MS Excel, MatLab and WAsP. From the results of both analyses procedures at wind mast site, the wind resource is categorized as a fair wind resource potential with 7m/s mean speed and mean power density of 287 W/m2 at 50m height. This is categorized as class-III wind resource potential.
From economical point of view Capacity Factor is a shorthand reference for wind and turbine productivity. As presented by Vaughan (2010) he classified as:
• Capacity factor with 30-35% implies Normal “Good” wind site having less production, economically viable with greater power sale rate.
• The upper end of capacity factor given by >45% Capacity Factor: implies the site is taken as World Class Wind site, characterized by consistent, predictable, strong winds. The site might be taken as great plains, Hawaii, mountain passes, off-shore sites.
Wind climate issues
By considering the observed (measured) wind data sets, that is, the site around the wind mast area has an estimated power law coefficient (α) of 0.15 and roughness length (Zo) of 0.025m. This implies that, the site roughness classification is under class I. It is to mean that the area is considered as open farmland with no crossing hedge and with scattered buildings. Open country refers to area without significant buildings and vegetation; only small hills are available. This also confirms with the site survey conditions.
For 10m measurement the most frequent turbulence intensity is about 0.1252 and its occurrence is 45%; the average is also 0.2300. For 30m measurement the most frequent turbulence intensity is about 0.1351 and its occurrence is 64.06%. The average is also 0.1691. Therefore, as the classification presented in (Eng. Ashour Abdelsalam, 2010), the site is considered as moderate turbulence intensity site.
The site annual average ambient temperature is 13.47oC, and considering the value for the standard condition as 101325Pa for pressure (since there is not available measurement) and 287 J/kg.K for specific gas constant, and by utilizing the ideal gas law, the site air density becomes 1.231 kg/m3. However, the average calculated air density using WAsP air density estimator by considering the annual average site ambient temperature as 13.47oC and 2513 meter above sea level(m.a.s.l),, the site air density becomes 0.92. This discrepancy will result in the poor power and AEP estimation. Therefore, it is also better to consider the measurements of pressures at the wind mast sites.

Wind Resource Data Analysis: The Case of MYDERHU Project Site
78 Prepared by: Oumer Issa Advisors: Dr.-Ing. Abebayehu Assefa
AEP, Performance and Cost issues for turbines installed at wind mast site
The AEP for E33 is about 0.858 GWhr with 29.68% capacity factor and 0.06 Euro/kWhr (1.47 Birr/kWhr); E53 is also about 2.485 GWhr with 35.46% capcity factor and 0.04 Euro/kWhr (1.07 Birr/kWhr); AEP for E82 is about 7.277 GWhr with 41.54% capacity factor and 0.03 Euro/kWhr (0.73 Birr/kWhr); and finally E101 turbine can generate 11.792 GWhr per annual with capacity factor of 44.87% and energy cost of 0.02 Euro/kWhr (0.56 Birr/kWhr).
Therefore, considering the capacity factor for each of the turbine hub heights as per the classification of Vaughan (2010) the investment at 30m height needs some extended time period for capital payback. However, heights of 50m, 80m and 100m can be classified as a world class wind resource, and their energy cost is comparable with the economically attractive resources such as hydropower and conventional energy generation, it will have lower energy cost/kWhr and/or also lower payback periods.
Note: For accurate estimation, detailed work is required on the economical and environmental models too. The estimation here is done only by considering resource map results; no considerations have been included for factors such as difficulty issues on the installation, land displacement cost, environmental analysis, etc.
AEP, Performance and Cost issues for the proposed wind farm using E82 wind turbines
The wind farm gross AEP using 72 pcs of turbines is estimated to be about 593 GWhr and considering the wake loss of average 4.4% the net AEP is estimated to be about 567GWhr. This means the farm has 95.6% efficiency and an average power density of 446 W/m2.
The turbines mean speed ranges from 7.32 m/s to 9.68 m/s with average of 8.07 m/s. The Weibull shape factor (k) ranges from 2.8 to 3.3 with total average of 3.17. This means, as indicated on Fig. 8.1, the site wind resource at each selected wind turbine site and the respective hub height has more uniformity on wind speeds.
The farm orographic characteristics can be summarized using ruggedness index (RIX) which ranges from 0.7% to 8.3%, with an overall average of 4.36%. The wind turbines are installed at an altitudes ranging from 2236m above sea level to 2750m.a.s.l with average of 2563m above sea level.
The selected turbines are ENERCON made, Model E82 with rated power capacity of 2000kW. The total number of turbines is 72. Therefore, the total installed capacity of the farm is 144MW and the estimated overall MYDERHU wind net AEP is 567.13 GWhr. The farm overall capacity factor estimated about 45%.

Wind Resource Data Analysis: The Case of MYDERHU Project Site
79 Prepared by: Oumer Issa Advisors: Dr.-Ing. Abebayehu Assefa
The investment and unit energy costs have been considered under two scenarios. First by assuming 1600 €/kW[38,400Birr/kW] for unit investment cost, the total investment cost will be about 230.4 million € [5.53billion Birr]; and the second have been done by considering the unit investment cost as 1750€/kW [42,000 Birr/kW], the total investment cost is about 252 million € [6.05 billion Birr] and the unit energy cost is 0.031€/kWhr [0.74 Birr/kWhr].
Therefore, as far as the capacity factor is concerned (Vaughan 2010) the farm is classified as an attractive investment. Considering the unit energy cost when compared with the newly drafted Ethiopian feed-in tariff proclamation of 2004 E.C., 0.1$[0.075€][1.72 Birr]/kWhr for the energy generated from wind power resources, the farm looks profitable with about 1 Birr/kWhr.

80 Prepared by: Oumer Issa Advisors: Dr.-Ing. Abebayehu Assefa
CHAPTER EIGHT
CONCLUSIONS AND RECOMMENDATIONS
The wind farm analysis is not performed in detail. For accurate cost estimation, a detailed analysis of environmental and financial issues, as indicated below should be incorporated.
• Operations and Maintenance • Local transportation and taxes • Insurance • Land use rights and displacement costs • Power delivery costs such as:
o Interconnection, o Transmission, o Detailed installation, etc.,
• Exclusive site visit for those selected turbine sites with greater power density to check the possibility and challenges for the turbine installations,
• It is recommended to undertake measurements for wind speeds as well as pressure and temperature at the top of the two mountains,
• Turbine sitting further requires exclusive onsite works to explore the complexity issues of installation and controls,
• Since these turbine sittings are basically done by using the 2D map and higher power density areas, it gives a higher CF, and consequently the cost of energy is lower. Therefore, it will definitely be reduced after undertaking site visit and considering the installation issues,
• Exploring the site in detail, will gives a better accurate energy cost. Since the site is mountainous and rocky area, it is expected a great investment cost for the construction of access roads and land preparation at each of proposed turbine sites,
• When CDM policy is updated, it will have the possibility of benefit package, consequently contributing something to the energy cost reduction.

81 Prepared by: Oumer Issa Advisors: Dr.-Ing. Abebayehu Assefa
BIBLIOGRAPHY
D. Elliott M. Schwartz, G Scott, S Haymes, D Heimiller, R George Presentation on"Wind Resource Assessment",National Renewable Energy Laboratory Golden,Colorado. - 2006.
Det Norske Veritas and Risø National Laboratory, Guidelines for Design of Wind Turbines [Book]. - Copenhagen, Denmark : Jydsk Centraltrykkeri, Denmark, 2002. - 2nd Edition. - ISBN 87-550-2870-5.
Documentation WAsP-10 help WAsp Help Documentation [Book]. - Denmark : [s.n.], 2010.
E.Sreevalsan presentation on "WIND RESOURCES and ASSESSMENT TECHNIQUES" [Report]. - [s.l.] : Centre for Wind Energy Technology, 2009.
EEPCo, EEPCo fact sheet 2010 [Report]. - Addis Ababa : [s.n.], 2010.
Eng. Ashour Abdelsalam Moussa Presentation on “Wind Resource Assessment Program”,Wind Energy Dep., New and Renewable Energy Authority (NREA). - Cairo : [s.n.], 2010.
Erich H. Wind Turbines: Fundamentals, Technologies, Application, Economics [Book] / trans. Horst Von Renourad. - Berlin Heidelberg,Germany : Springer-Verlag Berlin Heidelberg, 2006. - 2nd Edition.
Manwell J.F. McGowan J.G. and Rogers A.L., Wind energy explained; Theory, design and application [Book]. - University of Massachusetts, Amherst, USA : University of Massachusetts, Amherst, 2002. - ISBN 2323.
Risø National Laboratory for Sustainable Energy, Technical University of Denmark (DTU) WAsP 10 Help documentation. - Denmark : [s.n.], 1987-2011.
Sathyajith M. Wind Energy;Fundamentals, Resource Analysis and Economics [Book]. - Verlag Berlin Heidelberg : Springer-Verlag Berlin Heidelberg, 2006.
Tong Wei Fundamentals of wind energy [Book Section] // Wind Power Generation and Wind Turbine Design / ed. Wei Tong Kollmorgen Corp., USA. - Kollmorgen Corporation, Virginia, USA. : WIT Press, USA, 2010. - ISBN: 978-1-84564-205-1.

82 Prepared by: Oumer Issa Advisors: Dr.-Ing. Abebayehu Assefa
APPENDIX
Appendix A:
Turbulence Intensity (Eng. Ashour Abdelsalam, 2010):
Low levels indicated by values less than or equal to 0.10,
Moderate levels up to 0.25, and
High levels greater than 0.25
Appendix B:
Representative example to show the importance of using Eq.(3.2) than Eq.(3.1) to estimate average wind speed as done by (Sathyajith M., 2006):
For wind power calculations, averaging the velocity using Eq. (2.1) is often misleading. For example, 1 hour wind data from a site collected at 10 minutes interval are shown in the below Table. As per Eq. (2.2), the hourly average wind velocity is 6.45 m/s, taking the air density as 1.24 kg/m3, the corresponding average power is 166.37 W/m2. If it is calculated the power corresponding to individual velocities and then take the average, the result would be 207 W/m2. This means that, by calculating the average wind speed by using Eq. (2.1), it is underestimating the wind power potential by 20 per cent.
Table-Example: Wind velocity at 10 minutes interval (Sathyajith M., 2006)
SN V, m/s V3 P, W/m2
1 4.3 79.5 1 49.29
2 4.7 103.8 2 64.37
3 8.3 571.79 354.51
4 6.2 238.33 147.76
5 5.9 205.38 127.33
6 9.3 804.36 498.70
If it is used Eq. (2.2), the average velocity in the previous example is 6.94 m/s and the corresponding power is 207 W/m2. This shows that due to the cubic velocity power relationship, the weighted average expressed in Eq. (2.2) should be used in wind energy analysis.

Wind Resource Data Analysis: The Case of MYDERHU Project Site
83 Prepared by: Oumer Issa Advisors: Dr.-Ing. Abebayehu Assefa
Appendix C:
Table C-1: Wind speed parameters for various types of terrain. (Det Norske Veritas and Risø National Laboratory, 2002)
Table C-2: Roughness length (Zo) (E.Sreevalsan, 2009)

Wind Resource Data Analysis: The Case of MYDERHU Project Site
84 Prepared by: Oumer Issa Advisors: Dr.-Ing. Abebayehu Assefa
Appendix D:
Table D-1: power classification (D. Elliott, 2006)
Appendix E:
Saffir-Simpson’s hurricane scale, groups and ranks for hurricanes according to the wind a speed involved and gives consequences in terms of implied storm surges and associated resulting damage. (Det Norske Veritas and Risø National Laboratory,, 2002).
Table F-1 : Saffir-Simpson’s hurricane scale
* Maximum 1-minute average

Wind Resource Data Analysis: The Case of MYDERHU Project Site
85 Prepared by: Oumer Issa Advisors: Dr.-Ing. Abebayehu Assefa
Appendix F:
Source: Senter/Novem, ‘Cijfers en Tabellen 2006’ (Yearly handbook of the Dutch government on the possibilities for energy saving)
Table F-1: Costs for some turbine types, as provided by the suppliers
Table F-2: Electricity generated by Wind Turbines results in a reduction in the emission of greenhouse (and acid) gases by the following quantities per kWh:
• CO2 : 0.566 kg / kWh • NOx : 0.15 g / kWh • SO2 : 0.42 g / kWh

Wind Resource Data Analysis: The Case of MYDERHU Project Site
86 Prepared by: Oumer Issa Advisors: Dr.-Ing. Abebayehu Assefa
Appendix G: