wind in our sails, the coming of europe's offshore wind energy
TRANSCRIPT
The coming of Europe’s offshore wind energy industry
A report by the European Wind Energy Association - 2011
Wind in our Sails
Wind in our SailsThe coming of Europe’s offshore wind energy industry
A report by the European Wind Energy Association
Text and analysis:
Chapter 1 – Athanasia Arapogianni and Jacopo Moccia, European Wind Energy Association
Chapters 2 to 7 – David Williams and Joseph Phillips, GL Garrad Hassan
Revision: Christian Kjaer, Justin Wilkes and Anne-Bénédicte Genachte, European Wind Energy Association
Editing: Sarah Azau and Zoë Casey, European Wind Energy Association
Project coordinators: Sarah Azau and Raffaella Bianchin, European Wind Energy Association
Design: www.devisu.com
Print: www.artoos.be
EWEA has joined a climate-neutral printing programme. It makes choices as to what it prints and how, based on
environmental criteria. The CO2 emissions of the printing process are then calculated and compensated by green
emission allowances purchased from a sustainable project.
Cover photo: Dong
Published in November 2011
23420_Offshore report_int_v15.indd 123420_Offshore report_int_v15.indd 1 9/11/11 10:339/11/11 10:33

2 Wind in our Sails – The coming of Europe’s offshore wind energy industry
ForewordThe European Union leads the world in offshore wind
power with 4,000 MW already installed, and this is
only the beginning of a major industrial development.
This industry will not only help revitalise European
economies, but will place Europe at the heart of global
offshore wind developments benefi tting European
companies which are well established as fi rst movers,
and provide thousands of jobs for European citizens.
Our market and technology leadership in the offshore
wind sector will serve us well.
It is my pleasure to provide this foreword to Wind in our
Sails – The coming of Europe's offshore wind industry,
produced by the European Wind Energy Association,
once again showing overwhelming investor interest
and the huge contribution this innovative industry can
make to Europe. Offshore wind power contributes to
the EU goals of competitiveness, energy security and
reducing greenhouse gas emissions. As this report
highlights, the developing of a new industrial supply
chain will bring new jobs and a wealth of commercial
opportunities.
The European Environment Agency, in its 2009 report1
confi rms that the wind resource is not a constraint. In
fact, the EEA illustrate that offshore wind power’s eco-
nomically competitive potential is around 3,400 TWh
in 2030, about 80% of the EU’s projected electricity
demand.
At a time where Europe is at a major crossroads for its
energy future, offshore wind provides a powerful domestic
answer to Europe’s energy supply and climate dilemma.
However, this development will not happen without
ambitious national programmes, and support from the
European Union, underpinning the market promise.
There is strong evidence that the supply chain for off-
shore wind is dynamic and responding to challenges
through investment in innovation. Nevertheless, devel-
oping the necessary technology and industrial capacity
and getting projects through planning and consent-
ing takes time. To make the necessary investments,
the industry needs certainty and stability. Favourable
national framework conditions implementing the
Renewable Energy Directive, together with a stable
post - 2020 legislative framework and more innovative
fi nancing will be key to achieving it.
But none of these goals will be reached without solid,
reliable electricity networks. They are – and will become
even more – the backbone of our energy system. The
European Commission, in its energy infrastructure
package, stresses the urgent need to invest in energy
infrastructure in order to transport large amounts of off-
shore wind energy to the consumption centres.
By working together we can build a cleaner, greener
energy future. This EWEA report shows us that coordi-
nated action is needed across the supply chain, sup-
ported by a stable and clear legislative framework and
new fi nancial instruments to tap into this unlimited
indigenous and clean energy resource.
I know the European Commission can count on the
Member States, the European Parliament and all relevant
stakeholders at local, regional, national and European
level to work together in order to make it happen.
Günther H. Oettinger,
European Commissioner for Energy
1 EEA (European Environment Agency), 2009. ‘Europe’s onshore and offshore wind energy potential’. Technical report No 6/2009.
23420_Offshore report_int_v15.indd 223420_Offshore report_int_v15.indd 2 9/11/11 10:339/11/11 10:33

Wind in our Sails – The coming of Europe’s offshore wind energy industry 3
Contents Executive summary .......................................................................................................................4
Recommendations ................................................................................................................................ 7
The coming of Europe’s offshore wind energy industry ............................................................................. 8
1. Offshore wind power market ................................................................................................ 101.1 Historical development of offshore wind power in Europe ................................................................. 11
1.2 Wind power market today .............................................................................................................. 13
1.3 Market outlook (2011 - 2020, 2020 - 2030) ..................................................................................... 17
1.4 Offshore development trends – bigger, deeper and further ............................................................... 27
1.5 Europe’s fi rst mover advantage ...................................................................................................... 29
1.6 Offshore wind energy employment and future skill requirements....................................................... 32
2. Supply chain – Introduction .................................................................................................. 342.1 Contracting trends ........................................................................................................................ 35
2.2 Scope allocation ........................................................................................................................... 39
2.3 Location of key players .................................................................................................................. 40
Key fi ndings ....................................................................................................................................... 41
3. Wind turbines ......................................................................................................................... 423.1 Historical context and market options ............................................................................................ 43
3.2 Key sub-components .................................................................................................................... 44
3.3 Current status of industry supply chain .......................................................................................... 46
3.4 Future technical trends ................................................................................................................. 51
Key fi ndings ....................................................................................................................................... 54
4. Substructures ......................................................................................................................... 564.1 Historical context ......................................................................................................................... 57
4.2 Substructure types ....................................................................................................................... 58
4.3 Substructure market status and outlook ......................................................................................... 60
4.4 Floating structures ........................................................................................................................ 62
Key fi ndings ....................................................................................................................................... 64
5. Electrical infrastructure ......................................................................................................... 665.1 Historical context and market options ............................................................................................ 67
5.2 Current status of industry supply chain .......................................................................................... 70
5.3 Announcements and future technical trends ................................................................................... 73
Key fi ndings ....................................................................................................................................... 73
6. Vessels ..................................................................................................................................... 746.1 Vessel use at offshore wind farms ................................................................................................. 75
6.2 Estimation of future demand ......................................................................................................... 76
6.3 Installation vessel types ................................................................................................................ 78
6.4 New build and announced vessels ................................................................................................. 83
Key fi ndings ....................................................................................................................................... 83
7. Ports ........................................................................................................................................ 847.1 Background: the role of ports in offshore wind development ............................................................ 85
7.2 Port requirements and current status ............................................................................................ 87
7.3 Announcements and future trends ................................................................................................. 90
Key fi ndings ....................................................................................................................................... 91
23420_Offshore report_int_v15.indd 323420_Offshore report_int_v15.indd 3 9/11/11 10:339/11/11 10:33

EXECUTIVE SUMMARY
Photo
: Vesta
s
23420_Offshore report_int_v15.indd 423420_Offshore report_int_v15.indd 4 9/11/11 10:339/11/11 10:33

Wind in our Sails – The coming of Europe’s offshore wind energy industry 5
The European Wind Energy Association (EWEA)
expects around 1 GW of new offshore wind capac-
ity to be installed in European waters during the
course of 2011. This will bring total offshore wind
capacity to almost 4 GW confi rming Europe as the
world leader in offshore wind power. Currently, almost
6 GW of offshore wind capacity is under construc-
tion in Europe, 17 GW have been consented by EU
Member States and there are future plans for a fur-
ther 114 GW. Therefore, it is expected that during
this decade, offshore wind power capacity in Europe
will grow tenfold.
EWEA estimates that by 2020, 40 GW of offshore wind
power will produce 148 TWh annually, meeting over 4%
of the EU’s total electricity demand and avoiding 87
million tonnes of CO2 emissions2.
Between 2020 and 2030 a further 110 GW of off-
shore wind capacity is expected to be added in
European waters. 150 GW of wind power would pro-
duce 562 TWh annually, enough to cover 14% of the
EU’s 2030 electricity demand and avoid 315 million
tonnes of CO2 emissions3.
The projected growth of offshore wind energy resem-
bles the growth witnessed in the onshore wind sector at
a similar time in the industry’s development. Onshore
wind energy deployment picked up speed in the mid-
1990s. With a 15 year difference, offshore wind seems,
today, to be following a similar growth path.
The foreseen growth of the sector will push offshore
wind power to the forefront of the EU’s climate and
energy strategy.
The development of a new industrial sector in Europe
provides signifi cant opportunities, particularly in the
current economic climate, for growth and job creation.
Offshore wind power will play a key role in Europe’s
future renewable energy economy. However, a prere-
quisite for this is the provision by governments and the
European Union of stable legislative frameworks for
offshore wind, and access to and availability of, suffi -
cient levels of fi nancing. In order to reap the benefi ts
the offshore wind power sector offers, governments
need to play their role.
Offshore wind, creating high-skilled jobs
The offshore industry is forecast to see a steep rise
in employment numbers over the course of the next
decade. It is estimated that the wind energy sector will
employ 462,000 people in 2020. Of these 169,500,
almost 40% will be in offshore. By 2030, jobs in off-
shore are expected to count for 62% of total employ-
ment in the wind energy sector: around 300,000 jobs
out of a total of 480,000.
Moreover, following in the wake of substantial success
in the onshore wind industry, Europe as a fi rst-mover
could exploit future export opportunities to other
emerging markets.
The renewable industry generally has a higher propor-
tion of jobs classifi ed as “high-skilled” than the econ-
omy at large. Companies are fi nding these positions
diffi cult to fi ll, highlighting the importance of a focus
on training and education measures to prevent future
shortage in this often neglected yet essential element
of the supply chain.
A rapidly maturing and increasingly
competitive market
Over the coming two decades, offshore wind will move
rapidly from an emerging, immature technology to a
key component of the EU’s energy mix. Consequently,
competition across the supply chain for offshore wind
is increasing with an infl ux of signifi cant new entrants.
2-3 EWEA Pure Power 2011 report, http://www.ewea.org/fi leadmin/ewea_documents/documents/publications/reports/Pure_Power_III.pdf
23420_Offshore report_int_v15.indd 523420_Offshore report_int_v15.indd 5 9/11/11 10:339/11/11 10:33

6 Wind in our Sails – The coming of Europe’s offshore wind energy industry
Executive summary
Substructures have a relatively high elasticity of sup-
ply, potentially reducing the risk of bottlenecks. They
present an attractive diversifi cation opportunity for
substantial existing marine and oil and gas (O&G)
manufacturing capacity in Europe.
The move into deeper waters will see “space-frame
structures” – that is, wind turbine substructures which
use several “piles” to keep the turbine stable – having
an increased market share, and new fi xed and fl oating
structures in the longer term. Nevertheless improved
fabrication and installation procedures could also
enhance the depths at which monopiles are used.
Subsea cables – a critical bottleneck?
There is a limited range of suppliers for high voltage
(HV) subsea cables due to high investment costs and
long lead times for new capacity. Signifi cant advances
are being made in the use of high voltage direct cur-
rent (HVDC) cables with a wider range of suppliers and
there is potential for multi-terminal capability.
Without increased capacity in manufacturing, a short-
age of high voltage (HV) subsea cables is likely. Other
equipment is generally drawn from much larger trans-
mission and distribution (T&D) industries which are
relatively unconstrained, with the exception of HV
transformers, where delivery times are set by general
world demand.
Jack-up vessels remain industry workhorse as
vessel specialisation increases
The industry is seeing increased specialisation of
vessels for offshore wind generally and for the spe-
cifi c tasks performed on an offshore wind site.
Nevertheless jack-up designs are expected to con-
tinue to dominate vital installation procedures and
particularly turbine installation.
Developers are looking at strategic investments to
secure vessels. However, in the near term, supply con-
straints are decreasing, which may stem this trend.
The vessel supply chain outlook is strong through
to 2015 with several new builds, increased levels
The contracting format turned away from, but then
moved back towards, Engineer-Procure-Construct-
Install (EPCI) turnkey contracts – which mean one
company is in charge of all the different stages – as
developers and suppliers become more knowledge-
able concerning the risks involved and can allocate
them in a more cost effective way.
The emergence of major contractors from the offshore
oil and gas (O&G) and traditional maritime sectors
may prove to be a signifi cant shift in the dynamics of
the supply chain.
Increasing reliability driving down costs
An impressive and growing list of manufacturers are
developing new wind turbines dedicated to the off-
shore wind sector. It is estimated that the supply of
offshore wind turbines will meet and exceed demand
for the next decade, leading to healthy levels of com-
petition within Europe with the potential for export to
emerging offshore markets.
Sites for new projects are moving further from shore
and into deeper waters. To offset the costs involved in
developing such challenging projects, there is a clear
trend towards reducing the cost of energy through les-
sons learnt, improved reliability and structural effi -
ciency. Design trends are driving the supply chain
towards specialisation – partially decoupling it from
the onshore wind industry and developing specifi c off-
shore solutions.
High elasticity of supply enables domestic
manufacturing of substructures
Substructures present an opportunity for domes-
tic manufacturing due to lower technical barriers for
entry via, for example, the diversifi cation of shipyards
or tower manufacturers. Substructure manufacturing
brings a signifi cant amount of supply chain value as
substructures represent a large part of the capital
expenditure in an offshore wind farm. This shows that
it is not necessary for there to be a wind turbine manu-
facturer in a country for that country to have a signifi -
cant wind energy industry and job creation.
23420_Offshore report_int_v15.indd 623420_Offshore report_int_v15.indd 6 9/11/11 10:339/11/11 10:33

Wind in our Sails – The coming of Europe’s offshore wind energy industry 7
of competition and supply likely to meet demand.
Through the latter half of the decade increasing pres-
sure may return if further investments are not made.
Ports – a key stepping stone for the offshore
wind industry
There is a general move away from the use of mobi-
lisation ports and instead components are exported
directly from the manufacturing facilities to offshore
wind farms to save on logistical costs. However poten-
tial future production in Eastern Europe to take advan-
tage of lower labour costs may reverse or slow this
trend.
There is a drive in certain regions towards cluster-
building for offshore wind manufacturing in closely
located ports. These initiatives are being pursued via
co-operation between the public and private sectors.
RECOMMENDATIONS
To fully tap its potential and fully exploit the benefi ts of this clean and abundant energy source,
Europe needs to set ambitious, but achievable, renewable energy targets beyond 2020, invest in
wind power research and development and develop the grid infrastructure to bring offshore wind’s
power from the seas to the main areas of energy consumption on land.
23420_Offshore report_int_v15.indd 723420_Offshore report_int_v15.indd 7 9/11/11 10:339/11/11 10:33

8 Wind in our Sails – The coming of Europe’s offshore wind energy industry
The coming of Europe’s offshore wind energy industry
15-20t/m²Bearing
25haStorage area
Crane or gantry crane of 1,000tWaterway for 150-200m diameter rotors
>10mWater depth
Quayside length: Quay bearing 15-20t/m²Storage area: 25ha
Waterway for: 150-200m diameter rotors
Water depth: >10m
VESSELSAt least 6 different types of vessels are needed to survey the site, carry components and personnel, install substructure, turbines and substations, lay cables and complete the installation of an offshore wind farm.
ELECTRICAL INFRASTRUCTURE
Total demand 2010: 6 vessels
Total demand 2020: 27.5 vesselsPORTS Two main types of ports:
MANUFACTURINg PORTS: where the
manufacturing facility is closely located to/or at the port and the components are exported
directly to the offshore site.
MObILIzATION PORTS: where the components and turbines are received ready and transported to either
the installation vessels directly or the feeder vessels which take them on the offshore site.
Offshore wind energy is a significant opportunity for ports to counter-balance the downturn hitting traditional activities.
ThE SUPPLY ChAIN wILL dELIVER
- Total installed capacity of 40,000 MW- Annual installations of 6,900 MW- Total electricity production of 148 TWh - Meeting between 4% and 4.2% of total EU electricity demand- Avoiding 102 Mt of CO2 annually- Annual investments in offshore wind turbines of €10.4 billion- Cumulative investments in offshore wind turbines of €65.9 billion in the period 2011-2020
- Total installed capacity of 150,000 MW- Annual installations of 13,700 MW- Total electricity production of 562 TWh - Meeting 13.9% of total EU electricity demand- Avoiding 315 Mt of CO2 in 2030- Annual investments in offshore wind turbines of €17 billion in 2030- Cumulative investments of €145.2 billion from 2021 to 2030
2020
2030
Executive summary
What makes a suitable construction port

Wind in our Sails – The coming of Europe’s offshore wind energy industry 9
FRASTRUCTURE
SUBSTRUCTURES
TURBINES
Substructures present major opportunities for
domestic manufacturing thanks to low technical bar-
riers for entry. Substructure manufacturing also brings
a signifi cant amount of supply chain value as it represents
a large part of the capital expenditure in an offshore wind
farm. It is not essential to have turbine manufacturing to develop
an offshore wind industry.
Types of
substructures:
Four to 12 new wind turbines
models are expected to reach some level of
market readiness in the next decade. Supply of offshore
wind turbines will meet and exceed demand for the next decade,
leading to healthy levels of competition within Europe with the
potential for export.
HAIN WILL DELIVER
d
2002
Rotor diameter:
90 m
3 MW
2007
Rotor diameter:
122 m
5 MW
2013
Rotor diameter:
170 m
10 MW
Spar TLP Jacket
MonopileSpace Frame
(Tripod)
Space Frame
(Jacket)Space Frame
(Tri-pile)
Gravity-based
Structure (GBS)
23420_Offshore report_int_v15.indd 923420_Offshore report_int_v15.indd 9 9/11/11 10:339/11/11 10:33

Photo
: iSto
ck
Photo
: iSto
ck
OFFSHORE WIND POWER MARKET1
Photo
: Dong
1.1 Historical development of offshore wind power in Europe
1.2 Wind power market today
1.3 Market outlook (2011 - 2020, 2020 - 2030)
1.4 Offshore development trends – bigger, deeper and further
1.5 Europe’s fi rst mover advantage
1.6 Offshore wind energy employment and future skill requirements
23420_Offshore report_int_v15.indd 1023420_Offshore report_int_v15.indd 10 9/11/11 10:339/11/11 10:33

Wind in our Sails – The coming of Europe’s offshore wind energy industry 11
Ph
iSk
1.1 Historical development of offshore wind power in EuropeThe fi rst offshore wind farm was inaugurated in 1991,
2.5 km off the Danish coast at Vindeby. Developed by
DONG Energy, it features eleven 450 kW turbines for a
total capacity of 4.95 MW. 20 years later, by the end of
2010, 2,946 MW of offshore wind capacity in 45 wind
farms spread across nine countries were feeding an esti-
mated 10.6 TWh of electricity into the European grid.
Until 2001, the growth of the offshore wind power sector
was irregular and mainly depended on a handful of small
near-shore projects in Danish and Dutch waters featur-
ing wind turbines with a capacity of less than 1 MW.
With 20 turbines and a total capacity of 40 MW, in
2001, the Middelgrunden project in Danish waters
became the fi rst “utility-scale” offshore wind farm.
That same year, seven 1.5 MW turbines were grid con-
nected off Utgrunden in Sweden.
Since the beginning of the decade, new offshore wind
capacity has been going online every year. Moreover,
the share of new offshore wind capacity in total wind
capacity additions has been increasing. In 2001 the
50.5 MW of installed offshore capacity represented
1% of total new European annual wind capacity, the
883 MW installed in 2010 represented 9.5% of the
annual European wind energy market.
FIGURE 1.1 CUMULATIVE OFFSHORE WIND CAPACITY – EU AND NON EU (1991 - 2010)
1991 1992 1993 1994 1995 1996 1997 1998 1999 2000 2001 2002 2003 2004 2005 2006 2007 2008 2009 2010
Cumulative non EU 0 0 0 0 0 0 0 0 0 0 0 0 0 0 0 0 0 0 0 102
Cumulative EU 5 5 5 7 12 29 29 32 32 36 86 256 515 605 695 787 1,106 1,479 2,063 2,946
1,000
2,000
3,000
3,500
2,500
1,500
500
0
MW
Source: EWEA
23420_Offshore report_int_v15.indd 1123420_Offshore report_int_v15.indd 11 9/11/11 10:339/11/11 10:33

Chapter x: name of the chapter
12 Wind in our Sails – The coming of Europe’s offshore wind energy industry
Chapter 1: Offshore wind power market
FIGURE 1.2 ANNUAL OFFSHORE WIND CAPACITY – EU AND NON EU (1991 - 2010)
FIGURE 1.3 NEW OFFSHORE CAPACITY SHARE OF TOTAL NEW WIND POWER CAPACITY IN THE EU
400
600
800
1,000
1,200
MW
Annual non-EU
Annual EU
0
200
1991 1992 1993 1994 1995 1996 1997 1998 1999 2000 2001 2002 2003 2004 2005 2006 2007 2008 2009 2010
0 0 0 0 0 0 0 0 0 0 0 0 0 0 0 0 0 0 0 102
5 0 0 2 5 17 0 3 0 4 51 170 259 90 90 93 318 374 584 883
97.1% 98.5% 98.5%
97.3%
97.5% 95.4%
95.0%90.4%
0.1%
1.1%
2.9%4.8% 1.5%
1.5%
2.7%
2.5% 4.6%
5.0%
9.6%
4,000
6,000
8,000
10,000
12,000
MW
2000 2001 2002 2003 2004 2005 2006 2007 2008 2009 2010
Offshore new annual capacity (MW) 4 51 170 259 90 90 93 318 373 584 883
Total new annual capacity (MW) 3,209 4,428 5,913 5,462 5,838 6,204 7,592 8,535 8,263 10,499 9,332
99.9%
98.9%95.2%
0
2,000
Source: EWEA
Source: EWEA
23420_Offshore report_int_v15.indd 1223420_Offshore report_int_v15.indd 12 9/11/11 10:339/11/11 10:33

Wind in our Sails – The coming of Europe’s offshore wind energy industry 13
1.2 Wind power market today308 new offshore wind turbines, worth some €2.6
billion (20.5% of total EU investments in wind), were
fully grid connected in the EU during 2010, totalling
883 MW in nine separate offshore wind farms. This
is the biggest annual increase in capacity since the
fi rst offshore turbines were installed in 1991 and
a 51% increase compared to the annual market in
2009. Total installed capacity at the end of 2010 was
2,944 MW spread over eight EU Member States, with
a further 2.3 MW as a fl oating turbine operating since
2009 off the coast of Norway.
More than half the total annual capacity (458 MW –
52%) was installed in the UK, which remains the coun-
try with the largest installed offshore capacity in the
world after having overtaken Denmark during the pre-
vious year.
FIGURE 1.4 SHARE OF NEW INSTALLED CAPACITY IN EUROPE IN 2010
Belgium 19%
(165 MW)
Germany 6%
(50 MW)
Finland 0%
(2.3 MW)
United Kingdom 52%
(458 MW)
Denmark 23%
(207 MW)
Source: EWEA
23420_Offshore report_int_v15.indd 1323420_Offshore report_int_v15.indd 13 9/11/11 10:339/11/11 10:33

Chapter x: name of the chapter
14 Wind in our Sails – The coming of Europe’s offshore wind energy industry
Chapter 1: Offshore wind power market
During the fi rst half of 2011 (from 1 January to 30
June), 101 offshore wind turbines were fully grid con-
nected in fi ve wind farms in European waters totalling
348 MW. Total installed capacity at the end of June
2011 reached 3,294 MW.
Overall, 16 offshore wind farms are under construction
in 2011. During the fi rst half of the year, 129 offshore
foundations were installed and a further 108 turbines
were erected but not yet grid connected. Once com-
pleted, the 16 wind farms under construction will have
a total capacity of 5,603 MW.
During the fi rst six months of 2011, the total off-
shore capacity connected to the grid was 4.5% higher
than during the same period the previous year, when
333 MW were connected to the grid. Moreover this
growth was achieved with fewer turbines (17 fewer)
than during the same period in the previous year, indi-
cating a move towards larger machines for offshore
projects.
During 2010, the largest offshore wind farm to date
(300 MW), Thanet, was fully grid connected in British
waters. Furthermore, the fi rst four turbines at BARD
offshore 1 wind farm were grid connected at a dis-
tance of 100 km from the German coast.
In addition to these record-breaking projects, large pro-
jects in Denmark (Rødsand 2) and Belgium (Belwind)
were completed. Moreover, a 0.03 MW experimental
fl oating concept combining wave and wind technolo-
gies (Poseidon) was connected in Danish waters.
A 102 MW offshore wind farm was also grid-connected
in Chinese waters.
2011: annual market passes 1 GW
2010 saw strong market development with a much
larger number of projects beginning construction than
in 2009, under construction, expected to be com-
pleted, or completed during the course of the year.
FIGURE 1.5 EU OFFSHORE WIND POWER CAPACITY CONNECTED TO THE GRID ANNUAL AND CUMULATIVE 2010 - 2011
550
652
estimate
333
348
200
400
600
800
1,000
1,200
First half
Second half
0
200
2010 2011
MW
Source: EWEA
23420_Offshore report_int_v15.indd 1423420_Offshore report_int_v15.indd 14 9/11/11 10:339/11/11 10:33

Wind in our Sails – The coming of Europe’s offshore wind energy industry 15
141 GW and counting…
EWEA has identified 141 GW of offshore wind projects in European waters – either operational, under con-struction, consented, in the consenting phase or pro-posed by project developers or government proposed development zones. This 141 GW shows tremendous developer interest. With 26 GW already operational, under construction or consented, solid progress has been made towards 40 GW of offshore wind by 2020. Moreover, it provides a good indication that EWEA’s expectation that 150 GW of offshore wind power will be operating by 2030 is both accurate and credible.
Depending on the amount of wind power installed onshore, it looks as if Europe’s 2011 offshore market could make up approximately 10% of Europe’s total annual wind capacity market and more than 20% of total European wind farm capital investments, making the offshore industry a significant mainstream energy player in its own right.
EWEA expects a total installed offshore capacity of just under 4,000 MW in Europe by the end of 2011.
Summary of the offshore wind energy market in the EU in 2011
• Total installed capacity of 4,000 MW
• Meeting 0.4% of total EU electricity demand
• Annual installations of 1,000 MW
• Avoiding 9.9 Mt of CO2 annually
• Total electricity production of 14.4 TWh
• Annual investments in wind turbines of €2.8 billion.
PLANNED 114,737 MW
UNDER CONSTRUCTION
5,603 MW
ONLINE 3,295 MW
CONSENTED 17,341 MW
TOTAL EUROPE 140,976 MW
Capa
city
of g
over
nmen
t co
nces
sio
n zon
es or foreseen future tender zones: 73,695 M
WMARKET OUTLOOK
Source: EWEA
FigurE 1.6 ToTal oFFShorE Wind capaciTy inSTallEd, undEr conSTrucTion, conSEnTEd, plannEd aT 30 JunE 2011 and pEr SEa baSin in MW

Chapter x: name of the chapter
16 Wind in our Sails – The coming of Europe’s offshore wind energy industry
Chapter 1: Offshore wind power market
Only four EU Member States with a coastline (Bulgaria,
Lithuania, Romania and Slovenia) have no identifi ed
offshore pipeline, however, it is expected that offshore
wind will be a part of the energy mix in all the Baltic
states over the coming years.
Table 1.1 confi rms that offshore wind energy is cur-
rently most developed amongst the North Sea coun-
tries. The United Kingdom alone represents, on 30
June 2011, almost 45% of total installed capacity
in Europe. By 2020 it is expected that 18 European
countries will have developed offshore capacity.
TABLE 1.1 TOTAL OFFSHORE WIND CAPACITY INSTALLED, UNDER CONSTRUCTION, CONSENTED, PLANNED ON 30 JUNE 2011 AND
SIZE OF GOVERNMENT CONCESSION ZONES OR FORESEEN FUTURE TENDER ZONES IN MW
Online
Under
construction Consented Planned Total projects
Size of government
concession zones
or foreseen future
tender zones
Belgium 195 462 750 450 1,857 2,000
Denmark 854 0 418 1,200 2,471 4,600
Finland 26 0 765 3,502 4,294 n/a
Estonia 0 0 1,000 0 1,000 n/a
France 0 0 0 6,000 6,000 6,000
Germany 195 833 8,725 21,493 31,247 8,000
Greece 0 0 0 4,889 4,889 n/a
Ireland 25 0 1,600 2,155 3,780 n/a
Italy 0 0 162 2,538 2,700 n/a
Latvia 0 0 200 0 200 n/a
Malta 0 0 0 95 95 95
Netherlands 247 0 1,792 3,953 5,992 6,000
Norway 2 0 350 11,042 11,394 n/a
Poland 0 0 0 900 900 n/a
Portugal 0 0 0 478 478 n/a
Spain 0 0 0 6,804 6,804 n/a
Sweden 164 0 991 7,124 8,279 n/a
UK 1,586 4,308 588 42,114 48,596 47,000
Total Europe 3,294 5,603 17,341 114,737 140,976 73,695
23420_Offshore report_int_v15.indd 1623420_Offshore report_int_v15.indd 16 9/11/11 10:339/11/11 10:33

Wind in our Sails – The coming of Europe’s offshore wind energy industry 17
University of Athens, the Commission published new
fi gures in 20105. These expected wind to cover 14.2%
of total electricity consumption in the EU by 2020, with
an installed capacity in 2020 of 55.6 GW offshore
wind power, meeting between 4 and 4.2% of the EU’s
electricity demand. EWEA expects the total installed
offshore wind capacity in 2020 to be 40 GW, up from
just less than 3 GW at the end of 2010.
The 2009 directive also required all Member States
to produce National Renewable Energy Action Plans
(NREAPs) determining the share of each renewable
technology in the energy mix from 2010 to 2020 and,
therefore, setting sectoral objectives. The 27 NREAPs’
combined objective for offshore wind capacity by 2020
is 43.3 GW6. EWEA’s predictions are, thus, for the fi rst
time below those of the national governments.
1.3 Market outlook (2011 - 2020, 2020 - 2030)2011 - 2020
In December 2008 the European Union agreed on
a binding target of 20% renewable energy by 2020.
To meet the 20% target for renewable energy, the
European Commission expected 34%4 of electricity
to come from renewable energy sources by 2020 and
believed that “wind could contribute 12% of EU elec-
tricity by 2020”.
Not least due to the 2009 Renewable Energy Directive
and the 27 mandatory national renewable energy
targets, the Commission’s expectations for 2020
were increased. Based on the PRIMES energy model
developed by the E3M Lab at the National Technical
4 European Commission, 2006. ‘Renewable Energy Roadmap’, COM (2006) 848 fi nal.5 “Energy trends to 2030 - 2009 update”. European Commission, 2010.6 Belgium did not provide separate fi gures for onshore and offshore wind capacity to the Commission. Information subsequently
obtained by EWEA indicates that Belgium’s offshore wind energy target for 2020 determined in light of the NREAP exercise is
2,000 MW.
FIGURE 1.7 PROJECTED CUMULATIVE OFFSHORE WIND CAPACITY (EWEA AND NATIONAL RENEWABLE ENERGY ACTION PLANS)
2011 2012 2013 2014 2015 2016 2017 2018 2019 2020
EWEA 3.9 5.3 8.1 10.9 14.0 17.4 21.6 26.7 33.1 40.0
NREAPs 3.7 5.8 9.1 12.4 15.6 20.4 25.8 31.1 36.8 43.3
5
0
10
15
20
25
30
35
40
45
50
GW
Source: EWEA
23420_Offshore report_int_v15.indd 1723420_Offshore report_int_v15.indd 17 9/11/11 10:339/11/11 10:33

Chapter x: name of the chapter
18 Wind in our Sails – The coming of Europe’s offshore wind energy industry
Chapter 1: Offshore wind power market
EWEA’s projected growth of offshore wind energy
resembles the growth witnessed in the onshore sector
at a similar time in the industry’s development. Figure
1.8 compares EWEA’s assumed offshore development
to the actual development of onshore wind capacity
from 1995 to 2005.
The reasons for the discrepancy between EWEA’s pre-
dictions and those of the EU Member States include
the fact that EWEA has always made conservative
forecasts in terms of installed wind energy capacity,
but are also strongly linked to the need for additional
R&D in offshore wind energy, for steadier fi nancing,
and for an updated, European power grid to transport
the electricity produced in the seas.
FIGURE 1.8 HISTORICAL ONSHORE GROWTH (1995 - 2005) COMPARED TO EWEA'S OFFSHORE PROJECTION (2010 - 2020)
1995 /
2010
1996 /
2011
1997 /
2012
1998 /
2013
1999 /
2014
2000 /
2015
2001 /
2016
2002 /
2017
2003 /
2018
2004 /
2019
2005 /
2020
Onshore 2.5 3.4 4.7 6.4 9.6 12.9 17.2 22.8 28.0 33.8 39.8
Offshore 2.9 3.9 5.3 8.1 10.9 14.0 17.4 21.6 26.7 33.1 40.0
5
0
10
15
20
25
30
35
40
45
GW
Source: EWEA
23420_Offshore report_int_v15.indd 1823420_Offshore report_int_v15.indd 18 9/11/11 10:339/11/11 10:33

Wind in our Sails – The coming of Europe’s offshore wind energy industry 19
exceed the offshore market in the EU. In 2010, off-
shore made up 9.5% of the annual wind energy mar-
ket. By 2020, offshore will make up 28% of the annual
wind energy market.
Annual installations
Between 2011 and 2020, EWEA expects the annual
offshore market for wind turbines to grow steadily
from 1 GW in 2011 to 6.9 GW in 2020. Throughout
this period, the market for onshore wind turbines will
FIGURE 1.9 OFFSHORE WIND POWER ANNUAL (LEFT) AND CUMULATIVE (RIGHT) INSTALLATIONS 2010 - 2020
15
20
25
30
35
40
45
3
4
5
6
7
8
GW
GW
2011 2012 2013 2014 2015 2016 2017 2018 2019 2020
Annual 1.0 1.4 2.8 2.9 3.1 3.4 4.1 5.1 6.4 6.9
Cumulative 3.9 5.3 8.1 10.9 14.0 17.4 21.6 26.7 33.1 40.0
0
5
10
1
0
2
Source: EWEA
23420_Offshore report_int_v15.indd 1923420_Offshore report_int_v15.indd 19 9/11/11 10:339/11/11 10:33

Chapter x: name of the chapter
20 Wind in our Sails – The coming of Europe’s offshore wind energy industry
Chapter 1: Offshore wind power market
quarter of Europe’s wind energy would be produced
offshore in 2020, according to EWEA’s scenarios.
Including onshore, wind energy would produce
581 TWh, enough to meet between 15.7% and 16.5%
of total EU electricity demand by 2020.
Wind energy production
The 40 GW of installed capacity in 2020 would pro-
duce 148 TWh of electricity, equal to between 4% and
4.2% of EU electricity consumption, depending on the
development in electricity demand7. Approximately a
7 EWEA forecasts a total installed wind capacity of 230 GW in 2020 producing 581 TWh of electricity, with the 40 GW offshore
contributing 148 TWh.
FIGURE 1.10 OFFSHORE WIND ELECTRICITY PRODUCTION 2010 - 2020
20
0
40
60
80
100
120
140
160
2011 2012 2013 2014 2015 2016 2017 2018 2019 2020
TWh
14.2 19.129.1
39.550.6
63.278.3
97.1
120.5
148.2
Source: EWEA
23420_Offshore report_int_v15.indd 2023420_Offshore report_int_v15.indd 20 9/11/11 10:339/11/11 10:33

Wind in our Sails – The coming of Europe’s offshore wind energy industry 21
Offshore wind power investments
Annual investments in offshore wind power are
expected to increase from €2.8 billion in 2011 to
€10.4 billion in 2020.
FIGURE 1.11 ANNUAL AND CUMULATIVE INVESTMENTS IN OFFSHORE WIND POWER 2010 - 2020
20
30
40
50
60
70
4
6
8
10
12
€ b
illio
n
20
10
€ b
illio
n
20
10
2011 2012 2013 2014 2015 2016 2017 2018 2019 2020
Annual 2.8 3.5 6.2 5.9 5.9 6.2 7 8.2 9.9 10.4
Cumulative 2.8 6.2 12.4 18.3 24.2 30.4 37.4 45.6 55.5 65.9
0
10
20
2
0
Source: EWEA
23420_Offshore report_int_v15.indd 2123420_Offshore report_int_v15.indd 21 9/11/11 10:339/11/11 10:33

Chapter x: name of the chapter
22 Wind in our Sails – The coming of Europe’s offshore wind energy industry
Chapter 1: Offshore wind power market
Avoiding climate changeIn 2011, offshore wind power will avoid the emission of 9.8 million tonnes (Mt) of CO2, a figure that will rise to 102.1 Mt in 2020.
FigurE 1.12 CO2 EmiSSiOnS avOidEd by OFFShOrE Wind
20
0
40
60
80
100
120
2011 2012 2013 2014 2015 2016 2017 2018 2019 2020
Mt
9.8 13.2 20.027.2
34.943.5
53.9
66.9
83.0
102.1
Source: EWEA
Summary of the offshore wind energy market in the EU in 2020
• Total installed capacity of 40,000 MW
• Meeting between 4% and 4.2% of total EU electricity demand
• Annual installations of 6,900 MW
• Avoiding 102 Mt of CO2 annually
• Total electricity production of 148 TWh
• Annual investments in offshore wind turbines of €10.4 billion
• Cumulative investments in offshore wind turbines of €65.9 billion in the period 2011 - 2020.

Wind in our Sails – The coming of Europe’s offshore wind energy industry 23
2021 - 2030
Annual installations
Between 2021 and 2030, the annual offshore market
for wind turbines is estimated to grow steadily from
7.8 GW in 2021 to reach 13.7 GW in 2030. 2027 would
be the fi rst year in which the market for offshore wind
turbines (in MW) exceeds the onshore market in the EU.
60
80
100
120
140
160
6
8
10
12
14
16
GW
GW
0
20
40
2
0
4
2021 2022 2023 2024 2025 2026 2027 2028 2029 2030
Annual 7.8 8.5 9.1 9.6 10.5 11.5 12.4 13.0 13.2 13.7
Cumulative 47.7 56.2 65.5 75.6 86.5 98.1 110.4 123.2 136.4 150.0
FIGURE 1.13 OFFSHORE WIND POWER ANNUAL (LEFT) AND CUMULATIVE (RIGHT) INSTALLATIONS (2021 - 2030)
Source: EWEA
23420_Offshore report_int_v15.indd 2323420_Offshore report_int_v15.indd 23 9/11/11 10:339/11/11 10:33

Chapter x: name of the chapter
24 Wind in our Sails – The coming of Europe’s offshore wind energy industry
Chapter 1: Offshore wind power market
electricity would be produced offshore in 20308. An
additional 591 TWh would be produced onshore, bring-
ing wind energy’s total share to 28.5% of EU electric-
ity demand.
Wind energy production
The 150 GW of installed capacity in 2030 would pro-
duce 562 TWh of electricity, equal to 13.9% of EU elec-
tricity consumption, depending on the development in
demand for power. Approximately half of Europe’s wind
8 The 400 GW of wind power operating in 2030 would produce 1,154 TWh of electricity, with the 150 GW offshore contributing
562 TWh.
FIGURE 1.14 ONSHORE AND OFFSHORE WIND ELECTRICITY PRODUCTION 2021 - 2030
462 489 514 534 550 562 571 579 586 591
177209
244281
322366
412461
511562
0
200
400
600
800
1,000
1,200
1,400
2021 2022 2023 2024 2025 2026 2027 2028 2029 2030
TWh
Onshore Offshore
Source: EWEA
23420_Offshore report_int_v15.indd 2423420_Offshore report_int_v15.indd 24 9/11/11 10:339/11/11 10:33

Wind in our Sails – The coming of Europe’s offshore wind energy industry 25
Offshore wind power investments
Annual investments in offshore wind power are
expected to increase from €11.5 billion in 2021 to
€17 billion in 2030.
FIGURE 1.15 ANNUAL (LEFT) AND CUMULATIVE (RIGHT) INVESTMENTS IN OFFSHORE WIND POWER
100
150
200
250
6
8
10
12
14
16
18
€ b
illio
n 2
01
0
€ b
illio
n 2
01
0
0
50
2
0
4
6
2021 2022 2023 2024 2025 2026 2027 2028 2029 2030
Annual Cumulative
Source: EWEA
23420_Offshore report_int_v15.indd 2523420_Offshore report_int_v15.indd 25 9/11/11 10:339/11/11 10:33

Chapter x: name of the chapter
26 Wind in our Sails – The coming of Europe’s offshore wind energy industry
Chapter 1: Offshore wind power market
Avoiding climate change
In 2021, offshore wind power will avoid the emission
of 104 Mt CO2, a fi gure that will rise to 315 Mt CO
2 in
the year 2030.
FIGURE 1.16 ANNUAL (LEFT) AND CUMULATIVE (RIGHT) AVOIDED CO2 EMISSIONS 2021 - 2030
1,500
2,000
2,500
3,000
150
200
250
300
350
Mt
Mt
0
500
1,000
50
0
100
2021 2022 2023 2024 2025 2026 2027 2028 2029 2030
Annual Cumulative
Source: EWEA
Summary of the offshore wind energy market in the EU in 2030
• Total installed capacity of 150,000 MW
• Annual installations of 13,700 MW
• Total electricity production of 562 TWh
• Meeting 13.9% of total EU electricity demand
• Avoiding 315 Mt of CO2 in 2030
• Annual investments in offshore wind turbines of €17 billion in 2030
• Cumulative investments of €145.2 billion from 2021 to 2030.
23420_Offshore report_int_v15.indd 2623420_Offshore report_int_v15.indd 26 9/11/11 10:339/11/11 10:33

Wind in our Sails – The coming of Europe’s offshore wind energy industry 27
1.4 Offshore development trends – bigger, deeper and furtherAs the technology develops, valuable experience is
being gained and the offshore wind industry is moving
into deeper waters, further from the shore with bigger
farms. Looking at the online wind farms along with
the ones under construction and already consented,
the following graph represents the current trends in
distances to shore and water depths.
The wind farms that are already operating are con-
centrated in the 20x20 zone (up to 20 km from
shore and in water depths of up to 20 metres). The
majority of future offshore wind farms will be big-
ger in terms of capacity (bubble size in Figure 1.17),
going into deeper waters and certainly moving fur-
ther away from the shore.
Figure 1.18 presents offshore wind farms planned for
development after 2015.
Figure 1.18 shows that the offshore wind projects
planned for post 2015 are expected to be built in
deeper waters and further from shore than existing
projects and projects planned to go online before
2015. The following analysis identifi es the trends,
based on the information in Figures 1.17 and 1.18.
<20 km - <20 m
The majority of the wind farms that have come on
line to date have been built 20 km or less from the
shore and in up to 20 m of water depth. A large
amount of planned projects is also to be developed
in this area.
<60 km - <60 m
A large amount of consented and under construction
offshore wind farms are already located in depths up
to 60 m and up to 60 km from shore (Figure 1.17).
Figure 1.18 indicates that a signifi cant number of the
planned wind farms fall into this category as well.
>60 km - <60 m
Far offshore development, which includes current
development zones (those illustrated in fi gs 1.17 and
1.18 are mainly in Germany but will include in the
future the UK’s Round 3), is characterised by farms
far from shore (more than 60km), which will ideally
be connected to offshore supernodes9, with a water
depth generally between 20 m and 60 m. Both Figures
1.17 and 1.18 illustrate this trend.
<60 km - >60 m
Deep offshore wind farms are planned (Figure 1.18)
and consist of new concepts using fl oating platform
technologies during the course of the next decade.
9 Multi-terminal HVDC station.
23420_Offshore report_int_v15.indd 2723420_Offshore report_int_v15.indd 27 9/11/11 10:339/11/11 10:33

Chapter x: name of the chapter
28 Wind in our Sails – The coming of Europe’s offshore wind energy industry
Chapter 1: Offshore wind power market
To be provided by Ewea
FIGURE 1.18 DISTANCE AND DEPTH OF PLANNED OFFSHORE WIND FARMS
Water depth (m)
Dis
tanc
e to
sho
re (
km)
0
60
40
20
80
100
140
160
200
120
180
0 60 120 180
Source: EWEA
FIGURE 1.17 DISTANCE AND DEPTH OF ONLINE, CONSENTED AND UNDER CONSTRUCTION OFFSHORE WIND FARMS
Under construction ConsentedOnline excluding Hywind
Water depth (m)
Dis
tanc
e to
sho
re (
km)
0
20
40
60
80
100
0 10 20 30 40 50 60
Source: EWEA
23420_Offshore report_int_v15.indd 2823420_Offshore report_int_v15.indd 28 9/11/11 10:339/11/11 10:33

Wind in our Sails – The coming of Europe’s offshore wind energy industry 29
In February 2011, the Department of Energy (DOE)
announced $50.5 million (€35.4 million) to support
the joint national strategy to accelerate the develop-
ment of the US offshore wind power industry, agreed
between the Secretary of Interior and the Secretary of
Energy. In this context at least nine projects have been
proposed, totalling 2,322 MW (Figure 1.20).
Three of the proposed projects (NRG Bluewater Wind
in Delaware, Deepwater wind in Rhode Island and
Cape Wind in Massachusetts) have already signed
power purchase agreements.
1.5 Europe’s fi rst mover advantageCurrently all major operational offshore wind farms
are in European waters with the exception of the fi rst
Chinese offshore wind farm in Shanghai, with a capac-
ity of 102 MW. The development of offshore wind
energy globally creates signifi cant opportunities for
European companies, from manufacturers to develop-
ers, to expand their activities beyond European waters.
The United States
In the US, no offshore projects have been built to date.
Political support is slowly growing but planning, siting
and permitting procedures are still a challenge. Policy
developments show a clear trend in boosting offshore
wind development10.
In June 2010, the US Department of the Interior (DOI)
signed a Memorandum of Understanding together with
the governors of ten coastal states11 and formed the
Atlantic Offshore Wind Consortium. Its principle aim
is to facilitate the co-ordination of offshore develop-
ment off the eastern coast. In addition, in late 2009,
the DOI’s Bureau of Ocean Energy Management,
Regulation and Enforcement (BOEMRE) formed renew-
able energy task forces in several coastal states.
In 2010, the task forces in Maryland, Delaware and
Massachusetts published Requests for Information
(RFI) to measure the commercial interest in desig-
nated areas for offshore development. In April 2010,
the Cape Wind project in Massachusetts became the
fi rst proposed offshore wind farm to obtain fi nal fed-
eral regulatory approval from the BOEMRE and the
fi nal lease was issued in October. The “Smart from
the Start” initiative was announced in November 2010
from the DOI, aiming at shortening the federal off-
shore permitting process. Following that, in February
2011, BOEMRE defi ned four areas for potential wind
energy development in the mid-Atlantic for public com-
ments shown in Figure 1.19.
10 Information based on: U.S. Department of Energy’s “2010 Wind Technologies Market Report.”11 Maine, New Hampshire, Massachusetts, Rhode Island, New York, New Jersey, Delaware, Maryland, Virginia and North Carolina.
FIGURE 1.19 MID-ATLANTIC WIND ENERGY AREAS UNDER
CONSIDERATION BY BOEMRE
Pennsylvania
New Jersey
Dover
Delaware
Maryland
Virginia
Virgin
ia
Atlantic
City
Ocean
City
Virginia
Beach
Delaware
Bay
Chesapeake
Bay
Wilmington
New Jersey
Delaware
Maryland
Virginia
Nautical miles
Legend:
0 10 20 30
Source: US Department of Energy’s
“2010 Wind Technologies Market Report”
23420_Offshore report_int_v15.indd 2923420_Offshore report_int_v15.indd 29 9/11/11 10:339/11/11 10:33

Chapter x: name of the chapter
30 Wind in our Sails – The coming of Europe’s offshore wind energy industry
Chapter 1: Offshore wind power market
mainly in the north and western areas of the country where the wind resource is biggest.
However, the main centres of electricity consumption are in the eastern and other coastal areas. The need to overcome this grid bottleneck has pushed the devel-opment of offshore wind farms off the coasts near the main consumption areas.
The first commercial offshore wind farm in China, the 102 MW Donghai Daqiao offshore wind project, came online in June 2010. Located off Shanghai City, it is composed of 34 3 MW Sinovel turbines. The closest turbine to shore is situated 6 km out to sea and the furthest at 13 km.
China is also developing a number of near-shore projects in its vast intertidal areas. The advantage of exploiting inter-tidal sites is shallow waters with water depths of seldom more than five metres. Three
FigurE 1.20 ProPoSEd oFFShorE Wind Farm ProjEcTS in an advancEd STaTE oF dEvEloPmEnT
State waters
Federal waters
Cape Wind (MA)Deepwater Wind (RI)
Bluewater Wind (NJ)Garden State Offshore Energy (NJ)
Coastal Point Energy (TX)
Fisherman’s Energy (NJ)Fisherman’s Energy (NJ)Bluewater Wind (DE)
LEEDCo (OH)
Legend:
1,200
1,000
800
600
400
200
0NJ MA DE TX RI OH
1,055
OFFSHORE WIND ENERGY PROPOSED NAMEPLATE CAPACITY BY STATE
468 450
300
20
MW
29
Source: US Department of Energy’s “2010 Wind Technologies Market Report”
In addition to the proposed projects, a major devel-opment on the infrastructure side came in October 2010. According to the recent US DOE report for wind technologies, a $5 billion transmission project was announced by Trans-Elect. The Atlantic Wind Connection project received financial support from Google, Good Energies and Marubeni Corporation. This transmission line will be underwater and will be built in five phases. The final capacity is expected to be as much as 7,000 MW. It will connect Virginia to northern New Jersey and possibly New York City. During the first phase a line will connect Northern New Jersey with southern Delaware with a 2,000 MW capacity and it is expected to be built by 2016.
China China has put great emphasis on offshore develop-ment in the past two years. The wind base programme started in 2008, aiming at developing some 70 GW of wind power by 2020. Onshore wind development is

Wind in our Sails – The coming of Europe’s offshore wind energy industry 31
The tender winners are all domestic utilities, as the
rules stipulate that only Chinese companies (at least
51% share owned by Chinese company) can partici-
pate in the process. The turbine suppliers are Sinovel
(3 MW model), Goldwind (2.5 MW model) and Shanghai
Electric (3.6 MW model).
The second round of offshore concession tenders is
planned for the second half of 2011, for a capacity
totalling 200 MW.
Offshore wind starting elsewhere in Asia
The Korean government has announced an offshore
wind energy strategy to attract investments worth
around €6 billion to develop offshore wind farms
with a total capacity of 2.5 GW during this decade.
The government is aiming to set up a private-public
partnership (PPP) to install about 500 turbines off
the country’s west coast. Under this PPP 100 MW of
wind projects should be operational by 2013, a fur-
ther 900 MW by 2016 and the fi nal 1.5 GW by 2016.
Moreover, local governments are promoting another
4.5 GW of offshore wind projects across the country.
In the aftermath of events at Fukushima, Japan is step-
ping up its efforts to develop renewables. Offshore
wind is seen as a key technology despite the challeng-
ing sea environment off the Japanese coasts. Japan
has already some 25 MW of offshore projects, near
shore, with the fi rst turbines operating since 2003. In
2011 a senior government panel developed plans for
a 1 GW offshore wind farm to be operational by 2020.
An initial fi ve year programme should fund six or more
fl oating turbines off the North Eastern coast as a fi rst
step towards the larger project.
inter-tidal projects have already been built in China:
Rudong (30 MW), Jiangsu Xiangshui (6 MW) and
Shandong Rongcheng (6 MW).
Moreover, the 30 MW Rudong intertidal project is a
demonstration project in which nine different tur-
bine models are being tested, mainly from Chinese
manufacturers.
Policy development
The eleventh Five Year plan for energy and renewable
energy, which is currently under development, has a
tentative offshore wind development target of 5 GW by
2015 and 30 GW by 2020.
In 2010, the National Energy Administration (NEA) and
the State Oceanic Administration (SOA) jointly issued
“Offshore project development interim management
rules”. They stipulate that offshore projects will be
authorised on the basis of concession tenders to
determine the tariff.
In July 2011, a new policy was issued by the NEA and
SOA: “Detailed rules for offshore project develop-
ment”. This stipulates that offshore projects should
be at least 10 km from the shore and in water depths
of no less than 10 metres. These rules aim to mini-
mise confl icts with other sea uses such as fi shing and
aquaculture. Consequently, the scope for developing
intertidal projects further will be limited.
The fi rst offshore concession tender in 2010
In May 2010, the fi rst round of tenders took place
for four wind farms totalling 100MW, all located in
Jiangsu province. Two of the projects are intertidal the
other two are further offshore.
The tariffs retained range from 624 RMB/MWh (€73/
MWh) to 737 RMB/MWh (€87MWh). Compared to the
onshore tariff of RMB 510 (€60) to RMB 64O (€75)
per MWh, the offshore bids are quite low.
23420_Offshore report_int_v15.indd 3123420_Offshore report_int_v15.indd 31 9/11/11 10:339/11/11 10:33

Chapter x: name of the chapter
32 Wind in our Sails – The coming of Europe’s offshore wind energy industry
Chapter 1: Offshore wind power market
faces a shortage of skilled labour, notably engineers,
O&M technicians and project managers, and that this
is an area which needs addressing.
Institutes in both Germany and the UK – the two coun-
tries expected to lead European offshore wind develop-
ment during the next decade – have taken measures to
address this shortage through training programmes. In
Germany the Education Centre for Renewable Energies
(BZEE) founded in 2000 by the German Wind Energy
Association (BWE), the Chamber of Industry and
Commerce in Flensburg and wind energy enterprises
in northern Germany, provides a number of special-
ised training courses. The institute recently developed
a qualifi cation programme dedicated to the service
and maintenance of offshore wind farms13. In the UK
a similar collaboration between industry, government
bodies and Narec, the UK National Renewable Energy
centre for renewable energy development and testing,
has resulted in the opening of a new training tower.
This is designed to provide academic and industrial
training programmes for technicians in the wind indus-
try, with a strong focus on the offshore sector14.
The University of Aalborg in Denmark has been a fore-
runner in offering academic programmes focused on
wind energy including a dedicated Master’s course in
wind energy as well as other related on-site training
possibilities.
Over the last three years the POWER Cluster project
(Pushing Offshore Wind Energy Regions), the direct
successor of the North Sea Region (NSR) Interreg IIIB’s
programme POWER project, has been running. The pro-
ject comprises eighteen partners from six countries:
Germany, the UK, Denmark the Netherlands, Norway
and Sweden15. As part of its objectives, the project
has been tackling the problem of missing specialists
1.6 Offshore wind energy employment and future skill requirementsOffshore wind employment
Historically, the principal political drivers for the deploy-
ment of renewable energy in many countries were the
twin pillars of climate change objectives and energy
security – the former being infl uenced through inter-
national agreements notably within the UNFCCC and
more stringently through the EU with the 20% renew-
able energy by 2020 target. However the fi nancial cri-
sis of 2008 - 2009 and the resultant recession are
adding industrial development, export potentials and
employment opportunities associated with renewable
energy as a primary motivation for promoting renew-
able energy development.
The potential rewards are vast – EWEA estimates that
the wind energy sector in Europe will create around
273,000 direct and indirect new jobs over the next
decade, taking the industry to a total of approximately
462,000 direct and indirect jobs by 202012. The cor-
responding fi gures for the offshore sector alone are
134,000 and 169,500 respectively, highlighting the
fast increasing importance of offshore development
within the broader wind industry in Europe. By 2030,
around 480,000 people are expected to be employed
in the sector, around 300,000 of whom in the offshore
sector (almost 62% of the total).
Requirements for future
Very high growth rates are expected in the offshore
wind sector over the next decade, therefore this will
create huge demand for appropriately skilled staff.
There is general agreement in the industry that it
12 EWEA Pure Power 2011 report, http://www.ewea.org/fi leadmin/ewea_documents/documents/publications/reports/Pure_Power_III.pdf13 http://www.wwindea.org/technology/ch03/en/3_5_1.html 14 http://www.narec.co.uk/media/news/n/successful_collaboration_launches_new_wind_training_facility_in_the_north_east15 http://www.power-cluster.net/AboutPOWERcluster/tabid/587/Default.aspx
23420_Offshore report_int_v15.indd 3223420_Offshore report_int_v15.indd 32 9/11/11 10:339/11/11 10:33

Wind in our Sails – The coming of Europe’s offshore wind energy industry 33
Scotland. There are signifi cant skill-set cross-over
opportunities with the wind industry as noted by ref-
erence to the oil and gas sector at numerous points
within this report. Specifi cally, the transfer of Health,
Safety and Environment (HSE) skills from this sector
are likely to be required.
However in order to prevent skills shortages severely
impacting offshore wind farm development, fur-
ther measures to provide training courses and edu-
cation for engineers and technical staff need to be
addressed by industry, universities and policy-makers
across Europe.
in offshore wind by promoting career opportunities
to young people and students and facilitating quali-
fi cation pathways. A sister project named the “South
Baltic OFF.E.R.” project (South Baltic Offshore Wind
Energy Regions) was initiated in 2010 and is due for
completion in February 2013. Part of the project is
specifi cally aimed at enhancing educational possibili-
ties in offshore wind and generating opportunities in
the wind industry for highly qualifi ed workers.
Further potential exists for the transfer of skills from
the oil & gas sector in areas expected to see declin-
ing demand for their services, such as Aberdeen in
23420_Offshore report_int_v15.indd 3323420_Offshore report_int_v15.indd 33 9/11/11 10:339/11/11 10:33

SUPPLY CHAIN – INTRODUCTION2
Photo
: Offs
hore
sta
toil
2.1 Contracting trends
2.2 Scope allocation
2.3 Location of key players
23420_Offshore report_int_v15.indd 3423420_Offshore report_int_v15.indd 34 9/11/11 10:339/11/11 10:33

Wind in our Sails – The coming of Europe’s offshore wind energy industry 35
The remainder of this chapter provides an overview
of the history and current status of the supply chain
for the offshore wind power industries, as well as
anticipated future trends for each of the key sub-
sectors: wind turbines, substructures, electrical sys-
tems, installation vessels and ports.
2.1 Contracting trendsUnlike more mature sectors such as the automotive
industry and indeed onshore wind, the offshore wind
supply chain is currently fl exible in terms of both par-
ticipants and contracting structures. The following
section is intended to provide a snapshot of the con-
tracting landscape in order to characterise the type of
companies involved in the supply chain and the rela-
tionships between them.
A potted history of contracting structures within the
offshore wind sector is given below.
2000 - 2004: “Engineer-Procure-Construct-
Install” contracts (EPCI) the norm
The majority of early commercial offshore wind pro-
jects were contracted on the basis of a single major
construction contract under an EPCI (Engineer-
Procure-Construct-Install) arrangement. The wind tur-
bine manufacturers were the turnkey counterparty in
these cases, usually via a joint venture with a marine
contractor. These offers coincided with high levels of
early competition as the supply chain fought for early-
mover advantage in this promising new industry.
2004 - 2010: switch to multi-contracting
Whether due to a deliberate policy of 'loss-leading' or
inadvertent cost optimism, it is considered unlikely
that the principal contractors turned a profi t on the
preceding early engagements. Evidence for this is
demonstrated through the subsequent insolvency or
buy-outs of several key second level contractors –
notable examples including Dutch Sea Cable, CNS
Renewables, Mayfl ower Energy and more recently
The supply chain for the offshore wind industry is
evolving rapidly. The market promise underpinned by
ambitious national programmes, particularly in the UK
and Germany, has sparked an enormous volume of
industrial interest as well as a signifi cant amount of
new investment in plant and facilities. This burst of
activity should be set against the backdrop of a reces-
sionary climate in other industries, which has histori-
cally been responsible for the diversion of investment
and supply chain resources from offshore wind.
Contracting practices have also shifted signifi cantly
in the last few years, perhaps in part as a result of
the changes in the available companies in the supply
chain mix. The emergence of larger, more fi nancially
sound contracting partners who are willing to take on
a broader scope of supply within an individual project
is seen as a positive development from the perspec-
tive of investor confi dence. Also, perhaps for the fi rst
time, these developments offer the real possibility of
the widely discussed cross fertilisation of skills and
knowledge from the offshore oil and gas sector to
come to fruition.
Increased levels of competition within the supply
chain are observed as a result of new capacity and
companies becoming engaged in the industry. In the
short term, this is likely to help stabilise capital pricing
of projects with the prospect of signifi cant further sav-
ings through scale, learning and innovation effects so
long as competition levels remain healthy. Clearly this
trend should be set against the increased technical
challenges associated with moving further from shore
and in to deeper waters. New approaches and tech-
nologies will be required in order to meet these chal-
lenges, and as explored in this chapter, there is strong
evidence that the supply chain is responding through
investment in innovation.
We are also witnessing the development of more
long-term commercial partnerships between some
of the leading project developers and their supply
chain. This brings greater certainty and continuity to
the industry.
23420_Offshore report_int_v15.indd 3523420_Offshore report_int_v15.indd 35 9/11/11 10:339/11/11 10:33

Chapter x: name of the chapter
36 Wind in our Sails – The coming of Europe’s offshore wind energy industry
Chapter 2: Supply chain – Introduction
take the view that they are better off under this more
fl exible regime, given the associated expected cost-
reduction potential of having a more experienced and
comprehensive management.
To summarise, increasing levels of fl exibility are
available to the industry when considering contrac-
tual practise as supply chain participation and com-
petition increase. These trends are summarised in
Figure 2.1 opposite, with the slices representing the
approximate relative size and number of major con-
struction contracts for a typical offshore wind project
in each period.
Company types
Participants in the upper levels of the offshore wind
supply chain can generally be put into eight main cat-
egories, as follows:
1. Wind turbine manufacturers – responsible for sup-
plying wind turbines, with a broader scope of work
in some instances.
3. Structural manufacturers – responsible for manu-
facturing substructures and foundations for the
wind turbines, and possibly also the offshore
sub-stations.
4. Electrical equipment suppliers – responsible for the
electrical system design and for supplying all electri-
cal equipment for onshore and offshore substations.
5. Marine contractors – responsible for various aspects
of offshore installation including one or more of the
following: wind turbines, wind turbine substructures
and offshore substation foundation / topsides.
6. Cable suppliers – responsible for at least supply of
export or array cables with partial market segmen-
tation into these two categories, which are typically
demarcated at ~50kV.
7. Cable installers – niche marine contractors respon-
sible for array and export cable installation.
Oceanteam and Subocean. In some cases these
failures may have been caused by inappropriate risk
allocation through the supply chain. This early nega-
tive experience led to the withdrawal of EPCI contract
offers by the leading wind turbine suppliers for future
projects in 2004, as the full extent of the offshore con-
struction risks were recognised as being outside of
core competencies. The consequent switch to multi-
contracting caused a loss of early momentum in the
industry as project developers were forced to readjust
to the challenge of managing and delivering complex
construction projects involving many contracts.
2010 - 2012: trend towards larger contracts
Primarily due to increasing levels of competition within
the supply chain, we are now beginning to see an
increased appetite from suppliers for a broader scope
of work. The increased involvement of large civil engi-
neering and oil and gas multinationals is one of the
key drivers of this trend, as explored later in the chap-
ter. In addition, the increased reliance on more risk-
adverse capital such as pre-construction non-recourse
project fi nance is also driving procurement towards
fewer, larger contracts, as developers seek to mini-
mise interface risk.
>2012: re-emergence of EPCI?
A logical extension of the trend described above would
be the re-emergence of full EPCI contracts, perhaps via
joint ventures between the plant contractors – which
are more numerous – and the wind turbine manufac-
turers. Interestingly this would mean the contracting
environment for offshore wind had come full circle in
about a decade. Given the commercial and technical
lessons learnt over the last 10 years, it may be argued
that the industry is now mature enough for turnkey
contracting. However, it should be noted that given
the investment that leading developers have made in
acquiring the required skills and commercial appetite
to meet the multi-contracting challenge, some may
23420_Offshore report_int_v15.indd 3623420_Offshore report_int_v15.indd 36 9/11/11 10:339/11/11 10:33

Wind in our Sails – The coming of Europe’s offshore wind energy industry 37
(primarily for foundation design), certifi cation authori-
ties, project management companies, Health & Safety
consultants, marine warranty surveyors, insurance
providers and other minor contractors. The position of
any individual company amongst the above mentioned
categories within the value-chain is highly uncertain,
with a wide variety of approaches to procurement
strategy being adopted to date, as illustrated in Figure
2.2. In this context "Level" refers to the position of
the entity in question in the contracting hierarchy e.g.
Level 1 represents a direct contractual relationship
with the project owner, Level 2 a sub-contract let by a
Level 1 supplier, and so on.
8. EPCI contractors – large construction fi rms or joint
ventures between parties from one or more of the
above categories taking responsibility for a broader
scope of work, in some cases comprising the vast
majority of the capital spend.
9. Port operators – various private port companies
and publically owned harbours providing facilities
for manufacturing and/or assembly, acting as a mo-
bilisation port for the construction phase and as
base for operation and maintenance during the life-
time of the projects.
In addition to these main categories, smaller con-
tract lots will be awarded to specialist design houses
FIGURE 2.1. ILLUSTRATION OF TRENDS IN CONTRACTUAL PRACTISE
Source: GL Garrad Hassan
2002
• OEMs as turnkey providers
• Early competition
(market positioning)
• Low prices
• DONG the exception
2007
• Fingers burnt
• Complete withdrawal of
turnkey approach
• Owners forced towards
multi-contracting
2011
• Risks better understood
by supply chain
• New entrants offering
larger scope
• Some owners utilising
multi-contracting ability
2013?
• WTG OEMs more comfortable
with larger scope (again)
• Large BoP players offering
wrapped solutions
Approximate relative size and number of major construction contracts:
23420_Offshore report_int_v15.indd 3723420_Offshore report_int_v15.indd 37 9/11/11 10:339/11/11 10:33

Chapter x: name of the chapter
38 Wind in our Sails – The coming of Europe’s offshore wind energy industry
Chapter 2: Supply chain – Introduction
This fl uid picture is primarily a symptom of the relative
immaturity of the offshore wind industry which may be
contrasted with the relatively stable and well-defi ned
supply chain for mature sectors, such as the automo-
tive industry, for example.
FIGURE 2.2. A FLUID SUPPLY CHAIN – INCUMBENT AND NEW ENTRANT SUPPLIERS
Source: GL Garrad Hassan
Wind turbine manufacturers
Structural fabricators
Electrical suppliers
Marine contractors
Cable suppliers
Cable installers
EPCI contractors
Port operators
Example
incumbents
Siemens,
Vestas,
REpower,
Areva
SIF,
Smulders,
Bladt, EEW,
Weserwind,
BiFAB, Aker
ABB,
Siemens
Energy,
Alstom Grid
A2Sea,
MPI, SHL,
Geosea
Nexans,
Prysmian,
ABB NKT,
Scanrope
Technip,
CT Offshore,
Global
Marine,
Visser&Smit
Fluor,
Van Oord,
ABJV, MT
Hojgaard,
DEME
Various
Example
new
entrants
BARD, GE,
Doosan,
Gamesa,
Alstom,
Nordex,
Mitsubishi
H&W,
TAG, Tata,
Hereema,
ZPMC,
Shinan,
Fabricom
C&G Fred Olsen,
Beluga,
Inwind,
GOAH,
Sea Jacks
DRAKA,
JDR
Beluga Hochtief,
Saipem,
Technip,
Subsea7
Various
Level 1
Level 2
Level 3
Legend:
Ticks and crosses repre-
sent likelihood of position-
ing at relevant Level in the
contractual hierarchy:
Likely
Possible
Unlikely
23420_Offshore report_int_v15.indd 3823420_Offshore report_int_v15.indd 38 9/11/11 10:339/11/11 10:33

Wind in our Sails – The coming of Europe’s offshore wind energy industry 39
The supply chain landscape depicted above provides
the project developer with a reasonable degree of fl ex-
ibility when approaching the contracting market.
The emergence of major contractors from the offshore
oil and gas sector as active participants in the upper lev-
els of the supply chain for offshore wind is an interesting
recent development. In many cases it could be argued
that these companies offer the fi nancial strength, off-
shore project execution experience and strategic assets
that some incumbent participants lack. However, the dif-
ference in the nature of the engineering problem (which
for offshore wind primarily consists of serial production
processes rather than "one-offs" as for the oil and gas
sector), as well as the marginal economics of offshore
wind as a technology, are factors which may prove chal-
lenging for this class of contractor.
2.2 Scope allocationThe goods and services provided by each of the iden-
tifi ed supply chain categories to an individual project
are also pertinent to the categorisation, as in some
cases the exact services they are providing are not
immediately obvious. Figure 2.3 attempts to summa-
rise the potential scope allocation against the anat-
omy of a representative offshore wind project.
It is clear that for the vast majority of the supply chain,
there is more than one type of company which could
supply the required goods or services. The design and
supply of the wind turbine units themselves is the
notable exception to this rule, where the manufactur-
ers are currently the exclusive providers.
FIGURE 2.3 SCOPE ALLOCATION POSSIBILITIES
Wind turbine manufacturers
Electrical suppliers
Structural fabricators
Marine contractors
Wind turbine manufacturers
Cable suppliers
EPCI contractors
Cable installers
Port operators
Scope offer likely by company type
S Scope offer likely (delivered via a major sub-contact)
Scope offer possible by company type in some instances
Scope offer possible (delivered via a major sub-contact)S
Install
Supply
Design �
�
~S �
~S
~S
~S
�
�
� S
~S
~S
~SS
S
S
S
~S
~S
~S
�
�
� S
�
S
S
S
S
�
�
�
� S
� S
� S
� S
� S
� S
~
~
~
S
S
S
S
S
S
� S
� S
� S
�
�
~S � ~SS
S
S
S S
~S
�
�
� S
� S
� S
S S
S
S
~S
�
�
� S
� S
� S
S S
S
S S
S
S
S
� S
� S
� S
�
�
~S � ~SS
S
S
S S
~S
�
�
� S
� S
� S
S S
S
S
�
�
~S � � SS S
Wind turbine manufacturersSubstructure
Array cables
Offshore export cables Port
Onshore cable
Onshore substation
Offshore substation
Substructure Topside steelwor Equipment
23420_Offshore report_int_v15.indd 3923420_Offshore report_int_v15.indd 39 9/11/11 10:339/11/11 10:33

Chapter x: name of the chapter
40 Wind in our Sails – The coming of Europe’s offshore wind energy industry
Chapter 2: Supply chain – Introduction
drawing on signifi cant North Sea oil and gas and
coastal engineering experience. Electrical equipment
and subsea cable supply has a somewhat more dis-
tributed supply base with notable contributions from
Norway, Sweden, Germany and Italy. The UK, which
until recently had not played a signifi cant role in the
supply to the offshore wind sector, has seen substan-
tial recent investment, with new facilities being estab-
lished primarily along its east coast to serve domestic
and export markets in the North Sea.
The specifi c companies featuring in Figure 2.4 are dis-
cussed in more detail later in the report. See fi gures
3.3 and 4.3 for more detail.
2.3 Location of key players
Figure 2.4 shows the geographical distribution of
some of the key suppliers from the upper levels of the
offshore wind supply chain in Europe, including estab-
lished and planned manufacturing infrastructure.
Denmark and Germany have historically played and
continue to play host to a signifi cant amount of estab-
lished infrastructure, particularly in terms of wind tur-
bine manufacturing facilities. The Netherlands and
Belgium have also enjoyed signifi cant participation,
especially via the provision of installation services
FIGURE 2.4 AN EXAMPLE OF KEY SUPPLIERS AND MANUFACTURING INFRASTRUCTURE
Wind turbine manufacturers
Foundation manufacturers
Electrical equipment suppliers
Marine contractors
Cable suppliers
23420_Offshore report_int_v15.indd 4023420_Offshore report_int_v15.indd 40 9/11/11 10:339/11/11 10:33

Wind in our Sails – The coming of Europe’s offshore wind energy industry 41
KEY FINDINGS
• Competition across the supply chain for offshore wind is increasing with an infl ux of signifi cant
new entrants over the last 12 - 24 months. The contracting format has taken a full turn away from
and back towards EPCI turnkey contracts: wind turbine manufacturers initially vied for early-mover
advantage, but they are now in a knowledgeable and risk-averse market with multiple contracting
practices. Looking to the future, more mature risk-effective and cost-effective supplier collabora-
tions are likely to be developed.
• The emergence of major contractors from the offshore oil and gas and traditional maritime
sectors may prove to be a signifi cant shift in the dynamics of the supply chain.
23420_Offshore report_int_v15.indd 4123420_Offshore report_int_v15.indd 41 9/11/11 10:339/11/11 10:33

WIND TURBINES3
Photo
: Eon
3.1 Historical context and market options
3.2 Key sub-components
3.3 Current status of industry supply chain
3.4 Future technical trends
23420_Offshore report_int_v15.indd 4223420_Offshore report_int_v15.indd 42 9/11/11 10:339/11/11 10:33

Wind in our Sails – The coming of Europe’s offshore wind energy industry 43
manufacturers have until recently had limited incentive
to participate in offshore wind. Indeed there is only
limited incentive to invest heavily in ramping up pro-
duction facilities for what is still considered by some
as a high-risk, marginal market. The plot in Figure 3.1
shows how historically offshore wind has been dwarfed
by the scale of onshore wind deployment, globally.
Despite this, build-out rates for offshore wind over the
last three years have been relatively impressive with
year on year average growth of ~40%, leading to a total
installed base of around 3 GW by the end of 2010.
As momentum increases, there are some indications
that the supply-demand imbalance of recent years is
beginning to ease, with increased levels of competi-
tion between the handful of existing incumbent sup-
pliers. In the medium term, the prospects for further
improvements in the level of competition increases
with new entrant suppliers from both Europe and Asia,
providing additional supply capacity.
3.1 Historical context and market optionsThe rapid acceleration of onshore wind energy deploy-
ment, fuelled by particularly strong growth in North
America and Asia as well as sustained expansion in
Europe, has placed signifi cant pressure on the global
wind energy supply chain as demand has come to
outstrip supply. Turbine production capacity has, to a
large degree, been limited by second and third level
supplier constraints. In particular, shortages of key
components such as gears, large bearings, transform-
ers, castings, forgings and carbon-fi bre have contrib-
uted to this trend. Currently, the market for offshore
wind turbines largely coincides with that for onshore
turbines in terms of players, products and production
facilities.
Given the additional risks associated with supply-
ing technology to the offshore market and the high
demand for turbines in lower-risk onshore markets,
FIGURE 3.1 GLOBAL OFFSHORE WIND – HISTORICALLY A NICHE MARKET
2000 2001 2002 2003 2004 2005 2006 2007 2008 2009 2010
Onshore 3.7 6.4 7.0 7.6 7.6 10.8 14.3 18.8 25.1 38.2 37.3
Offshore 0.0 0.1 0.2 0.3 0.1 0.1 0.2 0.2 0.4 0.6 1.0
15
20
25
30
35
40
5
0
10Ann
ual w
ind
capa
city
(G
W)
Source: EWEA and GWEC
23420_Offshore report_int.indd 4323420_Offshore report_int.indd 43 9/11/11 11:149/11/11 11:14

Chapter x: name of the chapter
44 Wind in our Sails – The coming of Europe’s offshore wind energy industry
Chapter 3: Wind turbines
industry. Against this, we are likely to see more strate-
gic acquisitions as the manufacturers seek to secure
a competitive advantage.
3.2 Key sub-components Towers
Supply of towers for offshore wind turbines is consid-
ered to be relatively elastic, with low barriers to entry
and an economic driver to manufacture close to mar-
ket. A mixture of in-house and outsourcing approaches
has been adopted by the wind turbine manufacturers.
A reasonably wide selection of tower manufacturing
facilities exists in Europe, although those capable
of manufacturing larger diameter towers required for
wind turbines in the 5-7 MW range are more limited.
Whilst manufacturing equipment can be upgraded to
cope with this, transportation constraints may pre-
vent access to market in some cases. To mitigate the
impact of this, it is considered likely that additional
coastal tower manufacturing facilities will be required
in Europe in the coming decade.
Blades
Blade technology and manufacturing is increasingly
viewed as a highly strategic element of the value chain
for wind energy, given the high technological barriers to
entry and the value of Intellectual Property associated
with their design / production. In addition, previous
shortages of materials and production capacity may
There is now clear evidence of a trend towards offshore
specifi c wind turbine models and in some instances,
manufacturers. This trend should mitigate the histori-
cal 'resource diversion' suffered by the offshore wind
industry, particularly as manufacturers commit to sig-
nifi cant investment in bespoke production facilities.
There is strong evidence for this with three manufac-
turers with turbines in the 5-6 MW range commission-
ing substantial production facilities in the last few
years (BARD, REpower and Areva). Whilst production
is yet to ramp up to serial levels at these sites (all in
northern Germany), the development signals that this
critical part of the supply chain is now confi dent of
long-term, sustainable markets.
However, the bifurcation discussed above, which is
considered to be an important current trend, will not
entirely resolve the resource diversion caused by con-
tinued high demand from the global onshore wind
business, since second and third level sub-suppliers
are likely to remain largely common to both onshore
and offshore products and players. Recent announce-
ments have indicated a scaling-back of new produc-
tion capacity from previous plans for certain key
sub-suppliers which on the surface would suggest a
further tightening of supply. In reality it is considered
that this development is a reaction to lower than antic-
ipated demand from onshore wind, particularly from
North American markets and in this respect the off-
shore market may not be affected directly.
In the short term new entrant wind turbine manufac-
turers will rely on strategic partnerships with third
party suppliers until they establish themselves in the
23420_Offshore report_int_v15.indd 4423420_Offshore report_int_v15.indd 44 9/11/11 10:339/11/11 10:33

Wind in our Sails – The coming of Europe’s offshore wind energy industry 45
Although there is some evidence of vertical integration
(e.g. Vestas), the majority of cast and forged compo-
nents are supplied by independent companies. Supply
capacity in both cases has increased over the last two
to three years.
Overall, key trends in the supply chain for offshore
wind turbines may be summarised as follows:
• Incumbent wind turbine manufacturers are moving
towards vertical integration of their supply chains
through investments and acquisitions. This is driven
by the desire to secure design and production IP as
well as capacity for future expansion. Wind turbine
designers are shifting towards more specialist tech-
nologies and this is likely to increase the trend to-
wards vertical integration further still.
• In the short term new entrant wind turbine manu-
facturers will have to rely on strategic partnerships
with third party suppliers until they establish them-
selves in the industry. Against this, we are likely to
see more strategic acquisitions of specifi c technol-
ogy providers as the manufacturers seek to secure
a competitive advantage. A recent example of this is
Mitsubishi's purchase of specialist technology pro-
vider, Artemis, and GE's investment in power con-
verter supplier Converteam.
have contributed to cost increases. The longer blades
required by offshore wind turbine manufacturers bring
additional manufacturing and logistical requirements
and are likely to limit additional supply chain capacity
to coastal locations. Independent suppliers are likely
to continue to have a limited role supplying part of the
new entrant wind turbine manufacturers.
Drive train components
Drive train components including gearboxes, large bear-
ings and generators are increasingly viewed by wind tur-
bine manufacturers as strategically critical elements
of the value chain, with an increasing trend towards
vertical integration. Examples include investments
by Siemens and Suzlon in leading gearbox suppliers
Winergy and Hansen. Looking ahead, the technological
developments in the supply chain towards more spe-
cialist solutions – medium and low speed (direct drive)
concepts – is likely to accelerate the process of verti-
cal integration with wind turbine manufacturers looking
to consolidate control of design, intellectual property,
manufacturing and quality as well as securing supply
capacity.
Castings and forgings
The bedframe, hub and gearbox/bearing housings are
the main cast components within a modern wind tur-
bine with the main shaft, and bearing/gear rings being
forged constructions. Whilst there is a large global
supply base for castings and forgings, the dimensional
demands of wind energy, and in particular for large
wind turbines reduces the fi eld of available suppliers.
23420_Offshore report_int_v15.indd 4523420_Offshore report_int_v15.indd 45 9/11/11 10:339/11/11 10:33

Chapter x: name of the chapter
46 Wind in our Sails – The coming of Europe’s offshore wind energy industry
Chapter 3: Wind turbines
3.3 Current status of industry supply chain
FIGURE 3.2 SELECTION OF LEADING OFFSHORE WIND TURBINE SUPPLIERS AND FACILITIES
4 1
82
5-67
3
No Company Notes
1,2 Siemens
Established supplier with a fi rm order book for over 3 GW of offshore wind capacity to be delivered
before 2014. Existing 3.6 MW platform manufactured in Denmark with new UK assembly facility
planned for forthcoming 6.0 MW direct drive model.
3,4 Vestas
Established supplier with offshore deployments totalling ~1.5 GW to date. V80 and V90 wind turbine
platforms have given way to current market offering of the V112 3.0 MW unit. Recently announced
plans for UK production of V164-7.0 MW unit from ~2015, the latter being the fi rst Vestas unit to be
exclusively intended for offshore deployment.
5 REpower
Previous market offering (5M) now superseded by upscaled 6.0 MW version (6M). Demonstration
deployments of the 5M at Beatrice (UK - 2007), Thornton Bank (BE - 2009) and Alpha Ventus (DE - 2009)
have paved the way for the fi rst commercial-scale sales (Ormonde, Nordsee-Ost and Thornton Bank
phases 2&3) totalling ~650 MW.
6 AREVA
First prototype of M5000 (5 MW) unit deployed in 2006 with offshore demonstration of six units at
Alpha Ventus producing fi rst power from 2010. Commercial orders secured for Borkum West II Phase 1
(200 MW, DE), Global Tech I (400 MW, DE), MEG1 (400 MW, DE) to be delivered in 2012/13.
7 BARD
First prototype of BARD 5.0 (5 MW) unit deployed in 2007 followed by fi rst commercial deployment
on Bard Offshore 1 (400 MW) which is currently in construction. Unique vertically integrated business
model including project development, substructure fabrication and installation.
8 Nordex
Early interest in offshore sector with marinisation of N90 (2.5 MW) product. No further offshore
deployment beyond a near-shore prototype in 2006. Recent announcement of offshore-specifi c product
(N150-6000) with fi rst deployments of this 6 MW unit expected in 2014/15.
23420_Offshore report_int_v15.indd 4623420_Offshore report_int_v15.indd 46 9/11/11 10:339/11/11 10:33

Wind in our Sails – The coming of Europe’s offshore wind energy industry 47
A supply-side analysis has been undertaken based on
two databases, known as the “GLGH Component and
Activity Costing Database” and the “GLGH Offshore
Wind Installation Vessel Database”, for the period
2010 - 2020. This has been carried out for each major
Level 1 activity (wind turbine supply, foundation supply,
electrical equipment supply and installation vessels)
on the basis of the current and future planned expan-
sion of capacity.
Projections of supply capacity are notoriously problem-
atic, especially beyond a two to three year timeframe.
In this regard, the following factors are highlighted:
• Supply capacity for certain items is relatively elas-
tic and dynamic – it can be ramped up, within lim-
its, to meet demand in quite short timeframes. In
these cases, pressure on supply from the market
is less likely to result in short-term upward pres-
sure on pricing. In the majority of cases for the off-
shore wind sector however, investment decisions for
signifi cant additional Level 1 supply chain capacity
must be made 18-36 months before that capacity is
ready to be delivered, with the fi nal stages of prod-
uct development being executed in parallel with the
ramp-up.
• Plans for additional supply chain capacity are mostly
not in the public domain. This is particularly true for
potential new entrant suppliers who may hold back
specifi c plans because they are not fully committed
or otherwise confi dential for commercial reasons.
The perception of future market demand will trigger
investment decisions – but these are diffi cult to pre-
dict with any certainty.
• Those plans for additional supply chain capacity that
do enter into the public domain are often not fully
confi rmed or do not entail a full investment com-
mitment from the supplier in question. Again, this
allows the supply chain to scale back or even can-
cel plans should perceived future market demand
weaken signifi cantly.
For these reasons, dealing with supply and demand
independently is to some extent a fl awed approach.
However, the analysis that follows is intended to pro-
vide an indicative qualitative basis upon which gen-
eral fi ndings may be drawn with respect to competitive
pressure within the supply chain and the commensu-
rate effect on project costs.
There is an impressive and growing list of companies
developing wind turbine designs for future deployment
in the European offshore wind markets, as summa-
rised in Table 3.1.
TABLE 3.1 SELECTION OF FORTHCOMING OFFSHORE WIND TUR-
BINE MODELS (EWEA DATABASE)
Model/
Company
Capacity
(MW)
Model/
Company
Capacity
(MW)
2-B Energy 6 Mervento -
Acciona 3Mingyang
3
Aerodyn SCD 6.5 6
Alstom/
Converteam6 Mitsubishi -
AMSC Sea
Titan10 Nordex 6
BARD 6.5
Samsung
2
China Shippong
Industry5 5
Condor 5 6
Darwind 5 Schuler 6
Dongfang 5Shanghai
Electric3
Doosan 6 Siemens 6
Envision Energy 3Sinovel
6
Gamesa
15 10
- STX 5
5
SWAY
10
GE4 5
15 3
Goldwind6
Technip
-Vertiwind2
10 Tianwei 3
Guodian United
Power
6Vestas
7
12 6
HiPRWind 2 WInFlo 3
Huayi Electric
&Mecal6 WinWind 3
Hyundai 5
WPL
Aerogeneratior
X
10
2 Yinhe(Avantis 3
Israel
Aerospace
Industies
3Zheijian
Windey5
23420_Offshore report_int_v15.indd 4723420_Offshore report_int_v15.indd 47 9/11/11 10:339/11/11 10:33

Chapter x: name of the chapter
48 Wind in our Sails – The coming of Europe’s offshore wind energy industry
Chapter 3: Wind turbines
• Following an investment decision to establish the re-
quired assembly / testing facilities, it can take sever-
al years to reach operational maturity given consent-
ing, logistical and other constraints. The support of
local, regional or national bodies can help to accel-
erate the time to market.
The above assumptions are supported by the follow-
ing evidence:
• Siemens Wind Power have an order backlog of
~3 GW of capacity of their fl agship offshore wind
product (SWT-3.6-120) to be delivered to projects
in northern Europe in the 2011 - 2013 timeframe –
suggesting full capacity at ~1 GW / annum at their
assembly facilities in Brande, Denmark.
• Areva and REpower Systems have both estab-
lished assembly facilities in Bremerhaven, north-
ern Germany, each with a single shift capacity of
~400 MW / annum.
• Direct consultation with other leading wind turbine
manufacturers has revealed a consistent message
annual sales target of ~1 GW to justify the launch of
a new offshore wind turbine product.
On the basis of the rationale outlined above, the fol-
lowing generic capacity profi les may be assumed.
Wind turbine supply and demand analysis
At the manufacturer level, wind turbine supply capacity
will be limited by the capacity of the primary assem-
bly facilities. Downstream supply chain constraints on
key components such as castings and large diame-
ter bearings have largely been resolved, as discussed
earlier. On this basis, it is possible to defi ne generic
capacity profi les, providing an assumed annual pro-
duction capacity for new wind turbine products as
production ramps up at new facilities in the years fol-
lowing the launch of the product in question.
The generic "ramp-up" profi les which follow are based
on industry experience relating to the programme for
the establishment of offshore wind turbine assembly
facilities and their ultimate annual production capac-
ity. Broadly speaking, German and Danish wind turbine
manufacturers have adopted the following approach
to establishing such facilities:
• An ultimate sales target equivalent to 1 GW / annum
is usually required to justify the signifi cant expendi-
ture (typically in excess of €100 million) associated
with product development, supply chain establish-
ment and assembly facilities.
• In general, a single assembly hall and associated
support facilities are required for a single shift, an-
nual capacity in the order of 500 MW, ramping up to
1 GW by moving to two shifts.
23420_Offshore report_int_v15.indd 4823420_Offshore report_int_v15.indd 48 9/11/11 10:339/11/11 10:33
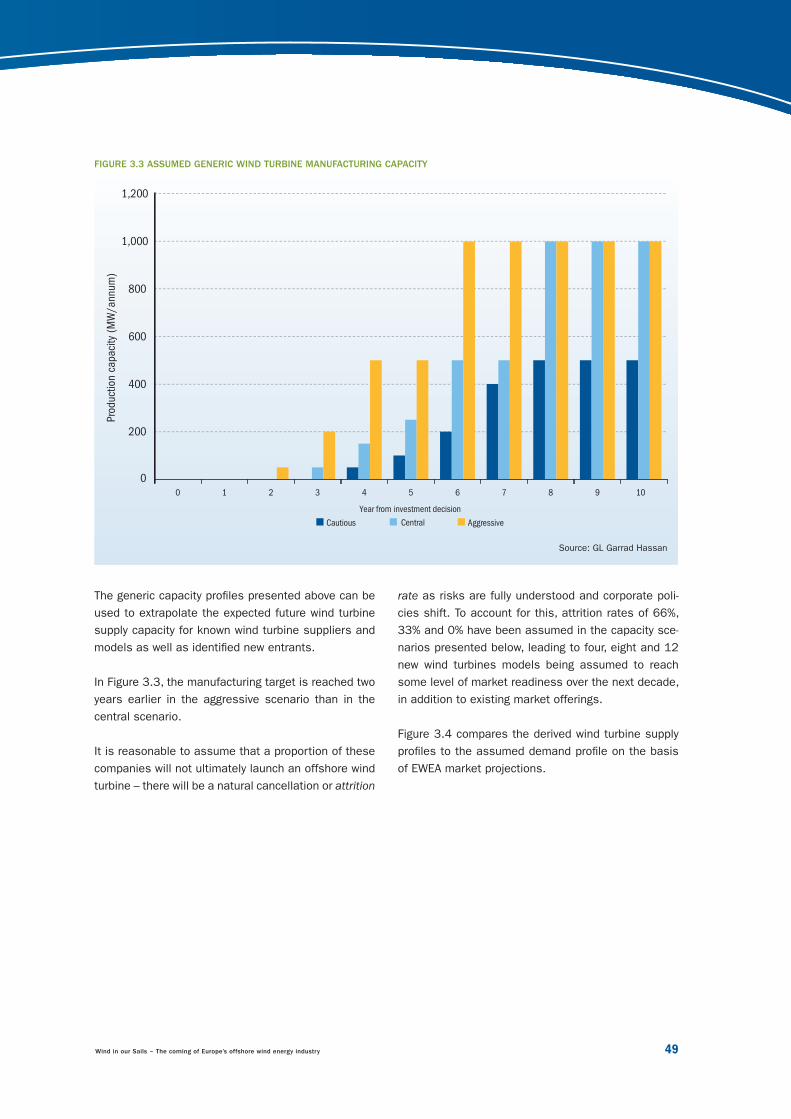
Wind in our Sails – The coming of Europe’s offshore wind energy industry 49
rate as risks are fully understood and corporate poli-
cies shift. To account for this, attrition rates of 66%,
33% and 0% have been assumed in the capacity sce-
narios presented below, leading to four, eight and 12
new wind turbines models being assumed to reach
some level of market readiness over the next decade,
in addition to existing market offerings.
Figure 3.4 compares the derived wind turbine supply
profi les to the assumed demand profi le on the basis
of EWEA market projections.
The generic capacity profi les presented above can be
used to extrapolate the expected future wind turbine
supply capacity for known wind turbine suppliers and
models as well as identifi ed new entrants.
In Figure 3.3, the manufacturing target is reached two
years earlier in the aggressive scenario than in the
central scenario.
It is reasonable to assume that a proportion of these
companies will not ultimately launch an offshore wind
turbine – there will be a natural cancellation or attrition
FIGURE 3.3 ASSUMED GENERIC WIND TURBINE MANUFACTURING CAPACITY
200
0
400
600
800
1,000
1,200
0 1 2 3 4 5 6 7 8 9 10
Prod
uctio
n ca
paci
ty (
MW
/ann
um)
Year from investment decision
Cautious Central Aggressive
Source: GL Garrad Hassan
23420_Offshore report_int_v15.indd 4923420_Offshore report_int_v15.indd 49 9/11/11 10:339/11/11 10:33

Chapter x: name of the chapter
50 Wind in our Sails – The coming of Europe’s offshore wind energy industry
Chapter 3: Wind turbines
there is potential for spare capacity to be taken up,
particularly by emerging export markets for offshore
wind in North America.
It is noted that the "No Attrition" supply capacity pro-
fi le is considered to be a very unlikely scenario and
some degree of product cancellation is inevitable.
It is clear from the results of the analysis presented in
Figure 3.4 that supply is anticipated to meet demand
for offshore wind turbine products over the next dec-
ade, even in the most pessimistic scenario for new
entrant products. Oversupply is estimated to range
between 2 and 8 GW per annum, which implies that a
high and increasing degree of competition within this
sector can be expected through to 2020. However,
FIGURE 3.4 ANALYSIS OF SUPPLY AND DEMAND FOR OFFSHORE WIND TURBINE TECHNOLOGY IN EUROPE
2,000
0
4,000
6,000
8,000
10,000
12,000
14,000
16,000
18,000
2010 2011 2012 2013 2014 2015 2016 2017 2018 2019 2020
Dem
and
/ su
pply
cap
acity
(M
W)
Total (pessimistic) Total (central) Total (optimistic) Firm capacityDemand (EWEA)
Source: GL Garrad Hassan
23420_Offshore report_int_v15.indd 5023420_Offshore report_int_v15.indd 50 9/11/11 10:339/11/11 10:33

Wind in our Sails – The coming of Europe’s offshore wind energy industry 51
Growth in offshore wind
turbine size
Both in terms of rated power and in rotor swept area
– as the two are closely related – onshore wind tur-
bines have grown considerably in size over the last
two decades. In parallel, technological developments
in areas such as aerodynamics, variable speed regu-
lation and independent blade pitch control have been
numerous and fast paced. In the last decade, the
rate of growth has seemed to slow down as a result
of planning or economic constraints rather than
technological issues. Because many of these con-
straints are eliminated or lessened in the offshore
environment and because wind turbines on their own
account for less than half of the capital costs in a typ-
ical project, the wind turbines aimed at the offshore
market have been growing rapidly. This is illustrated
in Figure 3.5.
3.4 Future technical trendsThe growth of the offshore wind sector in the last dec-
ade has presented wind turbine technology companies
with new engineering challenges and possibilities.
While initially onshore wind technology was used to sup-
ply this niche market, and therefore wind turbine designs
were restricted by the numerous planning constraints on
onshore models, such as tip height, noise emissions,
aesthetics, transport and construction limits, the off-
shore wind market has grown to a size at which the
development cost of bespoke products can be recouped
over hundreds of units and is therefore possible.
The technological trends emerging from this division
of supply is explored below, with commentary on the
implications of these trends on the supply chain.
FIGURE 3.5 GROWTH TRENDS – RATED CAPACITY AND ROTOR DIAMETER FOR OFFSHORE WIND TURBINE PRODUCTS
00
20
40
60
80
100
120
140
160
180
2
4
6
8
10
12
14
16
2000 2002 2004 2006 2008 2010 2012 2014
Rot
or d
iam
eter
(m
)
Rat
ed c
apac
ity (
MW
)
Deployment date (1st prototype)
Rotor diameter Rated capacity
Source: GL Garrad Hassan
23420_Offshore report_int_v15.indd 5123420_Offshore report_int_v15.indd 51 9/11/11 10:339/11/11 10:33

Chapter x: name of the chapter
52 Wind in our Sails – The coming of Europe’s offshore wind energy industry
Chapter 3: Wind turbines
the rotor size of an existing platform at a fi xed rated
power as highlighted by the red arrows in Figure 3.6.
However, in contrast, one manufacturer (green arrow
in Figure 3.6) decided to increase rated power as
opposed to rotor size. Recent product announcements
have confi rmed the trend towards larger swept areas
in relation to rated capacity – perhaps because this
is seen as an effective way of reducing the cost of
energy produced by improving the way plant infrastruc-
ture balance is utilised.
Other design trends
Specifi c swept area
Choosing the ratio of rotor swept area to rated power
is a key decision in wind turbine design. Both dimen-
sions have grown considerably – as shown in Figure
3.6 – but there is some evidence to suggest that tur-
bine manufacturers developed offshore turbines with
somewhat larger rotors relative to rated power capac-
ity in the second part of the last decade, as illustrated,
again, in Figure 3.6. Two manufacturers have enlarged
FIGURE 3.6 TRENDS IN SPECIFIC ROTOR AREA AND MASS
1,800
2,000
2,200
2,400
2,600
2,800
3,000
3,200
3,400
2000 2002 2004 2006 2008 2010 2012 2014
Deployment date (1st prototype)
Specific area (m2/ MW)
Enlarged rotors
Enlarged generators 1
0
2
3
4
5
6
7
8
9
10
2000 2002 2004 2006 2008 2010 2012 2014
Deployment date (1st prototype)
Specific mass (kg/ (MW*m2))
Source: GL Garrad Hassan
23420_Offshore report_int_v15.indd 5223420_Offshore report_int_v15.indd 52 9/11/11 10:339/11/11 10:33

Wind in our Sails – The coming of Europe’s offshore wind energy industry 53
1. There is clear evidence of a trend towards in-
creased reliability in drive train design with various
approaches being adopted. Direct drive technolo-
gy is being pursued by some manufacturers with
others opting for a focus on improved reliability for
geared designs. So-called "hybrid" designs which
employ a gearbox but with transmission only to a
medium speed are also being developed further.
2. Whichever mode of mechanical transmission is se-
lected, permanent magnet generators (PMGs) are
gaining market shares as generator technologies,
offering, as they do, a means of reducing nacelle
mass.
3. Electrically, there is a clear trend in generator tech-
nology away from partial to full power conversion.
This is partly a bi-product of the shift towards PMG
technology which inherently requires full conversion
but is also a result of improvements to component
technology and to meet increasingly demanding
grid code requirements.
Specifi c mass
Material effi ciency has also improved signifi cantly in
the last decade and new products due in the next few
years indicate that this trend is set to continue. This
is illustrated by the specifi c mass plot in Figure 3.6. A
combination of factors contributed to these improve-
ments, particularly:
• The optimisation of loads via advance control sys-
tems with associated structural design effi ciencies;
• The adoption of more effi cient materials e.g. carbon
fi bre;
• Concept changes e.g. direct drive concepts with per-
manent magnet generators.
This trend has obvious economic benefi ts in terms of
the cost of producing the wind turbines themselves
as well as associated balance of plant and installa-
tion costs.
Transmission and conversion technology
There are currently signifi cant trends with respect to
the selection of mechanical transmission and electrical
conversion technologies, as illustrated in Figure 3.7.
FIGURE 3.7 TRANSMISSION AND CONVERSION TECHNOLOGY TRENDS
2000 2002 2004 2006 2008 2010 2012 2014
Mec
hani
cal t
rans
mis
sion
con
cept
Deployment date (1st prototype)
DIRECT DRIVE
GEARED
2000 2002 2004 2006 2008 2010 2012 2014
Mec
hani
cal t
rans
mis
sion
con
cept
Deployment date (1st prototype)
FULL
PARTIAL
Source: GL Garrad Hassan
23420_Offshore report_int_v15.indd 5323420_Offshore report_int_v15.indd 53 9/11/11 10:339/11/11 10:33

Chapter x: name of the chapter
54 Wind in our Sails – The coming of Europe’s offshore wind energy industry
Chapter 3: Wind turbines
To sum up, the developments in offshore wind turbine
design are driving the decoupling of the supply chain
between the onshore and offshore wind sectors, with
dedicated offshore capacity a requirement for the
future. This may be seen as a natural consequence of
the maturing offshore wind industry, but it is a develop-
ment with both positive and negative consequences.
On the upside, the availability of dedicated supply chain
resources will help insulate the offshore wind sector
against the confl icts with the onshore wind indus-
try that have historically driven up the cost of deliver-
ing offshore wind projects. However, during periods of
lower demand from the onshore wind sector, the bene-
fi ts of supply chain fl exibility will no longer be available.
Overall, the bifurcation described above is considered
to be a welcome development signalling, as it does, a
"coming of age" of the offshore wind sector.
Implications for the supply chain
The trends above are considered to have a number of
important implications for the supply chain:
• Larger wind turbine technology means larger compo-
nents: blades, towers, bed frames, hubs, etc. Logis-
tically, this forces the supply chain towards the es-
tablishment of coastal manufacturing and assembly
facilities to avoid constraints associated with road/
rail transport. This will help to decouple offshore
from onshore supply chain capacity, as it necessi-
tates specialist facilities at these port locations.
• Shifts in the technological concepts for offshore wind
turbines will obviously have an impact further down
the supply chain. The adoption of advanced materials
and processes to serve these offshore-specifi c con-
cepts will contribute to a further decoupling of supply
capacity between onshore and offshore wind energy
for major components such as large PMG units.
KEY FINDINGS
• An impressive and growing list of manufacturers are developing new wind turbine models spe-
cifi cally for the offshore wind sector, to supplement the handful of incumbent suppliers and
products. It is expected that four to 12 new wind turbine models will reach some level of market
readiness over the next decade.
• It is estimated that the supply of offshore wind turbines will meet and exceed demand for the
next decade, leading to healthy levels of competition within Europe with the potential for export
to emerging North American markets.
• Against a backdrop of increasingly challenging project sites, there is a clear trend towards lowering
energy costs through improved reliability and structural effi ciency / energy capture. Improved
gearbox designs, direct-drive technology, permanent magnet generators and larger rotors are the
key avenues being pursued by wind turbine designers to achieve this.
• Design trends are driving the supply chain towards specialisation, partially decoupling it from
previous entanglement with the onshore wind industry, indicating growing market maturity.
23420_Offshore report_int_v15.indd 5423420_Offshore report_int_v15.indd 54 9/11/11 10:339/11/11 10:33

Wind in our Sails – The coming of Europe’s offshore wind energy industry 55
23420_Offshore report_int_v15.indd 5523420_Offshore report_int_v15.indd 55 9/11/11 10:339/11/11 10:33

SUBSTRUCTURES4
Photo
: C-p
ow
er
4.1 Historical context
4.2 Substructure types
4.3 Substructure market status and outlook
4.4 Floating structures
23420_Offshore report_int_v15.indd 5623420_Offshore report_int_v15.indd 56 9/11/11 10:339/11/11 10:33

Wind in our Sails – The coming of Europe’s offshore wind energy industry 57
represent a large amount of the capital expenditure
in a wind farm, and therefore represent a signifi cant
amount of supply chain value, it is not necessary for
a country to have its own wind turbine manufacturer
to have an offshore wind industry. Given these mar-
ketplace and product characteristics, it is considered
unlikely that any signifi cant supply chain constraints
will emerge for the supply of substructures for the
foreseeable future, except possibly as the result of
short-term demand peaks or excessive resource com-
petition from other industries.
A number of types of substructure have been utilised
and proposed to date. Important considerations when
selecting a structure type include cost, water depth,
seabed conditions, turbine characteristics and techni-
cal / commercial risk factors. The majority of the wind
farms currently in operation in water depths of under
20 - 25 metres have monopile foundations, as they
are relatively simple to produce, easier to install and
less costly. Gravity-based structures (GBS), which are
also relatively easy to produce, make up most of the
remainder, while only a small number of space-frame
structures (e.g. jackets, tripods and tripiles) have
been installed so far.
4.1 Historical context A major difference between onshore and offshore
wind farms is the relative complexity and cost of civil
works, especially the substructures required for off-
shore turbines. For offshore wind farms, substructure
supply and installation represents around 20% of the
capital costs. The size and water-depth constraints
of manufacturing, transporting and installing wind
turbines are vital factors in determining the current
techno-economic limitations of offshore wind farms.
Meeting the massive increase in demand forecast for
the next decade for offshore wind substructures will
require signifi cant expansion in manufacturing capac-
ity. The technical barriers to manufacturing substruc-
ture components are relatively low and establishment
of fabrication facilities is an obvious move for large
marine engineering fi rms who have reduced demand
from the oil and gas and maritime sectors in recent
years. The relatively low barriers to entry, high supply
elasticity (due to the short lead times for bringing new
production facilities online) and logistical incentive to
source locally will create signifi cant industrial develop-
ment opportunities in European countries with access
to the offshore wind areas. Since substructures
FIGURE 4.1 HISTORIC OFFSHORE WIND TURBINE FOUNDATION MARKET SHARE (BY YEAR)
30%
40%
50%
60%
70%
80%
90%
100%
0%
10%
20%
30%
1990 1991 1992 1993 1994 1995 1996 1997 1998 1999 2000 2001 2002 2003 2004 2005 2006 2007 2008 2009 2010 2011 2012
Monopile Gravity-based structure Space-frame
Source: GL Garrad Hassan
23420_Offshore report_int_v15.indd 5723420_Offshore report_int_v15.indd 57 9/11/11 10:339/11/11 10:33

Chapter x: name of the chapter
58 Wind in our Sails – The coming of Europe’s offshore wind energy industry
Chapter 4: Substructures
4.2 Substructure typesFIGURE 4.2 EXAMPLES OF TYPICAL SUBSTRUCTURE DESIGN
Note that the sample size in early years will generally
be smaller, typically consisting of a single wind farm
with, maybe, half a dozen turbines.
Monopile Gravity-based Structure (GBS)
Space Frame (Tripod) Space Frame (Jacket) Space Frame (Tri-pile)
23420_Offshore report_int_v15.indd 5823420_Offshore report_int_v15.indd 58 9/11/11 10:339/11/11 10:33

Wind in our Sails – The coming of Europe’s offshore wind energy industry 59
Again, the dimensions of gravity-based foundations
will increase mainly with turbine capacity, the site
wave conditions and water depth. This type of struc-
ture is currently suited for sites in water depths up
to 30 metres, although some designs are being con-
sidered for deeper sites. To date these designs have
been used in many of the offshore wind projects in the
Baltic Sea, where water depths and meteorological and
oceanographic (“metocean”) conditions are suitable.
Space frame structures
For deeper locations, space frame structures are likely
to be considered. Broadly speaking, these concepts
fall into two categories: multipods (including tri-pods
and tripiles) and jackets. These designs transmit
forces to the foundations in the seabed via a structure
made up of several piles, with the aim of minimising
the ratio of mass to stiffness. Typically, small diameter
piles ("pin-piles") are proposed for the method of fi x-
ing space frame structures to the seabed, although
suction caissons have also been suggested.
Tripods
The tripod is a standard three-legged structure made
of cylindrical steel tubes. The central steel shaft of the
tripod is attached to the turbine tower. The tripod can
have either vertical or inclined pile sleeves. The base
width and the pile penetration depth can be adjusted
to suit the environmental and ground conditions. The
piles in this case would be relatively small, say 2 to
3 m in diameter.
As with monopile designs, the size of the multi-pod
foundation will increase with the capacity of the tur-
bine, but it will also be affected by wave conditions
and water depth at the site. The distance between
the piles is likely to be around 20 to 40 m for the
turbines under consideration for projects planned to
come online during the next fi ve years. This type of
structure is well suited for sites ranging in water depth
from 20 to 50 m.
Tri-piles
Tri-piles consist of three foundation piles connected
via a transition piece to the turbine tower with the
Monopiles
A monopile foundation consists of a single steel pile
which is embedded into the sea bed. How far the pile
goes into the sea bed, and its pile diameter / wall
thickness are determined principally by the maximum
water depth and rated capacity of the wind turbine.
Typically, the turbine tower is mounted onto the foun-
dation via a transition piece which itself is fi xed on to
the pile using a specialised grouted joint.
A disadvantage of the monopile is that is becomes
less stable in deeper waters, and is best suited to
water depths of up to 25 metres. It is possible how-
ever, that future developments in manufacturing capa-
bilities and size of installation equipment will mean
that monopile structures with very large diameters
will be possible, reducing the monopile’s fl exibil-
ity and making it suitable for deeper water sites. As
such, owing to its simplicity and relatively low labour
content, the monopile solution is considered by the
industry as "low hanging fruit", to be exploited before
more complex and labour-intensive designs become
necessary.
Gravity-based structures
Unlike piled foundations, gravity-based structures
(GBS) are designed to avoid tensile or uplift forces
between the bottom of the support structure and the
seabed. This is achieved by providing dead loads to
weigh down the structure so it retains its stability in
all environmental conditions.
GBSs are constructed in building yards and transported
to site. Once in position on the seabed, their weight is
increased by fi lling the structure with pumped-in sand,
concrete, rock or iron ore as required. Gravity struc-
tures are usually competitive when the environmental
loads are relatively modest or when additional ballast
can be relatively easily provided at a modest cost.
To date, GBSs have been used in offshore wind pro-
jects using cylindrical or conical reinforced concrete
caissons which are mounted directly on to a prepared
area of the seabed.
23420_Offshore report_int_v15.indd 5923420_Offshore report_int_v15.indd 59 9/11/11 10:339/11/11 10:33

Chapter x: name of the chapter
60 Wind in our Sails – The coming of Europe’s offshore wind energy industry
Chapter 4: Substructures
place thus removing the need for expensive and cum-
bersome piling. They also avoid the need for pile driv-
ing and associated noise. However, suction buckets
are limited to use in relatively uniform benign soils
and hence are unsuitable for many European sites.
4.3 Substructure market status and outlookMonopiles are expected to continue to dominate the
marketplace up to the technical limits of their feasibility
in terms of turbine size, water depth and ground condi-
tions. GBS designs will also continue to capture a pro-
portion of the market share within shallower and more
sheltered sites. The size of this share will vary by region,
depending on local conditions and historic usage.
For most other cases such as deeper water sites,
space-frame structures are expected to be the design
of choice for the majority of developers. The market
share of jackets should grow as more challenging
sites are developed.
The challenge of decommissioning substructures
at the end of their lives may in some instances be
considerable, but not unprecedented with substan-
tial experience being accrued from the North Sea off-
shore oil and gas sector in recent years. Developers
are already putting aside money for decommissioning
and in some markets this is a statutory requirement.
A selection of incumbent and new entrant structural
fabricators serving the offshore wind sector is pre-
sented in Figure 4.3.
transition piece located above the water level. BARD
has patented a specifi c version of this concept which
consists of a transition piece with three pins that slot
in to the three pre-installed piles.
Jackets
Jackets differ from tripods and tri-piles in that they
consist of a larger plan area through the majority of
the structure, positioning the steel further from the
centre of the axis, which results in signifi cant mate-
rial savings.
The offshore wind developments to make use of jack-
ets to date are the Beatrice Demonstrator (2006),
Alpha Ventus (2009), Thornton Bank (2011) and
Ormonde (2011) wind farm projects although they
have been commonly employed in the offshore oil
& gas sector for many decades. As with the tripod
design, the structure is "pinned" to the seabed using
piles. It is argued that the increased manufacturing
and assembly costs of such a structure when com-
pared to the tripod are offset by a signifi cantly lower
mass for the same stiffness characteristics, and that
automated production processes have the potential to
reduce costs further.
Other demonstrated fi xed sub-
structure designs
Aside from the mainstream substructure types
detailed above, there are other designs including bat-
tered piles and suction buckets which have been dem-
onstrated to a greater or lesser extent.
Battered piles include a reinforced concrete pile cap
sitting on battered (inclined) driven steel piles and are
suitable only for shallow, well sheltered waters. Suction
buckets consist of an upturned cylinder “sucked” into
23420_Offshore report_int_v15.indd 6023420_Offshore report_int_v15.indd 60 9/11/11 10:339/11/11 10:33

Wind in our Sails – The coming of Europe’s offshore wind energy industry 61
FIGURE 4.3 SELECTION OF INCUMBENT AND NEW ENTRANT STRUCTURAL MANUFACTURERS
8
10 11-12-13
4
2 1
147
5
3
6
No Company Notes
1 Sif Group Established supplier of monopile foundations – industry leader.
2,3,4 Smulders Established manufacturer of monopile and jacket foundations – industry leader.
5 Bladt Established manufacturer of monopile and jacket foundations – industry leader.
6 EEW Supplier of monopile foundations – recent market entrant.
7 Weserwind Established supplier of tripod foundations with jacket capabilities.
8 BiFAB Established supplier of jacket foundations – industry leader.
9 Aker Supplier of tripod and jacket foundations – recent entrant.
10 Harland and Wolff Manufacturer with probable focus on jacket foundations – new entrant.
11 Tata Steel Manufacturer with probable focus on monopiles – new entrant.
12 TAG Manufacturer with probable focus on monopiles – new entrant.
13 Heerema Manufacturer with probable focus on jacket foundations – new entrant.
14 Cuxhn. Steel. Established supplier of tri-pile foundations – owned by Bard Group.
14 Strabag Supplier of gravity-based foundations – new entrant.
9
23420_Offshore report_int_v15.indd 6123420_Offshore report_int_v15.indd 61 9/11/11 10:339/11/11 10:33

Chapter x: name of the chapter
62 Wind in our Sails – The coming of Europe’s offshore wind energy industry
Chapter 4: Substructures
the ability to transfer onerous bending loads onto
water rather than rigid seafl oor, which is further away,
and easier removal upon site decommissioning.
Set against these benefi ts are a number of challenges
such as minimising wind and wave-induced motion,
the added complexity of the design process, electri-
cal infrastructure design and costs (in particular the
fl exible cable) and construction, installation and O&M
procedures.
There are three primary types of fl oating structures:
the spar, the tensioned-leg platform (TLP) and the
fl oating jacket structure as illustrated in Figure 4.4.
To date only the spar type has been demonstrated at
full size offshore.
4.4 Floating structuresAll ongoing commercial scale offshore wind develop-
ments utilise seabed mounted or "fi xed" substructure
concepts. However in many countries there are only a
limited number of suitable sites in suffi ciently shallow
water to allow economically viable fi xed substructures
to be deployed. Within Europe, the areas faced with
this diffi culty include much of the Mediterranean and
Atlantic basins as well as Norway.
Within these waters (over 50 m in depth) it is likely that
fl oating support structures will prove to be more eco-
nomical. In such circumstances fl oating structures have
a number of important benefi ts including greater fl ex-
ibility in the construction and installation procedures,
Spar TLP Jacket
FIGURE 4.4 FLOATING SUPPORT STRUCTURE TYPES
Sources: MSCGusto / ECN / TUDelft; others: GLGH
23420_Offshore report_int_v15.indd 6223420_Offshore report_int_v15.indd 62 9/11/11 10:339/11/11 10:33

Wind in our Sails – The coming of Europe’s offshore wind energy industry 63
include dynamic subsea cabling / connections, spe-
cialist installation methodologies and novel access
solutions.
A summary of the recent developments in the fi eld of
fl oating wind technology is provided in Table 4.1 below.
In the longer term, it is anticipated that such fl oat-
ing structures will become a more prominent feature
of the offshore wind market. New opportunities will
exist for the supply chain to serve the market through
the provision of goods and services which are spe-
cifi c to this technology. Areas of focus are likely to
TABLE 4.1 SELECTED EUROPEAN DEVELOPMENTS IN FLOATING SUBSTRUCTURE TECHNOLOGY
Country Project namePrincipal
partnerDescription
Norway Hywind Statoil
Hywind is the fi rst full scale grid-connected fl oating prototype (using spar
class technology). It was installed off Karmøy island on the south-west
coast of Norway in 2009 with a Siemens 2.3 MW machine.
Norway Karmøy SwaySway is building a prototype spar class fl oating design with the ambition of
deploying a 5 MW turbine in 2013.
France Vertiwind Technip
In association with Nénuphar, Converteam and EDF Energies, Technip
have launched a project to test a pre-industrial prototype of a vertical-axis
fl oating wind turbine.
France Winfl o Nass & Wind
In partnership with Saipem, DCNS and InVivo. Windfl o is a 2.5 MW moored
fl oating jacket class prototype to be installed off the coast of Brittany.
Currently under development.
SpainZèfi r Test
Station
Catalonia
Institute
for Energy
Research
In collaboration with a number of major industry players the Zèfi r Test
Station programme is intended to further deep water developments around
Spain in two phases, the second of which involves installing eight turbines
on fl oating structures at water depths of over 100 m.
Europe HiPRwindEU project
consortium
Five-year programme with a total budget of €19.8 million to develop a new
fl oating platform for “very large” offshore turbines.
Spain Azimut Project Gamesa
In partnership with Alstom Wind, Acciona and Iberdrola, the Azimut Project
has the objective of providing the groundwork for the development in
around 2020 of a 15 MW offshore turbine.
Portugal Windfl oat Principle Power
In partnership with EDP and InovCapital, the Windfl oat Project intends to
install a full-scale Vestas V80 2 MW turbine for 12 months of testing in
2011. The Windfl oat is a fl oating jacket design with novel features.
Italy - BlueH
A multi-national group of companies based in the Netherlands have
developed a TLP concept consisting of a larger structure with several piles
implanted in the surface. An off-grid prototype with an inactive turbine for
visualisation purposes was installed 21 km off Brindisi, Italy in 100 m
deep waters during 2007/8.
23420_Offshore report_int_v15.indd 6323420_Offshore report_int_v15.indd 63 9/11/11 10:339/11/11 10:33

Chapter x: name of the chapter
64 Wind in our Sails – The coming of Europe’s offshore wind energy industry
Chapter 4: Substructures
KEY FINDINGS
• Substructures present major opportunities for domestic manufacturing due to low technical
barriers for entry, for example by using shipyards or tower manufacturers. Substructure manufac-
turing also brings a signifi cant amount of supply chain value as substructures represent a large
part of the capital expenditure in an offshore wind farm. It is not essential to have turbine manu-
facturing to develop an offshore wind industry.
• Substructures have a relatively high elasticity of supply, lowering bottleneck risk. They present an
attractive diversifi cation opportunity for substantial existing marine and oil and gas fabricating
capacity in Europe.
• The move into deeper waters will see an increased market share from space-frame structures
as well as novel fi xed and fl oating structures further into the future. Nevertheless improved
production and installation procedures could enhance the depth envelope of monopiles as well.
23420_Offshore report_int_v15.indd 6423420_Offshore report_int_v15.indd 64 9/11/11 10:339/11/11 10:33

Wind in our Sails – The coming of Europe’s offshore wind energy industry 65
23420_Offshore report_int_v15.indd 6523420_Offshore report_int_v15.indd 65 9/11/11 10:339/11/11 10:33

ELECTRICAL INFRASTRUCTURE5
Photo
: Stiftu
ng O
ffshore
Win
denerg
ie –
Gehrin
g
5.1 Historical context and market options
5.2 Current status of industry supply chain
5.3 Announcements and future technical trends
23420_Offshore report_int_v15.indd 6623420_Offshore report_int_v15.indd 66 9/11/11 10:339/11/11 10:33
Wind in our Sails – The coming of Europe’s offshore wind energy industry 67
interface issues (mechanical, electrical, safety and
installation) there were good reasons for incorporating
the transformer and switchgear into the turbine sup-
ply contract. Some turbine manufacturers later took
the step of moving the transformer into the nacelle.
Internal transformers also started being added to
onshore wind farms, for different reasons.
The MV switchgear commonly in use at the time
onshore was very simple: fuses internal to the trans-
formers, and manual disconnection of MV cables
when necessary. Offshore, it was soon decided that
this was unsatisfactory, and fused switches were
adopted. The very tight dimensions inside the tower
base limited the equipment that could be used, and
resulted in at least one switchgear manufacturer with
signifi cantly smaller switchgear cabinets achieving
high market penetration. As turbine rating increased
beyond around 2.5 MW, suitable fuses were no longer
available, resulting in a move to circuit breakers for
transformer protection.
Subsea cables
Although the arrangement and voltage of the MV
cables between turbines and to shore were identical
to onshore wind farms, for cables it was necessary to
use submarine cable technology. At the voltage levels
used, suitable products and suppliers already existed.
Subsea cable construction is “tri-core” – that is, a sin-
gle cable containing three phase conductors inside an
external covering. The equivalent practice onshore is
to use three separate single-phase conductors, as this
allows better cooling of the cable, and (for the same
cable drum size) longer runs between joints. The sub-
sea cable also contained an optical fi bre communi-
cations cable, whereas in onshore wind farms this is
provided by a separate cable laid in the same trench
as the MV cables.
Methods were developed for cable entry to the off-
shore foundations, and cable support and termina-
tion. In addition, techniques for installing the relatively
short lengths in shallow water had to be developed,
but for these relatively sheltered sites unpowered
"dumb" barges could be used.
5.1 Historical context and market optionsThe fi rst offshore projects
The fi rst offshore projects such as Vindeby (built in
1991) were all relatively modest in capacity (Vindeby
has 4.95 MW of capacity) and close to shore (Vindeby
is 2.5 km from shore), and so conventional medium-
voltage (MV) interconnections could be used. The
electrical infrastructure was very similar in principle to
that of onshore wind farms of the time: the turbines
were interconnected in a radial system at a voltage of
10 or 20 kV, with an onshore substation to connect to
the local distribution system. The onshore substation
sometimes included transformation to higher voltages
such as 150 kV if it was necessary to connect to the
local electricity system.
As for onshore wind farms, substantial supply chain
bottlenecks existed for transformers (especially sub-
station transformers which stepped up from MV to
100-150 kV), and for switchgear. This was because
the most of these items went to electricity system
operators, whose network development programme is
planned on timescales of years. Therefore the suppli-
ers concentrated on maximising throughput for their
existing facilities. Delivery times were (and still can
be) typically of the order of 26 weeks, or even 12 or
24 months for the larger transformers. Often these
lead times were longer than the delivery times for
the turbines, and determined the overall length of the
project.
Internal transformer and switchgear
The turbine generator voltage, commonly 690 V, had
to be stepped up to the inter-turbine voltage of 10 to
20 kV, later 33 kV. At the time of the early offshore
wind farms, the equivalent function onshore was often
achieved by a transformer and associated MV switch-
gear located in a separate cubicle outside the base
of the turbine. It was therefore necessary to provide
space to locate these items inside the turbine base.
Initially these items were treated as separate from
turbine supply, but as there are many engineering
23420_Offshore report_int_v15.indd 6723420_Offshore report_int_v15.indd 67 9/11/11 10:339/11/11 10:33

Chapter x: name of the chapter
68 Wind in our Sails – The coming of Europe’s offshore wind energy industry
Chapter 5: Electrical infrastructure
For very large offshore wind farms, several offshore
substations may be required, and there may then be
an advantage in providing redundancy by adding HV
connections between the substations.
Offshore substations largely followed offshore oil and
gas practice: a foundation structure is installed, usu-
ally a jacket structure, though monopiles have also
been used (see Section 4). A ‘topsides’ structure is
built onshore, complete with all electrical equipment,
and commissioned as far as possible, before being
transported to the site and installed on the foundation
structure. Cables are then pulled in and terminated,
and fi nal commissioning is completed. Installation of
the foundation structure and the topsides requires
larger and more expensive vessels and cranes than
for turbine installation, and the availability of suitable
vessels has been a limitation. Therefore alternatives
have been proposed including the modularisation of
the topside design, allowing for a higher number of
smaller lifts, as well as "self-installing" platforms with
integral jack-up mechanisms. Such approaches are
yet to become widespread in the offshore wind sector,
although experience from the offshore oil & gas indus-
try may be exploited in the coming years.
Export cables
As noted above, the MV cables used between tur-
bines (‘array cables’) use existing subsea cable tech-
nology. The higher-voltage export cables necessary
when using offshore substations also use standard
subsea cable technology (though see also the section
on DC cables, below). However the existing manufac-
turing capacity has been strained by the demand, and
if offshore wind continues to expand as anticipated,
substantial additional manufacturing capacity will be
needed as explored in more detail below.
Cable installation
Early projects were in relatively sheltered waters, with
relatively short cable runs. Later projects had diffi -
culty obtaining suitable cable installation vessels, and
there has been substantial development of vessels,
Earthing systems
Onshore wind farms usually require substantial buried
earthing (grounding) systems, consisting of bare bur-
ied conductors around the turbines, along cable routes,
and at substations. Offshore turbines consist entirely
of metallic and concrete structures which are closely
interconnected, and so no earthing system is required.
Larger projects, further from shore
Offshore substations
Offshore installations are the most obvious differ-
ence between early and later projects. Not all large
projects need offshore substations: those close to
shore can follow the early practice of connection to
shore at Medium Voltage. However, as the maximum
power that can be exported on the largest MV cable
is of the order of 30-40 MW, a large wind farm will
need a large number of cables. Providing landfalls and
onshore cable routes to an onshore substation for
many cables may not be easy. For distances of more
than a few kilometres, offshore substations are cho-
sen because of the cost advantage of using a small
number of high-voltage cables (typically in the range
of 120 to 150 kV). The cost comparison includes the
capitalised value of the electrical losses, which are
signifi cantly lower when using higher voltages.
The electrical equipment mounted on the offshore
substation is very similar to onshore substation prac-
tice, with additional environmental protection.
The offshore substation is recognised as a major risk
– a failure at the substation may have a very signifi cant
effect on energy production. Designs have developed
to provide substantial redundancy, and recent projects
often have two transformers, and two export cables
to shore. It is normal for each transformer and export
cable to be rated around 50% of the wind farm rated
capacity, but since the wind farm operates for most of
the time well below its rated output, this arrangement
still allows around 70 to 80% of the annual energy pro-
duction to be exported in the event of a single failure.
23420_Offshore report_int_v15.indd 6823420_Offshore report_int_v15.indd 68 9/11/11 10:339/11/11 10:33

Wind in our Sails – The coming of Europe’s offshore wind energy industry 69
made. In addition, the economics of the technology is
expected to improve over the next decade via learn-
ing and scale effects.
HVDC technology currently allows only ‘point to point’
transmission. ‘Multi-terminal’ systems are techni-
cally feasible, but have not yet been demonstrated
on a commercial scale. This will be an important step
in making use of HVDC connections to offshore wind
farms to provide interconnections between coun-
tries, as proposed in the ‘Supergrid’ concept. This
is also an important technical development for the
German market where HVDC hubs are being installed
to service multiple projects in a regional cluster. This
arrangement may also be an important feature for
certain projects within the UK, particularly for Round
3 developments.
With an HVDC connection, there is substantially more
design freedom for the wind farm electrical system
and for the wind turbines. For example, it would be
possible to run the wind farm electrical system at
variable frequency. Higher frequencies could sub-
stantially reduce transformer size and cost. It may
also be possible to directly achieve DC output from
each turbine. These issues are closely tied in with
wind turbine design, and are unlikely to be tackled on
a project basis.
Electrical system within the wind farm
Currently, standard medium-voltage equipment is
used, utilising the International Electro-technical
Commission (IEC) standard voltage of 33 kV16. As
noted above, this limits the power transmitted on a
single cable to around 30–40 MW, as cables larger
than this would be very diffi cult to handle. There may
be advantages to utilising a higher standard voltage:
45 and 66 kV are options. These voltage levels are
rarely used elsewhere so there are limited suppliers
and costs are high. However, there are indications
that this could change: the V164-7.0 MW offshore tur-
bine recently announced by Vestas is stated to have
an option for 66 kV connection17.
installation techniques, and installation tools. Many
of the problems encountered with offshore wind farm
construction have been related to cable installation
and protection.
High Voltage Direct Current
Both onshore and offshore, Alternating Current (AC)
is virtually universal for electricity generation, trans-
mission and distribution. However, High Voltage Direct
Current (HVDC) is used increasingly in specifi c circum-
stances. Converter stations at each end of a DC cable
or overhead line convert AC power to DC and vice versa.
HVDC in principle has advantages for subsea power
transmission, and with recent developments in power
electronic conversion technology, this has become a
more attractive option for longer distances and larger
wind farms. HVDC is being used by Transmission
System Operators in Germany to connect several off-
shore wind farms arranged in clusters with a total
installed capacity of 800-900 MW. This technology
is likely to be used for the larger and more distant
UK wind farms, and is considered to be cost effec-
tive for projects of around 500 MW with a cable route
of around 100 km (although these fi gures are rather
uncertain). The use of the technology offshore is still
seen as a risk given its relative immaturity, lack of
widespread application and perceived complexity. In
addition a substantial offshore substructure is needed
to support the large converter stations.
The DC/AC conversion process onshore offers sig-
nifi cant advantages to the system operator in terms
of reactive power and voltage, both steady-state and
dynamically, and of the fault current. It is fair to say
that commercial and regulatory arrangements have
not yet been developed to allow these potential ben-
efi ts to be fully realised, primarily owing to the lack
of widespread deployment to date. It is anticipated
that as HVDC technology is more widely deployed,
the relevant stakeholders will take advantage of this
potential more often once the necessary changes
to regulation and commercial practice have been
16 This is the nominal voltage. The IEC standard provides more exact defi nitions based on maximum steady-state voltage.17 http://www.vestas.com/en/wind-power-plants/procurement/turbine-overview/v164-7.0-mw-offshore.aspx
23420_Offshore report_int_v15.indd 6923420_Offshore report_int_v15.indd 69 9/11/11 10:339/11/11 10:33

Chapter x: name of the chapter
70 Wind in our Sails – The coming of Europe’s offshore wind energy industry
Chapter 5: Electrical infrastructure
is limited, and when demand increases it results in
longer manufacturing lead times. In recent years, lead
times of three years or more have been known.
Subsea cable
As noted above, the supply chain capacity for sub-
sea cable is limited, especially at the higher voltages.
The main suppliers of HV subsea cable are shown in
Table 5.1.
It is estimated that current capacity of the existing HV
subsea cable suppliers is around 1,000 km of cable
run per annum for HVDC and 700 km per annum for
HVAC18. This would satisfy the demands of around
~3-3.5 GW of offshore wind capacity per annum.
Figure 5.1 presents an analysis of the projected sup-
ply capacity against demand for the current decade.
This shows that from 2015 there could be a signifi -
cant lack of supply capacity.
5.2 Current status of industry supply chainGeneral
From the above, it is seen that the electrical infra-
structure for offshore wind projects mostly uses the
existing supply chain, which has been developed for
onshore electrical transmission and distribution net-
works. However, as wind farms are put up at increas-
ing distances from shore, electrical infrastructure can
represent a signifi cant fraction of the total capital
investment required for constructions – as much as
20% in some instances.
For most items, the demand is relatively small com-
pared to the demand for the onshore distribution and
transmission networks, and so the supply chain is ade-
quate, and likely to remain so. However, world capac-
ity for manufacturing large high-voltage transformers
Supplier HV export cables Manufacturing location Offshore wind experience
ABB Typically 150 kV Karlskrona, Sweden Established supplier
Nexans Typically 150 kV Halden, Norway Established supplier
Prysmian Recently developed 245 kV Naples, Italy Established supplier
NKT Recently developed 245 kV Cologne, Germany New entrant (to HV market)
General Cable Recently developed 245 kV Nordenham, Germany New entrant (to HV market)
TABLE 5.1 MAIN EUROPEAN SUPPLIERS OF HV SUBSEA CABLE (EXPORT CABLES)
18 BVG Associates, "Towards Round 3: Building the Offshore Wind Supply Chain", 2010.
23420_Offshore report_int_v15.indd 7023420_Offshore report_int_v15.indd 70 9/11/11 10:339/11/11 10:33

Wind in our Sails – The coming of Europe’s offshore wind energy industry 71
voltages for the electrical system within the wind farm,
as discussed earlier (i.e. 45 or 66 kV), there is likely
to be a shortage of manufacturing capacity for these
higher-voltage array cables.
In the coming decade, the offshore wind sector is
expected to become the predominant market for both
MV and HV subsea cables, but additional production
capacity, especially for HV cables, appears to be an
urgent requirement.
Electrical switchgear and
transformers
If higher voltages become widely accepted for array
cables connecting turbines to each other and to the off-
shore substation, that is, the 45 kV or 66 kV options
noted above, there will be a need for expanded produc-
tion facilities for switchgear to operate at these voltage
levels. This is not thought to present any major diffi culty.
The lead time associated with bringing new subsea
cable capacity online is signifi cant – around three to
four years. Therefore it follows that signifi cant invest-
ment decisions in new capacity need to be made by
the end of 2011 if a bottleneck situation is to be
avoided in the middle of the decade.
Expansion is most likely to come from existing sub-
sea cable suppliers setting up new production facil-
ities. Current manufacturers of MV subsea cables
may consider expanding their capabilities to supply
HV subsea cables.
The supply base for MV subsea cables for array cabling
is considerably more diverse and has attracted diver-
sifi cation from the offshore oil & gas sector which is
the other key user of these products. There may be a
need for some expansion of manufacturing facilities,
but this is not currently seen as a critical issue. If wind
farm designers seek to make the transition to higher
FIGURE 5.1 ANALYSIS OF SUPPLY AND DEMAND FOR HV SUBSEA CABLES
0
1,000
2,000
3,000
4,000
5,000
6,000
7,000
8,000
Dem
and
/ su
pply
cap
acity
(M
W)
Demand Estimated supply
2010 2011 2012 2013 2014 2015 2016 2017 2018 2019 2020
Source: GL Garrad Hassan
23420_Offshore report_int_v15.indd 7123420_Offshore report_int_v15.indd 71 9/11/11 10:339/11/11 10:33

Chapter x: name of the chapter
72 Wind in our Sails – The coming of Europe’s offshore wind energy industry
Chapter 5: Electrical infrastructure
Until recently there was only one established supplier
of this technology, but now, there are at least two other
major players developing competing technologies. The
emergence of signifi cant offshore wind capacity in the
German Bight, where "collectivised" HVDC connection
is being driven by the grid operator (Tennet Offshore
GmbH), is a key driver for this technology, with UK
Round 3 capacity as a secondary future market.
The major components are the silicon power-electronic
devices themselves. These are produced by companies
producing a wide range of electronic devices, and so
substantial supply-chain constraints are not expected.
Drivers and constraints
The major driver is reduction in cost. As noted above,
the major electrical items are relatively mature, and so
cost reduction is likely to come from:
• Cable installation: availability of better vessels and
tools, including reducing risk and increasing weather
capability.
• Offshore substations: standardisation, volume pro-
duction, better installation methods and optimisa-
tion of support structures.
• HVDC: competition, volume production.
The main constraint that is foreseen is the supply of
subsea cable, especially at higher voltages, as dis-
cussed above.
Regulatory issues may also become constraints. In
particular, it will be necessary to develop clear regula-
tory procedures for dealing with offshore wind farms
with connections to more than one electricity market
or more than one network operator, where the connec-
tions may be used as an interconnector.
Another regulatory issue to solve is the diffi culty of
achieving an optimal interconnection arrangement for
multiple wind farms, where these are developed by dif-
ferent owners on different timescales.
In some locations, constraints on available routes for
cables may become signifi cant, especially where the
cable reaches the shore – known as the “landfall”.
Supplies of transformers at these voltage levels
are likely to be restricted initially, until suffi cient vol-
ume builds up in the offshore wind industry to justify
expanded production facilities for this niche market.
Offshore substation suppliers
Several companies have established themselves as
providers of complete offshore substation topsides:
see Table 5.2. As yet, however there is little standardi-
sation in substation ratings (MW) or confi gurations.
TABLE 5.2 MAIN SUPPLIERS OF OFFSHORE
SUBSTATIONS TOPSIDE
Supplier Offshore wind experience
ABB Established supplier
Alstom Grid
(formerly Areva T&D)Established supplier
Siemens Energy Established supplier
C&G / Fabricom New entrant
A handful of other suppliers are actively pursuing this
market, although the players mentioned above can
be considered as the core of the supply-base.
The large MV/HV transformers around which offshore
substations are designed and built may have delivery
times of up to three years, depending on demand else-
where. Compared to the requirements of other indus-
tries, the requirements for offshore wind are likely to
be small.
HVDC suppliers
HVDC technology is developing rapidly. Standard tech-
nology is based on current source converters, which is
familiar and has a long track record, but some techni-
cal disadvantages. Developments in power semicon-
ductor technology now allow voltage source converters
at large scale. This technology is more expensive,
and also has higher converter losses, but has other
technical advantages which are particularly relevant
for offshore wind farms. Voltage source technology is
expected to dominate.
23420_Offshore report_int_v15.indd 7223420_Offshore report_int_v15.indd 72 9/11/11 10:339/11/11 10:33

Wind in our Sails – The coming of Europe’s offshore wind energy industry 73
roll-out of several German offshore wind projects fol-
lowed by Round 3 developments in the UK, these
requirements will become increasingly pertinent in the
next fi ve years.
As noted above, the use of HVDC opens up radical
options for design of the wind farm electrical system
and the turbine electrical system: developments in
this area are likely to be slow, because they require
wind turbine manufacturers and wind farm electri-
cal system designers to work together. Unless there
are substantial advantages, project developers and
funders are likely to be wary of radical changes.
It is possible, and perhaps likely, that higher voltages
will become normal for the connections within the
wind farm. The recent announcement from Vestas of a
66 kV option within their fl agship offshore turbine is a
step in this direction.
Permitting issues for onshore network reinforcements
may become a constraint, as with large-scale onshore
wind projects.
5.3 Announcements and future technical trendsSubstantial deployment of HVDC technology is
expected, which should lead eventually to cost
reductions.
Multi-terminal HVDC systems require demonstration
to increase investor confi dence and "provenness".
Also, equipment from different suppliers will need to
be operated together given the potential for regional
HVDC hubs and ultimately, the Supergrid. With the
KEY FINDINGS
• There is a limited range of suppliers for HV subsea cables, a situation compounded by high
investment costs and long lead times for new capacity.
• Signifi cant advances are being made in the use of HVDC with a wider range of suppliers and there
is future potential for multi-terminal capability.
• There is a move towards considering higher voltages for connections between turbines within an
offshore wind farm.
• Substantial additional cable manufacturing capacity will be needed. Without new capacity a
shortage of HV subsea cables is looming. Other equipment is generally drawn from much larger
transmission and distribution (T&D) industries which are relatively unconstrained, with the
exception of HV transformers, where delivery times are set by general world demand.
23420_Offshore report_int_v15.indd 7323420_Offshore report_int_v15.indd 73 9/11/11 10:349/11/11 10:34
VESSELS6
Photo
: Eon
6.1 Vessel use at offshore wind farms
6.2 Estimation of future demand
6.3 Installation vessel types
6.4 New build and announced vessels
23420_Offshore report_int_v15.indd 7423420_Offshore report_int_v15.indd 74 9/11/11 10:349/11/11 10:34

Wind in our Sails – The coming of Europe’s offshore wind energy industry 75
during the installation of substructures and turbines.
The main points of consideration when selecting ves-
sels for these tasks include: ship performance, cost,
lift capacity, precision when lifting, vessel dimensions,
metocean (meteorological and oceanographic) limi-
tations, technical risk and commercial availability.
Other lower specifi cation vessels are used to trans-
port equipment and personnel to the site. Indeed one
developer reported using over a hundred vessels at
various times during the construction of a particular
project, demonstrating that the main installation ves-
sels are vastly outnumbered by the huge fl otilla of sup-
port craft required.
To date, over thirty vessels consisting of a number of
variant vessel designs have been utilised for substruc-
ture or turbine installation purposes. These include:
jack-up vessels, leg-stabilised crane vessels, heavy
lift cargo vessels, semi-submersible heavy lift vessels,
shearleg cranebarges and fl oating dumb barges with
cranes. A brief description of these different options is
provided in Section 6.3.
Site operations
Crane vessels will also be required during the opera-
tional phase of a wind farm life to perform major tur-
bine repairs although often this will be achieved with
lower specifi cation vessels than those used above
for installation purposes. Further signifi cant demand
comes from craft to transport technicians to and from
site for O&M purposes. Traditionally 12-passenger
work boats have been used for this task although for
future projects further from shore, larger vessels as
well as helicopters are increasingly being employed.
Furthermore, interest in using “fl oatels” or “mother-
ships” for the operation and maintenance of projects
further than 50 km from port is gaining momentum,
with some major providers proposing this method
during the commissioning and operational phases
of a project. Crews live aboard large fl oating vessels
located within the vicinity of the wind farm, typically
adopting a two-week on, two-week off shift as practiced
in the oil and gas industry. Motherships in particular
would appear to have an advantage due to their abil-
ity to deploy multiple small, agile craft during periods
6.1 Vessel use at offshore wind farmsA natural consequence of developing wind farms off-
shore is the need for suitable vessels for transporta-
tion and from which to perform the various activities
during the development, construction, operation and
decommissioning stages of a wind farm life.
Depending on the operation in question, these needs
range from the simple use of basic, generic vessels
currently used in other industries without the need
for further modifi cation, to bespoke, highly expen-
sive vessels designed for specifi c installation tasks.
Given the expected steep growth in the European off-
shore wind energy market over the next ten to twenty
years, and given that sites will move into ever more
challenging conditions, meeting the demand for the
highly specialised installation vessels will be a key
dynamic in the offshore wind industry supply chain.
Lead times for such vessels from order to delivery
are 24 to 36 months with longer for more specialised
designs. These times fi t relatively comfortably into a
typical timetable for the development of an offshore
wind farm, although experience has shown that time
should be set aside for possible delays.
Site development
The main functions of the vessels during the devel-
opment stage include carrying out of the surveys
required for an Environmental Impact Assessment,
geophysical surveys and geotechnical surveys (includ-
ing cable route survey). Of these, the latter have the
most onerous requirements with the need to provide
a stable platform from which to take borehole sam-
ples. Installation vessels such as jack-up types can
be used for this task although the specifi cations for
geotechnical surveys are greatly lower than those for
substructure or turbine installation and it will often be
uneconomical to use the same vessel for all these
tasks. This kind of lower-spec jack-up vessel can also
be used to perform meteorological mast installation.
Site construction
It is during the construction phase that the great-
est demands are made on vessel types, specifi cally
23420_Offshore report_int_v15.indd 7523420_Offshore report_int_v15.indd 75 9/11/11 10:349/11/11 10:34

Chapter x: name of the chapter
76 Wind in our Sails – The coming of Europe’s offshore wind energy industry
Chapter 6: Vessels
6.2 Estimation of future demandGiven that no signifi cant decommissioning work is
expected prior to 2020, the supply of installation ves-
sels for offshore wind projects over the next decade
can be categorised into three main types of operation:
1. Wind turbine foundation installation: generally un-
dertaken from a jack-up type vessel with some po-
tential for utilisation of fl oating barges;
2. Wind turbine erection: exclusively from jack-up type
vessels; and,
3. Wind turbine repair operations: where jack-up ves-
sels are required for major operations.
Future supply-side capacity has been projected for
four scenarios:
• Firm capacity, consisting of existing dedicated off-
shore wind installation vessels, those which are un-
der construction or contract as well as some vessel
availability from other industries (coastal engineer-
ing and offshore oil and gas);
• Low case, consisting of fi rm capacity with two addi-
tional new bespoke dedicated offshore wind instal-
lation vessels becoming available from 2015;
• Mid case, consisting of fi rm capacity with the addi-
tion of up to fi ve new bespoke dedicated offshore
wind installation vessels becoming available by
2020;
• High case, consisting of fi rm capacity with the ad-
dition of up to 10 new bespoke dedicated offshore
wind installation vessels becoming available by
2020.
Of these scenarios, the mid case is considered to be
the most likely and realistic.
of benign weather conditions, or transit to the turbine
themselves and use a specialist access system during
periods of more severe conditions. The size of fl oatels
or motherships not only allows technicians to live near
the vicinity of the wind farm for extended periods of
time, but also provides suffi cient deck space and sta-
bility to mount heave-compensated access systems
which are generally too large for standard work boats.
In this manner, time available for plant maintenance
can be maximised by reducing transit time and ena-
bling access in rougher sea conditions.
Fixed structures have also been proposed for offshore
accommodation in the vicinity of the project however,
these can have signifi cant construction and installa-
tion costs associated with them. One approach which
may allow these costs to be reduced is to combine
the accommodation platform with the offshore sub-
station however, this has numerous issues connected
with it, such as living in close proximity to HV equip-
ment and loss of heavy-lift access to substation com-
ponents. Horns Rev 2 in Denmark is currently the only
operational offshore project to utilise a fi xed offshore
accommodation platform and this is located adjacent
to the substation on a separate foundation structure.
A key limiting factor for fi xed offshore structures is that
whilst shift durations may be maximised by reduced
transit times, accessibility is still limited by the capa-
bility of the vessels used to transport technicians to
and from the turbines.
Site decommissioning
Similar vessels to those used for installing wind
turbines will be required for their removal during
decommissioning or repowering of offshore wind
farm sites.
23420_Offshore report_int_v15.indd 7623420_Offshore report_int_v15.indd 76 9/11/11 10:349/11/11 10:34

Wind in our Sails – The coming of Europe’s offshore wind energy industry 77
gas work in mind, being chartered for wind turbine
installation. Seaway Heavy Lifting’s new 5,000 tonne
lift crane vessel, Oleg Strashnov, and Master Marine’s
Edna, and Service Jack 2, may well also make the
transition, and are regularly considered for work. The
volatile nature of the price of oil will probably be the
principal driver defi ning which industry makes most
usage of such vessels.
Projected supply and demand for the principal vessels
for installation of foundations and wind turbines are
compared graphically in Figure 6.1 below.
Other key activities include specialist vessels for the
installation of export cables, and inter-array cables
and heavy lift vessels for the installation of offshore
substation foundations and topsides. Consideration
of the slightly less critical operations is excluded from
the current assessment.
Some vessels active in the oil and gas industry have
been carrying out work on offshore wind farm sites.
Examples include Seaway Heavy Lifting’s Stanislav
Yudin performing monopile and substation installa-
tion, and Seajacks’ new-build vessels Kraken, and
Leviathan, specifi ed with both wind farm and oil and
FIGURE 6.1 PROJECTED OFFSHORE INSTALLATION VESSEL SUPPLY AND DEMAND (VESSELS PER ANNUM)
5
0
10
15
20
25
30
35
40
2010 2011 2012 2013 2014 2015 2016 2017 2018 2019 2020
Mai
n in
stal
latio
n ve
ssel
s (o
ffsho
re w
ind)
Demand − repair
Demand − foundations
Demand − turbines
Supply − firm capacity
Supply − low case
Supply − mid case
Supply − high case
Source: GL Garrad Hassan
23420_Offshore report_int_v15.indd 7723420_Offshore report_int_v15.indd 77 9/11/11 10:349/11/11 10:34

Chapter x: name of the chapter
78 Wind in our Sails – The coming of Europe’s offshore wind energy industry
Chapter 6: Vessels
activity in the North Sea may somewhat constrain
the availability of labour from this source. Overall, the
analysis indicates a good balance between demand
and supply in the short to medium term followed by
the potential for supply constraints.
6.3 Installation vessel typesThe following section provides an introduction to the main
vessel types used for installation at offshore wind farms.
In general, it can be seen that supply is expected
to signifi cantly exceed demand up to 2015 although
potentially shortages could occur for specifi c vessel
categories such as cable laying. In the latter half of
the decade, as demand ramps up, there appears to
be potential for a signifi cant bottleneck depending on
the extent of new capacity coming on line. The lead
time associated with a new main installation vessel
is 24 to 36 months. However, the potential for using
resources from depressed oil and gas and coastal
engineering sectors should not be underestimated,
although increasing oil and gas decommissioning
FIGURE 6.2 EXAMPLES OF INSTALLATION VESSEL TYPES
Jack-up vesselExcalibur
DP2 Heavy lift cargo vesselJumbo Javelin
Leg-stabilised crane vesselA2Sea Sea Power at Lilligrund
Semi-submersible heavy lift vesselThialf at Alpha Ventus
Photo
: ©D
OTI 2
00
9/Alp
ha V
entu
sPhoto
: A2
SEA –
Hans B
loom
berg
Photo
: CR
G, G
unfl e
et S
ands W
ind Fa
rmPhoto
: Jum
bo S
hip
pin
g W
ebsite
23420_Offshore report_int_v15.indd 7823420_Offshore report_int_v15.indd 78 9/11/11 10:349/11/11 10:34

Wind in our Sails – The coming of Europe’s offshore wind energy industry 79
The ever increasing water-depths and foundation and
turbine weights mean that the vessels which carried
out the fi rst installations, in water depths of less than
25 m, are needed less frequently. A small number of
existing vessels with longer legs will be joined by new
build vessels, with the capacity to carry out the larger
5 to 7 MW class turbine installation work in waters
from 30-45 m deep. More vessels are needed that are
capable of operating in the large areas of the German
Bight and UK Round three sites which are over 45 m
in depth. However, there have been at least some
announcements of new build (see 6.4).
Leg-stabilised crane vessel
So far only two vessels of this class have entered the
wind farm installation fl eet and both are owned by
A2Sea – Sea Energy and Sea Power. They were stand-
ard ships before they were retro-fi tted. This adaption
has proved a versatile reduced-budget installation
craft, which was ideal to install wind turbines in the
shallower sites of the early wind farms.
The origins of the vessels mean that they have good
hydrodynamic hull forms and transit rapidly and eco-
nomically. This has allowed some sites to collect tur-
bines from the manufacturer’s load-out facility and
deliver them direct to site in reasonable cycle-times,
Jack-up vessels
Jack-ups are capable of most roles on wind farms
sites, and their stability means that they dominate
turbine installation. Smaller vessels with longer legs
are likely to fi nd favour for the pre-piling of jacket
foundations.
Early wind farms used jack-up vessels for virtually
every task. This was largely because wind farms were
smaller than those under construction at present, and
because it was most economical to use one versatile
vessel for all tasks, than to mobilise a number of cus-
tomised vessels to carry out specifi c roles. At larger
future sites, greater specialisation with site-optimised
vessels can be anticipated.
The stable base provided by a jack-up is equivalent to
working onshore, and onshore lift specifi cations can be
used (except when lifting from a fl oating plant, or when
some other dynamic lifting is required). This makes
them ideal for installing the nacelles and blades of tur-
bines, which are the most precise lifts required on a
project, and they effectively dominate this area of work.
If there are vessel shortages in the next decade, jack-up
vessels will probably be restricted to turbine installation
work, and attract a premium, while fl oating solutions will
be used for the majority of other activities.
Shearleg cranebargeRambiz
Floating dumb barge with craneHaven Seaforth
Photo
: CR
G, G
unfl e
et S
ands W
ind Fa
rm
Photo
: Scald
is S
alva
ge a
nd M
arin
e C
ontra
cto
rs N
V
23420_Offshore report_int_v15.indd 7923420_Offshore report_int_v15.indd 79 9/11/11 10:349/11/11 10:34
Chapter x: name of the chapter
80 Wind in our Sails – The coming of Europe’s offshore wind energy industry
Chapter 6: Vessels
Semi-submersible
heavy lift vessel
This type of vessel has been developed by the oil
and gas industry to carry out placement of oil rig
modules in harsh offshore conditions. The hull can
be fl ooded, greatly increasing the deadweight of the
craft, and it is designed so that this ballasting oper-
ation dramatically lowers the period of roll of the
craft. This change in vessel dynamics effectively
“tunes out” the effect of the waves on the craft,
and therefore the problem of inopportune wave-peri-
ods leading to resonance can be avoided. The ves-
sel is effectively motionless in the water, unaffected
by all but the biggest waves. Clearly the huge struc-
ture presents a large surface to the wind, but again,
the overall stability is such that even delicate lifting
operations can be carried out in deep water during
relatively strong wind conditions.
The use of the Thialf crane at Alpha Ventus due to the
particular circumstances of the project notwithstand-
ing, it is unlikely that this vessel type will be used on
offshore wind farms for turbine or foundation installa-
tion in the future. Day rates for this exorbitantly expen-
sive class of vessel are prohibitive to the offshore
wind installation market in general.
Occasionally there could be a role for these craft in
substation installation.
Shearleg cranebarge
The shearleg barge is fundamentally a very heavy-
lift confi guration of a dumb barge. The lifting frame
is permanently attached to the deck, and most have
some form of skid-mounted or containerised propul-
sion unit fi tted to the deck. This sort of vessel is
mainly designed for heavy-lifting in sheltered waters,
but the larger vessels (over 500t) usually have some
limited capability to operate offshore, in varying levels
of sea-state.
Vessels of this type are available in northern European
waters and have a capacity of up to 3,300t. They can
transit in seas with signifi cant wave heights of over
with the commensurate saving of the costs of a con-
struction mobilisation and storage port. It has also
won them feeder vessel duties.
The 24 m maximum working water depth means that
their future is limited. They may well be used for tur-
bine, or possibly transition piece installation in shal-
low areas of future sites, but they are more likely to
fi nd ongoing work in the O&M vessel fl eet for the exist-
ing wind farms which they helped to install, and where
they have the leg-length to operate.
DP2 heavy lift cargo vessels
Cargo vessels deliver loads rapidly and cheaply around
the world, and by fi tting heavy cranes to the vessel, they
can collect and deliver cargo from ports where there is
not enough crane capacity. Being ships, their hull-form
is far sleeker that the majority of crane vessels.
With their high transit speeds, heavy-lift capacity, and
lower day-rates than other equivalent lift-capacity
vessels, it is likely that this type of vessel will see a
greater role for future offshore wind projects.
Heave-compensation systems have been retro-fi tted to
these vessels in some instances, and offshore vessel-
to-vessel transfers have been performed in relatively
rough seas. This suggests they could fi nd favour as
feeder-vessels as wind farms move further offshore.
These vessels have been used successfully by the oil
and gas industry for a wide variety of offshore instal-
lation duties. Pictured in fi gure 6.2 is a jacket instal-
lation, during which the vessel carries not only the
jacket structure but also the pin piles as well as pil-
ing and grouting equipment. Likewise tripods would
appear to be another potential application. The two-
crane tandem lift confi guration largely avoids prob-
lems with the limited under-hook height which many
single-crane vessels struggle with when dealing with
deeper water structures.
However, these vessels lack the stability necessary to
install wind turbines, so jack-ups will continue to domi-
nate in this role.
23420_Offshore report_int_v15.indd 8023420_Offshore report_int_v15.indd 80 9/11/11 10:349/11/11 10:34

Wind in our Sails – The coming of Europe’s offshore wind energy industry 81
Floating dumb barge with crane
The cheapest fl oating lift-craft is formed by placing a
land-based crane on to a dumb barge. This is the most
common type of vessel used to support river, coastal
and estuarine marine construction projects.
Dumb barges are the most basic of craft, and any addi-
tional equipment to enhance their capability must be
added to the deck of the barge. The stability of this
confi guration of craft means that it is unsuitable for
the role of the principal installation vessel. However,
craft of this type will often be used for a multitude of
small roles on any offshore construction site, and may
fulfi l the role of a feeder vessel – but offshore unload-
ing will most likely be carried out by the main installa-
tion vessel in all but the most benign sea conditions
(such as the Chinese inter-tidal sites).
Current marketplace
As described in Section 3, depending upon the contract-
ing structure employed, marine contractors typically
hold responsibility for the installation of substructures,
wind turbines and substation foundations and topsides.
Cable installation is more commonly undertaken under
a separate contract. A selection of leading European
marine contractors who are active in the offshore wind
sector is presented in Table 6.1.
1 m, and carry out lifting operations in seas with
waves of between 0.5 and 1 m high depending on the
size of the craft.
Since lifting is always over the “end” of the barge,
shearleg cranes require less beam (width) than
crane vessels of an equivalent lift capacity which
can carry out fully-rotating lifts. This is a major
advantage in ports with narrow lock-gate widths to
wet-basins.
Given that piling hammers are far lighter than the
piles that they drive, a role is emerging for shearleg
crane vessels to deliver monopiles, jackets or tripods
to jack-up piling vessels pre-stationed at the founda-
tion site, and for the shearleg to lower the foundation
ready for piling.
Recent experience on one site led to programme
delays because the metocean limits on seabed-place-
ment of tripod foundations by the shearleg installation
vessel meant that the placement could only be carried
out in very fair weather conditions. It is unlikely that
shearlegs will be used so far offshore in anything but
summer weather windows.
The narrow beam of the vessel can on occasion allow
it access to ports which even relatively small jack-ups
cannot enter due to width restrictions.
TABLE 6.1 SELECTION OF INCUMBENT AND NEW ENTRANT MARINE CONTRACTORS
Company Main vessels Comments
A2SeaSea Energy, Sea Power, Sea Jack,
Sea WorkerLeading established supplier – substantial track record.
MPI Offshore Resolution, Adventure, Discovery (C) Leading established supplier – substantial track record.
Ballast Nedam Svanen Leading established supplier – substantial track record.
Scaldis Rambiz Leading established supplier – substantial track record.
Seaway Heavy Lift Stanislav Yudin, Oleg Strashnov Diversifi er from offshore oil and gas. Heavy lift specialist.
Seajacks Kraken, Leviathan, Zaratan (C) Jack-up specialist targeting North Sea offshore wind and O&G.
Geosea Buzzard, Goliath, Neptune (C) Diversifi er from coastal engineering / drilling. Track record
established at Thornton Bank and Alpha Ventus.
Fred Olsen Windcarrier 1 (C), Windcarrier 2 (C) New entrant with bespoke new build vessels.
Swire Blue Ocean Unnamed (C) New entrant with bespoke new build vessel.
"(C)" denotes vessel under construction or contract.
23420_Offshore report_int_v15.indd 8123420_Offshore report_int_v15.indd 81 9/11/11 10:349/11/11 10:34

Chapter x: name of the chapter
82 Wind in our Sails – The coming of Europe’s offshore wind energy industry
Chapter 6: Vessels
farms to date. Table 6.2 gives details of each of these
vessels.
Just over thirty vessels have been used in founda-
tion or turbine installation roles in the offshore wind
TABLE 6.2 VESSELS USED TO DATE FOR OFFSHORE WIND FARM INSTALLATION ACTIVITIES
Name Owner
Max lift
(t) Type
Length
(m)
Laden
draft
(m)
Build
year
Self-
propelled
(y/DP/n)
Max
for legs
depth (m)
1. Buzzard DEME 750* Towed jack-up 43 2.97 1982 n 30
2. Eide 5 EIDE Marine Services 1,800 Shearleg Cranebarge 30.5 2.18 1971 n n/a
3. Fen Jin n/a 500 Shearleg crane 100 4.8 2006 y n/a
4. Excalibur Fugro Seacore 220 Towed jack-up 60 2.55 n/a n ~40
5. Goliath DEME 750* Towed jack-up 55 3.6 2009 n 40
6. GPS Atlas GPS Marine 400 Shearleg Cranebarge 46.86 3.28 1967 y n/a
7. JB114 Jack up Barges BV 300 Towed jack-up 55.5 3.6 2009 n 40
8. JB115 Jack up Barges BV 300 Towed jack-up 55.5 3.6 2009 n 40
9. JB116 Jack up Barges BV 80 (300+) Towed jack-up 67.5 3.9 2010 n 45
10. Jumbo Javelin Jumbo Shipping 1,800 DP2 Heavy Lift Cargo 144.21 8.1 2004 y n/a
11. Krake n SeaJacks 300 DP Propelled Jack-up 76 3.65 2009 DP 48
12. Leviathan SeaJacks 300 DP Propelled Jack-up 76 3.65 2009 DP 48
13. Lisa A Smit 600 Towed jack-up 72.65 4 n/a n 38
14. Matador 3 Bonn and Mees 1,500 Shearleg cranebarge 70 5.8 5.8 y n/a
15. Muhibbah JB1 Muhibbah Marine 270 Towed jack-up 48.79 3 1960 n ~30
16. MPI Resolution MPI Offshore 300 (600) Jack-up crane vessel 130 4.3 2003 y 35+
17. Odin Hochtief 300 Towed jack-up 46.1 3.25 2004 n 45
18. Pauline Besix 200 Towed jack-up 48 2.5 2005 n 30
19. Rambiz Scaldis 3,300 Shearleg cranebarge 85 5.6 1976 y n/a
20. Sea Energy A2Sea 400 Leg-stablised vessel 91.76 4.25 2002* n 24
21. Sea Jack A2Sea 1,300 Towed jack-up 91.2 3.8 2003 n 30
22. Sea Power A2Sea 400 Leg-stablised vessel 91.76 4.25 2002* n 24
23. Sea Worker A2Sea 400 Towed Jack-up 55.5 3.6 2008 n 40
24. Stanislav Yudin Seaway Heavy Lifting 2,500 Heavy lift vessel 185 9 (13) 1985 n n/a
25. Svanen Ballast Nedam 8,700 Heavy lift vessel 102.75 6 1991 n n/a
26. Taklift 4 Smit 2,400 Shearleg crane 83.2 6.02 1981 y n/a
27. Taklift 7 Smit 1,600 Shearleg crane 72.56 4.9 1976 y n/a
28. Thor Hochtief 500 Towed Jack-up 70 3.5(7.4) 2010 n 50
29. Titan 2 Atlantic Oilfi eld Services 400 Self propel’d jackup 51.97 4.2672 2008 n 60.96
30. Thialf Heerema 14,200 Semi-sub HLV 201.611.8 - 31.6
1985 DP n/a
31. Wind De Brandt 200 DP2 jackup 55 2.4 1995 y 30
32. Wind Lift 1 BARD 500 DP2 Jack-up vessel 93 3.5 2010 DP 45
Source: GL Garrad Hassan
23420_Offshore report_int_v15.indd 8223420_Offshore report_int_v15.indd 82 9/11/11 10:349/11/11 10:34

Wind in our Sails – The coming of Europe’s offshore wind energy industry 83
half have remained in their fl eet, vessels have regu-
larly been sold after completion.
• MPI Offshore bought the boat Resolution from the
administrators of Mayfl ower, and has operated her
successfully for several years. She was upgraded
with a 600t crane in the winter of 2010/2011, al-
though this may still be inadequate for the majority
of UK Round 3 areas. MPI have therefore ordered
two larger vessels, and as the fi rst of the new gen-
eration of custom offshore wind farm vessels to ar-
rive on the market in 2011, their progress will be
keenly monitored.
• Van Oord has purchased two wind farm installation
vessels which are to be built in Germany.
• An unknown buyer has ordered a Gusto MSC de-
signed NG 9000 vessel, being built at Drydocks
World, publically stating that it will be sold to the off-
shore wind industry. This will probably attract keen
interest, arriving on the market as it does at a peak
time for contracting activity for UK Round 3 develop-
ment and a number of German wind projects. The
investment of €100 m+ by entrepreneurs in an in-
dustry is a sign of the view that the industry is ex-
pected to take off in the near future, and will have
been noted by many other vessel owners.
• Several deepwater installation methodologies are
under development which make use of fl oating ves-
sels for sites beyond the operational limits of jack-
up vessels.
6.4 New build and announced vesselsA perceived shortage of suitable vessels capable of car-
rying out installation work for UK Round 3 and German
offshore wind projects has led to a spate of new-build
commissions. Specifi cations for these vessels were
driven by the quantities of turbines and foundations that
were expected to be installed, and the water depths and
climatic conditions of the proposed sites.
Key trends and announcements include:
• Leading developer, RWE Innogy has decided to pur-
chase its own vessels, Victoria Mathias, and Friedrich
Ernestine, presumably for the added supply chain se-
curity this provides.
• Fred Olsen have similarly joined a joint venture which
has won UK leases, and have opted to purchase ves-
sels, but this is less surprising given their history in
vessel ownership and marine contracting.
• Seajacks have been intending to increase their fl eet
for some time, and have not only commissioned new-
build Zaratan, but have announced their intention to
purchase a similar vessel shortly.
• Siemens recently took a 49% stake in A2Sea, and they
have announced the long awaited Sea Installer order.
• Jack-up Barges have ordered a large number of jack-up
vessels over the last few years. While approximately
KEY FINDINGS
• The industry is seeing increasingly specialised vessels for offshore wind generally and in the
specifi c tasks performed on an offshore wind site. Nevertheless jack-up designs are expected to
continue to dominate vital installation procedures and particularly turbine erection.
• There is some evidence of strategic investment by developers to secure vessels. However the
near-term relaxing of supply constraints may stem this movement.
• The supply chain outlook is strong through to 2015 with several new builds, increased levels of
competition and supply likely to meet demand. Through the latter half of the decade increasing
pressure may return if no further new investment comes forward.
23420_Offshore report_int_v15.indd 8323420_Offshore report_int_v15.indd 83 9/11/11 10:349/11/11 10:34

PORTS7
Photo
: C-p
ow
er
7.1 Background: the role of ports in offshore wind development
7.2 Port requirements and current status
7.3 Announcements and future trends
23420_Offshore report_int_v15.indd 8423420_Offshore report_int_v15.indd 84 9/11/11 10:349/11/11 10:34

Wind in our Sails – The coming of Europe’s offshore wind energy industry 85
The decision over which approach to take will be
dependent upon cost-benefi t analyses. Mobilisation
ports may be economically advantageous where the
offshore wind site is located at some distance from
the manufacturing hubs but not in an area with signifi -
cant enough activity to justify long-lasting local supply
chain development. A further driver can be the differ-
ence in labour costs between manufacturing locations,
which could offset the added transportation costs.
It is also important to consider the implications for a
port owner of the approach taken by players involved
in the offshore wind industry. Manufacturing facilities
are likely to be created with the intention of provid-
ing component supply over the long-term to numer-
ous projects. In contrast, the use of a port for purely
mobilisation purposes is shorter lived. In the latter
circumstances a port owner will need to balance any
investment in dedicated facilities for offshore wind
development with demands from other business
streams and the likelihood of a consistent revenue
stream.
Further opportunities for ports servicing the off-
shore wind industry occur post-construction during
project operations with the provision of O&M activi-
ties, although requirements are less demanding than
during construction. Small 12-passenger workboats
have traditionally been used to transport technicians
between port and site however, as projects move fur-
ther offshore, larger vessels and helicopters are likely
to be increasingly employed, with the requirement of
port-based support infrastructure.
New concepts, such as the Dutch ‘harbour at sea’ are
also being researched for servicing future large off-
shore arrays implemented far from shore. It consists
of multi-purpose platforms which could allow sailing
times to be reduced for installation and maintenance.
7.1 Background: the role of ports in offshore wind developmentThe preceding chapters have provided an overview of
the major supply chain components for the develop-
ment of offshore wind farm projects as well as con-
tracting structure between the players involved. In
order to facilitate this development, the availability of
suitable ports is a major logistical consideration for
the industry. Within the next ten years, manufactur-
ers will have moved closer to, or located outlets at,
port facilities. This will require an integrated approach
towards offshore wind, based on a strong manufac-
turing capacity, testing facilities, demonstration sites,
research and training facilities, supported by dedi-
cated harbours.
The forecast acceleration of wind turbine deployment
in northern Europe has been identifi ed by many ports
as a signifi cant opportunity to counter-balance the
economic downturn hitting traditional activities. This
is particularly true of those with a history in the off-
shore oil and gas business in areas where activities
relating to exploration and production are expected to
be in decline over the next two decades.
Ports can effectively be divided into two types: manu-
facturing ports and mobilisation ports. The use of the
latter as a distinct port is dependent upon the deci-
sion to deliver turbines, substructures or sub-assem-
bled components directly to the offshore wind farm site
or not. A second decision is whether to transport com-
ponents from the port on the main installation vessel
itself, or to use feeder vessels for ferrying components
between port and site before transferring them offshore
for actual installation. These decisions and the corre-
sponding approaches are summarised in Figure 7.1.
23420_Offshore report_int_v15.indd 8523420_Offshore report_int_v15.indd 85 9/11/11 10:349/11/11 10:34

Chapter x: name of the chapter
86 Wind in our Sails – The coming of Europe’s offshore wind energy industry
Chapter 7: Ports
Key to maps:
M = Manufacturing site
MP = Mobilisation Port
WF = Wind Farm
FIGURE 7.1 ALTERNATIVE APPROACHES TO WIND TURBINE INSTALLATION
M
M
M
M
WF
WF
MP MP
WF
WF
= Transportation/Feeder vessel
= Installation vessel
23420_Offshore report_int_v15.indd 8623420_Offshore report_int_v15.indd 86 9/11/11 10:349/11/11 10:34
Wind in our Sails – The coming of Europe’s offshore wind energy industry 87
mobilisation port – as outlined above – will only take on
the construction requirements whereas if no mobilisa-
tion port is used, the port must be capable of fulfi lling
both manufacturing and construction requirements.
For each type of item being produced or installed it is
therefore necessary to consider what port infrastruc-
ture is needed during both the manufacturing and the
construction phases, and in some cases (particularly
for jacket foundation structure sub-assemblies) there
are intermediate requirements during possible reloca-
tion of sub-components, between specialised manu-
facturing facilities.
However, even if requirements differ, the following def-
inition of a suitable construction port for the short
to long term period – based on work undertaken by
EWEA’s Offshore Wind Industry Group (OWIG) – applies:
• The quayside should be long enough to accommo-
date two to three vessels. Some vessels are more
than 140 m long and need to be manoeuvred. Con-
sidering the growing size of wind turbines, future
vessels may be up to 250 m long. Components
should be able to be unloaded from cargo vessels
or barges while the installation vessel is loading
new structures. The quayside length should there-
fore be over 300 m, but no longer than 1 km.
• The quay should be able to bear weights of approx-
imately 15 - 20 tonnes / m2. Currently, costly load
spreading techniques allow the crane(s) to operate
on the different quays. The weight-bearing capacity
of the quay should match the capacity of the ves-
sels, in the 10 - 20 tonnes / m² range. Reinforced
seabed along berth is recommended to ensure sta-
bility of the jack-up barge during loading operations.
• The quay should be designed to allow jacking up
right next to the quayside in order to use both the
boat’s own crane and the crane on the harbour.
The seabed capacity near the pier should also be
suffi cient. The quay should be designed to avoid
the dents made by the jack’s legs weakening its
structure.
7.2 Port requirements and current status Depending upon the role played by a particular port in
the construction and operation of offshore wind farms,
different requirements will be placed upon their techni-
cal and logistical capabilities.
Some technical requirements, in terms of maritime
limitations, derive from the physical dimensions of the
vessels used for both the construction phase, or used
for transportation as logistical elements of the supply
chain, where consideration is needed of the:
• Vessel beam (width);
• The draft laden and un-laden;
• The overall length of the vessel (to a lesser extent);
• The overhead clearance required.
Other hard technical limits result from the dimensions
and weight of wind farm components, at the various
stages of assembly at which they are transported
between manufacturing and construction facilities,
where consideration is needed of the:
• Physical size range of foundation and turbine com-
ponents, for each project to be supported from
each port;
• Length, breadth, and height required – not only the
component itself, but the area surrounding it in any
storage areas to allow access for the lifting and other
mechanical handling plant required to move it;
• Numbers of components that are likely to require
storage during conventional project programmes.
As noted above, there are different infrastructure
requirements for ports with manufacturing facilities
as opposed to those used purely for mobilisation and
construction purposes. Even when the same compo-
nents are loaded onto the different vessels required,
different crane specifi cations and therefore different
quayside loadings are needed. A port used purely as a
23420_Offshore report_int_v15.indd 8723420_Offshore report_int_v15.indd 87 9/11/11 10:349/11/11 10:34

Chapter x: name of the chapter
88 Wind in our Sails – The coming of Europe’s offshore wind energy industry
Chapter 7: Ports
• Ports need to have permits for 24/7 labour, and au-
thorisations for welding, painting on site, or fi nalis-
ing small pieces during the fi nal assembly of founda-
tions for instance.
• Information technology, independent service provid-
ers and security services need to be available, as
do access to heavy equipment such as cranes and
enough parking space (> 50 places).
• Ports and terminals need to comply with health,
safety quality and environmental rules and require-
ments which are standard in the offshore wind
industry.
Concerning operation and maintenance, the specifi c
requirements include:
• Full time access for service vessels and service heli-
copters. This is particularly relevant for the colder
areas in northern Europe where ice is a major chal-
lenge. If the ports are not ice-free during the whole
year the use of an ice-breaking vessel should be
ensured;
• Full time and safe access for technicians and ser-
vice personnel;
• Fresh water, electricity and fuelling facilities;
• General waste disposal and waste water disposal;
• Loading/unloading facilities and transport
equipment.
The following diagram provides a map with the loca-
tion of a selection of ports in northern Europe which
have been used as manufacturing and/or mobilisation
ports for offshore wind farms to date, or identifi ed as
possible future bases for operations.
• If possible, a crane or a gantry crane of 1,000 tonnes
should be used. For the moment, cranes of 750
tonnes on the quay side, and a complement when
needed (fl oating crane) is an option. Roll-on roll-off
capability (meaning access ramps are used for load-
ing) and trailer options should be available onsite to
transport items including self propelled trailers.
• In terms of access, the facilities must be available
during the whole construction phase. No restrictions
should apply to vessels accessing the harbour, such
as tide, locks or water depths. Access should be
permanently possible for smaller vessels (pontoon
bridge, barge etc), for heavy/oversize trucks and/
or by rail. For O&M harbours, license/approvals for
helicopter transfer could be needed.
• A water depth of more than 10 m is recommended,
as the biggest distance between the lowest point of
a ship's hull and the surface of the water (known as
a “draught”) in the new installation vessel designs
is 9-10 m. The future large vessels which will trans-
port a number of wind turbines and foundations for
far offshore applications will require deep sea ports.
A minimum draught of 12.5 m is recommended for
multipurpose vessels supplying wind turbine ele-
ments from distant production sites to the assem-
bly site.
• The waterway should allow the transportation of a
full rotor 150 - 200 m in diameter, to accommodate
5/6 MW turbine blades, and future developments.
• An area of storage of 25 ha for installation harbours
should be made available; if manufacturing capaci-
ties are developed this should be as much as some
50 ha. Additional storage space and warehouse fa-
cilities are also required in case part of the project
is delayed, and components need to be stored.
23420_Offshore report_int_v15.indd 8823420_Offshore report_int_v15.indd 88 9/11/11 10:349/11/11 10:34

Wind in our Sails – The coming of Europe’s offshore wind energy industry 89
47
38
1941
2650
39
27934
18
1
2
17
15
45
1035
29
1331
23
4
3
32
3046
36 42 33
3728
20
22
21
6
44
43
824
7
12
14
25
49
40
48
16
5
11
No Port MP1 M2 OWE3 No Port MP1 M2 OWE3 No Port MP1 M2 OWE3
1 Aalborg 18 Frederikshvn. 35 Peterhead
2 Aarhus 19 Gdansk 36 Portland
3 Barrow 20 Great Yarmouth 37 Ramsgate
4 Belfast 21 Hartlepool & tees 38 Riga
5 Bremerhaven 22 Humber 39 Rostock
6 Brest 23 Hunterston 40 Rotterdam
7 Caen 24 Le Havre 41 Sassnitz
8 Cherbourg 25 Zeebrugge 42 Southampton
9 Copenhagen 26 Lubmin 43 St Malo
10 Cape Firth 27 Malmo 44 St Nazaire
11 Cuxhaven 28 Medway 45 Stavanger
12 Dieppe 29 Methil 46 Swansea
13 Dundee 30 Milford H 47 Tallin
14 Dunkirk 31 Montrose 48 Tyneside
15 Eemshaven 32 Mostyn 49 Vlissingen
16 Emden 33 Newhaven 50 Wismar
17 Esbjerg 34 Nyborg
Notes:
1. "MP": suitable as Mobilisation Port
2. "M": Manufacturing infrastructure serving the offshore wind sector
3. "OWE": Offshore Wind Experience
Legend:
Currently or likely in future
Possible in future
Unlikely
FIGURE 7.2 EXAMPLE OF EUROPEAN PORTS FOR OFFSHORE WIND CONSTRUCTION
23420_Offshore report_int_v15.indd 8923420_Offshore report_int_v15.indd 89 9/11/11 10:349/11/11 10:34

Chapter x: name of the chapter
90 Wind in our Sails – The coming of Europe’s offshore wind energy industry
Chapter 7: Ports
from some major supply chain players. Siemens, GE,
Mitsubishi, Gamesa, Vestas, and Doosan are among
those expected to create UK manufacturing facili-
ties. High activity regions in England include Tyneside,
Teesside, Humber and East Anglia.
The devolved Scottish administration has also iden-
tifi ed port infrastructures as a key component in
encouraging industrial development around its ambi-
tious offshore wind plans. The National Renewable
Infrastructure Plan (N-RIP) developed by Scotland’s eco-
nomic development agencies identifi ed three potential
clusters in Scotland, Forth/Tay, Moray Firth and West
Coast in addition to existing expertise focused around
Aberdeen and Peterhead. A £70 million public fund
has been made available for the required investments
with expressions of interest invited from market play-
ers at the end of 201020.
Ports in Denmark have also been active in seek-
ing opportunities in the offshore wind sector. Lindø
Industrial Park is an ongoing conversion of an area of
1 million square metres set up on the closing ship-
building facilities of Odense shipyard. Smulders Group
foundation manufacturer (see Section 4) has entered
a conditional agreement to set up extra production
capacity at Lindø21. Meanwhile the port of Esbjerg has
announced plans for signifi cant expansion citing the
forthcoming offshore wind market as a primary driver.
In preparation of its use for DONG Energy’s Anholt off-
shore wind farm, storage facilities are being rebuilt at
the Port of Grenaa.
France is similarly keen to exploit port development
opportunities expected to result from its ongoing off-
shore wind tender and future installation programme,
with Saint Nazaire, Brest, Cherbourg, Le Havre and
Dunkirk at the forefront of current interest.
While no signifi cant capacity is expected to come
online in Eastern European waters prior to 2020,
7.3 Announcements and future trendsConsiderable investment has already been made in
upgrading facilities in a number of northern European
port facilities for the offshore wind industry. In some
cases, this has been done on top of already impres-
sive existing capabilities and has further enhanced
the technical suitability for the requirements of off-
shore wind.
Following the substantial success in northwest
Germany of its North Sea ports, notably the cluster
of Bremerhaven, Cuxhaven and Emden, attention is
shifting towards the north-east region of the Baltic
coastline. Indeed, the port of Sassnitz in Mecklenburg
Vorpommern was selected by EnBW in 2010 as a
mobilisation port for the Baltic 2 project. Lower labour
costs and strong links to Asia have already allowed
a thriving foundation market to be generated in this
region. In Germany, substantial capital ownership
by local municipal bodies in port infrastructure has
allowed close cooperation between industry and public
bodies – smoothing the process of creating such clus-
ters. In summer 2011 Bremerhaven ran the fi rst stage
of a tender for the fi nancing, planning, construction
and operation of a cargo handling and assembly termi-
nal capable of pre-assembling and shipping up to 160
wind turbines per annum for offshore wind projects19.
In the UK, the government last year pledged a certain
amount of investment in offshore wind infrastructure,
in order to ensure deployment targets are met. These
grants come under the umbrella of the Environmental
Transformation Fund (ETF), a budget established to
stimulate transition to a low-carbon economy. Examples
of funds awarded include a £60 million (€69 million)
port infrastructure investment programme, as well as
£10 million awarded to individual companies invest-
ing in UK facilities. These stimulation measures seem
to have helped encourage commitments to invest
19 http://www.bremenports.de/2346_2 20 http://www.hie.co.uk/highlands-and-islands/key-sectors/energy/n-rip.html 21 http://www.lindo-industripark.dk/uploadcontent/20110318_Press_Release_Lindo_Smulders_Group_fi nal.pdf
23420_Offshore report_int_v15.indd 9023420_Offshore report_int_v15.indd 90 9/11/11 10:349/11/11 10:34

Wind in our Sails – The coming of Europe’s offshore wind energy industry 91
For Finland the ports of Pori, Vaase and Kristinestad
have been earmarked as possible installation bases
for its pipeline of projects. Similarly, in Sweden,
Halmstad, Uddevalla and Karlshamn offer potential.
In Belgium, Oostende and Zeebrugge ports authorities
have been undertaking major developments to service
Belwind and Thorton Bank offshore wind farm projects.
Several ports in Spain, particularly those along its
north and north-western Atlantic coast, have consider-
able industrial capabilities which would be well suited
to serve any future developments in the area.
Poland and the Baltic countries of Estonia, Latvia and
Lithuania have identifi ed opportunities for supply chain
involvement of their ports. Signifi cant labour cost sav-
ings in this region present a distinct advantage.
In the Netherlands, Eemshaven already has offshore
wind experience and is expected to provide future
support to a number of nearby proposed wind farms,
the Vlissingen area has recently been extended, and
facilities have also been identifi ed for possible use at
Ijmuiden and, for O&M operations, at Den Helder.
KEY FINDINGS
• The forecast growth of the offshore wind industry in northern Europe is a signifi cant opportunity
for ports to counter-balance the economic downturn hitting traditional activities.
• There is a general move away from the use of mobilisation ports and instead components are
being exported directly from manufacturing facilities to offshore wind farms to save on logistics
costs. However potential future production in Eastern Europe to take advantage of lower labour
rates may reverse or at least slow this trend.
• There is a drive in certain regions towards cluster-building for offshore wind manufacturing in
closely located ports. These initiatives are being pursued via cooperation between the public and
private sectors, sometimes with facilitation and fi nancial support from the former.
23420_Offshore report_int_v15.indd 9123420_Offshore report_int_v15.indd 91 9/11/11 10:349/11/11 10:34

251-53520-1111-1288
www.ewea.org
About EWEAEWEA is the voice of the wind industry, actively promoting the utilisation of wind power in Europe and worldwide. It now has over 700 members from almost 60 countries including manufacturers with a 90% share of the world wind power market, plus component suppliers, research institutes, national wind and renewables associations, developers, electricity providers, finance and insurance companies and consultants.
Rue d’Arlon 80 | B-1040 BrusselsTel: +32 2 213 18 11 - Fax: +32 2 213 18 90E-mail: [email protected]