wind energy: trends and status - aprekh.org · certification and testing of wind turbines ... in...
TRANSCRIPT

August 2007
Wind energy: Trends and Status
Prepared for Asian Development Bank
w w w . t e r i i n . o r g The Energy and Resources Institute

© The Energy and Resources Institute 2007
Suggested format for citation T E R I. 2007 Replace this line with the title of the report New Delhi: The Energy and Resources Institute.
For more information Project Monitoring Cell T E R I Tel. 2468 2100 or 2468 2111 Darbari Seth Block E-mail [email protected] IHC Complex, Lodhi Road Fax 2468 2144 or 2468 2145 New Delhi – 110 003 Web www.teriin.org India India +91 • Delhi (0) 11

Table of content
Wind Energy ................................................................................................................. 1
Large wind turbines ....................................................................................................... 1
Types of wind turbines ................................................................................................... 1
Technical description...................................................................................................... 4
Wind rose ..................................................................................................................... 4
Weibull distribution ........................................................................................................ 4
Power curve .................................................................................................................. 5
Current status ............................................................................................................... 6
State of art of technology ............................................................................................... 7
Research and development............................................................................................. 9
Certification and testing of wind turbines ......................................................................... 9
Technology development trends and status.....................................................................10
Major players ...............................................................................................................12
Small wind turbines.......................................................................................................12
Typical power curve for small wind turbines ....................................................................14
Applications..................................................................................................................14
Costs ...........................................................................................................................15
Major barriers...............................................................................................................15
Small wind turbine manufacturers ..................................................................................16
References...................................................................................................................16


Wind Energy Wind energy is kinetic energy associated with movement of atmospheric air. These movements of air are caused by uneven heating of atmosphere by solar radiations, irregularities in the earth surface and rotation of the earth. Wind flow patterns are affected by the earth's terrain, bodies of water, and vegetation. The wind energy can be converted in to electrical or mechanical energy, using wind mills and turbines.
Large wind turbines Types of wind turbines
Wind turbines are categorised on the basis of their axes and rotors.
Based on axis Primarily on the basis of the axis, wind turbines are categorised as horizontal axis wind turbines and vertical axis wind turbines. Horizontal axis wind turbines
A wind turbine in which axis of rotor’s rotation is parallel to wind stream and the ground is called as horizontal axis wind turbine. Mostly all the wind turbines available now days for commercial application are horizontal axis wind turbines. These are available in the range of 650 kW to 2 MW for onshore application, whereas for offshore applications 5 MW capacity wind turbine is commercially available. The wind passes over both surfaces of the airfoil shaped blade but passes more rapidly over the upper/longer side of the airfoil, thus creating a lower-pressure area above the airfoil. The pressure differential between top and bottom surfaces results in aerodynamic lift. Since the blades of a wind turbine are constrained to move in a plane with the hub as its centre, the lift force causes rotation of blades around the hub. In addition to the lift force, a drag force perpendicular to the lift force impedes rotor rotation. A prime objective in wind turbine design is for the blade to have a relatively high lift-to-drag ratio. This ratio can be varied along the length of the blade to optimize the turbine’s energy output at various wind speeds. Vertical axis wind turbine
In this type of wind turbines the axis of rotation is perpendicular to the wind stream and the ground. Vertical-axis wind turbines fall into two major categories: Darrieus turbines and Savonius turbines. Neither type is in wide use today.

2Wind energy: Trends and status
Source : www.daviddarling.info Figure 1 Types of Wind turbine
Based upon speed of rotor Constant speed wind turbines
Such wind turbines operate at a constant rotor speed (revolutions per minute or RPM) and are optimized for energy capture at a given rotor diameter at a particular speed in the wind power curve. Variable speed wind turbines
A wind turbine in which the rotor speed increases and decreases with changing wind speed, thereby producing electricity with a variable frequency; is known as a variable speed wind turbine.
Direct drive generators In direct drive configuration a generator is coupled to the rotor of a wind turbine directly. It offers high reliability and low maintenance. Offshore wind farms
Wind turbines can be installed on off shore and onshore. In the offshore wind farms, turbines are installed in the sea. As water has no surface roughness, wind speed in these areas is higher than onshore. The capacity factors of offshore wind turbines therefore, are considerably higher than onshore wind turbines.

3Wind energy: Trends and status
Figure 2 Offshore wind turbines Onshore wind farms
Wind turbines installed on hilly regions, on mountains, on barren lands and on costal areas are considered as onshore. The topography of the region has significant impact on energy generation from wind turbines. Various points need to be considered for micrositing of onshore wind turbines such as wake effect, hill effect, tunnel effect, and park effect etc. On hills, it is observed that wind speeds are slightly higher as compared to plain areas. This is due to fact that wind becomes compressed on the windy side of the hill, and once the air reaches the ridge it can expand again as its soars down into the low pressure area on the lee side of the hill. Figure 3 An onshore windfarm

4Wind energy: Trends and status
Technical description Capturing wind’s kinetic energy depends upon conversion efficiency and power of the wind. Wind power generation can be given by following equation,
P = 1/2ρAv³ Where, P= Power generated, ρ= Density of the air, A= Swept area of rotor and V= velocity of the wind.
Wind rose
Figure 4 indicates the average percentage of time that the wind blows from different directions on a monthly or annual basis. Figure 4 Wind rose
Weibull distribution Variation in wind speed can be described using Weibull distribution. Weibull distribution has two parameters namely ‘A’ parameter and ‘K’ parameter. K parameter is the shape factor, which usually lies in between 1 to 3. Depending upon mean wind speed, Weibull parameters change. Shape factor is used to determine probability of particular wind speed. Weibull distribution can be formulated as P (V) = ((k/c) (V/c) k-1 e – (V/c) k Where, P (V) is probability of having wind speed V, c is scale factor.

5Wind energy: Trends and status
Source : http://www.windpower.org/en/tour/wres/weibull.htm
Figure 5 Weibull distribution
Power curve
The power curve of a wind turbine is a graph representing relationship between the power available from the wind machine and the wind speed. As shown, the power increases exponentially with wind speed (at cube of wind speed).
0100200300400500600700800900
1 3 5 7 9 11 13 15 17 19 21 23
Wind speed (m/s)
Pow
er (k
W)
Figure 6 Power curve of a wind turbine

6Wind energy: Trends and status
Current status Table 1 gives installed capacities in various countries in 2005 and 2006.
Installed capacity(MW) Rank Country 2005 2006
1 Germany 18,415 20,622 2 Spain 10,028 11,615 3 United States 9,149 11,603 4 India 4,430 6,270 5 Denmark (incl. Faroe) 3,136 3,140 6 China 1,260 2,604 7 Italy 1,718 2,123 8 United Kingdom 1,332 1,963 9 Portugal 1,022 1,716
10 France 757 1,567 11 Netherlands 1,219 1,560 12 Canada 683 1,459 13 Japan 1,061 1,394 14 Austria 819 965 15 Australia 708 817 16 Greece 573 746 17 Ireland 496 745 18 Sweden 510 572 19 Norway 267 314 20 Brazil 29 237 21 Egypt 145 230 22 Belgium 167 193 23 Taiwan 104 188 24 South Korea 98 173 25 New Zealand 169 171 26 Poland 83 153 27 Morocco 64 124 28 Mexico 3 88 29 Finland 82 86 30 Ukraine 77 86 31 Costa Rica 71 74 32 Hungary 18 61 33 Lithuania 6 55 34 Turkey 20 51 35 Czech Republic 28 50 36 Iran 23 48
Rest of Europe 129 163 Rest of Americas 109 109 Rest of Asia 38 38 Rest of Africa & Middle
East 31 31
Rest of Oceania 12 12 World total 59,091 74,223
Source : www.wikipedia.com
Table 1 Total installed capacity in various countries

7Wind energy: Trends and status
Total installed capacity in Asia is as follows.
Asian installed Wind power capacity
0500
1,0001,5002,0002,5003,0003,5004,0004,5005,000
India
China
Japa
n
Taiw
an
Sout
h Ko
rea
Philipp
ines
Other
s
Country
MW
Up to 2005 2006
Figure 7 Total installed capacity in Asia
State of art of technology Figure 8 gives brief idea about turbine developments since 1980. Size of turbines increased from 30 kW in 1980 to 5MW (5000 kW) in 2005. 5MW turbine is designed and developed by REpower and is operating in Germany since 2004 (shown in figure 9). So far this is the largest wind turbine available in the world.
Presently, wind turbines of 800kW, 1250kW, 1300kW, 1650kW, 1670kW2000kW, 2300kW, 2500kW, 3000kW and 3600kW are also available and installed successfully.
Source: www. energieverbraucher.de
Figure 8 Trends in wind turbines’ capacities

8Wind energy: Trends and status
Figure 9 5MW offshore wind turbine Table 2 gives technical details of various wind turbines.
Model REpower 5M
Vestas V120
Multibrid M5000
Enercon E-112
Siemens 3.6 MW
GE Energy 3.6s
Rated capacity 5.0 MW 4.5 MW 5.0 MW 4.5 MW 3.6 MW 3.6 MW
Rotor diameter 126 m 120 m 116 m 114 m 107 m 104 m
Swept area 12.469 m2 11.310 m2 10.568 m2 10.207 m2 8.992 m2 8.495 m2 Gearbox 3-step 3-step 1-step - 3-step 3-step
Generator asynchronous generator (doubly fed)
asynchronous generator (doubly fed)
permanent-magnet synchronous generator
synchronous generator
asynchronous generator
asynchronous generator (doubly fed)
Weight
Rotor blade 17.8 t 12.3 t 16.5 t 21 t 16 t N.A. Rotor with hub 120 t 65 t 110 t N.A. 90 t 85 t
Nacelle 290 t 145 t 200 t N.A. 120 t 210 t Nacelle + Rotor 410 t 210 t 310 t 500 t 210 t 295 t
Tower 750 t 220 t 1.138 t 2.500 t 250 t 250 t Hub height 120 m 90 m 102 m 124 m 80 m 76.5 m In operation since 2004 2007 2004 2002 2004 2004
Specific power 401 W/m2 398 W/m2 473 W/m2 441 W/m2 400 W/m2 424 W/m2
Table 2 Technical details of wind turbines

9Wind energy: Trends and status
Research and development Organizations like International Energy Agency (IEA), National Renewable Energy Laboratory (NREL), and RISO National Laboratory are involved in R&D in various aspects related to wind energy, including development of various wind turbine parts. RISO National Laboratory and Garrad Hassan are working in commercial modelling. Following are some research activities which are being carried out globally:
1. Integration of wind and hydropower 2. Offshore wind energy technology development 3. Dynamic models of wind farm for power system studies 4. Modelling and control of grid converter 5. Development and validation of design methodologies and
design tools for low and moderate wind regimes 6. Modelling of interconnection of wind turbines with the
grid. 7. Parameterisation of flow distortion around the wind
turbine nacelle 8. Study of acoustic emissions of wind turbines 9. Failure Analysis of gearboxes of wind turbines 10. Short-term wind forecasting and development of a next
generation wind resource forecasting system for the large-scale integration of onshore and offshore wind farms (ANEMOS project)
Certification and testing of wind turbines The International Electrotechnical Commission (IEC) has prepared a series of international standards. IEC Standard 61400 pertains to wind energy generators (WEGs). Many countries have accepted IEC standards. Table 3 shows the standards already available and standards which are still under development by IEC.
Table 3 IEC standards for WEGs Part Title Status Publication Date 1 Design requirements (Ed. 3.0) Available 2005-08 2 Design requirements for small wind turbines (Ed. 2.0) Available 2003-06
3 Design requirements for offshore wind turbines Work in Progress -
4 Design and specifications of gearboxes Work in Progress -
11 Acoustic noise measurement techniques (Ed. 2.0) Available 2002-12 12 Wind turbine power performance testing Available 2005-12 13 Measurement of mechanical loads Available 2001-06 14 Declaration of apparent sound power level and tonality values Available 2005-03
21 Measurement and assessment of power quality characteristics of grid connected wind turbines Available 2001-12
22 Certification of wind turbines – Rules and Procedures Work in -

10Wind energy: Trends and status
Part Title Status Publication Date Progress
23 Full-scale structural testing of rotor blades Available 2001-04 24 Lightning protection Available 2002-07
25 Communications for monitoring and control of wind power plants Work in Progress -
Source: http://www.iec.ch
Technology development trends and status A technology development map for wind turbine power generation is shown in table 4.
Table 4 Technology development map for wind turbine power generation
Constant-Speed Wind Turbines Variable-Speed Wind Turbines Direct-Drive Wind Turbines Advanced Wind Turbines Feature and Advantages Technology Characterization
Tubular rolled steel tower. Off-the-shelf gearbox and induction generator. Digital controls and SCADA system
Tubular rolled steel tower. Double high speed gearbox shaft. Off-the-shelf induction generator. Digital controls and SCADA system.
Tubular rolled steel tower. No gearbox, reduced cost. Low-speed direct-drive generator. Improved controls and SCADA.
Tubular steel or composite tower. No conventional gearbox. Advanced low-speed generator drive. Advanced controls and SCADA.
Efficiency Limited by fixed generator speed.
Slightly greater due to variable generator speed
Slightly greater due to variable generator speed
Slightly greater due to variable generator speed
Re s Remote sites w/ PNL Class 4 or greater wind speed near transmission lines
Remote sites w/PNL Class 4 or greater wind speed near transmission lines
Remote sites w/PNL Class 4 or greater wind speed near transmission lines
Remote sites w/PNL Class 3 or greater wind speed near transmission lines
Challenges and Disadvantages Cost Design for fluctuating torque
load increases cost Full-span pitch control and power electronics increase cost
Weight and cost of low-speed generator offset by absence of gearbox
Optimize design to minimize cost
Operation Fatigue failure of parts due to fluctuating wind and torque loads
Complexity of full-span pitch controls increases maintenance cost
Durability of low-speed turbine under fluctuating loads
Optimize design to minimize O&M cost and maximize reliability
Technology Needs
Design for extreme loads to handle wind gusts
Solid-state power electronics Low-speed generator design, new control system
Optimization for reliability and low cost
Costs Equipment $680/kW $700/kW $650-$750/kW < $600/kW Relative O & M $16kW/yr $23/kW/yr $15k-$16k/kW/yr $15k/kW/yr Busbar 3.5-5.5¢kWh 3.5-5.5¢/kWh 3.0-5.0¢/kWh 2-4¢/kWh Development Timeframe Research 1970-1985 1985-1993 1992-1995 1994-2002 Development Timeframe
1980-present 1991-1995 1994-1999 1995-2004
Demonstration 1980s 1992 1994-1999 2001-2006 Commercialization ~ 1980 1993-present 1996-present 2007 Markets Key Issues Structural and load-bearing
component reliability. Cost of energy. Moderate cost reduces prospects in competitive market.
Complex control system, power electronics, component reliability. Moderate cost reduces prospects in competitive market.
Complex control system, power electronics, cost and reliability of new generator. Lower cost improves prospects in competitive market.
Reliability, cost of energy, Low cost likely to result in significant market.
Impact on Technology Outlook
Established and mature: dominant market share in U.S.
Established: Enhanced performance leading to growing market share worldwide.
Maturing: reduced cost would improve worldwide market.
Emerging: low cost would result in large worldwide market.
Source: Renewable energy technology assessment guide 2004

11Wind energy: Trends and status
Global Wind Energy Outlook 2006, published by Global Wind Energy Council projects 3 scenarios of wind power development, namely (i) reference scenario, (ii) moderate scenario, and (iii) advanced scenario. Reference scenario is based upon IEA projections in 2004, published by IEA in World Energy Outlook. Moderate scenario takes into consideration the global policy measures to support renewables either under way or planned. Advanced scenario considers feasibility of 10% and/or 12% world’s total electricity production by 2020, coming from wind. Also these scenarios are further projected in 2 types as 1. Projections up to 2030 and 2. Projections up to 2050. Following table gives an idea about these projections.
Table 5 Global Wind Energy Outlook
Global wind energy outlook for 2030 Global wind energy outlook for 2050 Global scenario Reference Moderate Advance Reference Moderate Advance Cumulative wind power capacity (GW) 364 1129 2107 577 1557 3010 Electricity Output (TWh) 892 2769 5179 1517 4092 7911 Percentage of world electricity (High energy efficiency)
5 15.6 29.1 6.6 17.7 34.3
Annual Installed capacity(GW) 24.8 58.3 129.2 34.3 71 168.6 Annual Investment (Euro bn) 21.2 45 84.8 28.8 54.2 112 Jobs (million) 0.48 1.14 1.44 0.65 1.39 2.8 Annual CO2 Saving (million tonnes)
535 1661 3100 910 2455 4747
Source : Global Wind Outlook 2006 Figure 10, indicates cumulative global wind power potential [1]
0
500000
1000000
1500000
2000000
2500000
3000000
3500000
Ref
eren
ceM
oder
ate
Adv
ance
dR
efer
ence
Mod
erat
eA
dvan
ced
Ref
eren
ceM
oder
ate
Adv
ance
dR
efer
ence
Mod
erat
eA
dvan
ced
Ref
eren
ceM
oder
ate
Adv
ance
dR
efer
ence
Mod
erat
eA
dvan
ced
2005 2010 2020 2030 2040 2050
Years
MW
Figure 10 Projections of global cumulative wind power potential

12Wind energy: Trends and status
Major players Table 6 gives information about major wind turbine players and their market share in 2006.
Table 6 Market share in 2006
Supplier Country MW Share (%) Vestas Denmark 4239 28.2 Gamesa Spain 2346 15.6 GE Energy USA 2326 15.5 Enercon Germany 2316 15.4 Suzlon India 1157 7.7 Siemens Germany 1103 7.3 Nordex Germany 505 3.4 Repower Germany 480 3.2 Acciona Spain 426 2.8 Goldwind China 416 2.8
: Sun & Wind 2/2007
Small wind turbines
Source : http://www.smallwindenergy.ca
Figure 11 Small wind turbine

13Wind energy: Trends and status
Small wind turbine usually consists of the following components.
Rotor
Blades and shaft together form rotor. Blades are usually made up of fibreglass, metal, reinforced plastic or wood. The rotor diameter determines how much energy can be captured from the wind. Generator/alternator
This produces electricity from rotation of blades. Usually electricity produced by generator is in DC form which is further converted to AC by means of an alternator. Gear box
Most of the small wind turbines above 10kW use a gearbox to synchronise the rotor speed to that of the generator. Nacelle
This is to protect gearbox and alternator/generator from external elements. Tail vane/ yaw system
This is for alignment of horizontal axis wind turbine towards wind. In some systems, the rotor is downwind of the generator, so it naturally aligns with the wind. Some yaw systems can be offset from the vertical axis to regulate rotor power and speed by tilting the turbine slightly upward. Following components are also supplied as part of small wind turbine systems. Control and protection systems Towers
− Tilt up towers – usually for systems under 1000 W (1 kW) − Guyed towers – usually used for systems between 1 kW to 50 kW − Self supporting towers – usually for turbines above 50 kW
Battery Inverter Rectifier Monitoring system
14Wind energy: Trends and status
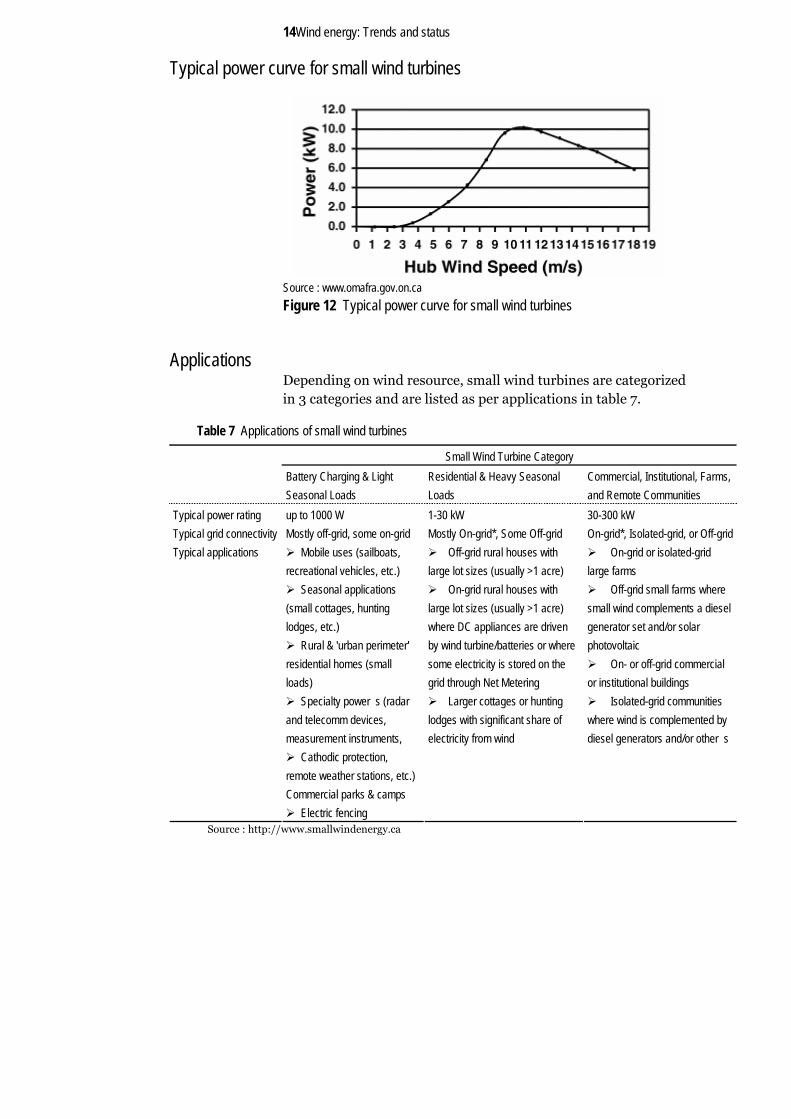
Typical power curve for small wind turbines
Source : www.omafra.gov.on.ca Figure 12 Typical power curve for small wind turbines
Applications Depending on wind resource, small wind turbines are categorized in 3 categories and are listed as per applications in table 7.
Table 7 Applications of small wind turbines
Small Wind Turbine Category Battery Charging & Light
Seasonal Loads Residential & Heavy Seasonal Loads
Commercial, Institutional, Farms, and Remote Communities
Typical power rating up to 1000 W 1-30 kW 30-300 kW Typical grid connectivity Mostly off-grid, some on-grid Mostly On-grid*, Some Off-grid On-grid*, Isolated-grid, or Off-grid Typical applications Mobile uses (sailboats,
recreational vehicles, etc.) Seasonal applications
(small cottages, hunting lodges, etc.)
Rural & 'urban perimeter' residential homes (small loads)
Specialty power s (radar and telecomm devices, measurement instruments,
Cathodic protection, remote weather stations, etc.) Commercial parks & camps
Electric fencing
Off-grid rural houses with large lot sizes (usually >1 acre)
On-grid rural houses with large lot sizes (usually >1 acre) where DC appliances are driven by wind turbine/batteries or where some electricity is stored on the grid through Net Metering
Larger cottages or hunting lodges with significant share of electricity from wind
On-grid or isolated-grid large farms
Off-grid small farms where small wind complements a diesel generator set and/or solar photovoltaic
On- or off-grid commercial or institutional buildings
Isolated-grid communities where wind is complemented by diesel generators and/or other s
Source : http://www.smallwindenergy.ca

15Wind energy: Trends and status
Costs Table 8 gives brief idea about the costs of small wind turbines.
Table 8 Cost Comparison of small wind turbine
Small wind turbine category Typical power rating 300 to 1,000 W Above 1 kW to 30 kW Above 30 kW to 300 kW Average capital cost of turbine $2352/kW $2520/kW $1848/kW Average total installed cost $4200-$5376/kW $5040/kW $2772/kW Average annual operations & maintenance $33.6-109.2/yr $966/yr $2772/yr Typical installation by User Professional Professional Typical lifetime** 10-15 yrs 20 yrs 25 yrs with major
component replacement typically after 15 yrs
Source: http://www.smallwindenergy.ca ; $= US dollar as in 2004
Major barriers Following is a result of survey, carried out by AWEA to analyse potential barriers for small scale wind turbine growth.
Table 9 Result of survey carried out by AWEA to analyse potential barriers for small scale wind turbine growth.
Source : AWEA small wind turbine global market study 2007

16Wind energy: Trends and status
Small wind turbine manufacturers Table 10 lists few of the small wind turbine manufacturers across the world.
Table 10 Small wind turbine manufacturers
Company Country Electrovent Canada Cyclone China Windmission Denmark Oy Windside Production Finland Vaigunth EnerTek (P) India Fortis Netherlands African Wind Power South Africa J.Bornay Aerogeneradores Spain Marlec Engineering Co. UK Proven Engineering Products Ltd (Proven Energy) UK Aeromax US Southwest Windpower US Thermodyne Systems US Bergey Wind Power Co. US Unitron Energy India
References 1. Global Wind Energy Outlook 2006. World wind energy council.
Bibliography www.daviddarling.info www.windpower.org/en/tour/wres/weibull.htm www.wikipedia.com www. energieverbraucher.de www.iec.ch Renewable energy technology assessment guide 2004 Global Wind Outlook 2006 Sun & Wind 2/2007 www.smallwindenergy.ca www.omafra.gov.on.ca www.smallwindenergy.ca