wimborne minster -
TRANSCRIPT

A Structural Engineering Analysis
Aquablue at the Golden Mile
Hato Rey, Puerto Rico
Lindsay Lynch
Integrated B.A.E./M.A.E. Program
Structural Option
Dr. Andres Lepage
22 April 2009

Lindsay Lynch Advisor: Dr. Andres Lepage ‐ AE Senior Thesis 2008‐2009 ‐
Aquablue at the Golden MileHato Rey, Puerto Rico
‐ Structural Option ‐
R e v i s e d F i n a l R e p o r t – 2 2 A p r i l 2 0 0 9 | 1
Table of Contents
Thesis Abstract . . . . . . . . . . . . . . . . . . . . . . . . . . . . . . . . . . . . . . . . . . . . . . . . . . . . . . . . . . . . . . 2 Executive Summary . . . . . . . . . . . . . . . . . . . . . . . . . . . . . . . . . . . . . . . . . . . . . . . . . . . . . . . . . . 3 Introduction
General Building Information . . . . . . . . . . . . . . . . . . . . . . . . . . . . . . . . . . . . . . . . . . . 4 Description of Existing Structure . . . . . . . . . . . . . . . . . . . . . . . . . . . . . . . . . . . . . . . . 5 Typical Floor Framing Plans of Original Design . . . . . . . . . . . . . . . . . . . . . . . . . . . . . 6 Description of Lateral System . . . . . . . . . . . . . . . . . . . . . . . . . . . . . . . . . . . . . . . . . . . 7 Codes and References . . . . . . . . . . . . . . . . . . . . . . . . . . . . . . . . . . . . . . . . . . . . . . . . . 8 Background for Proposal and General Project Goals . . . . . . . . . . . . . . . . . . . . . . . . 9
Structural Depth Analysis
Proposed Shear Wall Re‐design . . . . . . . . . . . . . . . . . . . . . . . . . . . . . . . . . . . . . . . . . 10 Determination of Lateral Loads . . . . . . . . . . . . . . . . . . . . . . . . . . . . . . . . . . . . . . . . . . 12 Calculation of Preliminary Wall Thicknesses . . . . . . . . . . . . . . . . . . . . . . . . . . . . . . . 20 ETABS Model (M.A.E. Requirement) . . . . . . . . . . . . . . . . . . . . . . . . . . . . . . . . . . . . . . 23 Drift Analysis . . . . . . . . . . . . . . . . . . . . . . . . . . . . . . . . . . . . . . . . . . . . . . . . . . . . . . . . . 25 Feasibility Test for Coupling Beams . . . . . . . . . . . . . . . . . . . . . . . . . . . . . . . . . . . . . . 27 Shear Wall Reinforcement . . . . . . . . . . . . . . . . . . . . . . . . . . . . . . . . . . . . . . . . . . . . . . 34 Coupling Beam Reinforcement . . . . . . . . . . . . . . . . . . . . . . . . . . . . . . . . . . . . . . . . . . 42 Impact on Existing Foundation . . . . . . . . . . . . . . . . . . . . . . . . . . . . . . . . . . . . . . . . . . 48
Architectural Breadth Study . . . . . . . . . . . . . . . . . . . . . . . . . . . . . . . . . . . . . . . . . . . . . . . . . . . 50 Construction Management Breadth Study . . . . . . . . . . . . . . . . . . . . . . . . . . . . . . . . . . . . . . . 53
Conclusions and Acknowledgements . . . . . . . . . . . . . . . . . . . . . . . . . . . . . . . . . . . . . . . . . . . 55 Appendix – Shear Wall Reinforcement . . . . . . . . . . . . . . . . . . . . . . . . . . . . . . . . . . . . . . . . . . 56

Lindsay Lynch Advisor: Dr. Andres Lepage ‐ AE Senior Thesis 2008‐2009 ‐
Aquablue at the Golden MileHato Rey, Puerto Rico
‐ Structural Option ‐
R e v i s e d F i n a l R e p o r t – 2 2 A p r i l 2 0 0 9 | 2

Lindsay Lynch Advisor: Dr. Andres Lepage ‐ AE Senior Thesis 2008‐2009 ‐
Aquablue at the Golden MileHato Rey, Puerto Rico
‐ Structural Option ‐
R e v i s e d F i n a l R e p o r t – 2 2 A p r i l 2 0 0 9 | 3
Executive Summary The following report summarizes the two‐semester thesis project for the 2008‐2009 academic year, as required by Penn State’s Architectural Engineering department. The subject of study was Aquablue at the Golden Mile, which is an actual building that is currently under construction in Hato Rey, Puerto Rico. After an initial investigation of the existing conditions, a more independent analysis was conducted for an extensive learning exercise. In general, the project included an in‐depth analysis and re‐design of the structural system, as well as two smaller studies of other building related systems. After designing new shear walls for the lateral force resisting system, the most relevant topics for breadth studies were architecture and construction. The shear walls were initially proposed to be more efficient, but they had a few implications on the existing architectural design. Therefore, those changes were included in this report. Also, in order to effectively compare the original and new systems, a cost analysis was conducted to determine if any savings were to be realized. The design process proved to be a very valuable exercise in practical engineering. In general, the project goals were met, as the analysis of the lateral force resisting system was more thorough than any other previous design experience. Also, the architectural breadth provided a better understanding of the potential difficulties of project coordination. For example, if an architect designs his/her building with a certain feature that cannot be altered, then the structural system has to work around that limitation, even if it is not the most efficient design. Based on achieving the project objectives, this independent design task was an overall success.

Lindsay Lynch Advisor: Dr. Andres Lepage ‐ AE Senior Thesis 2008‐2009 ‐
Aquablue at the Golden MileHato Rey, Puerto Rico
‐ Structural Option ‐
R e v i s e d F i n a l R e p o r t – 2 2 A p r i l 2 0 0 9 | 4
General Building Information Aquablue at the Golden Mile is an approximately 280’ high‐rise apartment building in Hato Rey, Puerto Rico. It is located in an urban area, about two miles away from the San Juan Bay (fig. 1). The building size is about 900,000 total square feet, and there are 31 stories above grade. (Up to level 7, the typical floor area is about 51,900 ft2. For the apartment towers, which are above level 7, the typical floor areas are 11600 and 14500 ft2.) The ground level will be developed as a commercial area, and the rest of the floors up to level 7 will be used for both parking and office space. Level 7 is an indoor/outdoor public area for the apartment residents, and the floors above are private apartments. There is a sky lobby above the penthouse apartments. Figure 1 – Building Site (maps.google.com – Hato Rey Central, PR)
The parking structure (levels 2‐6) is open, with concrete parapets along the exterior. As an architectural feature, there are two sections of an 8” masonry wall that extend from the ground up to level 7. The office areas of these floors are enclosed with a glass curtain wall system, as can be seen toward the bottom of figure 2. Above level 7, the façade materials are glass and concrete precast panels. The primary building material is reinforced concrete, and the structure consists of a building frame system with shear walls. Each floor has a post‐tensioned slab supported by concrete columns.
Figure 2 – Rendering of Aquablue

Lindsay Lynch Advisor: Dr. Andres Lepage ‐ AE Senior Thesis 2008‐2009 ‐
Aquablue at the Golden MileHato Rey, Puerto Rico
‐ Structural Option ‐
R e v i s e d F i n a l R e p o r t – 2 2 A p r i l 2 0 0 9 | 5
Description of Existing Structure The foundation consists of drilled piles that are aligned with the columns. They are the primary foundation system, although there are some grade beams as well. (The grade beams are only used occasionally; they do not span all of the piles.) At the foundation level, there is a 10” reinforced concrete slab. Each floor consists of a two‐way, post‐tensioned structural slab supported by reinforced columns, which span between 25’‐0” and 34’‐0”. It is a flat plate system, so beams are not a part of the general floor framing. The slabs are 9” thick for the first six stories. At level 7, parts of the slab are 12” thick because the loads are heavier on this partially outdoor level (due to the pool and landscaping). For the apartment levels, the post‐tensioned slabs are 8” thick. The lateral force resisting system is a series of shear walls near the core of the building. They are 18” thick, and they require integrated boundary elements. The system of shear walls is grouped into two sections, and each one extends into one of the apartment towers. There is one expansion joint, which breaks the building into two similar sections. It is a 5” seismic joint, and it runs parallel to the short dimension of the building. It only extends from the ground to level 7, because the two towers are separated on either side of the joint above that level. For the purpose of the structural analysis, this allows for the separation of Aquablue into two ‘buildings.’ The material strengths of the concrete for the various structural elements are listed in table 1. The concrete strength of the slabs and columns changes at level 12. The highlighted material strengths are Table 1 – Concrete Strengths for Various Structural Elements relevant to this structural analysis.
Concrete Material Strengths Structural Component Strength, f'c (ksi)pile cap 4retaining wall / basement wall 4 grade beam 4 slab on grade 5
formed slab foundation ‐ level 12 6 above level 12 5
beams 5 parapet / vehicle barrier wall 5 columns / shear walls
foundation ‐ level 13 8 above level 13 6

Lindsay Lynch Advisor: Dr. Andres Lepage ‐ AE Senior Thesis 2008‐2009 ‐
Aquablue at the Golden MileHato Rey, Puerto Rico
‐ Structural Option ‐
R e v i s e d F i n a l R e p o r t – 2 2 A p r i l 2 0 0 9 | 6
Typical Floor Framing Plans of Original Design There are two typical floor plans in this building: one for the parking garage levels and one for the apartment levels. In figure 3 below, the gravity‐based structural system for a typical parking level is highlighted in teal. The columns are supporting a two‐way, flat plate, post‐tensioned slab. Also shown in the figure below is the original lateral force resisting system of reinforced concrete shear walls concentrated toward the center of the floor plan. The most extensive shear wall system is at the base of the building, and the number and length of the walls decreases as the height above grade increases.
Figure 3 – Column and Shear Wall Layout for Typical Parking Garage Level
The plan below (fig. 4) is a typical apartment level floor plan. Both the columns and shear walls are shown, and the extension /simplification of the shear wall system can be seen by comparing this figure with the one above.
Figure 4 – Column and Shear Wall Layout for Typical Apartment Level

Lindsay Lynch Advisor: Dr. Andres Lepage ‐ AE Senior Thesis 2008‐2009 ‐
Aquablue at the Golden MileHato Rey, Puerto Rico
‐ Structural Option ‐
R e v i s e d F i n a l R e p o r t – 2 2 A p r i l 2 0 0 9 | 7
Description of Existing Lateral System
The existing lateral system is composed of reinforced concrete shear walls that are concentrated toward the center of the building. As can be seen in figure 5 to the right, the walls in both the north‐south and east‐west directions are integrated into one multi‐segment system. This detail is just one example to show the general type of shear wall design. In the case of figure 5, the wall lengths and reinforcing layout represent one shear wall system between levels 7 and 9.
The concrete strength of the shear walls changes over the height of the building. Below level 13, f’c = 8 ksi, and above level 13, f’c = 6 ksi. Similarly, the reinforcement becomes less dense over the height of the building. Also, the boundary elements of the shear walls are relatively complex due to their intersection at the wall joints. Therefore, due to the multi‐segment shear wall system and the difficulties it presents, the use of Figure 5 – Example of Shear Wall System (Levels 7‐9) computer modeling is used to improve the efficiency of the design.

Lindsay Lynch Advisor: Dr. Andres Lepage ‐ AE Senior Thesis 2008‐2009 ‐
Aquablue at the Golden MileHato Rey, Puerto Rico
‐ Structural Option ‐
R e v i s e d F i n a l R e p o r t – 2 2 A p r i l 2 0 0 9 | 8
Codes and References
General References: o ACI 318‐08 (American Concrete Institute) o ASCE 7‐05 (American Society of Civil Engineering) o IBC 2006 (International Building Code)
Code used for wind and seismic analyses:
o ASCE 7‐05 (American Society of Civil Engineers, “Minimum Design Loads for Buildings and Other Structures”)
Chapters 6 and C6 – Wind Loads (Method 2) Chapters 11 and 12 – Seismic Loads (Equivalent Lateral Force Procedure)
Major national model codes used by De‐Simone Consulting Engineers:
o Puerto Rico Building Code 1999 o UBC 1997 (Uniform Building Code) o ACI 318‐99 (American Concrete Institute “Building Code Requirements for Structural Concrete”) o ACI 530‐99 (American Concrete Institute “Building Code Requirements for Masonry Structures”) o SJI 1994 (Steel Joist Institute “Standard Specifications, Load Tables and Weight Tables
for Steel Joists and Joist Girders”)
Utilized Computer Programs o ETABS Nonlinear v9.2.0, copyright 2008 (Computers and Structures, Inc.) o pcaColumn v3.64, copyright 2005 (Portland Cement Association)

Lindsay Lynch Advisor: Dr. Andres Lepage ‐ AE Senior Thesis 2008‐2009 ‐
Aquablue at the Golden MileHato Rey, Puerto Rico
‐ Structural Option ‐
R e v i s e d F i n a l R e p o r t – 2 2 A p r i l 2 0 0 9 | 9
Background for Proposal and General Project Goals The focus of this thesis project is on the lateral force resisting system of Aquablue at the Golden Mile. The location of this building in Hato Rey, Puerto Rico puts it at risk for earthquake and tsunami damage due to movement of the Puerto Rico Trench. Therefore, the seismic and wind loads are significant and provide a design challenge. In particular, one of the difficulties in designing the structure of Aquablue occurs in the layout of the shear walls. First of all, the walls cannot be placed along the exterior of the building for architectural reasons. The tenants of this luxury apartment building need to have great views of the outside, and the shear walls would limit the amount of glass on the façade. Also, shear walls that are located at the exterior of the apartment buildings would run right through the middle of the parking garage, which would complicate its design. Therefore, the shear walls need to be located at the core of the building, specifically in two separate groups that can be continuous through each of the two towers. Because of the specific architectural layout of apartments in the two towers of Aquablue, there is an additional challenge in the detailed layout of the shear walls. They cannot be placed just anywhere in the core of the building, so this limitation on the wall placement can result in some odd and inefficient shapes. These shear wall difficulties provide an opportunity for research and re‐design. The following is a list of general topics to be studied, and the goals for this project are to gain a more in‐depth understanding and better engineering judgment in these areas:
Detailed analysis of lateral loads Concrete shear wall design and the ACI 318‐08 building code Computer modeling as a means of structural analysis Economic impact of structural design Architectural impact of structural design

Lindsay Lynch Advisor: Dr. Andres Lepage ‐ AE Senior Thesis 2008‐2009 ‐
Aquablue at the Golden MileHato Rey, Puerto Rico
‐ Structural Option ‐
R e v i s e d F i n a l R e p o r t – 2 2 A p r i l 2 0 0 9 | 10
Proposed Shear Wall Re‐design The shear walls will be completely re‐designed to be more efficient and more cost effective. The location of the walls will remain at the core of the building (one group in each of the two towers), but the layout will be modified to be two I‐shapes that are connected by coupling beams at the ‘flanges’. These symmetric shapes would be much more efficient, and after a preliminary look at the existing layout, it seems like they could be incorporated into the building without too much of an impact on the architecture. The figure below gives a preliminary sketch of the potential solution for one of the towers. The dimensions are approximate in this initial sketch.
Figure 6 – Sketch of Proposed Shear Wall System
In order to achieve this goal, the use of both preliminary hand calculations as well as computer programs will be used. Once the wall layout is determined, a simple analysis based on the factored shear forces and wall lengths will give a likely solution to the required wall thicknesses. Further analysis will be done with the use of computer programs. The building will be modeled 3‐dimensionally in ETABS, with the primary elements being the shear walls, coupling beams, and floor diaphragms. The beams will have to be designed with minimal depth, because the existing gravity system is a flat plate, post‐tensioned slab that is only 8” deep in the residential towers. This efficient floor system limits the floor‐to‐floor height of the building, so the coupling beams will have to be designed (if possible) to fit within a limited depth of about 19.5”. If this design does not work, there might be some implications for the floor height and overall height of the building. The program input will include user‐defined loads based on wind and seismic shear forces calculated by hand. Inherent torsion will be included, as well as accidental torsion by applying 5% eccentricity of the loads to each floor (with potential amplification). The relevant output will include the shear/axial forces and moments in each particular wall and beam, as well as the floor displacements and story drifts.

Lindsay Lynch Advisor: Dr. Andres Lepage ‐ AE Senior Thesis 2008‐2009 ‐
Aquablue at the Golden MileHato Rey, Puerto Rico
‐ Structural Option ‐
R e v i s e d F i n a l R e p o r t – 2 2 A p r i l 2 0 0 9 | 11
Although the structural engineers designed this building based primarily on the Puerto Rico Building Code 1999 and the UBC 1997, the following codes will be used for this design project:
ACI 318‐08 (American Concrete Institute) ASCE 7‐05 (American Society of Civil Engineers) IBC 2006 (International Building Code)
Once the shear wall layout is determined, the wall and coupling beam reinforcement will be designed according to ACI 318‐08, in addition to the computer program pcaColumn. Based on the output from the model in ETABS, the overturning moment at each level for a certain I‐shaped section of shear walls could be determined by assigning a pier label to that section. These moments, in addition to the axial forces in each wall based on gravity loads, would provide enough information to check the layout of the reinforcement in pcaColumn. The arrangement of the reinforcement for the boundary elements and for the wall in general will give the program the information needed to create a force‐moment interaction diagram. A comparison of the diagram with the actual loads will determine if the reinforcement is adequate. It will also illustrate if the reinforcement is over‐designed by giving the location of the data point(s) relative to the edge of the diagram.

Lindsay Lynch Advisor: Dr. Andres Lepage ‐ AE Senior Thesis 2008‐2009 ‐
Aquablue at the Golden MileHato Rey, Puerto Rico
‐ Structural Option ‐
R e v i s e d F i n a l R e p o r t – 2 2 A p r i l 2 0 0 9 | 12
Determination of Lateral Loads For the purpose of this project, an analysis was done for about one‐half of the building (which includes a residential tower and the section of parking garage up to the expansion joint). Because of the seismic joint, each tower could be treated structurally as an independent building. By narrowing the scope to just one building, a more detailed analysis could be completed because the exercises did not have to be repeated for each tower. The sketch below (fig. 7) shows the overall building dimensions as well as the directions of the applied lateral loads. The colored rectangle (about 90’ x 160’) shows the approximate location of the tower above the parking garage.
Figure 7 – Plan Dimensions (N.T.S.) and Cardinal Directions
The wind loads were calculated using the analytical procedure (method 2) in chapter 6 of ASCE 7‐05. A summary of the main design variables is shown to the right in table 2, and the wind pressures for each direction are shown on the following page in table 3. For the purpose of design, the total wind pressures were used to calculate the story forces and story shears.
Table 2 – Wind Design Variables
Basic Wind Speed V (mph) = 145 Wind Directionality Factor Kd = 0.85 Importance Factor I = 1.0 Exposure Category = B Topographic Factor Kzt = 1.0 Velocity Pressure Exposure Coefficient
Kh = 1.32
Velocity Pressure Exposure Coefficient
Kz = (varies)
Velocity Pressures qz, qh (psf) = (varies)
seismic joint

Lindsay Lynch Advisor: Dr. Andres Lepage ‐ AE Senior Thesis 2008‐2009 ‐
Aquablue at the Golden MileHato Rey, Puerto Rico
‐ Structural Option ‐
R e v i s e d F i n a l R e p o r t – 2 2 A p r i l 2 0 0 9 | 13
Height above ground level, z
or h (ft)
North‐South Direction East‐West Direction
windward pressure (psf)
leeward suction (psf)
total wind pressure (psf)
windward pressure (psf)
leeward suction (psf)
total wind pressure (psf)
15 20.38 ‐11.71 32.10 18.01 ‐25.87 43.89 20 22.13 ‐11.71 33.84 19.56 ‐25.87 45.43 25 23.59 ‐11.71 35.30 20.84 ‐25.87 46.72 30 24.85 ‐11.71 36.56 21.96 ‐25.87 47.83 40 26.98 ‐11.71 38.69 23.84 ‐25.87 49.71 50 28.75 ‐11.71 40.47 25.41 ‐25.87 51.28 60 30.29 ‐11.71 42.00 26.77 ‐25.87 52.64 67 31.26 ‐11.71 42.97 27.63 ‐25.87 53.50 67 31.26 ‐11.71 42.97 27.63 ‐25.87 53.50 70 31.66 ‐11.71 43.37 27.97 ‐25.87 53.85 80 32.89 ‐11.71 44.60 29.06 ‐25.87 54.94 90 34.01 ‐11.71 45.72 30.06 ‐25.87 55.93 100 35.05 ‐11.71 46.76 30.97 ‐25.87 56.85 120 36.93 ‐11.71 48.64 32.63 ‐25.87 58.50 140 38.59 ‐11.71 50.30 34.10 ‐25.87 59.97 160 40.09 ‐11.71 51.80 35.43 ‐25.87 61.30 180 41.46 ‐11.71 53.17 36.64 ‐25.87 62.51 200 42.73 ‐11.71 54.44 37.76 ‐25.87 63.63 250 45.54 ‐11.71 57.25 40.24 ‐25.87 66.12 276 46.85 ‐11.71 58.56 41.40 ‐25.87 67.27
* up to level 7 (parking structure) * above level 7 (residential towers)
Table 3 – Calculated Wind Pressures
A summary of the main variables used for the seismic lateral load analysis is shown to the right in table 4. A value of R=6 was used for a building frame system with special reinforced concrete shear walls (ASCE 7‐05, table 12.2‐1). In this study, the analysis was completed using the equivalent lateral force procedure. According to table 12.6‐1 in ASCE 7‐05, this type of analysis is not permitted for the building because it is in a seismic design category D and there is extreme torsional irregularity (type 1b). However, the analysis was used as a feasibility study for the new shear wall layout.
Table 4 – Seismic Design Variables
Spectral Response Acceleration (Short Periods)
Ss = 0.882
Spectral Response Acceleration (1 second)
S1 = 0.301
Site Class = B Importance Factor I = 1.0 Short Period Site Coefficient Fa = 1.0 Long Period Site Coefficient Fv = 1.0 Seismic Design Category = D Response Modification Coefficient R = 6 Fundamental Period T (sec) = 2.031 Seismic Response Coefficient Cs = 0.0165

Lindsay Lynch Advisor: Dr. Andres Lepage ‐ AE Senior Thesis 2008‐2009 ‐
Aquablue at the Golden MileHato Rey, Puerto Rico
‐ Structural Option ‐
R e v i s e d F i n a l R e p o r t – 2 2 A p r i l 2 0 0 9 | 14
In table 5 below, the base shear force was found from the total building weight and the seismic response coefficient. The dead loads for each floor were calculated by doing take‐offs from the original building. Allowances were included for slabs, exterior walls, shear walls, columns, partitions, roofing, and superimposed loads. The areas were found by making approximate calculations based on existing floor plan dimensions.
Level(s) Total Dead Load (psf) Area (ft2)
Weight per Floor (k)
2 153 23440 3586 3 to 6 150 23440 3516 7 170 23440 3985 8 to 17 145 11060 1604 18 to 27 145 11060 1604 28 to 29 145 13490 1956 Roof 117 13490 1578 Sky Lobby Roof 115 4740 545
Total Building Weight, W (k) = 59745 Cs = 0.0165
Base Shear, V (k) = 986
Table 5 – Calculation of Base Shear
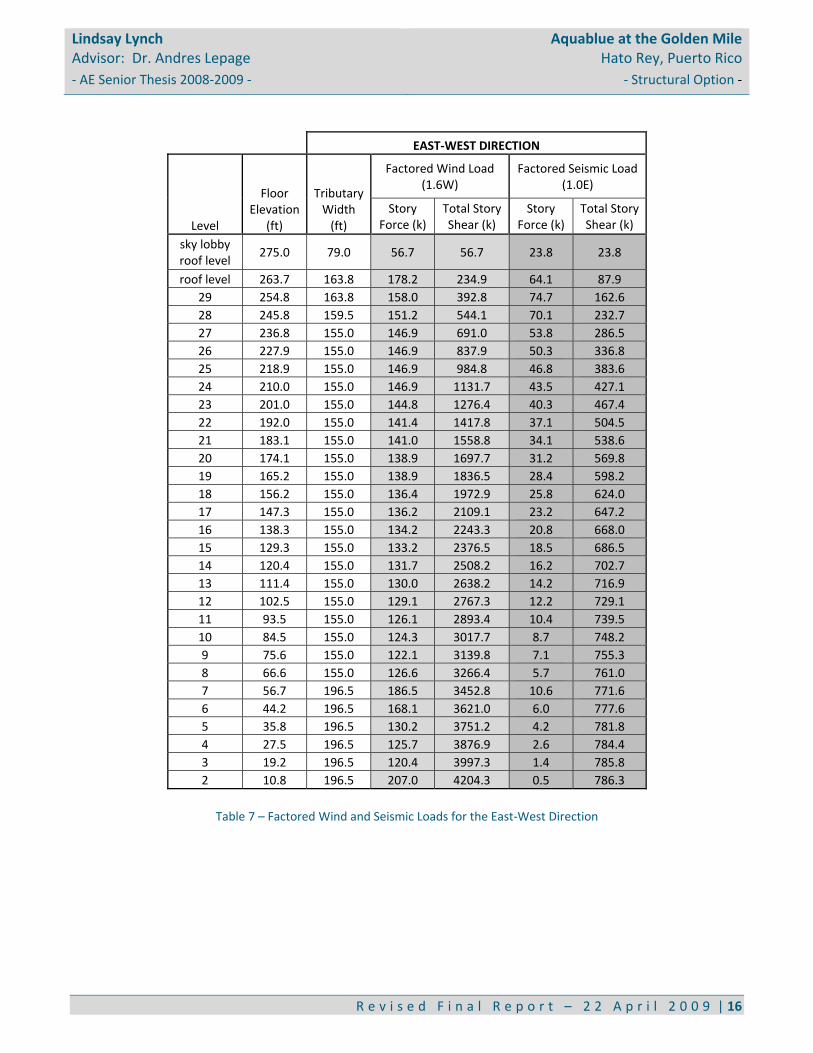
The seismic story forces were calculated by distributing the base shear to each level according to chapter 12 of ASCE 7‐05. Both the seismic and wind loads for each orthogonal direction were then factored (1.6 for wind and 1.0 for earthquake), and the total story shears were calculated. The results are summarized on the next two pages in tables 6 and 7. For both the north‐south and east‐west directions, the factored wind loads were the controlling lateral load case in terms of story forces and base shears. However, both the wind and the seismic loading conditions were used for the design checks throughout the report.

Lindsay Lynch Advisor: Dr. Andres Lepage ‐ AE Senior Thesis 2008‐2009 ‐
Aquablue at the Golden MileHato Rey, Puerto Rico
‐ Structural Option ‐
R e v i s e d F i n a l R e p o r t – 2 2 A p r i l 2 0 0 9 | 15
NORTH‐SOUTH DIRECTION
Level
Floor Elevation
(ft)
Tributary Width (ft)
Factored Wind Load (1.6W)
Factored Seismic Load (1.0E)
Story Force (k)
Total Story Shear (k)
Story Force (k)
Total Story Shear (k)
sky lobby roof level
275.0 60.0 37.5 37.5 23.8 23.8
roof level 263.7 89.0 84.3 121.8 64.1 87.9 29 254.8 89.0 74.7 196.5 74.7 162.6 28 245.8 89.0 73.1 269.6 70.1 232.7 27 236.8 83.5 68.5 338.1 53.8 286.5 26 227.9 83.5 68.5 406.6 50.3 336.8 25 218.9 83.5 68.5 475.1 46.8 383.6 24 210.0 83.5 68.5 543.6 43.5 427.1 23 201.0 83.5 67.2 610.8 40.3 467.4 22 192.0 83.5 65.2 676.0 37.1 504.5 21 183.1 83.5 64.9 740.9 34.1 538.6 20 174.1 83.5 63.6 804.5 31.2 569.8 19 165.2 83.5 63.6 868.1 28.4 598.2 18 156.2 83.5 62.1 930.2 25.8 624.0 17 147.3 83.5 62.0 992.2 23.2 647.2 16 138.3 83.5 60.8 1053.0 20.8 668.0 15 129.3 83.5 60.2 1113.2 18.5 686.5 14 120.4 83.5 59.3 1172.5 16.2 702.7 13 111.4 83.5 58.2 1230.7 14.2 716.9 12 102.5 83.5 57.7 1288.4 12.2 729.1 11 93.5 83.5 55.8 1344.2 10.4 739.5 10 84.5 83.5 54.7 1398.9 8.7 748.2 9 75.6 83.5 53.4 1452.3 7.1 755.3 8 66.6 119.3 78.6 1530.9 5.7 761.0 7 56.7 119.3 90.5 1621.4 10.6 771.6 6 44.2 119.3 80.6 1702.0 6.0 777.6 5 35.8 119.3 61.6 1763.6 4.2 781.8 4 27.5 119.3 58.4 1822.0 2.6 784.4 3 19.2 119.3 54.8 1876.8 1.4 785.8 2 10.8 119.3 91.9 1968.7 0.5 786.3
Table 6 – Factored Wind and Seismic Loads for the North‐South Direction
Lindsay Lynch Advisor: Dr. Andres Lepage ‐ AE Senior Thesis 2008‐2009 ‐
Aquablue at the Golden MileHato Rey, Puerto Rico
‐ Structural Option ‐
R e v i s e d F i n a l R e p o r t – 2 2 A p r i l 2 0 0 9 | 16
EAST‐WEST DIRECTION
Level
Floor Elevation
(ft)
Tributary Width (ft)
Factored Wind Load (1.6W)
Factored Seismic Load (1.0E)
Story Force (k)
Total Story Shear (k)
Story Force (k)
Total Story Shear (k)
sky lobby roof level
275.0 79.0 56.7 56.7 23.8 23.8
roof level 263.7 163.8 178.2 234.9 64.1 87.9 29 254.8 163.8 158.0 392.8 74.7 162.6 28 245.8 159.5 151.2 544.1 70.1 232.7 27 236.8 155.0 146.9 691.0 53.8 286.5 26 227.9 155.0 146.9 837.9 50.3 336.8 25 218.9 155.0 146.9 984.8 46.8 383.6 24 210.0 155.0 146.9 1131.7 43.5 427.1 23 201.0 155.0 144.8 1276.4 40.3 467.4 22 192.0 155.0 141.4 1417.8 37.1 504.5 21 183.1 155.0 141.0 1558.8 34.1 538.6 20 174.1 155.0 138.9 1697.7 31.2 569.8 19 165.2 155.0 138.9 1836.5 28.4 598.2 18 156.2 155.0 136.4 1972.9 25.8 624.0 17 147.3 155.0 136.2 2109.1 23.2 647.2 16 138.3 155.0 134.2 2243.3 20.8 668.0 15 129.3 155.0 133.2 2376.5 18.5 686.5 14 120.4 155.0 131.7 2508.2 16.2 702.7 13 111.4 155.0 130.0 2638.2 14.2 716.9 12 102.5 155.0 129.1 2767.3 12.2 729.1 11 93.5 155.0 126.1 2893.4 10.4 739.5 10 84.5 155.0 124.3 3017.7 8.7 748.2 9 75.6 155.0 122.1 3139.8 7.1 755.3 8 66.6 155.0 126.6 3266.4 5.7 761.0 7 56.7 196.5 186.5 3452.8 10.6 771.6 6 44.2 196.5 168.1 3621.0 6.0 777.6 5 35.8 196.5 130.2 3751.2 4.2 781.8 4 27.5 196.5 125.7 3876.9 2.6 784.4 3 19.2 196.5 120.4 3997.3 1.4 785.8 2 10.8 196.5 207.0 4204.3 0.5 786.3
Table 7 – Factored Wind and Seismic Loads for the East‐West Direction

Lindsay Lynch Advisor: Dr. Andres Lepage ‐ AE Senior Thesis 2008‐2009 ‐
Aquablue at the Golden MileHato Rey, Puerto Rico
‐ Structural Option ‐
R e v i s e d F i n a l R e p o r t – 2 2 A p r i l 2 0 0 9 | 17
The following two tables (8 and 9) provide an analysis for the special wind load cases as defined in figure 6‐9 in chapter 6 of ASCE 7‐05. Some of the load cases include just story forces, while others include story forces plus an applied moment due to eccentricity of the wind load. The load cases are described below, and the calculated values for each level are shown in the tables with an assigned letter for each column. Load Case Column Description ‐ 1a A Factored wind load (NS direction) ‐ 1b G Factored wind load (EW direction)
‐ 2a B + E 75% of the factored wind load + the moment created by 75% of the load at 15% eccentricity (NS direction)
‐ 2b H + K 75% of the factored wind load + the moment created by 75% of the load at 15% eccentricity (EW direction)
‐ 3 B + H 75% of the factored wind load applied in both directions simultaneously ‐ 4 C + F + I + L 56.25% of the factored wind loads in both directions + the moment
created by 56.25% of the wind loads at 15% eccentricity in both directions

Lindsay Lynch Advisor: Dr. Andres Lepage ‐ AE Senior Thesis 2008‐2009 ‐
Aquablue at the Golden MileHato Rey, Puerto Rico
‐ Structural Option ‐
R e v i s e d F i n a l R e p o r t – 2 2 A p r i l 2 0 0 9 | 18
NORTH‐SOUTH DIRECTION
Level
A B C D E F
Story Force, Fx (k)
0.75Fx (k) 0.5625Fx (k) Building
Width, Bx (ft)
Moment, 0.15Bx*0.75Fx
(k‐ft)
Moment, 0.15Bx*0.5625Fx
(k‐ft)
sky lobby roof level
37.5 28.1 21.1 60.0 253.1 189.8
roof level 84.3 63.2 47.4 89.0 844.1 633.0 29 74.7 56.0 42.0 89.0 747.9 561.0 28 73.1 54.8 41.1 89.0 731.9 548.9 27 68.5 51.4 38.5 83.5 643.5 482.6 26 68.5 51.4 38.5 83.5 643.5 482.6 25 68.5 51.4 38.5 83.5 643.5 482.6 24 68.5 51.4 38.5 83.5 643.5 482.6 23 67.2 50.4 37.8 83.5 631.3 473.4 22 65.2 48.9 36.7 83.5 612.5 459.4 21 64.9 48.7 36.5 83.5 609.7 457.2 20 63.6 47.7 35.8 83.5 597.4 448.1 19 63.6 47.7 35.8 83.5 597.4 448.1 18 62.1 46.6 34.9 83.5 583.4 437.5 17 62.0 46.5 34.9 83.5 582.4 436.8 16 60.8 45.6 34.2 83.5 571.1 428.4 15 60.2 45.2 33.9 83.5 565.5 424.1 14 59.3 44.5 33.4 83.5 557.0 417.8 13 58.2 43.7 32.7 83.5 546.7 410.0 12 57.7 43.3 32.5 83.5 542.0 406.5 11 55.8 41.9 31.4 83.5 524.2 393.1 10 54.7 41.0 30.8 83.5 513.8 385.4 9 53.4 40.1 30.0 83.5 501.6 376.2 8 78.6 59.0 44.2 119.3 1055.2 791.4 7 90.5 67.9 50.9 119.3 1215.0 911.2 6 80.6 60.5 45.3 119.3 1082.1 811.5 5 61.6 46.2 34.7 119.3 827.0 620.2 4 58.4 43.8 32.9 119.3 784.0 588.0 3 54.8 41.1 30.8 119.3 735.7 551.8 2 91.9 68.9 51.7 119.3 1233.8 925.3
Table 8 – Special Wind Load Cases for the North‐South Direction

Lindsay Lynch Advisor: Dr. Andres Lepage ‐ AE Senior Thesis 2008‐2009 ‐
Aquablue at the Golden MileHato Rey, Puerto Rico
‐ Structural Option ‐
R e v i s e d F i n a l R e p o r t – 2 2 A p r i l 2 0 0 9 | 19
EAST‐WEST DIRECTION
Level
G H I J K L
Story Force, Fx (k)
0.75Fx (k) 0.5625Fx (k) Building
Width, Bx (ft)
Moment, 0.15Bx*0.75Fx
(k‐ft)
Moment, 0.15Bx*0.5625Fx
(k‐ft)
sky lobby roof level
56.7 42.5 31.9 79.0 503.8 377.9
roof level 178.2 133.6 100.2 163.8 3283.9 2462.9 29 158.0 118.5 88.9 163.8 2911.6 2183.7 28 151.2 113.4 85.1 159.5 2713.8 2035.4 27 146.9 110.2 82.6 155.0 2561.6 1921.2 26 146.9 110.2 82.6 155.0 2561.6 1921.2 25 146.9 110.2 82.6 155.0 2561.6 1921.2 24 146.9 110.2 82.6 155.0 2561.6 1921.2 23 144.8 108.6 81.4 155.0 2524.1 1893.1 22 141.4 106.0 79.5 155.0 2465.0 1848.7 21 141.0 105.7 79.3 155.0 2458.3 1843.8 20 138.9 104.2 78.1 155.0 2421.7 1816.3 19 138.9 104.2 78.1 155.0 2421.7 1816.3 18 136.4 102.3 76.7 155.0 2378.3 1783.7 17 136.2 102.1 76.6 155.0 2374.8 1781.1 16 134.2 100.6 75.5 155.0 2339.2 1754.4 15 133.2 99.9 74.9 155.0 2323.2 1742.4 14 131.7 98.8 74.1 155.0 2297.2 1722.9 13 130.0 97.5 73.1 155.0 2266.4 1699.8 12 129.1 96.9 72.6 155.0 2251.9 1688.9 11 126.1 94.6 70.9 155.0 2198.5 1648.9 10 124.3 93.2 69.9 155.0 2166.8 1625.1 9 122.1 91.6 68.7 155.0 2128.6 1596.4 8 126.6 95.0 71.2 155.0 2207.8 1655.8 7 186.5 139.9 104.9 196.5 4122.2 3091.6 6 168.1 126.1 94.6 196.5 3716.5 2787.4 5 130.2 97.7 73.3 196.5 2879.1 2159.3 4 125.7 94.3 70.7 196.5 2779.2 2084.4 3 120.4 90.3 67.7 196.5 2661.2 1995.9 2 207.0 155.2 116.4 196.5 4575.8 3431.8
Table 9 – Special Wind Load Cases for the East‐West Direction
Lindsay Lynch Advisor: Dr. Andres Lepage ‐ AE Senior Thesis 2008‐2009 ‐
Aquablue at the Golden MileHato Rey, Puerto Rico
‐ Structural Option ‐
R e v i s e d F i n a l R e p o r t – 2 2 A p r i l 2 0 0 9 | 20
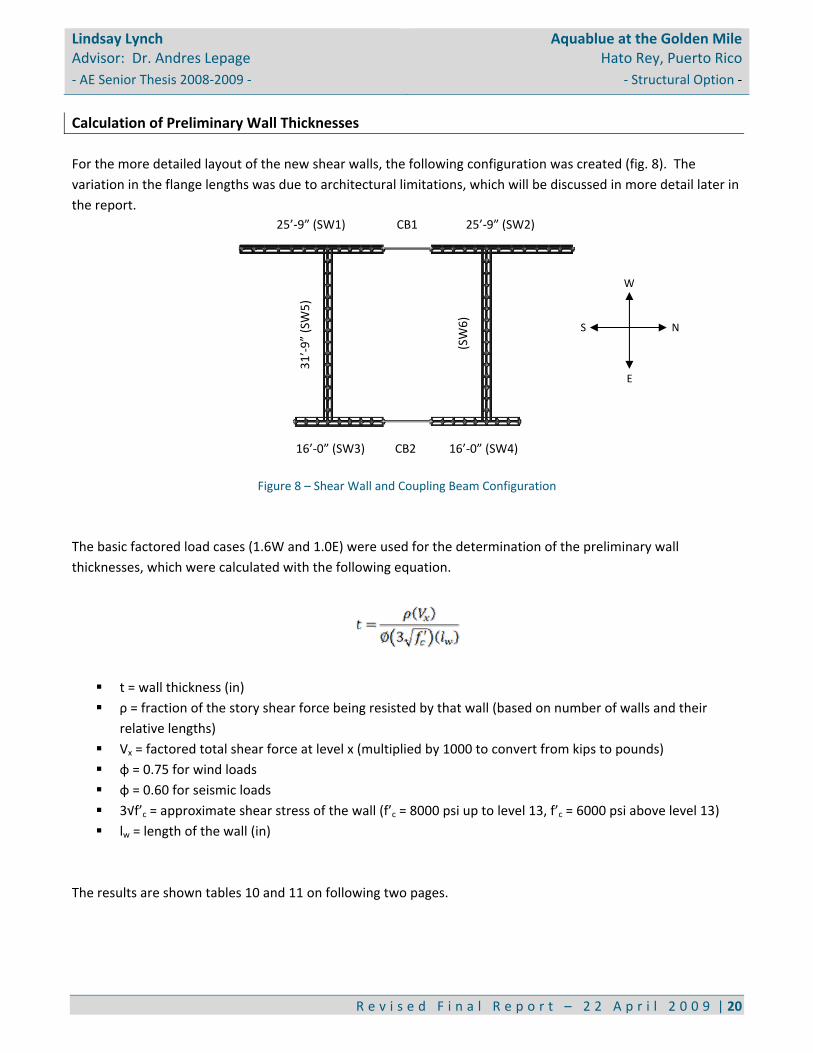
Calculation of Preliminary Wall Thicknesses For the more detailed layout of the new shear walls, the following configuration was created (fig. 8). The variation in the flange lengths was due to architectural limitations, which will be discussed in more detail later in the report. 25’‐9” (SW1) CB1 25’‐9” (SW2)
16’‐0” (SW3) CB2 16’‐0” (SW4)
Figure 8 – Shear Wall and Coupling Beam Configuration
The basic factored load cases (1.6W and 1.0E) were used for the determination of the preliminary wall thicknesses, which were calculated with the following equation.
t = wall thickness (in) ρ = fraction of the story shear force being resisted by that wall (based on number of walls and their
relative lengths) Vx = factored total shear force at level x (multiplied by 1000 to convert from kips to pounds) φ = 0.75 for wind loads φ = 0.60 for seismic loads 3√f’c = approximate shear stress of the wall (f’c = 8000 psi up to level 13, f’c = 6000 psi above level 13) lw = length of the wall (in)
The results are shown tables 10 and 11 on following two pages.
31’‐9
” (SW5)
(SW6)
N S
W
E

Lindsay Lynch Advisor: Dr. Andres Lepage ‐ AE Senior Thesis 2008‐2009 ‐
Aquablue at the Golden MileHato Rey, Puerto Rico
‐ Structural Option ‐
R e v i s e d F i n a l R e p o r t – 2 2 A p r i l 2 0 0 9 | 21
NORTH‐SOUTH DIRECTION
Level
Wind (factored) Seismic (factored) Preliminary Shear Wall Thickness
(in)
Story Force, Fx (k)
Total Shear, Vx (k)
Story Force, Fx (k)
Total Shear, Vx (k)
SW1 SW2 SW3 SW4
sky lobby roof level
37.5 37.5 23.8 23.8 0.21 0.21 0.22 0.22
roof level 84.3 121.8 64.1 87.9 0.67 0.67 0.73 0.73 29 74.7 196.5 74.7 162.6 1.12 1.12 1.21 1.21 28 73.1 269.6 70.1 232.7 1.60 1.60 1.74 1.74 27 68.5 338.1 53.8 286.5 1.98 1.98 2.14 2.14 26 68.5 406.6 50.3 336.8 2.32 2.32 2.52 2.52 25 68.5 475.1 46.8 383.6 2.65 2.65 2.87 2.87 24 68.5 543.6 43.5 427.1 3.00 3.00 3.25 3.25 23 67.2 610.8 40.3 467.4 3.37 3.37 3.65 3.65 22 65.2 676.0 37.1 504.5 3.73 3.73 4.04 4.04 21 64.9 740.9 34.1 538.6 4.09 4.09 4.43 4.43 20 63.6 804.5 31.2 569.8 4.44 4.44 4.81 4.81 19 63.6 868.1 28.4 598.2 4.79 4.79 5.19 5.19 18 62.1 930.2 25.8 624.0 5.13 5.13 5.56 5.56 17 62.0 992.2 23.2 647.2 5.47 5.47 5.93 5.93 16 60.8 1053.0 20.8 668.0 5.81 5.81 6.29 6.29 15 60.2 1113.2 18.5 686.5 6.14 6.14 6.65 6.65 14 59.3 1172.5 16.2 702.7 6.47 6.47 7.01 7.01 13 58.2 1230.7 14.2 716.9 5.88 5.88 6.37 6.37 12 57.7 1288.4 12.2 729.1 6.16 6.16 6.67 6.67 11 55.8 1344.2 10.4 739.5 6.42 6.42 6.96 6.96 10 54.7 1398.9 8.7 748.2 6.68 6.68 7.24 7.24 9 53.4 1452.3 7.1 755.3 6.94 6.94 7.52 7.52 8 78.6 1530.9 5.7 761.0 7.31 7.31 7.92 7.92 7 90.5 1621.4 10.6 771.6 7.75 7.75 8.39 8.39 6 80.6 1702.0 6.0 777.6 8.13 8.13 8.81 8.81 5 61.6 1763.6 4.2 781.8 8.43 8.43 9.13 9.13 4 58.4 1822.0 2.6 784.4 8.71 8.71 9.43 9.43 3 54.8 1876.8 1.4 785.8 8.97 8.97 9.71 9.71 2 91.9 1968.7 0.5 786.3 9.41 9.41 10.19 10.19
Table 10 – Preliminary Thicknesses for Walls in the North‐South Direction

Lindsay Lynch Advisor: Dr. Andres Lepage ‐ AE Senior Thesis 2008‐2009 ‐
Aquablue at the Golden MileHato Rey, Puerto Rico
‐ Structural Option ‐
R e v i s e d F i n a l R e p o r t – 2 2 A p r i l 2 0 0 9 | 22
EAST‐WEST DIRECTION
Level
Wind (factored) Seismic (factored) Preliminary Shear Wall
Thickness (in)
Story Force, Fx (k)
Total Shear, Vx (k)
Story Force, Fx (k)
Total Shear, Vx (k)
SW5 SW6
sky lobby roof level
56.7 56.7 23.8 23.8 0.44 0.44
roof level 178.2 234.9 64.1 87.9 1.81 1.81 29 158.0 392.8 74.7 162.6 3.03 3.03 28 151.2 544.1 70.1 232.7 4.20 4.20 27 146.9 691.0 53.8 286.5 5.33 5.33 26 146.9 837.9 50.3 336.8 6.46 6.46 25 146.9 984.8 46.8 383.6 7.59 7.59 24 146.9 1131.7 43.5 427.1 8.73 8.73 23 144.8 1276.4 40.3 467.4 9.84 9.84 22 141.4 1417.8 37.1 504.5 10.93 10.93 21 141.0 1558.8 34.1 538.6 12.02 12.02 20 138.9 1697.6 31.2 569.8 13.09 13.09 19 138.9 1836.5 28.4 598.2 14.16 14.16 18 136.4 1972.9 25.8 624.0 15.22 15.22 17 136.2 2109.1 23.2 647.2 16.27 16.27 16 134.2 2243.3 20.8 668.0 17.30 17.30 15 133.2 2376.5 18.5 686.5 18.33 18.33 14 131.7 2508.2 16.2 702.7 19.34 19.34 13 130.0 2638.2 14.2 716.9 17.62 17.62 12 129.1 2767.3 12.2 729.1 18.48 18.48 11 126.1 2893.4 10.4 739.5 19.32 19.32 10 124.3 3017.7 8.7 748.2 20.15 20.15 9 122.1 3139.7 7.1 755.3 20.97 20.97 8 126.6 3266.4 5.7 761.0 21.82 21.82 7 186.5 3452.8 10.6 771.6 23.06 23.06 6 168.1 3620.9 6.0 777.6 24.18 24.18 5 130.2 3751.2 4.2 781.8 25.05 25.05 4 125.7 3876.9 2.6 784.4 25.89 25.89 3 120.4 3997.3 1.4 785.8 26.70 26.70 2 207.0 4204.3 0.5 786.3 28.08 28.08
Table 11 – Preliminary Thicknesses for Walls in the East‐West Direction
For the initial model, an 18” thickness was used for all shear walls oriented in the north‐south direction. For the east‐west direction, a 30” wall was used up to level 7, a 24” wall through level 16, and an 18” wall extending to the top floor.
Lindsay Lynch Advisor: Dr. Andres Lepage ‐ AE Senior Thesis 2008‐2009 ‐
Aquablue at the Golden MileHato Rey, Puerto Rico
‐ Structural Option ‐
R e v i s e d F i n a l R e p o r t – 2 2 A p r i l 2 0 0 9 | 23
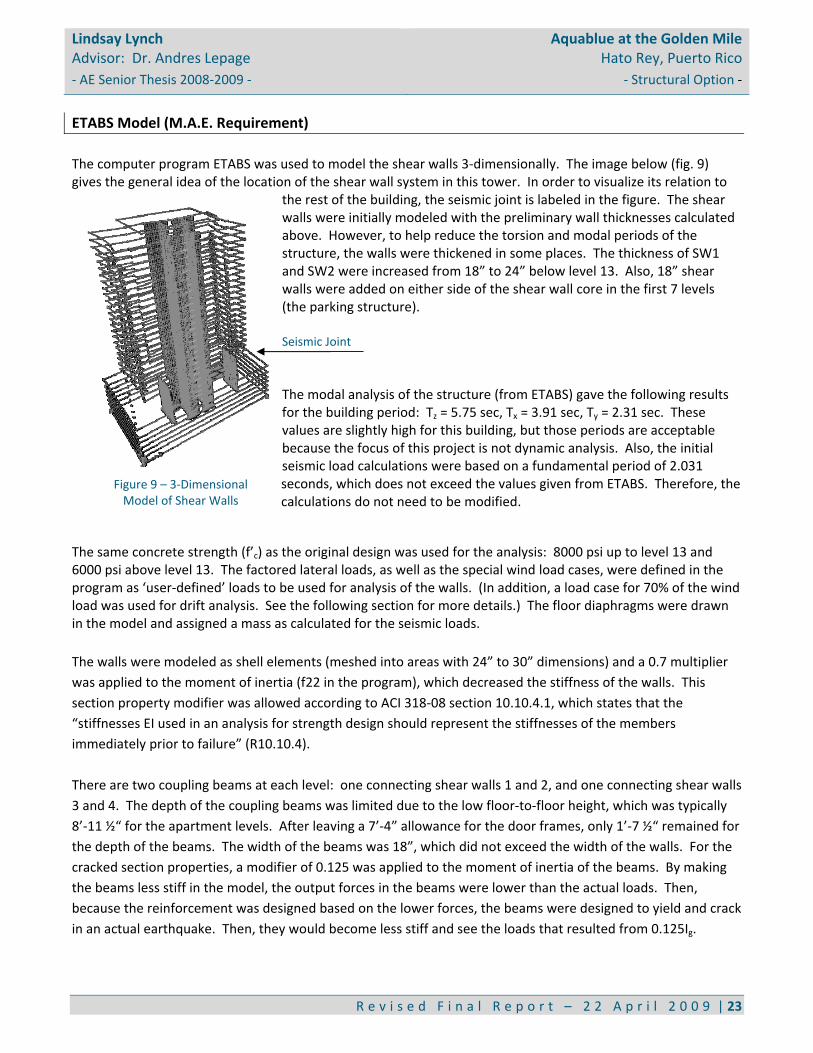
ETABS Model (M.A.E. Requirement) The computer program ETABS was used to model the shear walls 3‐dimensionally. The image below (fig. 9) gives the general idea of the location of the shear wall system in this tower. In order to visualize its relation to
the rest of the building, the seismic joint is labeled in the figure. The shear walls were initially modeled with the preliminary wall thicknesses calculated above. However, to help reduce the torsion and modal periods of the structure, the walls were thickened in some places. The thickness of SW1 and SW2 were increased from 18” to 24” below level 13. Also, 18” shear walls were added on either side of the shear wall core in the first 7 levels (the parking structure). Seismic Joint The modal analysis of the structure (from ETABS) gave the following results for the building period: Tz = 5.75 sec, Tx = 3.91 sec, Ty = 2.31 sec. These values are slightly high for this building, but those periods are acceptable because the focus of this project is not dynamic analysis. Also, the initial seismic load calculations were based on a fundamental period of 2.031 seconds, which does not exceed the values given from ETABS. Therefore, the calculations do not need to be modified.
The same concrete strength (f’c) as the original design was used for the analysis: 8000 psi up to level 13 and 6000 psi above level 13. The factored lateral loads, as well as the special wind load cases, were defined in the program as ‘user‐defined’ loads to be used for analysis of the walls. (In addition, a load case for 70% of the wind load was used for drift analysis. See the following section for more details.) The floor diaphragms were drawn in the model and assigned a mass as calculated for the seismic loads. The walls were modeled as shell elements (meshed into areas with 24” to 30” dimensions) and a 0.7 multiplier was applied to the moment of inertia (f22 in the program), which decreased the stiffness of the walls. This section property modifier was allowed according to ACI 318‐08 section 10.10.4.1, which states that the “stiffnesses EI used in an analysis for strength design should represent the stiffnesses of the members immediately prior to failure” (R10.10.4). There are two coupling beams at each level: one connecting shear walls 1 and 2, and one connecting shear walls 3 and 4. The depth of the coupling beams was limited due to the low floor‐to‐floor height, which was typically 8’‐11 ½“ for the apartment levels. After leaving a 7’‐4” allowance for the door frames, only 1’‐7 ½“ remained for the depth of the beams. The width of the beams was 18”, which did not exceed the width of the walls. For the cracked section properties, a modifier of 0.125 was applied to the moment of inertia of the beams. By making the beams less stiff in the model, the output forces in the beams were lower than the actual loads. Then, because the reinforcement was designed based on the lower forces, the beams were designed to yield and crack in an actual earthquake. Then, they would become less stiff and see the loads that resulted from 0.125Ig.
Figure 9 – 3‐Dimensional Model of Shear Walls

Lindsay Lynch Advisor: Dr. Andres Lepage ‐ AE Senior Thesis 2008‐2009 ‐
Aquablue at the Golden MileHato Rey, Puerto Rico
‐ Structural Option ‐
R e v i s e d F i n a l R e p o r t – 2 2 A p r i l 2 0 0 9 | 24
For clarity, the elevations of each of the main shear walls are shown in figure 10 below. There are some variations and openings along the height of the building due to architectural reasons. To summarize, SW1 and SW2 are 24” thick up to level 13 and 18” for the upper floors, while SW3 and SW4 are 18” thick for the total building height. SW5 and SW6 are 30” up to level 7, 24” up to level 16, and 18” for the upper floors.
Figure 10 – Shear Wall Elevations and Thicknesses
SW5 SW6 SW3 and SW4SW1 and SW2
18”
18”
30”
24”
30”
24”
18”18”
24”

Lindsay Lynch Advisor: Dr. Andres Lepage ‐ AE Senior Thesis 2008‐2009 ‐
Aquablue at the Golden MileHato Rey, Puerto Rico
‐ Structural Option ‐
R e v i s e d F i n a l R e p o r t – 2 2 A p r i l 2 0 0 9 | 25
Drift Analysis Initially, the calculated seismic story forces were defined in the ETABS model with an automatic 5% accidental torsion. After running the model, the displacements at the roof level (table 12) were used to determine if there were any horizontal structural irregularities in the building. The maximum seismic drift for two points at opposite ends of the level was found. For the load case with the maximum displacements, the larger of the two displacements was divided by the average of the displacements at that point.
Point 1 Point2
dx dy dx dy
Story Drift (in) NS Seismic 0.1737 0.2547 0.4602 0.2589
EW Seismic 0.0216 0.0010 0.0637 0.1538
Table 12 – Displacements of two points at the roof level with 5% accidental eccentricity
The maximum drifts were in the x‐direction due to seismic loads oriented in the north‐south direction. The
following equation was used to determine that there was extreme torsional irregularity because dmax/davg > 1.4.
The types of horizontal irregularities are defined in table 12.3‐1 of ASCE 7‐05.
0.46020.4602 0.1737
21.45
Because of the irregularity, a torsional amplification factor (ASCE 7‐05, 12.8.4.3) was calculated and applied to the accidental eccentricity ratio. This calculation for accidental torsion was only based on the displacements at the roof level, but the value was used for the entire building.
1.21.451.2
1.46
Accidental eccentricity ratio = (0.05)(1.46) = 0.073
Table 13 on the following page summarizes the drift analyses at each floor for both wind and seismic loads. The drift limit for wind is defined as L/400, which is common practice. The ETABS output for wind is based on 70% of the calculated loads. In section CC.1.2 of ASCE 7‐05, it is written that the use of factored wind loads for serviceability checks is extremely conservative. Therefore, the load combination with a 5% chance of being exceeded in a given year (0.70W) is used in this analysis. The allowable story drift due to seismic loads is based on an occupancy category of II (ASCE 7‐05, table 12.12‐1). The actual drifts from ETABS are multiplied by a deflection amplification factor, Cd, which is equal to 5 for special reinforced concrete shear walls (ASCE 7‐05, table 12.2‐1). For the new shear wall design, the story drifts do not exceed the given limits.

Lindsay Lynch Advisor: Dr. Andres Lepage ‐ AE Senior Thesis 2008‐2009 ‐
Aquablue at the Golden MileHato Rey, Puerto Rico
‐ Structural Option ‐
R e v i s e d F i n a l R e p o r t – 2 2 A p r i l 2 0 0 9 | 26
Story Drift due to Wind (in) Story Drift due to Seismic (in)
Level Story Height
(ft)
ETABS Output (deflection due
to 0.7W)
Code Recommendation
(L/400)
ETABS Output (Cd * deflection due
to 1.0E)
Code Requirement (0.020h)
sky lobby roof level 11.250 0.232 0.338 1.820 2.70 roof level 9.000 0.202 0.270 1.619 2.16 29 9.000 0.203 0.270 1.630 2.16 28 9.000 0.243 0.270 2.018 2.16 27 9.000 0.205 0.270 1.634 2.16 26 9.000 0.206 0.270 1.646 2.16 25 9.000 0.208 0.270 1.656 2.16 24 9.000 0.210 0.270 1.662 2.16 23 9.000 0.211 0.270 1.665 2.16 22 9.000 0.212 0.270 1.663 2.16 21 9.000 0.212 0.270 1.655 2.16 20 9.000 0.212 0.270 1.641 2.16 19 9.000 0.211 0.270 1.620 2.16 18 9.000 0.209 0.270 1.591 2.16 17 9.000 0.207 0.270 1.553 2.16 16 9.000 0.203 0.270 1.506 2.16 15 9.000 0.198 0.270 1.452 2.16 14 9.000 0.191 0.270 1.387 2.16 13 9.000 0.184 0.270 1.319 2.16 12 9.000 0.178 0.270 1.262 2.16 11 9.000 0.171 0.270 1.198 2.16 10 9.000 0.162 0.270 1.127 2.16 9 9.000 0.153 0.270 1.048 2.16 8 10.000 0.170 0.300 1.173 2.40 7 12.500 0.162 0.375 1.057 3.00 6 8.333 0.092 0.250 0.592 2.00 5 8.333 0.078 0.250 0.493 2.00 4 8.333 0.062 0.250 0.387 2.00 3 8.333 0.044 0.250 0.271 2.00 2 10.833 0.022 0.325 0.130 2.60
Table 13 – Story Drifts Under Wind and Seismic Loads
A brief check was conducted for the existing seismic joint (which extends from the base to the 7th floor) based on ASCE 7‐05 section 12.12.3 (‘Building Separation’). The maximum drift at level 7 in the north‐south direction is 1.06”, which is due to the seismic loading. The analysis was only completed for one of the towers, so the required separation was assumed to be twice that displacement, or 2.12”. Therefore, it is assumed that the existing 5” seismic joint would suffice with the new shear wall design and no pounding would occur.

Lindsay Lynch Advisor: Dr. Andres Lepage ‐ AE Senior Thesis 2008‐2009 ‐
Aquablue at the Golden MileHato Rey, Puerto Rico
‐ Structural Option ‐
R e v i s e d F i n a l R e p o r t – 2 2 A p r i l 2 0 0 9 | 27
Feasibility Test for Coupling Beams Because of the shallow depth of the coupling beams, an analysis was done to see if the beams could be designed without diagonal reinforcing. In order to avoid diagonal reinforcing (according to ASCE 7‐05 section 21.9.7), the following equation had to be met.
⁄√
12 4
Vu = factored shear force in the beam based on the following load combinations
o 1.2D + 0.5L + 1.6W o 0.9D + 1.6W o 1.32D + 0.5L + 1.0E (modified, see below) o 0.78D + 1.0E (modified, see below)
φ = 0.75 for wind loads φ = 0.60 for seismic loads λ = 1 for normal weight concrete f’c = 8000 psi up to level 13, f’c = 6000 psi above level 13 Acw = cross‐sectional area of the beam (18” x 19.5” = 351 in2)
The values for Vu were found based on both hand calculations and ETABS output. Using the tributary area for each beam, the estimated dead load for each floor, and the provided live loads from IBC 2006, the Vu from gravity loads was calculated. Generally, the tributary area was found to be 183.4 ft2 for the coupling beam labeled CB1 and 142.9 ft2 (apartments) or 230.6 ft2 (parking area) for the coupling beam labeled CB2. The dead loads were summarized previously for the seismic load calculations. The live loads were assumed to be 20 psf for the roof, 100 psf for the apartment towers (because the shear walls surround the elevator lobby, which is treated as a corridor), and 40 psf for the parking garage. The shear forces in the beams due to wind were found from ETABS. All of the special load cases were considered. The seismic load combinations were modified according to section 12.4 of ASCE 7‐05.
Seismic effects, E = Eh ± Ev Eh = ρQE (ρ = 1.3 for Seismic Design Category D, QE = seismic force) Ev = (0.2SDS)D = 0.2(0.588)D = 0.1176D Modified Dead Load Factors:
o 1.2 + 0.1176 = 1.318 o 0.9 – 0.1176 = 0.782
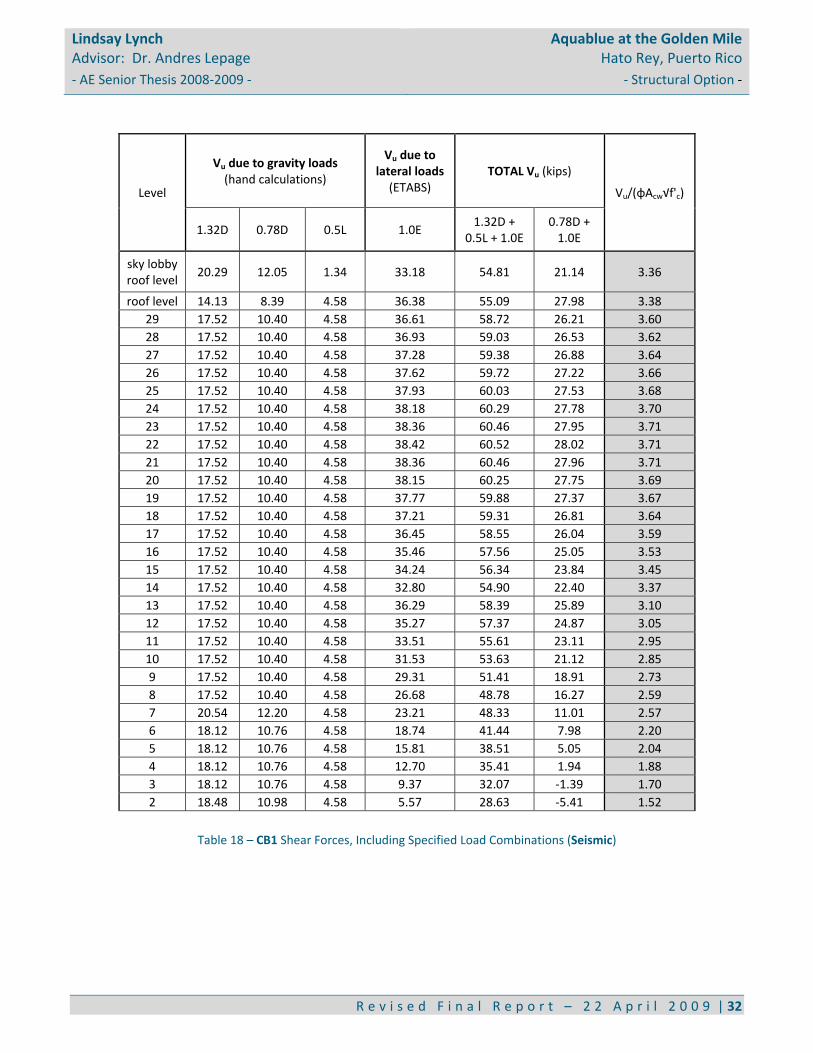
The total Vu from the gravity calculations and the ETABS output was found using the previously stated load combinations, and the maximum Vu was used in the equation to check the necessity of diagonal reinforcement. The results are summarized in the tables on the next few pages. (Note: There is only one coupling beam at the top level because the shear wall configuration changes due to the sky lobby.)

Lindsay Lynch Advisor: Dr. Andres Lepage ‐ AE Senior Thesis 2008‐2009 ‐
Aquablue at the Golden MileHato Rey, Puerto Rico
‐ Structural Option ‐
R e v i s e d F i n a l R e p o r t – 2 2 A p r i l 2 0 0 9 | 28
Level
Vu due to gravity loads (hand calculations)
Vu due to lateral loads (ETABS)
Wind Case 1 Wind Case 2 Wind Case 3 Wind Case 4
1.2D 0.9D 0.5L 1.6W (in NS direction for
beams)
0.75(1.6W) + 15% eccentricity (max. in either NS or EW
direction)
0.75(1.6W) (simultaneous in both directions)
0.5625(1.6W) + 15% eccentricity (applied in both
directions)
sky lobby roof level
18.47 13.86 1.34 34.99 21.76 26.04 3.24
roof level 12.87 9.65 4.58 38.35 23.84 28.55 3.53 29 15.95 11.97 4.58 38.60 23.99 28.73 3.54 28 15.95 11.97 4.58 38.94 24.21 28.99 3.58 27 15.95 11.97 4.58 39.35 24.48 29.29 3.64 26 15.95 11.97 4.58 39.79 24.77 29.62 3.73 25 15.95 11.97 4.58 40.24 25.07 29.95 3.83 24 15.95 11.97 4.58 40.68 25.37 30.27 3.96 23 15.95 11.97 4.58 41.08 25.65 30.56 4.10 22 15.95 11.97 4.58 41.40 25.90 30.80 4.26 21 15.95 11.97 4.58 41.64 26.09 30.97 4.44 20 15.95 11.97 4.58 41.75 26.22 31.05 4.64 19 15.95 11.97 4.58 41.72 26.26 31.02 4.85 18 15.95 11.97 4.58 41.52 26.21 30.86 5.09 17 15.95 11.97 4.58 41.12 26.05 30.55 5.34 16 15.95 11.97 4.58 40.49 25.75 30.07 5.61 15 15.95 11.97 4.58 39.61 25.31 29.41 5.89 14 15.95 11.97 4.58 38.48 24.71 28.55 6.15 13 15.95 11.97 4.58 43.23 27.92 32.06 7.50 12 15.95 11.97 4.58 42.48 27.57 31.50 7.83 11 15.95 11.97 4.58 40.84 26.66 30.26 8.07 10 15.95 11.97 4.58 38.91 25.58 15.98 8.33 9 15.95 11.97 4.58 36.67 24.31 27.15 8.59 8 15.95 11.97 4.58 33.87 22.70 25.06 8.80 7 18.70 14.03 4.58 30.06 20.47 22.34 9.11 6 16.50 12.38 4.58 24.89 17.24 18.75 8.81 5 16.50 12.38 4.58 21.29 14.82 16.19 7.94 4 16.50 12.38 4.58 17.34 12.13 13.35 6.79 3 16.50 12.38 4.58 12.96 9.10 10.16 5.34 2 16.83 12.63 4.58 7.82 5.50 6.25 3.34
Table 14 – CB1 Shear Forces Due to Gravity and Lateral Loads (Wind)

Lindsay Lynch Advisor: Dr. Andres Lepage ‐ AE Senior Thesis 2008‐2009 ‐
Aquablue at the Golden MileHato Rey, Puerto Rico
‐ Structural Option ‐
R e v i s e d F i n a l R e p o r t – 2 2 A p r i l 2 0 0 9 | 29
Level
TOTAL Vu (kips)
Vu/ (φΑcw√f'c)
1.2D + 0.5L + Wind Case 1
1.2D + 0.5L + Wind Case 2
1.2D + 0.5L + Wind Case 3
1.2D + 0.5L + Wind Case 4
0.9D + Wind Case 1
0.9D + Wind Case 2
0.9D + Wind Case 3
0.9D + Wind Case
4
sky lobby roof level
54.80 41.57 45.86 23.05 21.13 7.90 12.19 ‐10.62 3.36
roof level 55.81 41.30 46.01 20.99 28.70 14.19 18.89 ‐6.13 3.42 29 59.13 44.53 49.27 24.07 26.63 12.03 16.77 ‐8.43 3.62 28 59.48 44.75 49.53 24.12 26.98 12.25 17.02 ‐8.39 3.65 27 59.89 45.02 49.83 24.18 27.38 12.51 17.32 ‐8.32 3.67 26 60.33 45.31 50.15 24.27 27.83 12.80 17.65 ‐8.24 3.70 25 60.78 45.61 50.49 24.37 28.28 13.11 17.99 ‐8.13 3.73 24 61.22 45.91 50.81 24.50 28.72 13.41 18.31 ‐8.01 3.75 23 61.61 46.19 51.10 24.64 29.11 13.69 18.60 ‐7.86 3.78 22 61.94 46.43 51.34 24.80 29.44 13.93 18.84 ‐7.70 3.80 21 62.18 46.63 51.51 24.98 29.67 14.12 19.00 ‐7.52 3.81 20 62.29 46.76 51.59 25.18 29.79 14.25 19.08 ‐7.33 3.82 19 62.26 46.80 51.56 25.39 29.76 14.30 19.05 ‐7.11 3.82 18 62.06 46.75 51.40 25.62 29.55 14.25 18.89 ‐6.88 3.80 17 61.66 46.59 51.09 25.87 29.15 14.08 18.59 ‐6.63 3.78 16 61.02 46.29 50.61 26.15 28.52 13.78 18.11 ‐6.36 3.74 15 60.15 45.85 49.95 26.43 27.65 13.34 17.45 ‐6.08 3.69 14 59.01 45.25 49.09 26.69 26.51 12.74 16.59 ‐5.81 3.62 13 63.76 48.46 52.60 28.04 31.26 15.96 20.10 ‐4.47 3.39 12 63.02 48.11 52.03 28.37 30.51 15.61 19.53 ‐4.14 3.35 11 61.37 47.19 50.80 28.61 28.87 14.69 18.30 ‐3.89 3.26 10 59.45 46.12 36.52 28.87 26.94 13.61 4.01 ‐3.64 3.16 9 57.21 44.85 47.68 29.13 24.71 12.35 15.18 ‐3.37 3.04 8 54.41 43.23 45.60 29.34 21.91 10.73 13.09 ‐3.16 2.89 7 53.35 43.76 45.63 32.40 16.03 6.44 8.31 ‐4.92 2.83 6 45.97 38.32 39.84 29.89 12.51 4.86 6.37 ‐3.57 2.44 5 42.38 35.91 37.27 29.03 8.91 2.45 3.81 ‐4.44 2.25 4 38.43 33.22 34.44 27.88 4.96 ‐0.25 0.97 ‐5.59 2.04 3 34.05 30.18 31.25 26.42 0.58 ‐3.28 ‐2.22 ‐7.04 1.81 2 29.24 26.92 27.67 24.76 ‐4.81 ‐7.13 ‐6.38 ‐9.28 1.55
Table 15 – CB1 Shear Forces Due to Specified Load Combinations (Wind)

Lindsay Lynch Advisor: Dr. Andres Lepage ‐ AE Senior Thesis 2008‐2009 ‐
Aquablue at the Golden MileHato Rey, Puerto Rico
‐ Structural Option ‐
R e v i s e d F i n a l R e p o r t – 2 2 A p r i l 2 0 0 9 | 30
Level
Vu due to gravity loads (hand calculations)
Vu due to lateral loads (ETABS)
Wind Case 1 Wind Case 2 Wind Case 3 Wind Case 4
1.2D 0.9D 0.5L 1.6W (in NS direction for
beams)
0.75(1.6W) + 15% eccentricity (max. in either NS or EW
direction)
0.75(1.6W) (simultaneous in both directions)
0.5625(1.6W) + 15% eccentricity (applied in both
directions)
roof level
10.03 7.52 3.57 16.49 18.00 11.98 26.36
29 12.43 9.32 3.57 18.08 19.72 13.14 28.88 28 12.43 9.32 3.57 18.23 19.84 13.24 29.08 27 12.43 9.32 3.57 18.43 19.98 13.39 29.33 26 12.43 9.32 3.57 18.66 20.13 13.56 29.60 25 12.43 9.32 3.57 18.92 20.27 13.74 29.87 24 12.43 9.32 3.57 19.19 20.38 13.94 30.13 23 12.43 9.32 3.57 19.47 20.46 14.14 30.36 22 12.43 9.32 3.57 19.75 20.48 14.33 30.54 21 12.43 9.32 3.57 20.00 20.44 14.50 30.64 20 12.43 9.32 3.57 20.24 20.56 14.66 30.66 19 12.43 9.32 3.57 20.44 20.65 14.78 30.56 18 12.43 9.32 3.57 20.59 20.69 14.87 30.34 17 12.43 9.32 3.57 20.70 20.65 14.91 29.96 16 12.43 9.32 3.57 20.74 20.52 14.91 29.38 15 12.43 9.32 3.57 20.71 20.30 14.85 28.63 14 12.43 9.32 3.57 20.56 19.97 14.70 27.73 13 12.43 9.32 3.57 23.41 22.50 16.67 30.64 12 12.43 9.32 3.57 23.33 22.16 16.55 29.57 11 12.43 9.32 3.57 23.06 21.62 16.29 28.14 10 12.43 9.32 3.57 22.72 20.98 15.98 26.49 9 12.43 9.32 3.57 22.29 20.21 15.60 24.55 8 12.43 9.32 3.57 21.58 19.12 15.03 22.05 7 23.52 17.64 5.77 20.84 17.71 14.45 18.45 6 20.76 15.57 5.77 18.86 15.42 13.12 14.51 5 20.76 15.57 5.77 16.39 13.35 11.53 12.47 4 20.76 15.57 5.77 13.53 10.98 9.65 10.26 3 20.76 15.57 5.77 10.24 8.28 7.45 7.79 2 21.17 15.88 5.77 6.16 4.99 4.60 4.77
Table 16 – CB2 Shear Forces Due to Gravity and Lateral Loads (Wind)

Lindsay Lynch Advisor: Dr. Andres Lepage ‐ AE Senior Thesis 2008‐2009 ‐
Aquablue at the Golden MileHato Rey, Puerto Rico
‐ Structural Option ‐
R e v i s e d F i n a l R e p o r t – 2 2 A p r i l 2 0 0 9 | 31
Level
TOTAL Vu (kips)
Vu/ (φΑcw√f'c)
1.2D + 0.5L + Wind Case 1
1.2D + 0.5L + Wind Case 2
1.2D + 0.5L + Wind Case 3
1.2D + 0.5L + Wind Case 4
0.9D + Wind Case 1
0.9D + Wind Case 2
0.9D + Wind Case 3
0.9D + Wind Case 4
roof level
30.10 31.60 25.58 39.96 8.97 10.47 4.46 18.83 2.45
29 34.08 35.72 29.14 44.88 8.76 10.39 3.81 19.56 2.75 28 34.23 35.84 29.25 45.08 8.91 10.51 3.92 19.76 2.76 27 34.43 35.98 29.39 45.33 9.11 10.66 4.07 20.00 2.78 26 34.66 36.13 29.56 45.60 9.34 10.81 4.24 20.27 2.80 25 34.92 36.27 29.75 45.87 9.60 10.95 4.42 20.55 2.81 24 35.20 36.39 29.94 46.13 9.87 11.06 4.62 20.81 2.83 23 35.47 36.46 30.14 46.36 10.15 11.14 4.81 21.04 2.84 22 35.75 36.49 30.33 46.54 10.42 11.16 5.00 21.21 2.85 21 36.01 36.44 30.50 46.64 10.68 11.12 5.18 21.32 2.86 20 36.24 36.56 30.66 46.66 10.92 11.24 5.33 21.33 2.86 19 36.44 36.66 30.78 46.57 11.12 11.33 5.46 21.24 2.85 18 36.60 36.69 30.87 46.34 11.27 11.37 5.55 21.02 2.84 17 36.70 36.65 30.92 45.97 11.37 11.33 5.59 20.64 2.82 16 36.74 36.52 30.91 45.38 11.42 11.20 5.59 20.06 2.78 15 36.71 36.30 30.85 44.63 11.38 10.98 5.52 19.31 2.74 14 36.57 35.98 30.70 43.73 11.24 10.65 5.37 18.41 2.68 13 39.42 38.50 32.67 46.64 14.09 13.18 7.35 21.32 2.48 12 39.33 38.16 32.55 45.57 14.00 12.84 7.23 20.25 2.42 11 39.06 37.63 32.29 44.15 13.73 12.30 6.97 18.82 2.34 10 38.72 36.98 31.98 42.49 13.39 11.66 6.66 17.17 2.26 9 38.29 36.21 31.60 40.56 12.96 10.89 6.28 15.23 2.15 8 37.59 35.12 31.03 38.05 12.26 9.80 5.71 12.72 2.02 7 50.13 47.00 43.73 47.73 3.20 0.07 ‐3.20 0.80 2.66 6 45.38 41.95 39.64 41.03 3.29 ‐0.14 ‐2.45 ‐1.06 2.41 5 42.91 39.87 38.05 38.99 0.83 ‐2.22 ‐4.04 ‐3.09 2.28 4 40.06 37.50 36.17 36.78 ‐2.03 ‐4.59 ‐5.92 ‐5.31 2.13 3 36.76 34.81 33.97 34.31 ‐5.33 ‐7.28 ‐8.11 ‐7.78 1.95 2 33.10 31.92 31.53 31.71 ‐9.72 ‐10.89 ‐11.28 ‐11.11 1.76
Table 17 – CB2 Shear Forces Due to Specified Load Combinations (Wind)
Lindsay Lynch Advisor: Dr. Andres Lepage ‐ AE Senior Thesis 2008‐2009 ‐
Aquablue at the Golden MileHato Rey, Puerto Rico
‐ Structural Option ‐
R e v i s e d F i n a l R e p o r t – 2 2 A p r i l 2 0 0 9 | 32
Level
Vu due to gravity loads (hand calculations)
Vu due to lateral loads (ETABS)
TOTAL Vu (kips)
Vu/(φAcw√f'c)
1.32D 0.78D 0.5L 1.0E 1.32D +
0.5L + 1.0E 0.78D + 1.0E
sky lobby roof level
20.29 12.05 1.34 33.18 54.81 21.14 3.36
roof level 14.13 8.39 4.58 36.38 55.09 27.98 3.38 29 17.52 10.40 4.58 36.61 58.72 26.21 3.60 28 17.52 10.40 4.58 36.93 59.03 26.53 3.62 27 17.52 10.40 4.58 37.28 59.38 26.88 3.64 26 17.52 10.40 4.58 37.62 59.72 27.22 3.66 25 17.52 10.40 4.58 37.93 60.03 27.53 3.68 24 17.52 10.40 4.58 38.18 60.29 27.78 3.70 23 17.52 10.40 4.58 38.36 60.46 27.95 3.71 22 17.52 10.40 4.58 38.42 60.52 28.02 3.71 21 17.52 10.40 4.58 38.36 60.46 27.96 3.71 20 17.52 10.40 4.58 38.15 60.25 27.75 3.69 19 17.52 10.40 4.58 37.77 59.88 27.37 3.67 18 17.52 10.40 4.58 37.21 59.31 26.81 3.64 17 17.52 10.40 4.58 36.45 58.55 26.04 3.59 16 17.52 10.40 4.58 35.46 57.56 25.05 3.53 15 17.52 10.40 4.58 34.24 56.34 23.84 3.45 14 17.52 10.40 4.58 32.80 54.90 22.40 3.37 13 17.52 10.40 4.58 36.29 58.39 25.89 3.10 12 17.52 10.40 4.58 35.27 57.37 24.87 3.05 11 17.52 10.40 4.58 33.51 55.61 23.11 2.95 10 17.52 10.40 4.58 31.53 53.63 21.12 2.85 9 17.52 10.40 4.58 29.31 51.41 18.91 2.73 8 17.52 10.40 4.58 26.68 48.78 16.27 2.59 7 20.54 12.20 4.58 23.21 48.33 11.01 2.57 6 18.12 10.76 4.58 18.74 41.44 7.98 2.20 5 18.12 10.76 4.58 15.81 38.51 5.05 2.04 4 18.12 10.76 4.58 12.70 35.41 1.94 1.88 3 18.12 10.76 4.58 9.37 32.07 ‐1.39 1.70 2 18.48 10.98 4.58 5.57 28.63 ‐5.41 1.52
Table 18 – CB1 Shear Forces, Including Specified Load Combinations (Seismic)

Lindsay Lynch Advisor: Dr. Andres Lepage ‐ AE Senior Thesis 2008‐2009 ‐
Aquablue at the Golden MileHato Rey, Puerto Rico
‐ Structural Option ‐
R e v i s e d F i n a l R e p o r t – 2 2 A p r i l 2 0 0 9 | 33
Level
Vu due to gravity loads (hand calculations)
Vu due to lateral loads (ETABS)
TOTAL Vu (kips)
Vu/(φAcw√f'c)
1.32D 0.78D 0.5L 1.0E 1.32D +
0.5L + 1.0E 0.78D + 1.0E
roof level 11.01 6.54 3.57 11.18 25.77 4.64 1.58 29 13.65 8.10 3.57 12.26 29.48 4.16 1.81 28 13.65 8.10 3.57 12.36 29.58 4.26 1.81 27 13.65 8.10 3.57 12.50 29.72 4.40 1.82 26 13.65 8.10 3.57 12.66 29.88 4.55 1.83 25 13.65 8.10 3.57 12.83 30.05 4.72 1.84 24 13.65 8.10 3.57 13.00 30.22 4.90 1.85 23 13.65 8.10 3.57 13.17 30.39 5.07 1.86 22 13.65 8.10 3.57 13.33 30.55 5.23 1.87 21 13.65 8.10 3.57 13.48 30.70 5.37 1.88 20 13.65 8.10 3.57 13.60 30.82 5.50 1.89 19 13.65 8.10 3.57 13.70 30.92 5.59 1.90 18 13.65 8.10 3.57 13.76 30.98 5.66 1.90 17 13.65 8.10 3.57 13.79 31.01 5.68 1.90 16 13.65 8.10 3.57 13.78 31.00 5.68 1.90 15 13.65 8.10 3.57 13.73 30.95 5.62 1.90 14 13.65 8.10 3.57 13.59 30.81 5.48 1.89 13 13.65 8.10 3.57 15.44 32.66 7.34 1.73 12 13.65 8.10 3.57 15.39 32.61 7.28 1.73 11 13.65 8.10 3.57 15.24 32.46 7.14 1.72 10 13.65 8.10 3.57 15.07 32.29 6.97 1.71 9 13.65 8.10 3.57 14.87 32.09 6.76 1.70 8 13.65 8.10 3.57 14.52 31.74 6.42 1.69 7 25.83 15.34 5.77 14.26 45.86 ‐1.07 2.43 6 22.79 13.53 5.77 13.02 41.57 ‐0.52 2.21 5 22.79 13.53 5.77 11.22 39.77 ‐2.31 2.11 4 22.79 13.53 5.77 9.17 37.73 ‐4.36 2.00 3 22.79 13.53 5.77 6.87 35.42 ‐6.67 1.88 2 23.25 13.80 5.77 4.07 33.08 ‐9.73 1.76
Table 19 – CB2 Shear Forces, Including Specified Load Combinations (Seismic)
Because Vu/(φAcw√f’c) was less than 12 for the wind load cases and less than 4 for the seismic load cases, diagonal reinforcement was not required. Therefore, the analysis continued with the proposed design.

Lindsay Lynch Advisor: Dr. Andres Lepage ‐ AE Senior Thesis 2008‐2009 ‐
Aquablue at the Golden MileHato Rey, Puerto Rico
‐ Structural Option ‐
R e v i s e d F i n a l R e p o r t – 2 2 A p r i l 2 0 0 9 | 34
Shear Wall Reinforcement The shear wall reinforcement was initially designed according to the seismic section 21.9 of ACI 318‐08, which is entitled ‘Special structural walls and coupling beams’. Then, the reinforcement was checked to see if it would be adequate under the wind loads. In some cases, the rebar size had to be increased or the spacing had to be decreased in order to have sufficient strength. Two curtains of reinforcement were used everywhere due to the thickness of the walls. The seismic shear forces in each wall at each level were determined by ETABS, and these values were compared to Acvλ√f’c (where Acv was the wall length multiplied by the wall thickness) to determine if the required reinforcement ratio could be reduced. For the transverse (horizontal) reinforcement, ρt ≥ 0.0025 if Vu exceeded this value, but if not, ρt ≥ 0.0020. Similarly, for the longitudinal reinforcement, ρl ≥ 0.0025 if Vu exceeded this value, but if not, ρt ≥ 0.0012. However, the reinforcement ratio could only be reduced for rebar sizes #5 and smaller. Using the required ratio, a preliminary design for the rebar and spacing was determined for the reinforcement based on the seismic loads. The shear capacity of the wall with this preliminary design was determined by the equation from section 21.9.4 of ACE 319‐08.
φ = 0.60 for seismic design αc = 2.0, based on the height/length ratio of the walls ρt = transverse reinforcement ratio as calculated in the spreadsheet fy = 60 ksi for grade 60 steel
In order to check the reinforcement for the wind loads, the factored shear forces were retrieved from the ETABS model. Then, a simple calculation, Vc = 2λ√f’ctwd (ACI 318‐08, eqn. 11‐3), was done to check the shear capacity of the concrete. An approximation of 0.8lw was made for d. In most cases, 0.5φVc did not exceed the factored shear force, so chapter 11 of ACI 318‐08 was required for the reinforcement design. The shear capacity of the steel was calculated with the steel area of the preliminary rebar design (Vs = As,tfyd/s, ACI 318‐08, eqn. 11‐15). Then, the total capacity of the wall φ(Vc + Vs) was calculated and compared to Vu. For SW1, the transverse reinforcement only needed to be changed for the first two levels. For the longitudinal reinforcement, the following equation was used to determine the minimum reinforcement ratio (ACI 318‐08, eqn. 11‐30).
0.0025 0.5 2.5 0.0025
This equation became the limiting factor for almost all of the walls, so the vertical reinforcement had to be increased. The calculation spreadsheets for SW1 are shown on the following pages. Table 20 shows the preliminary transverse reinforcement, and table 21 shows the preliminary longitudinal reinforcement based on the seismic loads. The last two tables (22 and 23) show the final shear wall reinforcement for SW1 after the wind load check. Similar tables for the remaining five shear walls can be found in the Appendix.

Lindsay Lynch Advisor: Dr. Andres Lepage ‐ AE Senior Thesis 2008‐2009 ‐
Aquablue at the Golden MileHato Rey, Puerto Rico
‐ Structural Option ‐
R e v i s e d F i n a l R e p o r t – 2 2 A p r i l 2 0 0 9 | 35
Seismic
Level
Seismic Shear Force
(from ETABS), Vu (k)
Acvλ√f'c (k)
Transverse (horizontal) Reinforcement
Minimum Required ρt
Required As,t (in
2/ft)
Preliminary Rebar and Spacing
Actual As,t (in2/ft)
Actual ρt
sky lobby roof level
13.1 430.8 0.0020 0.432 (2) #5 @ 12 0.62 0.0029
roof level 27.0 430.8 0.0020 0.432 (2) #5 @ 12 0.62 0.0029 29 61.2 430.8 0.0020 0.432 (2) #5 @ 12 0.62 0.0029 28 93.0 430.8 0.0020 0.432 (2) #5 @ 12 0.62 0.0029 27 116.6 430.8 0.0020 0.432 (2) #5 @ 12 0.62 0.0029 26 138.7 430.8 0.0020 0.432 (2) #5 @ 12 0.62 0.0029 25 159.2 430.8 0.0020 0.432 (2) #5 @ 12 0.62 0.0029 24 178.3 430.8 0.0020 0.432 (2) #5 @ 12 0.62 0.0029 23 196.3 430.8 0.0020 0.432 (2) #5 @ 12 0.62 0.0029 22 213.0 430.8 0.0020 0.432 (2) #5 @ 12 0.62 0.0029 21 228.4 430.8 0.0020 0.432 (2) #5 @ 12 0.62 0.0029 20 242.6 430.8 0.0020 0.432 (2) #5 @ 12 0.62 0.0029 19 255.7 430.8 0.0020 0.432 (2) #5 @ 12 0.62 0.0029 18 268.4 430.8 0.0020 0.432 (2) #5 @ 12 0.62 0.0029 17 279.0 430.8 0.0020 0.432 (2) #5 @ 12 0.62 0.0029 16 273.8 430.8 0.0020 0.432 (2) #5 @ 12 0.62 0.0029 15 295.4 430.8 0.0020 0.432 (2) #5 @ 12 0.62 0.0029 14 312.4 430.8 0.0020 0.432 (2) #5 @ 12 0.62 0.0029 13 329.1 663.3 0.0020 0.576 (2) #5 @ 9 0.83 0.0029 12 316.3 663.3 0.0020 0.576 (2) #5 @ 9 0.83 0.0029 11 306.1 663.3 0.0020 0.576 (2) #5 @ 9 0.83 0.0029 10 279.4 663.3 0.0020 0.576 (2) #5 @ 9 0.83 0.0029 9 226.6 663.3 0.0020 0.576 (2) #5 @ 9 0.83 0.0029 8 72.4 663.3 0.0020 0.576 (2) #5 @ 9 0.83 0.0029 7 176.4 553.8 0.0020 0.576 (2) #5 @ 9 0.83 0.0029 6 235.1 553.8 0.0020 0.576 (2) #5 @ 9 0.83 0.0029 5 318.4 553.8 0.0020 0.576 (2) #5 @ 9 0.83 0.0029 4 482.9 553.8 0.0020 0.576 (2) #5 @ 9 0.83 0.0029 3 909.7 553.8 0.0025 0.720 (2) #5 @ 9 0.83 0.0029 2 832.4 553.8 0.0025 0.720 (2) #5 @ 9 0.83 0.0029
Table 20 – Preliminary Transverse Reinforcement for SW1

Lindsay Lynch Advisor: Dr. Andres Lepage ‐ AE Senior Thesis 2008‐2009 ‐
Aquablue at the Golden MileHato Rey, Puerto Rico
‐ Structural Option ‐
R e v i s e d F i n a l R e p o r t – 2 2 A p r i l 2 0 0 9 | 36
Seismic
Level
Longitudinal (vertical) Reinforcement Shear Capacity (k), φVn = φAcv(αcλ√f'c +
ρtfy) Minimum Required ρl
Required As,l (in
2/ft)
Preliminary Rebar and Spacing
Actual As,l (in2/ft)
Actual ρl
sky lobby roof level
0.0012 0.259 (2) #5 @ 18 0.413 0.0019 1091.7
roof level 0.0012 0.259 (2) #5 @ 18 0.413 0.0019 1091.7 29 0.0012 0.259 (2) #5 @ 18 0.413 0.0019 1091.7 28 0.0012 0.259 (2) #5 @ 18 0.413 0.0019 1091.7 27 0.0012 0.259 (2) #5 @ 18 0.413 0.0019 1091.7 26 0.0012 0.259 (2) #5 @ 18 0.413 0.0019 1091.7 25 0.0012 0.259 (2) #5 @ 18 0.413 0.0019 1091.7 24 0.0012 0.259 (2) #5 @ 18 0.413 0.0019 1091.7 23 0.0012 0.259 (2) #5 @ 18 0.413 0.0019 1091.7 22 0.0012 0.259 (2) #5 @ 18 0.413 0.0019 1091.7 21 0.0012 0.259 (2) #5 @ 18 0.413 0.0019 1091.7 20 0.0012 0.259 (2) #5 @ 18 0.413 0.0019 1091.7 19 0.0012 0.259 (2) #5 @ 18 0.413 0.0019 1091.7 18 0.0012 0.259 (2) #5 @ 18 0.413 0.0019 1091.7 17 0.0012 0.259 (2) #5 @ 18 0.413 0.0019 1091.7 16 0.0012 0.259 (2) #5 @ 18 0.413 0.0019 1091.7 15 0.0012 0.259 (2) #5 @ 18 0.413 0.0019 1091.7 14 0.0012 0.259 (2) #5 @ 18 0.413 0.0019 1091.7 13 0.0012 0.346 (2) #5 @ 18 0.413 0.0014 1562.3 12 0.0012 0.346 (2) #5 @ 18 0.413 0.0014 1562.3 11 0.0012 0.346 (2) #5 @ 18 0.413 0.0014 1562.3 10 0.0012 0.346 (2) #5 @ 18 0.413 0.0014 1562.3 9 0.0012 0.346 (2) #5 @ 18 0.413 0.0014 1562.3 8 0.0012 0.346 (2) #5 @ 18 0.413 0.0014 1562.3 7 0.0012 0.346 (2) #5 @ 18 0.413 0.0014 1304.4 6 0.0012 0.346 (2) #5 @ 18 0.413 0.0014 1304.4 5 0.0012 0.346 (2) #5 @ 18 0.413 0.0014 1304.4 4 0.0012 0.346 (2) #5 @ 18 0.413 0.0014 1304.4 3 0.0025 0.720 (2) #5 @ 9 0.827 0.0029 1304.4 2 0.0025 0.720 (2) #5 @ 9 0.827 0.0029 1304.4
Table 21 – Preliminary Longitudinal Reinforcement and Total Shear Capacity for SW1

Lindsay Lynch Advisor: Dr. Andres Lepage ‐ AE Senior Thesis 2008‐2009 ‐
Aquablue at the Golden MileHato Rey, Puerto Rico
‐ Structural Option ‐
R e v i s e d F i n a l R e p o r t – 2 2 A p r i l 2 0 0 9 | 37
Wind
Level
Wind Shear Force (from ETABS), Vu (k)
Vc = 2√f'ctwd
(k)
Transverse (horizontal) Reinforcement
Vs = As,tfyd/s
(k)
φVn = φ(Vc+Vs)
(k)
Modified Rebar and Spacing
As,t (in2/ft)
NEW φVn = φ(Vc+Vs) (k)
ρt
sky lobby roof level
20.2 689.3 766.3 1091.7 (2) #5 @ 12 0.620 1091.7 0.0029
roof level 55.3 689.3 766.3 1091.7 (2) #5 @ 12 0.620 1091.7 0.0029 29 64.8 689.3 766.3 1091.7 (2) #5 @ 12 0.620 1091.7 0.0029 28 91.4 689.3 766.3 1091.7 (2) #5 @ 12 0.620 1091.7 0.0029 27 121.0 689.3 766.3 1091.7 (2) #5 @ 12 0.620 1091.7 0.0029 26 150.5 689.3 766.3 1091.7 (2) #5 @ 12 0.620 1091.7 0.0029 25 179.8 689.3 766.3 1091.7 (2) #5 @ 12 0.620 1091.7 0.0029 24 208.9 689.3 766.3 1091.7 (2) #5 @ 12 0.620 1091.7 0.0029 23 237.4 689.3 766.3 1091.7 (2) #5 @ 12 0.620 1091.7 0.0029 22 265.1 689.3 766.3 1091.7 (2) #5 @ 12 0.620 1091.7 0.0029 21 293.3 689.3 766.3 1091.7 (2) #5 @ 12 0.620 1091.7 0.0029 20 321.1 689.3 766.3 1091.7 (2) #5 @ 12 0.620 1091.7 0.0029 19 349.0 689.3 766.3 1091.7 (2) #5 @ 12 0.620 1091.7 0.0029 18 377.2 689.3 766.3 1091.7 (2) #5 @ 12 0.620 1091.7 0.0029 17 404.5 689.3 766.3 1091.7 (2) #5 @ 12 0.620 1091.7 0.0029 16 414.8 689.3 766.3 1091.7 (2) #5 @ 12 0.620 1091.7 0.0029 15 455.2 689.3 766.3 1091.7 (2) #5 @ 12 0.620 1091.7 0.0029 14 489.9 689.3 766.3 1091.7 (2) #5 @ 12 0.620 1091.7 0.0029 13 535.8 1061.3 1021.8 1562.3 (2) #5 @ 9 0.827 1562.3 0.0029 12 534.7 1061.3 1021.8 1562.3 (2) #5 @ 9 0.827 1562.3 0.0029 11 536.1 1061.3 1021.8 1562.3 (2) #5 @ 9 0.827 1562.3 0.0029 10 510.2 1061.3 1021.8 1562.3 (2) #5 @ 9 0.827 1562.3 0.0029 9 440.4 1061.3 1021.8 1562.3 (2) #5 @ 9 0.827 1562.3 0.0029 8 290.8 1061.3 1021.8 1562.3 (2) #5 @ 9 0.827 1562.3 0.0029 7 649.2 886.1 853.1 1304.4 (2) #5 @ 9 0.827 1304.4 0.0029 6 524.0 886.1 853.1 1304.4 (2) #5 @ 9 0.827 1304.4 0.0029 5 683.4 886.1 853.1 1304.4 (2) #5 @ 9 0.827 1304.4 0.0029 4 996.9 886.1 853.1 1304.4 (2) #5 @ 9 0.827 1304.4 0.0029 3 1807.1 886.1 853.1 1304.4 (2) #7 @ 9 1.600 1903.0 0.0056 2 1628.3 886.1 853.1 1304.4 (2) #7 @ 9 1.600 1903.0 0.0056
Table 22 – Final Transverse Reinforcement for SW1

Lindsay Lynch Advisor: Dr. Andres Lepage ‐ AE Senior Thesis 2008‐2009 ‐
Aquablue at the Golden MileHato Rey, Puerto Rico
‐ Structural Option ‐
R e v i s e d F i n a l R e p o r t – 2 2 A p r i l 2 0 0 9 | 38
Wind
Level
Longitudinal (vertical) Reinforcement
Minimum Required ρl
Modified Rebar and Spacing
As,l (in2/ft) ρl
sky lobby roof level
0.0029 (2) #5 @ 10 0.744 0.0034
roof level 0.0029 (2) #5 @ 10 0.744 0.0034 29 0.0029 (2) #5 @ 10 0.744 0.0034 28 0.0029 (2) #5 @ 10 0.744 0.0034 27 0.0029 (2) #5 @ 10 0.744 0.0034 26 0.0029 (2) #5 @ 10 0.744 0.0034 25 0.0029 (2) #5 @ 10 0.744 0.0034 24 0.0029 (2) #5 @ 10 0.744 0.0034 23 0.0029 (2) #5 @ 10 0.744 0.0034 22 0.0029 (2) #5 @ 10 0.744 0.0034 21 0.0029 (2) #5 @ 10 0.744 0.0034 20 0.0029 (2) #5 @ 10 0.744 0.0034 19 0.0029 (2) #5 @ 10 0.744 0.0034 18 0.0029 (2) #5 @ 10 0.744 0.0034 17 0.0029 (2) #5 @ 10 0.744 0.0034 16 0.0029 (2) #5 @ 10 0.744 0.0034 15 0.0029 (2) #5 @ 10 0.744 0.0034 14 0.0029 (2) #5 @ 10 0.744 0.0034 13 0.0029 (2) #5 @ 8 0.930 0.0032 12 0.0029 (2) #5 @ 8 0.930 0.0032 11 0.0029 (2) #5 @ 8 0.930 0.0032 10 0.0029 (2) #5 @ 8 0.930 0.0032 9 0.0029 (2) #5 @ 8 0.930 0.0032 8 0.0029 (2) #5 @ 8 0.930 0.0032 7 0.0029 (2) #5 @ 8 0.930 0.0032 6 0.0029 (2) #5 @ 8 0.930 0.0032 5 0.0029 (2) #5 @ 8 0.930 0.0032 4 0.0029 (2) #5 @ 8 0.930 0.0032 3 0.0057 (2) #7 @ 8 1.800 0.0063 2 0.0055 (2) #7 @ 8 1.800 0.0063
Table 23 – Final Longitudinal Reinforcement for SW1

Lindsay Lynch Advisor: Dr. Andres Lepage ‐ AE Senior Thesis 2008‐2009 ‐
Aquablue at the Golden MileHato Rey, Puerto Rico
‐ Structural Option ‐
R e v i s e d F i n a l R e p o r t – 2 2 A p r i l 2 0 0 9 | 39
The computer program pcaColumn was used to do a strength check of one of the I‐shaped shear walls at level 9, which is approximately at the base of the tower. The load cases for both the north‐south and east‐west directions were considered, and the wall section was analyzed biaxially. Based on the factored axial loads and bending moments, flexural reinforcement was required. Figure 11 below shows the final reinforcement layout for this level. The general wall reinforcement consists of #5 bars at either 8” or 12” spacing. For the boundary elements, which are indicated with teal boxes, #11 bars are used.
Figure 11 – Vertical Reinforcement Layout for Strength Check of Shear Wall

Lindsay Lynch Advisor: Dr. Andres Lepage ‐ AE Senior Thesis 2008‐2009 ‐
Aquablue at the Golden MileHato Rey, Puerto Rico
‐ Structural Option ‐
R e v i s e d F i n a l R e p o r t – 2 2 A p r i l 2 0 0 9 | 40
With the final reinforcement layout shown above in figure 11, the following moment interaction diagrams were determined through pcaColumn. The analysis was completed for the factored wind loads, which is the more critical loading condition. In each figure, the data points correspond to the axial forces and moments in the walls if both 100% of the wind load in one direction and 30% of the wind load in the other direction are applied simultaneously. In all cases, the reinforcement is adequate because the data points falls within the graph.
Figure 12 – Moment Interaction Diagram for Strength Check of Shear Wall (100% Wind in North‐South Direction, 30% Wind in East‐West Direction)
My (k -ft)
Mx (k -ft)
P = 1983 k ip
800000
-800000
800000-800000
12
3 4

Lindsay Lynch Advisor: Dr. Andres Lepage ‐ AE Senior Thesis 2008‐2009 ‐
Aquablue at the Golden MileHato Rey, Puerto Rico
‐ Structural Option ‐
R e v i s e d F i n a l R e p o r t – 2 2 A p r i l 2 0 0 9 | 41
Figure 13 – Moment Interaction Diagram for Strength Check of Shear Wall (100% Wind in East‐West Direction, 30% Wind in North‐South Direction)
My (k -ft)
Mx (k -ft)
P = 3898 k ip
800000
-800000
800000-800000567 8

Lindsay Lynch Advisor: Dr. Andres Lepage ‐ AE Senior Thesis 2008‐2009 ‐
Aquablue at the Golden MileHato Rey, Puerto Rico
‐ Structural Option ‐
R e v i s e d F i n a l R e p o r t – 2 2 A p r i l 2 0 0 9 | 42
Coupling Beam Reinforcement The coupling beams required both longitudinal and shear (stirrup) reinforcement. For the longitudinal reinforcement, there were two stipulations for the minimum amount of required steel (for both the top and the bottom of the beam).
, (ACI 318‐08, eqn. 10‐3)
(ACI 318‐08, section 21.5.2.1)
The maximum factored moment from ETABS was used to calculate the required area of steel. A derivation (assuming As = 0.0125bd and ρ = 1.25%) of the two fundamental equations, Mn = Asfy(d‐a/2) and a = Asfy/(0.85f’cb), leads to the following equations to be used for reinforcement design.
.
(for f’c = 6000 psi)
.
(for f’c = 8000 psi)
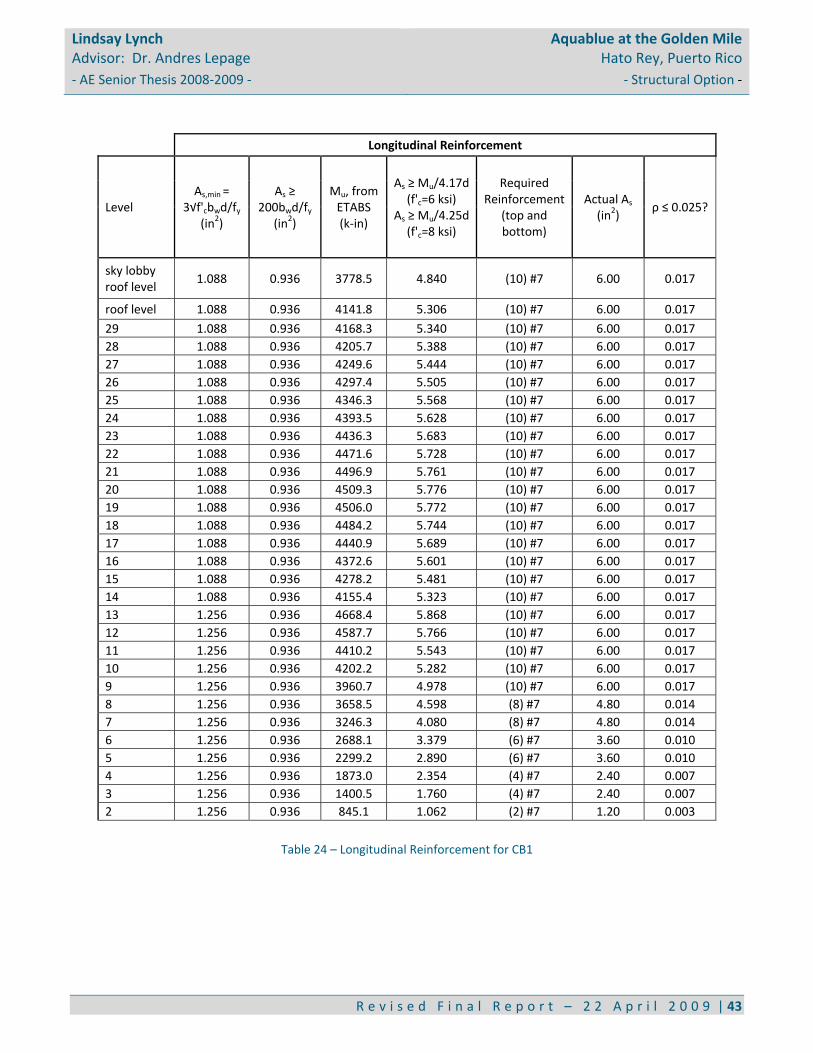
For most of the floors, anywhere from (6) – (10) #7 bars were sufficient for the top and bottom of the beam, which was allowable by code. According to ACI 318‐08, section 21.5.2.1, the limit for the reinforcement ratio is 0.025, and this value was not exceeded in this design. See tables 24 and 25 for the results for the longitudinal reinforcement for each coupling beam.
Lindsay Lynch Advisor: Dr. Andres Lepage ‐ AE Senior Thesis 2008‐2009 ‐
Aquablue at the Golden MileHato Rey, Puerto Rico
‐ Structural Option ‐
R e v i s e d F i n a l R e p o r t – 2 2 A p r i l 2 0 0 9 | 43
Longitudinal Reinforcement
Level As,min =
3√f'cbwd/fy (in2)
As ≥ 200bwd/fy
(in2)
Mu, from ETABS (k‐in)
As ≥ Mu/4.17d (f'c=6 ksi)
As ≥ Mu/4.25d (f'c=8 ksi)
Required Reinforcement
(top and bottom)
Actual As (in2)
ρ ≤ 0.025?
sky lobby roof level
1.088 0.936 3778.5 4.840 (10) #7 6.00 0.017
roof level 1.088 0.936 4141.8 5.306 (10) #7 6.00 0.017
29 1.088 0.936 4168.3 5.340 (10) #7 6.00 0.017 28 1.088 0.936 4205.7 5.388 (10) #7 6.00 0.017 27 1.088 0.936 4249.6 5.444 (10) #7 6.00 0.017 26 1.088 0.936 4297.4 5.505 (10) #7 6.00 0.017 25 1.088 0.936 4346.3 5.568 (10) #7 6.00 0.017 24 1.088 0.936 4393.5 5.628 (10) #7 6.00 0.017 23 1.088 0.936 4436.3 5.683 (10) #7 6.00 0.017 22 1.088 0.936 4471.6 5.728 (10) #7 6.00 0.017 21 1.088 0.936 4496.9 5.761 (10) #7 6.00 0.017 20 1.088 0.936 4509.3 5.776 (10) #7 6.00 0.017 19 1.088 0.936 4506.0 5.772 (10) #7 6.00 0.017 18 1.088 0.936 4484.2 5.744 (10) #7 6.00 0.017 17 1.088 0.936 4440.9 5.689 (10) #7 6.00 0.017 16 1.088 0.936 4372.6 5.601 (10) #7 6.00 0.017 15 1.088 0.936 4278.2 5.481 (10) #7 6.00 0.017 14 1.088 0.936 4155.4 5.323 (10) #7 6.00 0.017 13 1.256 0.936 4668.4 5.868 (10) #7 6.00 0.017 12 1.256 0.936 4587.7 5.766 (10) #7 6.00 0.017 11 1.256 0.936 4410.2 5.543 (10) #7 6.00 0.017 10 1.256 0.936 4202.2 5.282 (10) #7 6.00 0.017 9 1.256 0.936 3960.7 4.978 (10) #7 6.00 0.017 8 1.256 0.936 3658.5 4.598 (8) #7 4.80 0.014 7 1.256 0.936 3246.3 4.080 (8) #7 4.80 0.014 6 1.256 0.936 2688.1 3.379 (6) #7 3.60 0.010 5 1.256 0.936 2299.2 2.890 (6) #7 3.60 0.010 4 1.256 0.936 1873.0 2.354 (4) #7 2.40 0.007 3 1.256 0.936 1400.5 1.760 (4) #7 2.40 0.007 2 1.256 0.936 845.1 1.062 (2) #7 1.20 0.003
Table 24 – Longitudinal Reinforcement for CB1

Lindsay Lynch Advisor: Dr. Andres Lepage ‐ AE Senior Thesis 2008‐2009 ‐
Aquablue at the Golden MileHato Rey, Puerto Rico
‐ Structural Option ‐
R e v i s e d F i n a l R e p o r t – 2 2 A p r i l 2 0 0 9 | 44
Longitudinal Reinforcement
Level As,min =
3√f'cbwd/fy (in2)
As ≥ 200bwd/fy
(in2)
Mu, from ETABS (k‐in)
As ≥ Mu/4.17d (f'c=6 ksi)
As ≥ Mu/4.25d (f'c=8 ksi)
Required Reinforcement
(top and bottom)
Actual As (in2)
ρ ≤ 0.025?
roof level 1.088 0.936 2846.6 3.647 (8) #7 4.80 0.014
29 1.088 0.936 3119.3 3.996 (8) #7 4.80 0.014 28 1.088 0.936 3140.4 4.023 (8) #7 4.80 0.014 27 1.088 0.936 3167.2 4.057 (8) #7 4.80 0.014 26 1.088 0.936 3196.5 4.095 (8) #7 4.80 0.014 25 1.088 0.936 3226.1 4.133 (8) #7 4.80 0.014 24 1.088 0.936 3254.3 4.169 (8) #7 4.80 0.014 23 1.088 0.936 3278.9 4.200 (8) #7 4.80 0.014 22 1.088 0.936 3297.8 4.225 (8) #7 4.80 0.014 21 1.088 0.936 3309.1 4.239 (8) #7 4.80 0.014 20 1.088 0.936 3310.9 4.241 (8) #7 4.80 0.014 19 1.088 0.936 3300.9 4.229 (8) #7 4.80 0.014 18 1.088 0.936 3277.0 4.198 (8) #7 4.80 0.014 17 1.088 0.936 3236.2 4.146 (8) #7 4.80 0.014 16 1.088 0.936 3173.2 4.065 (8) #7 4.80 0.014 15 1.088 0.936 3091.8 3.961 (8) #7 4.80 0.014 14 1.088 0.936 2994.8 3.836 (8) #7 4.80 0.014 13 1.256 0.936 3309.2 4.159 (8) #7 4.80 0.014 12 1.256 0.936 3193.5 4.014 (8) #7 4.80 0.014 11 1.256 0.936 3039.5 3.820 (8) #7 4.80 0.014 10 1.256 0.936 2861.0 3.596 (6) #7 3.60 0.010 9 1.256 0.936 2651.9 3.333 (6) #7 3.60 0.010 8 1.256 0.936 2380.9 2.993 (6) #7 3.60 0.010 7 1.256 0.936 2251.1 2.829 (6) #7 3.60 0.010 6 1.256 0.936 2036.5 2.560 (6) #7 3.60 0.010 5 1.256 0.936 1770.4 2.225 (4) #7 2.40 0.007 4 1.256 0.936 1461.6 1.837 (4) #7 2.40 0.007 3 1.256 0.936 1105.7 1.390 (4) #7 2.40 0.007 2 1.256 0.936 669.0 0.841 (2) #7 1.20 0.003
Table 25 – Longitudinal Reinforcement for CB2

Lindsay Lynch Advisor: Dr. Andres Lepage ‐ AE Senior Thesis 2008‐2009 ‐
Aquablue at the Golden MileHato Rey, Puerto Rico
‐ Structural Option ‐
R e v i s e d F i n a l R e p o r t – 2 2 A p r i l 2 0 0 9 | 45
For the design of the stirrups, the strength of the concrete was neglected as a conservative assumption (based on ACI 318‐08, section 21.5.4.2). The maximum Vu due to both wind and seismic loads, as previously calculated for the feasibility test of the coupling beams, was divided by the applicable φ factor to determine the required shear strength of the steel. The following limitations applied to the value for Vs.
(ACI 318‐08, section 11.4.7.9)
The minimum area of the shear reinforcement was determined with section 11.4.6.3 of the concrete building code.
The resulting steel design was (3) – (4) legs of #3 stirrups in each beam. The maximum allowable spacing was calculated (using a more accurate d = 16”), but the actual spacing was limited to 4” by section 21.5.3.2. A summary of the coupling beam reinforcement calculations can be found in the tables on the following pages. The sketches below show the transverse reinforcement for a typical coupling beam. Figure 14 shows the spacing of the reinforcement across the length of the beam, and figure 15 gives a view of a typical beam cross‐section. The two hoops overlap in the beam, and they have 3” extensions where the ends of the bars extend into the interior concrete.
Figure 14 – Stirrup Spacing for a Coupling Beam Figure 15 – Typical beam cross‐section

Lindsay Lynch Advisor: Dr. Andres Lepage ‐ AE Senior Thesis 2008‐2009 ‐
Aquablue at the Golden MileHato Rey, Puerto Rico
‐ Structural Option ‐
R e v i s e d F i n a l R e p o r t – 2 2 A p r i l 2 0 0 9 | 46
Table 26 – Stirrup Reinforcement for CB1
0.75√f'cbws/fy 50bws/fy
sky lobby roof level
54.80 73.1 46.97 78.28 271.9 174.0 0.070 0.060 0.330 4.047 4.0 79.2
55.81 74.4 46.51 77.52 271.9 174.0 0.070 0.060 0.330 4.087 4.0 79.2
59.13 78.8 50.07 83.45 271.9 174.0 0.070 0.060 0.440 5.062 4.0 105.6
59.48 79.3 50.31 83.85 271.9 174.0 0.070 0.060 0.440 5.038 4.0 105.6
59.89 79.8 50.58 84.30 271.9 174.0 0.070 0.060 0.440 5.011 4.0 105.6
60.33 80.4 50.84 84.73 271.9 174.0 0.070 0.060 0.440 4.985 4.0 105.6
60.78 81.0 51.08 85.13 271.9 174.0 0.070 0.060 0.440 4.962 4.0 105.6
61.22 81.6 51.28 85.47 271.9 174.0 0.070 0.060 0.440 4.942 4.0 105.6
61.61 82.2 51.42 85.70 271.9 174.0 0.070 0.060 0.440 4.929 4.0 105.6
61.94 82.6 51.47 85.78 271.9 174.0 0.070 0.060 0.440 4.924 4.0 105.6
62.18 82.9 51.43 85.72 271.9 174.0 0.070 0.060 0.440 4.928 4.0 105.6
62.29 83.1 51.28 85.47 271.9 174.0 0.070 0.060 0.440 4.942 4.0 105.6
62.26 83.0 51.00 85.00 271.9 174.0 0.070 0.060 0.440 4.969 4.0 105.6
62.06 82.7 50.58 84.30 271.9 174.0 0.070 0.060 0.440 5.011 4.0 105.6
61.66 82.2 50.00 83.33 271.9 174.0 0.070 0.060 0.440 5.069 4.0 105.6
61.02 81.4 49.26 82.10 271.9 174.0 0.070 0.060 0.440 5.145 4.0 105.6
60.15 80.2 48.34 80.57 271.9 174.0 0.070 0.060 0.440 5.243 4.0 105.6
59.01 78.7 47.25 78.75 271.9 174.0 0.070 0.060 0.440 5.364 4.0 105.6
63.76 85.0 49.95 83.25 313.9 200.9 0.080 0.060 0.440 4.968 4.0 105.6
63.02 84.0 49.19 81.98 313.9 200.9 0.080 0.060 0.440 5.027 4.0 105.6
61.37 81.8 47.85 79.75 313.9 200.9 0.080 0.060 0.440 5.162 4.0 105.6
59.45 79.3 46.35 77.25 313.9 200.9 0.080 0.060 0.440 5.329 4.0 105.6
57.21 76.3 44.67 74.45 313.9 200.9 0.080 0.060 0.330 4.153 4.0 79.2
54.41 72.6 42.67 71.12 313.9 200.9 0.080 0.060 0.330 4.367 4.0 79.2
53.35 71.1 43.05 71.75 313.9 200.9 0.080 0.060 0.330 4.415 4.0 79.2
45.97 61.3 37.22 62.03 313.9 200.9 0.080 0.060 0.330 5.107 4.0 79.2
42.38 56.5 34.96 58.27 313.9 200.9 0.080 0.060 0.330 5.437 4.0 79.2
38.43 51.2 32.56 54.27 313.9 200.9 0.080 0.060 0.330 5.838 4.0 79.2
34.05 45.4 29.98 49.97 313.9 200.9 0.080 0.060 0.330 6.340 4.0 79.2
2 29.24 39.0 27.39 45.65 313.9 200.9 0.080 0.060 0.330 6.940 4.0 79.2
Level
7
18
17
16
15
14
13
12
11
10
9
8
6
5
4
3
19
roof level
29
28
27
26
25
24
23
22
21
20
Seismic
Max Vu
(k)
Vs,required ≥ Vu/φ (k)
Vs ≤ 10Acw√f'c
(k)
Shear Reinforcement (stirrups)
Vs,actual = Avfyd/s (k)
Wind
Max Vu
(k)
Vs,required ≥ Vu/φ (k)
smax = Avfyd/Vs
(in)
sactual (in)
Vs ≤ 8√f'cbwd
(k)
Av,min (in2) Preliminary Av
(#3 bars, 0.11
in2 per leg)

Lindsay Lynch Advisor: Dr. Andres Lepage ‐ AE Senior Thesis 2008‐2009 ‐
Aquablue at the Golden MileHato Rey, Puerto Rico
‐ Structural Option ‐
R e v i s e d F i n a l R e p o r t – 2 2 A p r i l 2 0 0 9 | 47
Table 27 – Stirrup Reinforcement for CB2
0.75√f'cbws/fy 50bws/fy
39.96 53.3 24.05 40.08 271.9 174.0 0.070 0.060 0.330 5.946 4.0 79.2
44.88 59.8 27.59 45.98 271.9 174.0 0.070 0.060 0.330 5.294 4.0 79.2
45.08 60.1 27.68 46.13 271.9 174.0 0.070 0.060 0.330 5.271 4.0 79.2
45.33 60.4 27.79 46.32 271.9 174.0 0.070 0.060 0.330 5.242 4.0 79.2
45.60 60.8 27.92 46.53 271.9 174.0 0.070 0.060 0.330 5.211 4.0 79.2
45.87 61.2 28.06 46.77 271.9 174.0 0.070 0.060 0.330 5.179 4.0 79.2
46.13 61.5 28.19 46.98 271.9 174.0 0.070 0.060 0.330 5.150 4.0 79.2
46.36 61.8 28.33 47.22 271.9 174.0 0.070 0.060 0.330 5.125 4.0 79.2
46.54 62.0 28.45 47.42 271.9 174.0 0.070 0.060 0.330 5.106 4.0 79.2
46.64 62.2 28.56 47.60 271.9 174.0 0.070 0.060 0.330 5.094 4.0 79.2
46.66 62.2 28.64 47.73 271.9 174.0 0.070 0.060 0.330 5.092 4.0 79.2
46.57 62.1 28.70 47.83 271.9 174.0 0.070 0.060 0.330 5.102 4.0 79.2
46.34 61.8 28.74 47.90 271.9 174.0 0.070 0.060 0.330 5.127 4.0 79.2
45.97 61.3 28.73 47.88 271.9 174.0 0.070 0.060 0.330 5.169 4.0 79.2
45.38 60.5 28.70 47.83 271.9 174.0 0.070 0.060 0.330 5.235 4.0 79.2
44.63 59.5 28.62 47.70 271.9 174.0 0.070 0.060 0.330 5.324 4.0 79.2
43.73 58.3 28.48 47.47 271.9 174.0 0.070 0.060 0.330 5.433 4.0 79.2
46.64 62.2 29.98 49.97 313.9 200.9 0.080 0.060 0.330 5.094 4.0 79.2
45.57 60.8 29.89 49.82 313.9 200.9 0.080 0.060 0.330 5.214 4.0 79.2
44.15 58.9 29.73 49.55 313.9 200.9 0.080 0.060 0.330 5.382 4.0 79.2
42.49 56.7 29.54 49.23 313.9 200.9 0.080 0.060 0.330 5.592 4.0 79.2
40.56 54.1 29.31 48.85 313.9 200.9 0.080 0.060 0.330 5.858 4.0 79.2
38.05 50.7 28.96 48.27 313.9 200.9 0.080 0.060 0.330 6.245 4.0 79.2
50.13 66.8 43.03 71.72 313.9 200.9 0.080 0.060 0.330 4.417 4.0 79.2
45.38 60.5 38.91 64.85 313.9 200.9 0.080 0.060 0.330 4.885 4.0 79.2
42.91 57.2 37.47 62.45 313.9 200.9 0.080 0.060 0.330 5.073 4.0 79.2
40.06 53.4 35.84 59.73 313.9 200.9 0.080 0.060 0.330 5.304 4.0 79.2
36.76 49.0 34.01 56.68 313.9 200.9 0.080 0.060 0.330 5.589 4.0 79.2
33.10 44.1 32.27 53.78 313.9 200.9 0.080 0.060 0.330 5.890 4.0 79.2
Level
2
7
18
17
16
15
14
13
12
11
10
9
8
6
5
4
3
19
roof level
29
28
27
26
25
24
23
22
21
20
Seismic
Max Vu
(k)
Vs,required ≥ Vu/φ (k)
Vs ≤ 10Acw√f'c
(k)
Shear Reinforcement (stirrups)
Vs,actual = Avfyd/s (k)
Wind
Max Vu
(k)
Vs,required ≥ Vu/φ (k)
smax = Avfyd/Vs
(in)
sactual (in)
Vs ≤ 8√f'cbwd
(k)
Av,min (in2) Preliminary Av
(#3 bars, 0.11
in2 per leg)

Lindsay Lynch Advisor: Dr. Andres Lepage ‐ AE Senior Thesis 2008‐2009 ‐
Aquablue at the Golden MileHato Rey, Puerto Rico
‐ Structural Option ‐
R e v i s e d F i n a l R e p o r t – 2 2 A p r i l 2 0 0 9 | 48
Impact on Existing Foundation The existing foundation consists of drilled piles, and the loads are transferred from the superstructure to the foundation via pile caps or a mat slab. Most columns are supported by a pile cap, but a mat slab is used where there are numerous columns and shear walls close together. For the existing design, there are both drilled tension piles and drilled compression piles, with the following capacities.
Tension pile (generally 18”φ x 80’‐0”) o Compression capacity = 200 tons o Lateral capacity = 20 tons o Tension capacity = 40 tons
Compression pile (generally 18”φ x 80’‐0”) o Compression capacity = 200 tons o Lateral capacity = 20 tons
For the mat slab supporting the area below the new shear wall design, there were 23 tension piles and 147 compression piles in the original design. For this analysis, the impact on the existing foundation was analyzed for lateral forces and overturning moments, because the focus of this structural analysis was on the lateral force resisting system of the building. Using output from ETABS, the maximum shear forces and overturning moments (based on the defined load combinations) were found at the base of the building. In table 28 below, the base shear in the two I‐shaped shear walls was found in each direction for all of the load cases. Then, the forces were summed for each load case to find the base shear being transferred in the mat slab in each direction. Lastly, the maximum shear force was converted to tons and number of required piles. Because both the compression and tension piles have lateral capacity, the original design utilizes up to 170 piles to resist the base shear, which exceeds the number of required piles based on this new shear wall design.
North‐South Direction East‐West Direction
Shear Force (k) in I‐Shape
Shear Wall Total Shear (k)
Shear Force (k) in I‐Shape Shear Wall Total
Shear (k) Web = SW5 Web = SW6 Web = SW5 Web = SW6
Wind Case 1a 0.4 0.4 0.8 1800.3 161.5 1961.8 Wind Case 1b 1492.9 1458.7 2951.6 155.7 148.3 304.0 Wind Case 2a 80.1 71.9 151.9 1356.6 115.9 1472.4 Wind Case 2b 827.0 1356.2 2183.1 93.3 90.6 183.9 Wind Case 3 1121.8 1092.4 2214.2 1233.6 232.5 1466.1 Wind Case 4 560.0 1070.9 1630.9 947.2 154.9 1102.0 Seismic ‐ NS 3.5 6.2 9.7 860.3 71.8 932.1 Seismic ‐ EW 251.8 288.9 540.7 38.9 37.0 75.9
Total Shear (tons) = 1475.8 Total Shear (tons) = 980.9 Required Piles = 73.8 Required Piles = 49.0
Table 28 – Number of Required Piles Based on Lateral Capacity

Lindsay Lynch Advisor: Dr. Andres Lepage ‐ AE Senior Thesis 2008‐2009 ‐
Aquablue at the Golden MileHato Rey, Puerto Rico
‐ Structural Option ‐
R e v i s e d F i n a l R e p o r t – 2 2 A p r i l 2 0 0 9 | 49
Similarly, an analysis was done for the overturning moment at the base of the building. The existing design has tension piles oriented to resist moments in the north‐south direction, so ETABS output was used to find the N‐S overturning moment in each I‐shaped pier for the various load combinations. The base moment was then divided by the maximum length of the flange of the shear wall (25.75’) in order to find the tension force at the extreme fiber of the wall. This tension force was then converted to tons and the corresponding number of piles. It can be seen below in table 29 that the required number of piles based on this analysis is much larger than the original design (23 tension piles).
Web = SW5 Web = SW6 Total Tension Force (tons)
Number of Required Piles
Base Moment (k‐ft)
Tension Force (k)
Tension Force (tons)
Moment (k‐ft)
Tension Force (k)
Tension Force (tons)
Wind Case 1a 98949.1 3842.7 1921.3 83688.2 3250.0 1625.0 3546.4 88.7 Wind Case 1b 15767.9 612.3 306.2 17581.5 682.8 341.4 647.6 16.2 Wind Case 2a 74334.1 2886.8 1443.4 62585.1 2430.5 1215.2 2658.6 66.5 Wind Case 2b 11419.4 443.5 221.7 12427.9 482.6 241.3 463.1 11.6 Wind Case 3 62400.2 2423.3 1211.7 75966.0 2950.1 1475.1 2686.7 67.2 Wind Case 4 47171.5 1831.9 916.0 56244.5 2184.3 1092.1 2008.1 50.2 Seismic ‐ NS 52404.2 2035.1 1017.6 44329.3 1721.5 860.8 1878.3 47.0 Seismic ‐ EW 4200.3 163.1 81.6 4680.7 181.8 90.9 172.4 4.3
Table 29 – Number of Required Piles Based on Tension Capacity
The reason for the large amount of tension piles is because the ETABS model was only used for lateral loads, so there is no inclusion of gravity loads to resist the building uplift. Therefore, to account for gravity loads, the approximate dead loads for each floor (as found for the calculation of seismic base shear) were multiplied by the area of the mat slab (100’ x 60’). The dead loads were summed (2600 k = 1300 tons), and converted to the number of piles corresponding to a 40 ton capacity. It was found that the loads resisting uplift, due to the weight of the building, accounted for about 33 piles. As a result, the number of tension piles required due to wind load case 1a is reduced from 89 to 56. This number could possibly be reduced even more with a more detailed analysis. These foundation calculations were a preliminary and quick way to check the impact of the new shear wall design on the existing foundation. Based on the analysis, the base shear forces of the new shear walls would not affect the foundation. In fact, fewer piles are required to resist the base shear. As for the overturning moments, the new shear wall design requires about 2.5 times the number of existing tension piles. However, about 33 of the existing compression piles could be converted to tension piles to account for this difference in overturning moments. Because the tension piles have the same compressive strengths as the compression piles, this conversion would not alter the gravity system. However, it is likely that this would increase the foundation cost.

Lindsay Lynch Advisor: Dr. Andres Lepage ‐ AE Senior Thesis 2008‐2009 ‐
Aquablue at the Golden MileHato Rey, Puerto Rico
‐ Structural Option ‐
R e v i s e d F i n a l R e p o r t – 2 2 A p r i l 2 0 0 9 | 50
Architectural Breadth Study In order for the new shear wall layout (fig. 16) to be feasible, a few architectural changes had to be made. For the new design, SW1, SW2, SW5, and SW6 were on the same column lines as before, but SW3 and SW4 shifted to the façade of the building. For a comparison to the existing design, figure 17 shows the original shear wall locations, which are highlighted in teal. For SW3 and SW4 of the new design, which are located at the building edge, the walls are shorter than SW1 and SW2 to allow for more window area. However, the new location SW3 SW4 still eliminated one set of windows on the façade. The change was deemed as acceptable because the Figure 16 – Sketch of New Shear Wall Design windows were primarily chosen for exterior aesthetics. They extended the length of the tower, but they were located in an electrical room and a janitor room near the elevator core. Therefore, they were not necessary to the apartment tenants for views from the interior. The renderings on the next page (fig. 18) give an exterior view of the building. The image on the left is the original design, and the image on the right shows the new façade without the windows at the elevator core. Based on the small size of the windows, this architectural re‐design is reasonable for such a large building. For aesthetic purposes, the intent of the architect is not altered drastically with the window elimination. Figure 17 – Original Shear Wall Locations
SW6
SW5
SW1 SW2
Windows to be removed

Lindsay Lynch Advisor: Dr. Andres Lepage ‐ AE Senior Thesis 2008‐2009 ‐
Aquablue at the Golden MileHato Rey, Puerto Rico
‐ Structural Option ‐
R e v i s e d F i n a l R e p o r t – 2 2 A p r i l 2 0 0 9 | 51
Figure 18 – Exterior Renderings of Original Building (left) and New Façade (right)

Lindsay Lynch Advisor: Dr. Andres Lepage ‐ AE Senior Thesis 2008‐2009 ‐
Aquablue at the Golden MileHato Rey, Puerto Rico
‐ Structural Option ‐
R e v i s e d F i n a l R e p o r t – 2 2 A p r i l 2 0 0 9 | 52
Lastly, as a comparison between the original and the new shear wall design, a study was done for the areas of the walls in plan view. At each level, the total area of the shear walls in square inches was calculated. Then, these values were converted to percentages based on the square footages of each level. The results are summarized in table 30 below. The new design reduced the area of shear walls for about 2/3 of the levels, and the floor area gained can be found in the far right column. This reduction in shear wall area allows for more floor space that can be occupied by tenants or utilized for other building functions (e.g. – mechanical or electrical rooms). If the additional floor area would be used for apartment spaces, the building owner could possibly benefit from an increase in rental rates for the tenants.
Original Shear Wall Design New Shear Wall Design Floor Area Gained in New Design (ft2) Level
Total Floor Area (ft2)
Plan Area of Walls (in2)
Percentage of Floor Area (%)
Plan Area of Walls (in2)
Percentage of Floor Area (%)
sky lobby roof level
4740 30528 4.47 31104 4.56 ‐4.0
roof level 13490 34020 1.75 31104 1.60 20.3 29 13490 34020 1.75 31104 1.60 20.3 28 13490 34020 1.75 31104 1.60 20.3 27 11060 34020 2.14 31104 1.95 20.3 26 11060 34020 2.14 31104 1.95 20.3 25 11060 34020 2.14 31104 1.95 20.3 24 11060 34020 2.14 31104 1.95 20.3 23 11060 34020 2.14 31104 1.95 20.3 22 11060 34020 2.14 31104 1.95 20.3 21 11060 34020 2.14 31104 1.95 20.3 20 11060 34020 2.14 31104 1.95 20.3 19 11060 34020 2.14 31104 1.95 20.3 18 11060 34020 2.14 31104 1.95 20.3 17 11060 34020 2.14 31104 1.95 20.3 16 11060 34020 2.14 35460 2.23 ‐10.0 15 11060 34020 2.14 35460 2.23 ‐10.0 14 11060 34020 2.14 35460 2.23 ‐10.0 13 11060 34020 2.14 39024 2.45 ‐34.8 12 11060 34020 2.14 39024 2.45 ‐34.8 11 11060 34020 2.14 39024 2.45 ‐34.8 10 11060 34020 2.14 39024 2.45 ‐34.8 9 11060 34020 2.14 39024 2.45 ‐34.8 8 11060 34020 2.14 39024 2.45 ‐34.8 7 23440 63594 1.88 58032 1.72 38.6 6 23440 63594 1.88 58032 1.72 38.6 5 23440 63594 1.88 58032 1.72 38.6 4 23440 63594 1.88 58032 1.72 38.6 3 23440 63594 1.88 58032 1.72 38.6 2 23440 70110 2.08 58032 1.72 83.9
Table 30 – Comparison of Shear Wall Areas for Original and New Design

Lindsay Lynch Advisor: Dr. Andres Lepage ‐ AE Senior Thesis 2008‐2009 ‐
Aquablue at the Golden MileHato Rey, Puerto Rico
‐ Structural Option ‐
R e v i s e d F i n a l R e p o r t – 2 2 A p r i l 2 0 0 9 | 53
Construction Management Breadth Study The main goal of the construction management breadth study was to compare the construction costs for the original and new shear wall designs. Because the gravity system remained the same, the focus was the lateral force resisting system. The source for the cost estimates was the 2009 edition of RS Means ‘Building Construction Cost Data’. The primary expense category was the cast‐in‐place concrete, which included forms, reinforcing steel, concrete, placing and finishing. Due to the limitations of the book, some costs had to be extrapolated from the given data. The cost breakdown is shown below in tables 31 and 32.
Cost Breakdown for Cast‐In‐Place Concrete – Original Design
Level Volume of Reinforced
Concrete (C.Y.)
Material Labor Equipment Total Total Including
O&P
$157.00/C.Y. $75.00/C.Y. $7.20/C.Y. $239.20/C.Y. $290.00/C.Y.
sky lobby roof level
88.3 13868.33 6625.00 636.00 21129.33 25616.67
roof level 78.8 12363.75 5906.25 567.00 18837.00 22837.50 29 78.8 12363.75 5906.25 567.00 18837.00 22837.50 28 78.8 12363.75 5906.25 567.00 18837.00 22837.50 27 78.8 12363.75 5906.25 567.00 18837.00 22837.50 26 78.8 12363.75 5906.25 567.00 18837.00 22837.50 25 78.8 12363.75 5906.25 567.00 18837.00 22837.50 24 78.8 12363.75 5906.25 567.00 18837.00 22837.50 23 78.8 12363.75 5906.25 567.00 18837.00 22837.50 22 78.8 12363.75 5906.25 567.00 18837.00 22837.50 21 78.8 12363.75 5906.25 567.00 18837.00 22837.50 20 78.8 12363.75 5906.25 567.00 18837.00 22837.50 19 78.8 12363.75 5906.25 567.00 18837.00 22837.50 18 78.8 12363.75 5906.25 567.00 18837.00 22837.50 17 78.8 12363.75 5906.25 567.00 18837.00 22837.50 16 78.8 12363.75 5906.25 567.00 18837.00 22837.50 15 78.8 12363.75 5906.25 567.00 18837.00 22837.50 14 78.8 12363.75 5906.25 567.00 18837.00 22837.50 13 78.8 12363.75 5906.25 567.00 18837.00 22837.50 12 78.8 12363.75 5906.25 567.00 18837.00 22837.50 11 78.8 12363.75 5906.25 567.00 18837.00 22837.50 10 78.8 12363.75 5906.25 567.00 18837.00 22837.50 9 78.8 12363.75 5906.25 567.00 18837.00 22837.50 8 87.5 13737.50 6562.50 630.00 20930.00 25375.00 7 204.5 32099.59 15334.20 1472.08 48905.88 59292.25 6 136.3 21398.87 10222.39 981.35 32602.62 39526.58 5 136.3 21398.87 10222.39 981.35 32602.62 39526.58 4 136.3 21398.87 10222.39 981.35 32602.62 39526.58 3 136.3 21398.87 10222.39 981.35 32602.62 39526.58 2 195.3 30669.18 14650.88 1406.48 46726.54 56650.07
Estimated Cost of Shear Walls ($) = 827465.31
Table 31 – Shear Wall Cost Estimate for Original Design

Lindsay Lynch Advisor: Dr. Andres Lepage ‐ AE Senior Thesis 2008‐2009 ‐
Aquablue at the Golden MileHato Rey, Puerto Rico
‐ Structural Option ‐
R e v i s e d F i n a l R e p o r t – 2 2 A p r i l 2 0 0 9 | 54
Cost Breakdown for Cast‐In‐Place Concrete ‐ New Design
Level Volume of Reinforced
Concrete (C.Y.)
Material Labor Equipment Total Total
Including O&P
$157.00/C.Y. $75.00/C.Y. $7.20/C.Y. $239.20/C.Y. $290.00/C.Y.
sky lobby roof level
90.0 14130.00 6750.00 648.00 21528.00 26100.00
roof level 72.0 11304.00 5400.00 518.40 17222.40 20880.00 29 72.0 11304.00 5400.00 518.40 17222.40 20880.00 28 72.0 11304.00 5400.00 518.40 17222.40 20880.00 27 72.0 11304.00 5400.00 518.40 17222.40 20880.00 26 72.0 11304.00 5400.00 518.40 17222.40 20880.00 25 72.0 11304.00 5400.00 518.40 17222.40 20880.00 24 72.0 11304.00 5400.00 518.40 17222.40 20880.00 23 72.0 11304.00 5400.00 518.40 17222.40 20880.00 22 72.0 11304.00 5400.00 518.40 17222.40 20880.00 21 72.0 11304.00 5400.00 518.40 17222.40 20880.00 20 72.0 11304.00 5400.00 518.40 17222.40 20880.00 19 72.0 11304.00 5400.00 518.40 17222.40 20880.00 18 72.0 11304.00 5400.00 518.40 17222.40 20880.00 17 72.0 11304.00 5400.00 518.40 17222.40 20880.00 16 82.1 12887.08 6156.25 591.00 19634.33 23804.17 15 82.1 12887.08 6156.25 591.00 19634.33 23804.17 14 82.1 12887.08 6156.25 591.00 19634.33 23804.17 13 90.3 14182.33 6775.00 650.40 21607.73 26196.67 12 90.3 14182.33 6775.00 650.40 21607.73 26196.67 11 90.3 14182.33 6775.00 650.40 21607.73 26196.67 10 90.3 14182.33 6775.00 650.40 21607.73 26196.67 9 90.3 14182.33 6775.00 650.40 21607.73 26196.67 8 100.4 15758.15 7527.78 722.67 24008.59 29107.41 7 186.6 29292.13 13993.06 1343.33 44628.52 54106.48 6 124.4 19527.31 9328.33 895.52 29751.16 36069.54 5 124.4 19527.31 9328.33 895.52 29751.16 36069.54 4 124.4 19527.31 9328.33 895.52 29751.16 36069.54 3 124.4 19527.31 9328.33 895.52 29751.16 36069.54 2 161.7 25385.73 12126.94 1164.19 38676.86 46890.84
Estimated Cost of Shear Walls ($) = 795198.74
Based on the cost analysis, the estimated cost of the shear walls decreased for the new design. The difference in cost was about $32,300, which was a 4% difference. As for the construction schedule, no information was available as a resource for the project. However, it is probable that the new shear wall design would help to tighten the schedule, especially if the shear wall erection is on the critical path. The simpler wall layout means that less formwork is necessary for the wall construction. If the shear walls are one of the critical erection tasks, then it is possible that a few days would be saved for each floor. On the other hand, if the shear walls are not on the critical path, then at the very least, the new design should not lengthen the schedule.
Table 32 – Shear Wall Cost Estimate for New Design

Lindsay Lynch Advisor: Dr. Andres Lepage ‐ AE Senior Thesis 2008‐2009 ‐
Aquablue at the Golden MileHato Rey, Puerto Rico
‐ Structural Option ‐
R e v i s e d F i n a l R e p o r t – 2 2 A p r i l 2 0 0 9 | 55
Conclusions and Acknowledgements After studying Aquablue at the Golden Mile for this senior thesis project, it can be determined that the initial goals were met. A detailed lateral analysis was conducted, and some valuable design experience was gained. The concrete building code, ACI 318‐08, became a much more familiar resource, and ETABS became a valuable design tool. In looking back over the course of the academic year, the project goals were accomplished. Based on this analysis, the shear wall re‐design for Aquablue at the Golden Mile was a success. The new design was feasible, and the new shear walls did not drastically alter the architecture. Even some usable floor area was gained. Also, the preliminary cost analysis showed a savings for the construction of the shear walls. In summary, this design could be an appropriate alternative to the existing lateral force resisting system. If given more time for further study, a dynamic analysis of the structure would prove to be valuable. In fact, it was recently discovered (due to other Spring 2009 coursework) that the building has a classification of vertical irregularity type 2 due to the significant change in floor weight at the transition between the parking garage and the apartment towers (ASCE 7‐05). Therefore, the equivalent lateral force procedure was not permitted for this building. Instead, a modal response spectrum analysis was required. This more detailed design approach could be the next step in studying Aquablue at the Golden Mile. ACKNOWLEDGEMENTS: The following people need to be recognized for their assistance in the completion of this senior thesis project. Collectively, they provided technical expertise, general engineering consulting, patience and support throughout the year.
Dr. Andres Lepage (structural advisor) Professor Kevin Parfitt (general thesis advisor) Professor Robert Holland (general thesis advisor) Anh Trong Nguyen (project engineer) Architectural Engineering Peers Family and Friends

Lindsay Lynch Advisor: Dr. Andres Lepage ‐ AE Senior Thesis 2008‐2009 ‐
Aquablue at the Golden MileHato Rey, Puerto Rico
‐ Structural Option ‐
R e v i s e d F i n a l R e p o r t – 2 2 A p r i l 2 0 0 9 | 56
Appendix – Shear Wall Reinforcement The following tables summarize the shear wall reinforcement for SW2 through SW6. A description of the design process, as well as the SW1 reinforcement, can be found in the ‘Shear Wall Reinforcement’ section of the report.
Minim
um
Requ
ired ρ t
Req
uired As,t
(in2 /ft)
Actual A
s,t
(in2 /ft)
Actual ρ
t M
inim
um
Requ
ired
ρl
Req
uired As,l
(in2 /ft)
Actual A
s,l
(in2 /ft)
Actual ρ
l
sky lobb
y roof
level
13.1
430.8
0.0020
0.432
(2) #5 @
120.62
0.00
290.0012
0.259
(2) #5 @
180.41
30.00
191091
.7
roof level
27.0
430.8
0.0020
0.432
(2) #5 @
120.62
0.00
290.0012
0.259
(2) #5 @
180.41
30.00
191091
.7
2961
.243
0.8
0.0020
0.432
(2) #5 @
120.62
0.00
290.0012
0.259
(2) #5 @
180.41
30.00
191091
.7
2893
.043
0.8
0.0020
0.432
(2) #5 @
120.62
0.00
290.0012
0.259
(2) #5 @
180.41
30.00
191091
.7
2711
6.6
430.8
0.0020
0.432
(2) #5 @
120.62
0.00
290.0012
0.259
(2) #5 @
180.41
30.00
191091
.7
2613
8.7
430.8
0.0020
0.432
(2) #5 @
120.62
0.00
290.0012
0.259
(2) #5 @
180.41
30.00
191091
.7
2515
9.2
430.8
0.0020
0.432
(2) #5 @
120.62
0.00
290.0012
0.259
(2) #5 @
180.41
30.00
191091
.7
2417
8.3
430.8
0.0020
0.432
(2) #5 @
120.62
0.00
290.0012
0.259
(2) #5 @
180.41
30.00
191091
.7
2319
6.3
430.8
0.0020
0.432
(2) #5 @
120.62
0.00
290.0012
0.259
(2) #5 @
180.41
30.00
191091
.7
2221
3.0
430.8
0.0020
0.432
(2) #5 @
120.62
0.00
290.0012
0.259
(2) #5 @
180.41
30.00
191091
.7
2122
8.4
430.8
0.0020
0.432
(2) #5 @
120.62
0.00
290.0012
0.259
(2) #5 @
180.41
30.00
191091
.7
2024
2.6
430.8
0.0020
0.432
(2) #5 @
120.62
0.00
290.0012
0.259
(2) #5 @
180.41
30.00
191091
.7
1925
5.7
430.8
0.0020
0.432
(2) #5 @
120.62
0.00
290.0012
0.259
(2) #5 @
180.41
30.00
191091
.7
1826
8.5
430.8
0.0020
0.432
(2) #5 @
120.62
0.00
290.0012
0.259
(2) #5 @
180.41
30.00
191091
.7
1727
9.2
430.8
0.0020
0.432
(2) #5 @
120.62
0.00
290.0012
0.259
(2) #5 @
180.41
30.00
191091
.7
1627
4.5
430.8
0.0020
0.432
(2) #5 @
120.62
0.00
290.0012
0.259
(2) #5 @
180.41
30.00
191091
.7
1529
6.8
430.8
0.0020
0.432
(2) #5 @
120.62
0.00
290.0012
0.259
(2) #5 @
180.41
30.00
191091
.7
1431
5.7
430.8
0.0020
0.432
(2) #5 @
120.62
0.00
290.0012
0.259
(2) #5 @
180.41
30.00
191091
.7
1333
9.4
663.3
0.0020
0.576
(2) #5 @
120.62
0.00
220.0012
0.346
(2) #5 @
180.41
30.00
141370
.7
1233
8.1
663.3
0.0020
0.576
(2) #5 @
120.62
0.00
220.0012
0.346
(2) #5 @
180.41
30.00
141370
.7
1135
5.5
663.3
0.0020
0.576
(2) #5 @
120.62
0.00
220.0012
0.346
(2) #5 @
180.41
30.00
141370
.7
1039
2.7
663.3
0.0020
0.576
(2) #5 @
120.62
0.00
220.0012
0.346
(2) #5 @
180.41
30.00
141370
.7
948
4.7
663.3
0.0020
0.576
(2) #
5 @
120.62
0.00
220.0012
0.346
(2) #5 @
180.41
30.00
141370
.7
873
0.8
663.3
0.0025
0.720
(2) #
5 @
90.83
0.00
290.0025
0.720
(2) #5 @
90.82
70.00
291562
.3
716
3.9
663.3
0.0020
0.576
(2) #
5 @
120.62
0.00
220.0012
0.346
(2) #5 @
180.41
30.00
141370
.7
632
2.3
663.3
0.0020
0.576
(2) #
5 @
120.62
0.00
220.0012
0.346
(2) #5 @
180.41
30.00
141370
.7
526
1.5
663.3
0.0020
0.576
(2) #
5 @
120.62
0.00
220.0012
0.346
(2) #5 @
180.41
30.00
141370
.7
411
1.0
663.3
0.0020
0.576
(2) #
5 @
120.62
0.00
220.0012
0.346
(2) #5 @
180.41
30.00
141370
.7
361
9.9
663.3
0.0020
0.576
(2) #
5 @
120.62
0.00
220.0012
0.346
(2) #5 @
180.41
30.00
141370
.7
216
2.9
553.8
0.0020
0.576
(2) #
5 @
120.62
0.00
220.0012
0.346
(2) #5 @
180.41
30.00
141144
.5
Prelim
inary Re
bar
and Spacing
Prelim
inary Re
bar
and Spacing
Longitu
dinal (vertical) R
einforcemen
tShear C
apacity
(k), φVn
=
φAcv(α
cλ√f' c +
ρ tf y)
SEISMIC
Level
Seismic She
ar
Force (from
ETABS), V u (k)
Acvλ√f' c
(k)
Transverse (h
orizon
tal) Re
inforcem
ent
Table A1 – Prelim
inary Re
inforcem
ent for SW2

Lindsay Lynch Advisor: Dr. Andres Lepage ‐ AE Senior Thesis 2008‐2009 ‐
Aquablue at the Golden MileHato Rey, Puerto Rico
‐ Structural Option ‐
R e v i s e d F i n a l R e p o r t – 2 2 A p r i l 2 0 0 9 | 57
V s =
As,tf yd/s (k)
φV n =
φ(V
c+V s) (k)
As,t (in
2 /ft)
NEW
φV n =
φ(V
c+V s) (k)
ρ t
Minim
um
Requ
ired
ρl
As,l (in
2 /ft)
ρ l
sky lobb
y roof
level
21.8
689.3
766.3
1091.7
(2) #
5 @
120.620
1091
.70.00
290.00
29(2) #
5 @
100.744
0.00
34
roof level
37.8
689.3
766.3
1091.7
(2) #
5 @
120.620
1091
.70.00
290.00
29(2) #
5 @
100.744
0.00
3429
60.2
689.3
766.3
1091.7
(2) #
5 @
120.620
1091
.70.00
290.00
29(2) #
5 @
100.744
0.00
3428
91.4
689.3
766.3
1091.7
(2) #
5 @
120.620
1091
.70.00
290.00
29(2) #
5 @
100.744
0.00
3427
121.0
689.3
766.3
1091.7
(2) #
5 @
120.620
1091
.70.00
290.00
29(2) #
5 @
100.744
0.00
3426
150.5
689.3
766.3
1091.7
(2) #
5 @
120.620
1091
.70.00
290.00
29(2) #
5 @
100.744
0.00
3425
179.8
689.3
766.3
1091.7
(2) #
5 @
120.620
1091
.70.00
290.00
29(2) #
5 @
100.744
0.00
3424
208.9
689.3
766.3
1091.7
(2) #
5 @
120.620
1091
.70.00
290.00
29(2) #
5 @
100.744
0.00
3423
237.4
689.3
766.3
1091.7
(2) #
5 @
120.620
1091
.70.00
290.00
29(2) #
5 @
100.744
0.00
3422
265.1
689.3
766.3
1091.7
(2) #
5 @
120.620
1091
.70.00
290.00
29(2) #
5 @
100.744
0.00
3421
293.3
689.3
766.3
1091.7
(2) #
5 @
120.620
1091
.70.00
290.00
29(2) #
5 @
100.744
0.00
3420
321.1
689.3
766.3
1091.7
(2) #
5 @
120.620
1091
.70.00
290.00
29(2) #
5 @
100.744
0.00
3419
349.1
689.3
766.3
1091.7
(2) #
5 @
120.620
1091
.70.00
290.00
29(2) #
5 @
100.744
0.00
3418
377.3
689.3
766.3
1091.7
(2) #
5 @
120.620
1091
.70.00
290.00
29(2) #
5 @
100.744
0.00
3417
404.9
689.3
766.3
1091.7
(2) #
5 @
120.620
1091
.70.00
290.00
29(2) #
5 @
100.744
0.00
3416
415.8
689.3
766.3
1091.7
(2) #
5 @
120.620
1091
.70.00
290.00
29(2) #
5 @
100.744
0.00
3415
457.5
689.3
766.3
1091.7
(2) #
5 @
120.620
1091
.70.00
290.00
29(2) #
5 @
100.744
0.00
3414
495.0
689.3
766.3
1091.7
(2) #
5 @
120.620
1091
.70.00
290.00
29(2) #
5 @
100.744
0.00
3413
552.1
1061
.376
6.3
1370.7
(2) #
5 @
90.827
1562
.30.00
290.00
29(2) #
5 @
80.930
0.00
3212
569.5
1061
.376
6.3
1370.7
(2) #
5 @
90.827
1562
.30.00
290.00
29(2) #
5 @
80.930
0.00
3211
614.8
1061
.376
6.3
1370.7
(2) #
5 @
90.827
1562
.30.00
290.00
29(2) #
5 @
80.930
0.00
3210
691.0
1061
.376
6.3
1370.7
(2) #
5 @
90.827
1562
.30.00
290.00
29(2) #
5 @
80.930
0.00
329
852.2
1061
.376
6.3
1370.7
(2) #
5 @
90.827
1562
.30.00
290.00
29(2) #
5 @
80.930
0.00
328
1264
.01061
.310
21.8
1562.3
(2) #
5 @
90.827
1562
.30.00
290.00
29(2) #
5 @
80.930
0.00
327
888.2
1061
.376
6.3
1370.7
(2) #
5 @
90.827
1562
.30.00
290.00
29(2) #
5 @
80.930
0.00
326
733.5
1061
.376
6.3
1370.7
(2) #
5 @
90.827
1562
.30.00
290.00
29(2) #
5 @
80.930
0.00
325
638.6
1061
.376
6.3
1370.7
(2) #
5 @
90.827
1562
.30.00
290.00
29(2) #
5 @
80.930
0.00
324
378.6
1061
.376
6.3
1370.7
(2) #
5 @
90.827
1562
.30.00
290.00
29(2) #
5 @
80.930
0.00
323
927.7
1061
.376
6.3
1370.7
(2) #
5 @
90.827
1562
.30.00
290.00
29(2) #
5 @
80.930
0.00
322
140.6
886.1
639.8
1144.5
(2) #
5 @
90.827
1304
.40.00
290.00
29(2) #
5 @
80.930
0.00
32
Mod
ified
Reb
ar
and Spacing
Mod
ified
Reb
ar
and Spacing
Wind Shear
Force (from
ETABS), Vu
(k)
V c =
2√f' ct wd (k)
WIND
Level
Tran
sverse (h
orizon
tal) Re
inforcem
ent
Longitu
dinal (vertical) R
einforcemen
t
Table A2 – Final Reinforcemen
t for SW2

Lindsay Lynch Advisor: Dr. Andres Lepage ‐ AE Senior Thesis 2008‐2009 ‐
Aquablue at the Golden MileHato Rey, Puerto Rico
‐ Structural Option ‐
R e v i s e d F i n a l R e p o r t – 2 2 A p r i l 2 0 0 9 | 58
Minim
um
Requ
ired ρ t
Req
uired As,t
(in2 /ft)
Actual A
s,t
(in2 /ft)
Actual ρ
t M
inim
um
Requ
ired ρ l
Req
uired As,l
(in2 /ft)
Actual A
s,l
(in2 /ft)
Actual ρ
l
roof level
19.1
267.7
0.00
200.43
2(2) #
5 @
160.47
0.00
220.00
120.25
9(2) #
5 @
180.41
30.00
1958
9.1
2919
.826
7.7
0.00
200.43
2(2) #
5 @
160.47
0.00
220.00
120.25
9(2) #
5 @
180.41
30.00
1958
9.1
2822
.926
7.7
0.00
200.43
2(2) #
5 @
160.47
0.00
220.00
120.25
9(2) #
5 @
180.41
30.00
1958
9.1
2725
.826
7.7
0.00
200.43
2(2) #
5 @
160.47
0.00
220.00
120.25
9(2) #
5 @
180.41
30.00
1958
9.1
2628
.426
7.7
0.00
200.43
2(2) #
5 @
160.47
0.00
220.00
120.25
9(2) #
5 @
180.41
30.00
1958
9.1
2530
.826
7.7
0.00
200.43
2(2) #
5 @
160.47
0.00
220.00
120.25
9(2) #
5 @
180.41
30.00
1958
9.1
2433
.026
7.7
0.00
200.43
2(2) #
5 @
160.47
0.00
220.00
120.25
9(2) #
5 @
180.41
30.00
1958
9.1
2335
.026
7.7
0.00
200.43
2(2) #
5 @
160.47
0.00
220.00
120.25
9(2) #
5 @
180.41
30.00
1958
9.1
2236
.926
7.7
0.00
200.43
2(2) #
5 @
160.47
0.00
220.00
120.25
9(2) #
5 @
180.41
30.00
1958
9.1
2138
.726
7.7
0.00
200.43
2(2) #
5 @
160.47
0.00
220.00
120.25
9(2) #
5 @
180.41
30.00
1958
9.1
2040
.326
7.7
0.00
200.43
2(2) #
5 @
160.47
0.00
220.00
120.25
9(2) #
5 @
180.41
30.00
1958
9.1
1941
.626
7.7
0.00
200.43
2(2) #
5 @
160.47
0.00
220.00
120.25
9(2) #
5 @
180.41
30.00
1958
9.1
1842
.726
7.7
0.00
200.43
2(2) #
5 @
160.47
0.00
220.00
120.25
9(2) #
5 @
180.41
30.00
1958
9.1
1741
.126
7.7
0.00
200.43
2(2) #
5 @
160.47
0.00
220.00
120.25
9(2) #
5 @
180.41
30.00
1958
9.1
1654
.426
7.7
0.00
200.43
2(2) #
5 @
160.47
0.00
220.00
120.25
9(2) #
5 @
180.41
30.00
1958
9.1
1549
.026
7.7
0.00
200.43
2(2) #
5 @
160.47
0.00
220.00
120.25
9(2) #
5 @
180.41
30.00
1958
9.1
1436
.526
7.7
0.00
200.43
2(2) #
5 @
160.47
0.00
220.00
120.25
9(2) #
5 @
180.41
30.00
1958
9.1
1330
.530
9.1
0.00
200.43
2(2) #
5 @
160.47
0.00
220.00
120.25
9(2) #
5 @
180.41
30.00
1963
8.8
1240
.530
9.1
0.00
200.43
2(2) #
5 @
160.47
0.00
220.00
120.25
9(2) #
5 @
180.41
30.00
1963
8.8
1144
.930
9.1
0.00
200.43
2(2) #
5 @
160.47
0.00
220.00
120.25
9(2) #
5 @
180.41
30.00
1963
8.8
1044
.830
9.1
0.00
200.43
2(2) #
5 @
160.47
0.00
220.00
120.25
9(2) #
5 @
180.41
30.00
1963
8.8
939
.630
9.1
0.00
200.43
2(2) #
5 @
160.47
0.00
220.00
120.25
9(2) #
5 @
180.41
30.00
1963
8.8
841
.630
9.1
0.00
200.43
2(2) #
5 @
160.47
0.00
220.00
120.25
9(2) #
5 @
180.41
30.00
1963
8.8
732
7.1
309.1
0.00
250.54
0(2) #
5 @
120.62
0.00
290.00
250.54
0(2) #
5 @
120.62
00.00
2972
8.1
614
2.9
309.1
0.00
200.43
2(2) #
5 @
160.47
0.00
220.00
120.25
9(2) #
5 @
180.41
30.00
1963
8.8
512
1.3
309.1
0.00
200.43
2(2) #
5 @
160.47
0.00
220.00
120.25
9(2) #
5 @
180.41
30.00
1963
8.8
413
6.2
309.1
0.00
200.43
2(2) #
5 @
160.47
0.00
220.00
120.25
9(2) #
5 @
180.41
30.00
1963
8.8
318
8.2
309.1
0.00
200.43
2(2) #
5 @
160.47
0.00
220.00
120.25
9(2) #
5 @
180.41
30.00
1963
8.8
257
.230
9.1
0.00
200.43
2(2) #
5 @
160.47
0.00
220.00
120.25
9(2) #
5 @
180.41
30.00
1963
8.8
Prelim
inary Re
bar
and Spacing
Prelim
inary Re
bar
and Spacing
Longitu
dinal (vertical) R
einforcemen
tShear C
apacity
(k), φVn =
φAcv(α
cλ√f' c + ρ tf y)
SEISMIC
Level
Seismic She
ar
Force (from
ETABS), Vu (k)
Acvλ√f' c
(k)
Transverse (h
orizon
tal) Re
inforcem
ent
Table A3 – Prelim
inary Re
inforcem
ent for SW3

Lindsay Lynch Advisor: Dr. Andres Lepage ‐ AE Senior Thesis 2008‐2009 ‐
Aquablue at the Golden MileHato Rey, Puerto Rico
‐ Structural Option ‐
R e v i s e d F i n a l R e p o r t – 2 2 A p r i l 2 0 0 9 | 59
V s = A
s,tf yd/s (k)
φV n =
φ(V
c+V s) (k)
As,t (in
2 /ft)
NEW
φV n =
φ(V
c+V s) (k)
ρ t
Minim
um
Requ
ired ρ l
As,l (in
2 /ft)
ρ l
roof level
62.6
428.3
357.1
589.1
(2) #
5 @
120.62
067
8.4
0.00
290.00
29(2) #
5 @
120.62
00.0029
2966.4
428.3
357.1
589.1
(2) #
5 @
120.62
067
8.4
0.00
290.00
29(2) #
5 @
120.62
00.0029
2874.9
428.3
357.1
589.1
(2) #
5 @
120.62
067
8.4
0.00
290.00
29(2) #
5 @
120.62
00.0029
2781.0
428.3
357.1
589.1
(2) #
5 @
120.62
067
8.4
0.00
290.00
29(2) #
5 @
120.62
00.0029
2687.2
428.3
357.1
589.1
(2) #
5 @
120.62
067
8.4
0.00
290.00
29(2) #
5 @
120.62
00.0029
2593.4
428.3
357.1
589.1
(2) #
5 @
120.62
067
8.4
0.00
290.00
29(2) #
5 @
120.62
00.0029
2499.6
428.3
357.1
589.1
(2) #
5 @
120.62
067
8.4
0.00
290.00
29(2) #
5 @
120.62
00.0029
23105.5
428.3
357.1
589.1
(2) #
5 @
120.62
067
8.4
0.00
290.00
29(2) #
5 @
120.62
00.0029
22111.0
428.3
357.1
589.1
(2) #
5 @
120.62
067
8.4
0.00
290.00
29(2) #
5 @
120.62
00.0029
21116.6
428.3
357.1
589.1
(2) #
5 @
120.62
067
8.4
0.00
290.00
29(2) #
5 @
120.62
00.0029
20122.3
428.3
357.1
589.1
(2) #
5 @
120.62
067
8.4
0.00
290.00
29(2) #
5 @
120.62
00.0029
19129.2
428.3
357.1
589.1
(2) #
5 @
120.62
067
8.4
0.00
290.00
29(2) #
5 @
120.62
00.0029
18139.0
428.3
357.1
589.1
(2) #
5 @
120.62
067
8.4
0.00
290.00
29(2) #
5 @
120.62
00.0029
17155.8
428.3
357.1
589.1
(2) #
5 @
120.62
067
8.4
0.00
290.00
29(2) #
5 @
120.62
00.0029
16122.3
428.3
357.1
589.1
(2) #
5 @
120.62
067
8.4
0.00
290.00
29(2) #
5 @
120.62
00.0029
15138.2
428.3
357.1
589.1
(2) #
5 @
120.62
067
8.4
0.00
290.00
29(2) #
5 @
120.62
00.0029
14146.8
428.3
357.1
589.1
(2) #
5 @
120.62
067
8.4
0.00
290.00
29(2) #
5 @
120.62
00.0029
13120.6
494.6
357.1
638.8
(2) #
5 @
120.62
072
8.1
0.00
290.00
29(2) #
5 @
120.62
00.0029
12142.0
494.6
357.1
638.8
(2) #
5 @
120.62
072
8.1
0.00
290.00
29(2) #
5 @
120.62
00.0029
11157.3
494.6
357.1
638.8
(2) #
5 @
120.62
072
8.1
0.00
290.00
29(2) #
5 @
120.62
00.0029
10177.8
494.6
357.1
638.8
(2) #
5 @
120.62
072
8.1
0.00
290.00
29(2) #
5 @
120.62
00.0029
9232.2
494.6
357.1
638.8
(2) #
5 @
120.62
072
8.1
0.00
290.00
29(2) #
5 @
120.62
00.0029
8330.1
494.6
357.1
638.8
(2) #
5 @
120.62
072
8.1
0.00
290.00
28(2) #
5 @
120.62
00.0029
7593.3
494.6
476.2
728.1
(2) #
5 @
120.62
072
8.1
0.00
290.00
28(2) #
5 @
120.62
00.0029
6267.5
494.6
357.1
638.8
(2) #
5 @
120.62
072
8.1
0.00
290.00
29(2) #
5 @
120.62
00.0029
5248.3
494.6
357.1
638.8
(2) #
5 @
120.62
072
8.1
0.00
290.00
29(2) #
5 @
120.62
00.0029
4286.0
494.6
357.1
638.8
(2) #
5 @
120.62
072
8.1
0.00
290.00
29(2) #
5 @
120.62
00.0029
3392.7
494.6
357.1
638.8
(2) #
5 @
120.62
072
8.1
0.00
290.00
29(2) #
5 @
120.62
00.0029
2211.7
494.6
357.1
638.8
(2) #
5 @
120.62
072
8.1
0.00
290.00
28(2) #
5 @
120.62
00.0029
Mod
ified
Rebar and
Spacing
Mod
ified
Reb
ar and
Spacing
Wind Shear
Force (from
ETABS), Vu (k)
V c =
2√f' ct wd (k)
WIND
Level
Transverse (h
orizon
tal) Re
inforcem
ent
Longitu
dinal (vertical) R
einforcemen
t
Table A4 – Final Reinforcemen
t for SW3

Lindsay Lynch Advisor: Dr. Andres Lepage ‐ AE Senior Thesis 2008‐2009 ‐
Aquablue at the Golden MileHato Rey, Puerto Rico
‐ Structural Option ‐
R e v i s e d F i n a l R e p o r t – 2 2 A p r i l 2 0 0 9 | 60
Minim
um
Requ
ired ρ t
Req
uired As,t
(in2 /ft)
Actual A
s,t
(in2 /ft)
Actual ρ
t M
inim
um
Requ
ired ρ l
Required As,l
(in2 /ft)
Actual A
s,l
(in2 /ft)
Actual ρ
l
roof level
19.1
267.7
0.0020
0.43
2(2) #
5 @
160.47
0.00
220.00
120.25
9(2) #
5 @
180.41
30.00
1958
9.1
2919
.826
7.7
0.00
200.43
2(2) #5 @
160.47
0.00
220.00
120.25
9(2) #
5 @
180.41
30.00
1958
9.1
2823
.026
7.7
0.00
200.43
2(2) #5 @
160.47
0.00
220.00
120.25
9(2) #
5 @
180.41
30.00
1958
9.1
2725
.726
7.7
0.00
200.43
2(2) #5 @
160.47
0.00
220.00
120.25
9(2) #
5 @
180.41
30.00
1958
9.1
2628
.526
7.7
0.00
200.43
2(2) #5 @
160.47
0.00
220.00
120.25
9(2) #
5 @
180.41
30.00
1958
9.1
2531
.026
7.7
0.00
200.43
2(2) #5 @
160.47
0.00
220.00
120.25
9(2) #
5 @
180.41
30.00
1958
9.1
2433
.526
7.7
0.00
200.43
2(2) #5 @
160.47
0.00
220.00
120.25
9(2) #
5 @
180.41
30.00
1958
9.1
2335
.826
7.7
0.00
200.43
2(2) #5 @
160.47
0.00
220.00
120.25
9(2) #
5 @
180.41
30.00
1958
9.1
2238
.026
7.7
0.00
200.43
2(2) #5 @
160.47
0.00
220.00
120.25
9(2) #
5 @
180.41
30.00
1958
9.1
2140
.126
7.7
0.00
200.43
2(2) #5 @
160.47
0.00
220.00
120.25
9(2) #
5 @
180.41
30.00
1958
9.1
2042
.126
7.7
0.00
200.43
2(2) #5 @
160.47
0.00
220.00
120.25
9(2) #
5 @
180.41
30.00
1958
9.1
1943
.826
7.7
0.00
200.43
2(2) #5 @
160.47
0.00
220.00
120.25
9(2) #
5 @
180.41
30.00
1958
9.1
1845
.026
7.7
0.00
200.43
2(2) #5 @
160.47
0.00
220.00
120.25
9(2) #
5 @
180.41
30.00
1958
9.1
1744
.826
7.7
0.00
200.43
2(2) #5 @
160.47
0.00
220.00
120.25
9(2) #
5 @
180.41
30.00
1958
9.1
1659
.326
7.7
0.00
200.43
2(2) #5 @
160.47
0.00
220.00
120.25
9(2) #
5 @
180.41
30.00
1958
9.1
1555
.026
7.7
0.00
200.43
2(2) #5 @
160.47
0.00
220.00
120.25
9(2) #
5 @
180.41
30.00
1958
9.1
1446
.326
7.7
0.00
200.43
2(2) #5 @
160.47
0.00
220.00
120.25
9(2) #
5 @
180.41
30.00
1958
9.1
1346
.030
9.1
0.00
200.43
2(2) #5 @
160.47
0.00
220.00
120.25
9(2) #
5 @
180.41
30.00
1963
8.8
1249
.230
9.1
0.00
200.43
2(2) #5 @
160.47
0.00
220.00
120.25
9(2) #
5 @
180.41
30.00
1963
8.8
1152
.230
9.1
0.00
200.43
2(2) #5 @
160.47
0.00
220.00
120.25
9(2) #
5 @
180.41
30.00
1963
8.8
1056
.130
9.1
0.00
200.43
2(2) #5 @
160.47
0.00
220.00
120.25
9(2) #
5 @
180.41
30.00
1963
8.8
965
.030
9.1
0.00
200.43
2(2) #5 @
160.47
0.00
220.00
120.25
9(2) #
5 @
180.41
30.00
1963
8.8
841
.530
9.1
0.00
200.43
2(2) #5 @
160.47
0.00
220.00
120.25
9(2) #
5 @
180.41
30.00
1963
8.8
733
0.6
309.1
0.00
250.54
0(2) #5 @
120.62
0.00
290.00
250.54
0(2) #
5 @
120.62
00.00
2972
8.1
614
9.6
309.1
0.00
200.43
2(2) #5 @
160.47
0.00
220.00
120.25
9(2) #
5 @
180.41
30.00
1963
8.8
512
7.8
309.1
0.00
200.43
2(2) #5 @
160.47
0.00
220.00
120.25
9(2) #
5 @
180.41
30.00
1963
8.8
414
2.5
309.1
0.00
200.43
2(2) #5 @
160.47
0.00
220.00
120.25
9(2) #
5 @
180.41
30.00
1963
8.8
319
2.8
309.1
0.00
200.43
2(2) #5 @
160.47
0.00
220.00
120.25
9(2) #
5 @
180.41
30.00
1963
8.8
255
.730
9.1
0.00
200.43
2(2) #5 @
160.47
0.00
220.00
120.25
9(2) #
5 @
180.41
30.00
1963
8.8
Prelim
inary Re
bar
and Spacing
Prelim
inary Re
bar
and Spacing
Longitu
dinal (vertical) R
einforcemen
tShear Capacity (k),
φVn = φAcv(α
cλ√f' c
+ ρ tf y)
SEISMIC
Level
Seismic Shear
Force (from
ETABS), V u (k)
Acvλ√f' c
(k)
Transverse (h
orizon
tal) Re
inforcem
ent
Table A5 – Prelim
inary Re
inforcem
ent for SW4

Lindsay Lynch Advisor: Dr. Andres Lepage ‐ AE Senior Thesis 2008‐2009 ‐
Aquablue at the Golden MileHato Rey, Puerto Rico
‐ Structural Option ‐
R e v i s e d F i n a l R e p o r t – 2 2 A p r i l 2 0 0 9 | 61
V s = A
s,tf yd/s (k)
φV n =
φ(V
c+V s) (k)
As,t (in
2 /ft)
NEW
φV n =
φ(V
c+V s) (k)
ρ t
Minim
um
Requ
ired ρ l
As,l (in
2 /ft)
ρ l
roof level
70.7
428.3
357.1
589.1
(2) #
5 @
120.62
067
8.4
0.00
290.00
29(2) #
5 @
120.62
00.00
29
2976
.742
8.3
357.1
589.1
(2) #
5 @
120.62
067
8.4
0.00
290.00
29(2) #
5 @
120.62
00.00
29
2888
.342
8.3
357.1
589.1
(2) #
5 @
120.62
067
8.4
0.00
290.00
29(2) #
5 @
120.62
00.00
29
2798
.142
8.3
357.1
589.1
(2) #
5 @
120.62
067
8.4
0.00
290.00
29(2) #
5 @
120.62
00.00
29
2610
7.6
428.3
357.1
589.1
(2) #
5 @
120.62
067
8.4
0.00
290.00
29(2) #
5 @
120.62
00.00
29
2511
7.2
428.3
357.1
589.1
(2) #
5 @
120.62
067
8.4
0.00
290.00
29(2) #
5 @
120.62
00.00
29
2412
7.6
428.3
357.1
589.1
(2) #
5 @
120.62
067
8.4
0.00
290.00
29(2) #
5 @
120.62
00.00
29
2313
8.0
428.3
357.1
589.1
(2) #
5 @
120.62
067
8.4
0.00
290.00
29(2) #
5 @
120.62
00.00
29
2214
8.1
428.3
357.1
589.1
(2) #
5 @
120.62
067
8.4
0.00
290.00
29(2) #
5 @
120.62
00.00
29
2115
8.4
428.3
357.1
589.1
(2) #
5 @
120.62
067
8.4
0.00
290.00
29(2) #
5 @
120.62
00.00
29
2016
8.9
428.3
357.1
589.1
(2) #
5 @
120.62
067
8.4
0.00
290.00
29(2) #
5 @
120.62
00.00
29
1918
0.0
428.3
357.1
589.1
(2) #
5 @
120.62
067
8.4
0.00
290.00
29(2) #
5 @
120.62
00.00
29
1819
2.7
428.3
357.1
589.1
(2) #
5 @
120.62
067
8.4
0.00
290.00
29(2) #
5 @
120.62
00.00
29
1720
4.3
428.3
357.1
589.1
(2) #
5 @
120.62
067
8.4
0.00
290.00
29(2) #
5 @
120.62
00.00
29
1618
2.9
428.3
357.1
589.1
(2) #
5 @
120.62
067
8.4
0.00
290.00
29(2) #
5 @
120.62
00.00
29
1520
6.7
428.3
357.1
589.1
(2) #
5 @
120.62
067
8.4
0.00
290.00
29(2) #
5 @
120.62
00.00
29
1421
6.5
428.3
357.1
589.1
(2) #
5 @
120.62
067
8.4
0.00
290.00
29(2) #
5 @
120.62
00.00
29
1320
5.9
494.6
357.1
638.8
(2) #
5 @
120.62
072
8.1
0.00
290.00
29(2) #
5 @
120.62
00.00
29
1223
0.9
494.6
357.1
638.8
(2) #
5 @
120.62
072
8.1
0.00
290.00
29(2) #
5 @
120.62
00.00
29
1125
2.8
494.6
357.1
638.8
(2) #
5 @
120.62
072
8.1
0.00
290.00
29(2) #
5 @
120.62
00.00
29
1027
9.3
494.6
357.1
638.8
(2) #
5 @
120.62
072
8.1
0.00
290.00
29(2) #
5 @
120.62
00.00
29
933
8.4
494.6
357.1
638.8
(2) #
5 @
120.62
072
8.1
0.00
290.00
29(2) #
5 @
120.62
00.00
29
834
2.0
494.6
357.1
638.8
(2) #
5 @
120.62
072
8.1
0.00
290.00
28(2) #
5 @
120.62
00.00
29
761
6.3
494.6
476.2
728.1
(2) #
5 @
120.62
072
8.1
0.00
290.00
28(2) #
5 @
120.62
00.00
29
627
6.6
494.6
357.1
638.8
(2) #
5 @
120.62
072
8.1
0.00
290.00
29(2) #
5 @
120.62
00.00
29
525
7.6
494.6
357.1
638.8
(2) #
5 @
120.62
072
8.1
0.00
290.00
29(2) #
5 @
120.62
00.00
29
429
5.4
494.6
357.1
638.8
(2) #
5 @
120.62
072
8.1
0.00
290.00
29(2) #
5 @
120.62
00.00
29
340
2.1
494.6
357.1
638.8
(2) #
5 @
120.62
072
8.1
0.00
290.00
29(2) #
5 @
120.62
00.00
29
223
7.3
494.6
357.1
638.8
(2) #
5 @
120.62
072
8.1
0.00
290.00
28(2) #
5 @
120.62
00.00
29
Mod
ified
Rebar and
Spacing
Mod
ified
Rebar and
Spacing
Wind Shear F
orce
(from ETA
BS), Vu
(k)
V c = 2√f' ct
wd
(k)
WIND
Level
Transverse (h
orizon
tal) Re
inforcem
ent
Longitu
dinal (vertical) R
einforcemen
t
Table A6 – Final Reinforcemen
t for SW4

Lindsay Lynch Advisor: Dr. Andres Lepage ‐ AE Senior Thesis 2008‐2009 ‐
Aquablue at the Golden MileHato Rey, Puerto Rico
‐ Structural Option ‐
R e v i s e d F i n a l R e p o r t – 2 2 A p r i l 2 0 0 9 | 62
Minim
um
Requ
ired ρ t
Req
uired As,t
(in2 /ft)
Actual A
s,t
(in2 /ft)
Actual ρ
t M
inim
um
Requ
ired ρ l
Required As,l
(in2 /ft)
Actual A
s,l
(in2 /ft)
Actual ρ
l
sky lobb
y roof
level
21.2
320.7
0.0020
0.432
(2) #5 @
120.62
0.0029
0.0012
0.25
9(2) #5 @
180.41
30.0019
812.6
roof level
52.7
531.2
0.0020
0.432
(2) #5 @
120.62
0.0029
0.0012
0.25
9(2) #5 @
180.41
30.0019
1346.1
2967
.3531.2
0.0020
0.432
(2) #5 @
120.62
0.0029
0.0012
0.25
9(2) #5 @
180.41
30.0019
1346.1
2882
.3531.2
0.0020
0.432
(2) #5 @
120.62
0.0029
0.0012
0.25
9(2) #5 @
180.41
30.0019
1346.1
2799
.9531.2
0.0020
0.432
(2) #5 @
120.62
0.0029
0.0012
0.25
9(2) #5 @
180.41
30.0019
1346.1
2611
8.8
531.2
0.0020
0.432
(2) #5 @
120.62
0.0029
0.0012
0.25
9(2) #5 @
180.41
30.0019
1346.1
2513
6.2
531.2
0.0020
0.432
(2) #5 @
120.62
0.0029
0.0012
0.25
9(2) #5 @
180.41
30.0019
1346.1
2415
2.3
531.2
0.0020
0.432
(2) #5 @
120.62
0.0029
0.0012
0.25
9(2) #5 @
180.41
30.0019
1346.1
2316
8.8
531.2
0.0020
0.432
(2) #5 @
120.62
0.0029
0.0012
0.25
9(2) #5 @
180.41
30.0019
1346.1
2218
4.8
531.2
0.0020
0.432
(2) #5 @
120.62
0.0029
0.0012
0.25
9(2) #5 @
180.41
30.0019
1346.1
2120
0.1
531.2
0.0020
0.432
(2) #
5 @
120.62
0.0029
0.0012
0.25
9(2) #5 @
180.41
30.0019
1346.1
2021
4.5
531.2
0.0020
0.432
(2) #5 @
120.62
0.0029
0.0012
0.25
9(2) #5 @
180.41
30.0019
1346.1
1922
8.0
531.2
0.0020
0.432
(2) #5 @
120.62
0.0029
0.0012
0.25
9(2) #5 @
180.41
30.0019
1346.1
1824
0.2
531.2
0.0020
0.432
(2) #5 @
120.62
0.0029
0.0012
0.25
9(2) #5 @
180.41
30.0019
1346.1
1724
9.4
531.2
0.0020
0.432
(2) #5 @
120.62
0.0029
0.0012
0.25
9(2) #5 @
180.41
30.0019
1346.1
1627
3.2
708.3
0.0020
0.576
(2) #5 @
120.62
0.0022
0.0012
0.34
6(2) #5 @
180.41
30.0014
1558.6
1526
0.9
708.3
0.0020
0.576
(2) #5 @
120.62
0.0022
0.0012
0.34
6(2) #5 @
180.41
30.0014
1558.6
1424
3.6
708.3
0.0020
0.576
(2) #5 @
120.62
0.0022
0.0012
0.34
6(2) #5 @
180.41
30.0014
1558.6
1320
9.1
817.9
0.0020
0.576
(2) #5 @
120.62
0.0022
0.0012
0.34
6(2) #5 @
180.41
30.0014
1690.1
1224
7.7
817.9
0.0020
0.576
(2) #5 @
120.62
0.0022
0.0012
0.34
6(2) #5 @
180.41
30.0014
1690.1
1126
7.2
817.9
0.0020
0.576
(2) #5 @
120.62
0.0022
0.0012
0.34
6(2) #5 @
180.41
30.0014
1690.1
1027
7.6
817.9
0.0020
0.576
(2) #5 @
120.62
0.0022
0.0012
0.34
6(2) #5 @
180.41
30.0014
1690.1
927
4.7
817.9
0.0020
0.576
(2) #
5 @
120.62
0.0022
0.0012
0.34
6(2) #5 @
180.41
30.0014
1690.1
825
4.6
817.9
0.0020
0.576
(2) #
5 @
120.62
0.0022
0.0012
0.34
6(2) #5 @
180.41
30.0014
1690.1
711
05.7
1022
.30.0025
0.900
(2) #5 @
80.93
0.0026
0.0025
0.90
0(2) #5 @
80.93
00.0026
2289.8
666
4.2
1022
.30.0020
0.720
(2) #
5 @
100.74
0.0021
0.0012
0.43
2(2) #5 @
120.62
00.0017
2077.2
543
5.5
1022
.30.0020
0.720
(2) #
5 @
100.74
0.0021
0.0012
0.43
2(2) #5 @
120.62
00.0017
2077.2
435
6.3
1022
.30.0020
0.720
(2) #
5 @
100.74
0.0021
0.0012
0.43
2(2) #5 @
120.62
00.0017
2077.2
331
6.1
1022
.30.0020
0.720
(2) #
5 @
100.74
0.0021
0.0012
0.43
2(2) #5 @
120.62
00.0017
2077.2
227
8.1
1022
.30.0020
0.720
(2) #
5 @
100.74
0.0021
0.0012
0.43
2(2) #5 @
120.62
00.0017
2077.2
Prelim
inary Re
bar
and Spacing
Prelim
inary Re
bar
and Spacing
Longitu
dinal (vertical) R
einforcement
Shear C
apacity
(k),
φVn
= φAcv(α
cλ√f' c
+ ρ tf y)
SEISMIC
Level
Seismic She
ar
Force (from
ETABS), V u (k)
Acvλ√f' c
(k)
Transverse (h
orizon
tal) Re
inforcem
ent
Table A7 – Prelim
inary Re
inforcem
ent for SW5

Lindsay Lynch Advisor: Dr. Andres Lepage ‐ AE Senior Thesis 2008‐2009 ‐
Aquablue at the Golden MileHato Rey, Puerto Rico
‐ Structural Option ‐
R e v i s e d F i n a l R e p o r t – 2 2 A p r i l 2 0 0 9 | 63
V s = A
s,tf yd/s (k)φV n = φ(V
c+Vs)
(k)
As,t (in
2 /ft)
NEW
φVn =
φ(V
c+V s) (k)
ρ t
Minim
um
Requ
ired ρ l
As,l (in
2 /ft)
ρ l
sky lobb
y roof
level
64.4
513.1
570.4
812.6
(2) #5 @
120.620
812.6
0.0029
0.00
29(2) #5 @
100.74
40.00
34
roof level
162.5
849.9
944.9
1346.1
(2) #5 @
120.620
1346.1
0.0029
0.00
29(2) #5 @
100.74
40.00
34
29191.2
849.9
944.9
1346.1
(2) #5 @
120.620
1346.1
0.0029
0.00
29(2) #5 @
100.74
40.00
34
28265.2
849.9
944.9
1346.1
(2) #5 @
120.620
1346.1
0.0029
0.00
29(2) #5 @
100.74
40.00
34
27338.0
849.9
944.9
1346.1
(2) #5 @
120.620
1346.1
0.0029
0.00
29(2) #5 @
100.74
40.00
34
26411.2
849.9
944.9
1346.1
(2) #5 @
120.620
1346.1
0.0029
0.00
29(2) #5 @
100.74
40.00
34
25484.6
849.9
944.9
1346.1
(2) #5 @
120.620
1346.1
0.0029
0.00
29(2) #5 @
100.74
40.00
34
24558.4
849.9
944.9
1346.1
(2) #5 @
120.620
1346.1
0.0029
0.00
29(2) #5 @
100.74
40.00
34
23631.4
849.9
944.9
1346.1
(2) #5 @
120.620
1346.1
0.0029
0.00
29(2) #5 @
100.74
40.00
34
22703.2
849.9
944.9
1346.1
(2) #5 @
120.620
1346.1
0.0029
0.00
29(2) #5 @
100.74
40.00
34
21775.0
849.9
944.9
1346.1
(2) #5 @
120.620
1346.1
0.0029
0.00
29(2) #5 @
100.74
40.00
34
20846.2
849.9
944.9
1346.1
(2) #5 @
120.620
1346.1
0.0029
0.00
29(2) #5 @
100.74
40.00
34
19917.6
849.9
944.9
1346.1
(2) #5 @
120.620
1346.1
0.0029
0.00
29(2) #5 @
100.74
40.00
34
18989.3
849.9
944.9
1346.1
(2) #5 @
120.620
1346.1
0.0029
0.00
29(2) #5 @
100.74
40.00
34
1710
60.1
849.9
944.9
1346.1
(2) #5 @
120.620
1346.1
0.0029
0.00
29(2) #5 @
100.74
40.00
34
1611
40.6
1133
.394
4.9
1558.6
(2) #5 @
100.744
1700.3
0.0026
0.00
26(2) #5 @
80.93
00.00
32
1511
98.8
1133
.394
4.9
1558.6
(2) #5 @
100.744
1700.3
0.0026
0.00
26(2) #5 @
80.93
00.00
32
1412
64.8
1133
.394
4.9
1558.6
(2) #5 @
100.744
1700.3
0.0026
0.00
26(2) #5 @
80.93
00.00
32
1313
34.5
1308
.694
4.9
1690.1
(2) #5 @
100.744
1831.8
0.0026
0.00
26(2) #5 @
80.93
00.00
32
1214
11.0
1308
.694
4.9
1690.1
(2) #5 @
100.744
1831.8
0.0026
0.00
26(2) #5 @
80.93
00.00
32
1114
75.4
1308
.694
4.9
1690.1
(2) #5 @
100.744
1831.8
0.0026
0.00
26(2) #5 @
80.93
00.00
32
1015
39.5
1308
.694
4.9
1690.1
(2) #5 @
100.744
1831.8
0.0026
0.00
26(2) #5 @
80.93
00.00
32
916
02.5
1308
.694
4.9
1690.1
(2) #5 @
100.744
1831.8
0.0026
0.00
26(2) #5 @
80.93
00.00
32
816
29.1
1308
.694
4.9
1690.1
(2) #5 @
100.744
1831.8
0.0026
0.00
26(2) #5 @
80.93
00.00
32
724
21.1
1635
.71417
.322
89.8
(2) #7 @
121.200
2598.4
0.0033
0.00
34(2) #5 @
61.24
00.00
34
619
05.0
1635
.71133
.920
77.2
(2) #7 @
121.200
2598.4
0.0033
0.00
34(2) #5 @
61.24
00.00
34
515
36.2
1635
.71133
.920
77.2
(2) #7 @
121.200
2598.4
0.0033
0.00
34(2) #5 @
61.24
00.00
34
415
52.5
1635
.71133
.920
77.2
(2) #7 @
121.200
2598.4
0.0033
0.00
34(2) #5 @
61.24
00.00
34
315
86.5
1635
.71133
.920
77.2
(2) #7 @
121.200
2598.4
0.0033
0.00
34(2) #5 @
61.24
00.00
34
215
97.3
1635
.71133
.920
77.2
(2) #7 @
121.200
2598.4
0.0033
0.00
34(2) #5 @
61.24
00.00
34
Mod
ified
Rebar and
Spacing
Mod
ified
Reb
ar and
Spacing
Wind Shear F
orce
(from ETA
BS), Vu
(k)
V c = 2√f' ct
wd
(k)
WIND
Level
Transverse (h
orizon
tal) Re
inforcem
ent
Longitu
dinal (vertical) R
einforcement
Table A8 – Final Reinforcemen
t for SW5

Lindsay Lynch Advisor: Dr. Andres Lepage ‐ AE Senior Thesis 2008‐2009 ‐
Aquablue at the Golden MileHato Rey, Puerto Rico
‐ Structural Option ‐
R e v i s e d F i n a l R e p o r t – 2 2 A p r i l 2 0 0 9 | 64
Minim
um
Requ
ired ρ t
Req
uired As,t
(in2 /ft)
Actual A
s,t
(in2 /ft)
Actual ρ
t M
inim
um
Requ
ired ρ l
Required As,l
(in2 /ft)
Actual A
s,l
(in2 /ft)
Actual ρ
l
sky lobb
y roof
level
21.2
320.7
0.00
200.432
(2) #5 @
120.62
0.0029
0.00
120.25
9(2) #
5 @
180.41
30.00
1981
2.6
roof level
36.4
531.2
0.00
200.432
(2) #5 @
120.62
0.0029
0.00
120.25
9(2) #
5 @
180.41
30.00
191346
.1
2994
.653
1.2
0.00
200.432
(2) #5 @
120.62
0.0029
0.00
120.25
9(2) #
5 @
180.41
30.00
191346
.1
2814
8.5
531.2
0.00
200.432
(2) #5 @
120.62
0.0029
0.00
120.25
9(2) #
5 @
180.41
30.00
191346
.1
2719
1.4
531.2
0.00
200.432
(2) #5 @
120.62
0.0029
0.00
120.25
9(2) #
5 @
180.41
30.00
191346
.1
2623
2.9
531.2
0.00
200.432
(2) #5 @
120.62
0.0029
0.00
120.25
9(2) #
5 @
180.41
30.00
191346
.1
2527
1.8
531.2
0.00
200.432
(2) #5 @
120.62
0.0029
0.00
120.25
9(2) #
5 @
180.41
30.00
191346
.1
2430
8.3
531.2
0.00
200.432
(2) #5 @
120.62
0.0029
0.00
120.25
9(2) #
5 @
180.41
30.00
191346
.1
2334
2.5
531.2
0.00
200.432
(2) #5 @
120.62
0.0029
0.00
120.25
9(2) #
5 @
180.41
30.00
191346
.1
2237
4.4
531.2
0.00
200.432
(2) #5 @
120.62
0.0029
0.00
120.25
9(2) #
5 @
180.41
30.00
191346
.1
2140
4.1
531.2
0.00
200.432
(2) #5 @
120.62
0.0029
0.00
120.25
9(2) #
5 @
180.41
30.00
191346
.1
2043
1.7
531.2
0.00
200.432
(2) #5 @
120.62
0.0029
0.00
120.25
9(2) #
5 @
180.41
30.00
191346
.1
1945
6.9
531.2
0.00
200.432
(2) #5 @
120.62
0.0029
0.00
120.25
9(2) #
5 @
180.41
30.00
191346
.1
1847
9.8
531.2
0.00
200.432
(2) #5 @
120.62
0.0029
0.00
120.25
9(2) #
5 @
180.41
30.00
191346
.1
1749
8.6
531.2
0.00
200.432
(2) #5 @
120.62
0.0029
0.00
120.25
9(2) #
5 @
180.41
30.00
191346
.1
1653
5.8
708.3
0.00
200.576
(2) #5 @
120.62
0.0022
0.00
120.34
6(2) #
5 @
180.41
30.00
141558
.6
1554
1.8
708.3
0.00
200.576
(2) #5 @
120.62
0.0022
0.00
120.34
6(2) #
5 @
180.41
30.00
141558
.6
1455
2.2
708.3
0.00
200.576
(2) #5 @
120.62
0.0022
0.00
120.34
6(2) #
5 @
180.41
30.00
141558
.6
1356
8.2
817.9
0.00
200.576
(2) #5 @
120.62
0.0022
0.00
120.34
6(2) #
5 @
180.41
30.00
141690
.1
1258
4.9
817.9
0.00
200.576
(2) #5 @
120.62
0.0022
0.00
120.34
6(2) #
5 @
180.41
30.00
141690
.1
1159
5.9
817.9
0.00
200.576
(2) #5 @
120.62
0.0022
0.00
120.34
6(2) #
5 @
180.41
30.00
141690
.1
1060
4.0
817.9
0.00
200.576
(2) #5 @
120.62
0.0022
0.00
120.34
6(2) #
5 @
180.41
30.00
141690
.1
960
6.0
817.9
0.00
200.576
(2) #5 @
120.62
0.0022
0.00
120.34
6(2) #
5 @
180.41
30.00
141690
.1
857
8.3
817.9
0.00
200.576
(2) #5 @
120.62
0.0022
0.00
120.34
6(2) #
5 @
180.41
30.00
141690
.1
714
46.7
1022
.30.00
250.900
(2) #5 @
80.93
0.0026
0.00
250.90
0(2) #
5 @
80.93
00.00
262289
.8
685
1.8
1022
.30.00
200.720
(2) #5 @
100.74
0.0021
0.00
120.43
2(2) #
5 @
120.62
00.00
172077
.2
554
7.6
1022
.30.00
200.720
(2) #5 @
100.74
0.0021
0.00
120.43
2(2) #
5 @
120.62
00.00
172077
.2
431
9.5
1022
.30.00
200.720
(2) #5 @
100.74
0.0021
0.00
120.43
2(2) #
5 @
120.62
00.00
172077
.2
324
0.9
1022
.30.00
200.720
(2) #5 @
100.74
0.0021
0.00
120.43
2(2) #
5 @
120.62
00.00
172077
.2
232
8.6
1022
.30.00
200.720
(2) #5 @
100.74
0.0021
0.00
120.43
2(2) #
5 @
120.62
00.00
172077
.2
Prelim
inary Re
bar
and Spacing
Prelim
inary Re
bar
and Spacing
Longitu
dinal (vertical) R
einforcemen
tShear C
apacity
(k),
φVn
= φAcv(α
cλ√f' c
+ ρ tf y)
SEISMIC
Level
Seismic She
ar
Force (from
ETABS), V u (k)
Acvλ√f' c
(k)
Transverse (h
orizon
tal) Re
inforcem
ent
Table A9 – Prelim
inary Re
inforcem
ent for SW6
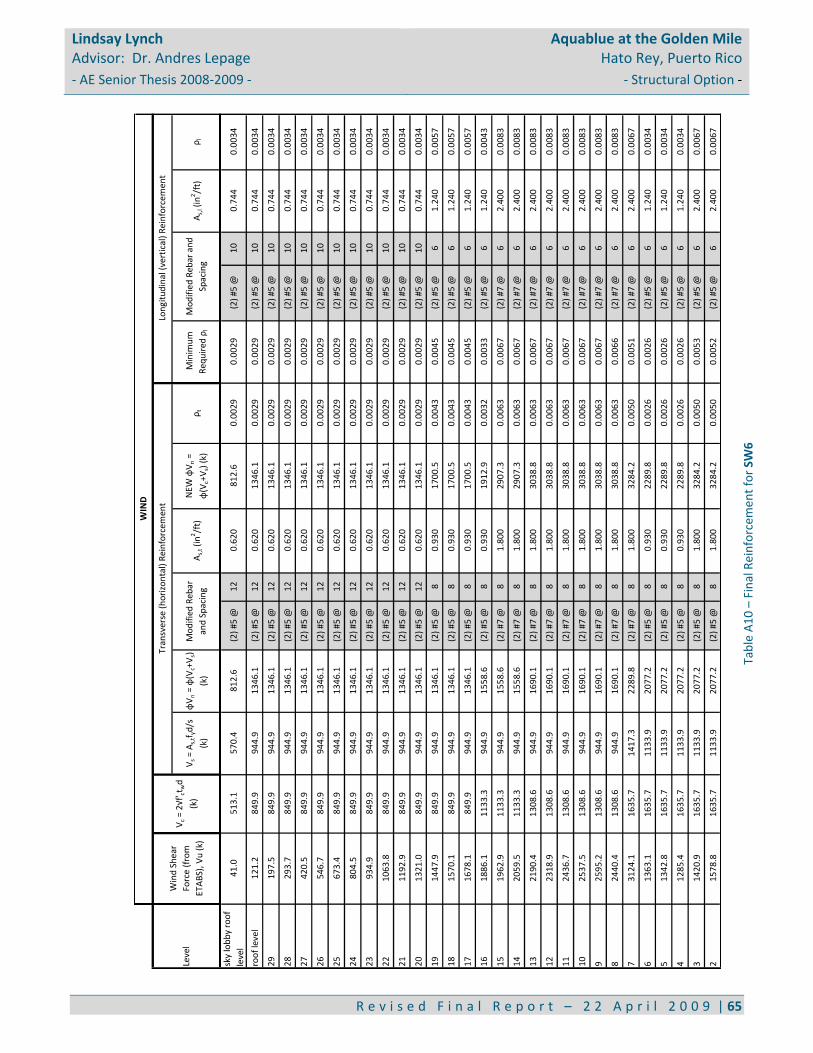
Lindsay Lynch Advisor: Dr. Andres Lepage ‐ AE Senior Thesis 2008‐2009 ‐
Aquablue at the Golden MileHato Rey, Puerto Rico
‐ Structural Option ‐
R e v i s e d F i n a l R e p o r t – 2 2 A p r i l 2 0 0 9 | 65
V s = A
s,tf yd/s
(k)
φV n = φ(V
c+V s)
(k)
As,t (in
2 /ft)
NEW
φV n =
φ(V
c+V s) (k)
ρ t
Minim
um
Requ
ired ρ l
As,l (in
2 /ft)
ρ l
sky lobb
y roof
level
41.0
513.1
570.4
812.6
(2) #
5 @
120.620
812.6
0.00
290.0029
(2) #5 @
100.74
40.0034
roof level
121.2
849.9
944.9
1346.1
(2) #
5 @
120.620
1346
.10.00
290.0029
(2) #5 @
100.74
40.0034
29197.5
849.9
944.9
1346.1
(2) #
5 @
120.620
1346
.10.00
290.0029
(2) #5 @
100.74
40.0034
28293.7
849.9
944.9
1346.1
(2) #
5 @
120.620
1346
.10.00
290.0029
(2) #5 @
100.74
40.0034
27420.5
849.9
944.9
1346.1
(2) #
5 @
120.620
1346
.10.00
290.0029
(2) #5 @
100.74
40.0034
26546.7
849.9
944.9
1346.1
(2) #
5 @
120.620
1346
.10.00
290.0029
(2) #5 @
100.74
40.0034
25673.4
849.9
944.9
1346.1
(2) #
5 @
120.620
1346
.10.00
290.0029
(2) #5 @
100.74
40.0034
24804.5
849.9
944.9
1346.1
(2) #
5 @
120.620
1346
.10.00
290.0029
(2) #5 @
100.74
40.0034
23934.9
849.9
944.9
1346.1
(2) #
5 @
120.620
1346
.10.00
290.0029
(2) #5 @
100.74
40.0034
221063
.8849.9
944.9
1346.1
(2) #
5 @
120.620
1346
.10.00
290.0029
(2) #5 @
100.74
40.0034
211192
.9849.9
944.9
1346.1
(2) #
5 @
120.620
1346
.10.00
290.0029
(2) #5 @
100.74
40.0034
201321
.0849.9
944.9
1346.1
(2) #
5 @
120.620
1346
.10.00
290.0029
(2) #5 @
100.74
40.0034
191447
.9849.9
944.9
1346.1
(2) #
5 @
80.930
1700
.50.00
430.0045
(2) #5 @
61.24
00.0057
181570
.1849.9
944.9
1346.1
(2) #
5 @
80.930
1700
.50.00
430.0045
(2) #5 @
61.24
00.0057
171678
.1849.9
944.9
1346.1
(2) #
5 @
80.930
1700
.50.00
430.0045
(2) #5 @
61.24
00.0057
161886
.11133
.3944.9
1558.6
(2) #
5 @
80.930
1912
.90.00
320.0033
(2) #5 @
61.24
00.0043
151962
.91133
.3944.9
1558.6
(2) #
7 @
81.800
2907
.30.00
630.0067
(2) #7 @
62.40
00.0083
142059
.51133
.3944.9
1558.6
(2) #
7 @
81.800
2907
.30.00
630.0067
(2) #7 @
62.40
00.0083
132190
.41308
.6944.9
1690.1
(2) #
7 @
81.800
3038
.80.00
630.0067
(2) #7 @
62.40
00.0083
122318
.91308
.6944.9
1690.1
(2) #
7 @
81.800
3038
.80.00
630.0067
(2) #7 @
62.40
00.0083
112436
.71308
.6944.9
1690.1
(2) #
7 @
81.800
3038
.80.00
630.0067
(2) #7 @
62.40
00.0083
102537
.51308
.6944.9
1690.1
(2) #
7 @
81.800
3038
.80.00
630.0067
(2) #7 @
62.40
00.0083
92595
.21308
.6944.9
1690.1
(2) #
7 @
81.800
3038
.80.00
630.0067
(2) #7 @
62.40
00.0083
82440
.41308
.6944.9
1690.1
(2) #
7 @
81.800
3038
.80.00
630.0066
(2) #7 @
62.40
00.0083
73124
.11635
.71417
.322
89.8
(2) #
7 @
81.800
3284
.20.00
500.0051
(2) #7 @
62.40
00.0067
61363
.11635
.71133
.920
77.2
(2) #
5 @
80.930
2289
.80.00
260.0026
(2) #5 @
61.24
00.0034
51342
.81635
.71133
.920
77.2
(2) #
5 @
80.930
2289
.80.00
260.0026
(2) #5 @
61.24
00.0034
41285
.41635
.71133
.920
77.2
(2) #
5 @
80.930
2289
.80.00
260.0026
(2) #5 @
61.24
00.0034
31420
.91635
.71133
.920
77.2
(2) #
5 @
81.800
3284
.20.00
500.0053
(2) #5 @
62.40
00.0067
21578
.81635
.71133
.920
77.2
(2) #
5 @
81.800
3284
.20.00
500.0052
(2) #5 @
62.40
00.0067
Mod
ified
Rebar
and Spacing
Mod
ified
Reb
ar and
Spacing
Wind Shear
Force (from
ETABS), Vu
(k)
V c = 2√f' ct
wd
(k)
WIND
Level
Transverse (h
orizon
tal) Re
inforcem
ent
Longitu
dinal (vertical) R
einforcemen
t
Table A10
– Final Reinforcemen
t for SW6