willis re summary of natural cat events 2016 re summ… · willis re summary of natural cat events...
TRANSCRIPT

Willis Re Summary of Natural Cat
Events 2016
eVENT Natural Catastrophe Update
Economic impact and insured losses due to natural disasters
Volume 5 Issue 3

Natural catastrophes in 2016
Table of Contents
Table of Contents .......................................................................................................................................... 2
Major natural catastrophes in 2016 ............................................................................................................... 1
Other natural catastrophe events by peril and location .............................................................................. 30
Abbreviations ........................................................................................................................................... 40
Sources ................................................................................................................................................... 40
Apr
Apr
Typhoon Haima,
Oct
Wildfire
Tennessee, Nov
Thunderstorm
U.S.A., Nov
Typhoon
Sarika, Oct
Tropical
Cyclone
Vardah, Dec
Wildfire Israel,
Nov
Earthquake
Kaikoura, Nov
Typhoon
Chaba, Oct
Willis Re Natural Catastrophe Events 2016
2016
Thunderstorm
U.S.A., Nov
Earthquake
Italy, Oct
Hurricane
Matthew, Oct
Thunderstorm
Australia, Nov
Flood Louisiana,
Aug
Windstorm
Europe, May
Wildfire Canada,
May
Hailstorm U.S.A.,
Apr
Tornado U.S.A.,
Feb
Earthquake
Japan, Apr
Earthquake
Ecuador, Apr
Figure 1. Major natural catastrophes 2016 (Source of map: Willis Re SpatialKey application)

Natural catastrophes in 2016
Contact us
For further information, please contact
John E. Alarcon, PhD MSc
Executive Director,
Head of U.K. Catastrophe Analytics, APMETA
Willis Re
Willis Ltd I 51 Lime Street I London EC3M 7DQ
D +44 (0) 20 3124 8678
M +44 (0) 79 8352 6997
Ashish Harbindu, PhD MSc
Senior Technical Leader, MR&E
Willis Re
Willis Processing Services I Vikhroli (West) Mumbai –
400 079
D +91 22 6210 8511
Karl Jones
Managing Director
Catastrophe Analytics, Willis Re International
Willis Re
Willis Ltd I 51 Lime Street I London EC3M 7DQ
D +49 (0)89 54336 189
Vaughn Jensen
Executive Vice President
Catastrophe Analytics, Willis Re North America
Willis Re
7760 France Avenue South I Minneapolis, MN 55435
D +1 952 841 6641
With special thanks to the eVENT™ response team:
Meenakshi Verma (Mumbai) | Thomas Kiessling (Germany) | Giorgis Hadzilacos (London) | Adam Cannig
(Miami) | Roy Cloutier (U.S.A.) | Prasad Gunturi (U.S.A.)
willistowerswatson.com I willisre.com
January 2017
eVENT™ Natural catastrophes in 2016 1
Major natural catastrophes in 2016
This report summarizes the economic and insured losses from the most relevant natural
catastrophe events that occurred during 2016. The loss values presented include those reported
by Willis Re, catastrophe model vendors, reinsurance companies and third party organizations.
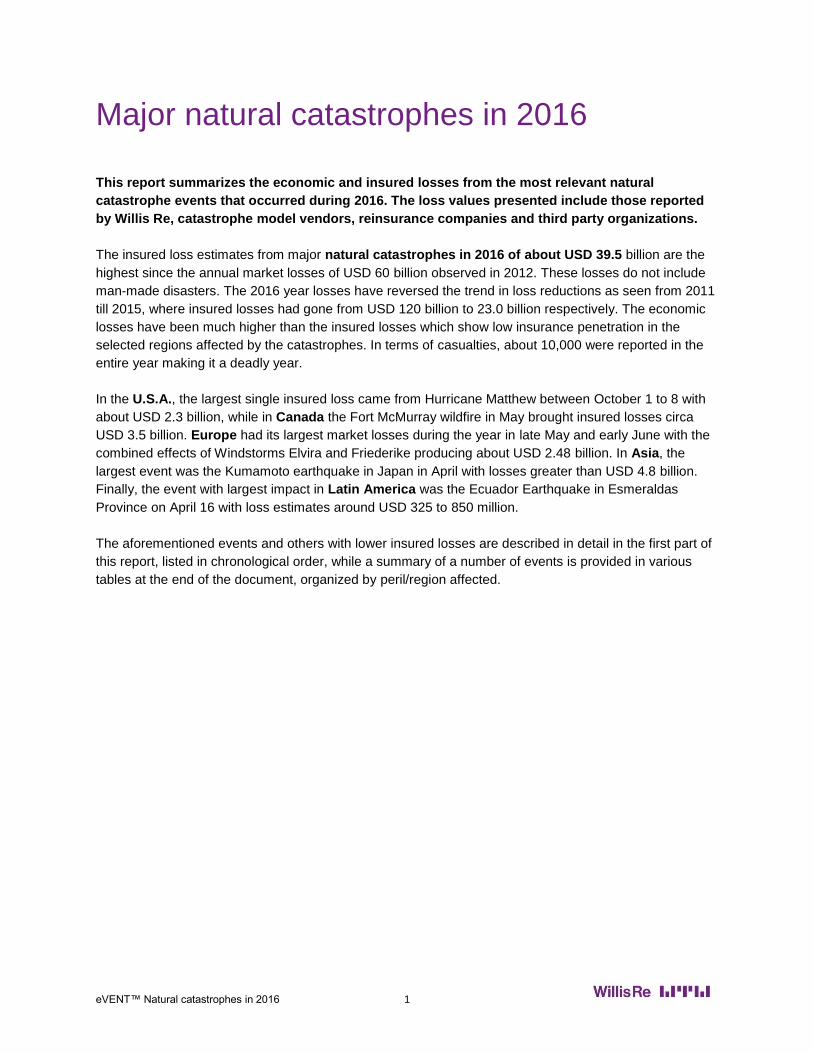
The insured loss estimates from major natural catastrophes in 2016 of about USD 39.5 billion are the
highest since the annual market losses of USD 60 billion observed in 2012. These losses do not include
man-made disasters. The 2016 year losses have reversed the trend in loss reductions as seen from 2011
till 2015, where insured losses had gone from USD 120 billion to 23.0 billion respectively. The economic
losses have been much higher than the insured losses which show low insurance penetration in the
selected regions affected by the catastrophes. In terms of casualties, about 10,000 were reported in the
entire year making it a deadly year.
In the U.S.A., the largest single insured loss came from Hurricane Matthew between October 1 to 8 with
about USD 2.3 billion, while in Canada the Fort McMurray wildfire in May brought insured losses circa
USD 3.5 billion. Europe had its largest market losses during the year in late May and early June with the
combined effects of Windstorms Elvira and Friederike producing about USD 2.48 billion. In Asia, the
largest event was the Kumamoto earthquake in Japan in April with losses greater than USD 4.8 billion.
Finally, the event with largest impact in Latin America was the Ecuador Earthquake in Esmeraldas
Province on April 16 with loss estimates around USD 325 to 850 million.
The aforementioned events and others with lower insured losses are described in detail in the first part of
this report, listed in chronological order, while a summary of a number of events is provided in various
tables at the end of the document, organized by peril/region affected.
eVENT™ Natural catastrophes in 2016 2
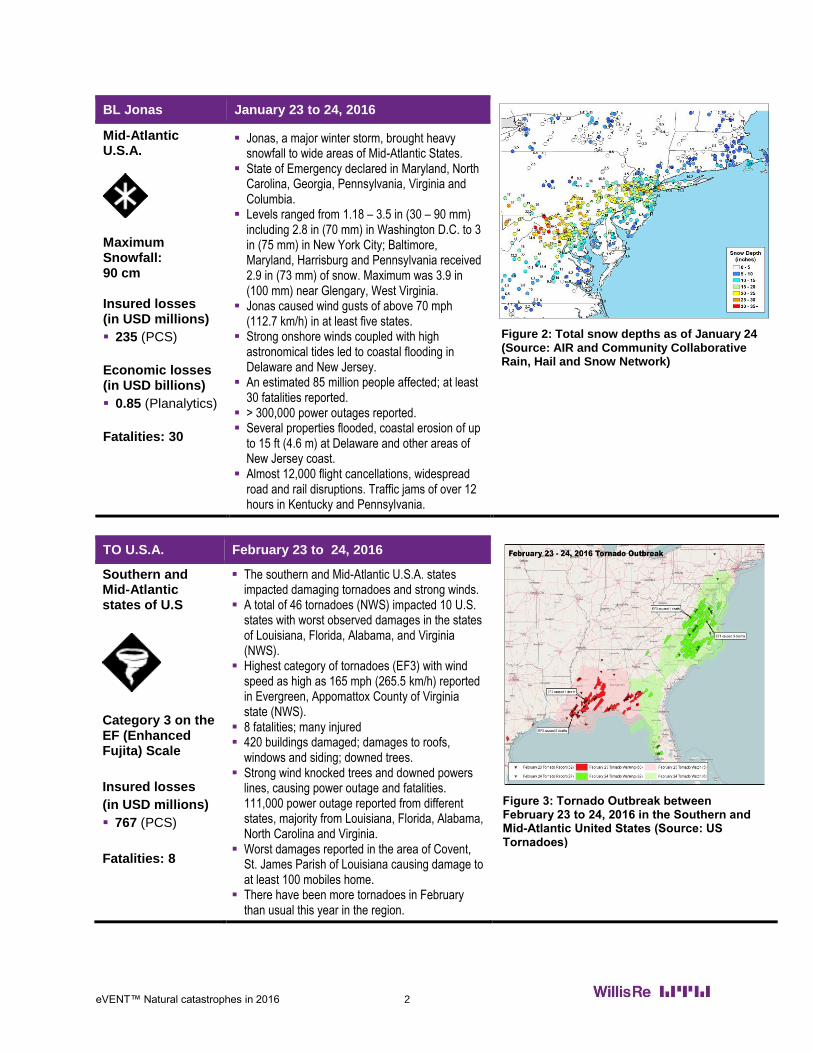
BL Jonas January 23 to 24, 2016
Mid-Atlantic U.S.A.
Maximum Snowfall: 90 cm Insured losses (in USD millions)
235 (PCS)
Economic losses (in USD billions)
0.85 (Planalytics)
Fatalities: 30
Jonas, a major winter storm, brought heavy snowfall to wide areas of Mid-Atlantic States.
State of Emergency declared in Maryland, North Carolina, Georgia, Pennsylvania, Virginia and Columbia.
Levels ranged from 1.18 – 3.5 in (30 – 90 mm) including 2.8 in (70 mm) in Washington D.C. to 3 in (75 mm) in New York City; Baltimore, Maryland, Harrisburg and Pennsylvania received 2.9 in (73 mm) of snow. Maximum was 3.9 in (100 mm) near Glengary, West Virginia.
Jonas caused wind gusts of above 70 mph (112.7 km/h) in at least five states.
Strong onshore winds coupled with high astronomical tides led to coastal flooding in Delaware and New Jersey.
An estimated 85 million people affected; at least 30 fatalities reported.
> 300,000 power outages reported. Several properties flooded, coastal erosion of up
to 15 ft (4.6 m) at Delaware and other areas of New Jersey coast.
Almost 12,000 flight cancellations, widespread road and rail disruptions. Traffic jams of over 12 hours in Kentucky and Pennsylvania.
TO U.S.A. February 23 to 24, 2016
Southern and Mid-Atlantic states of U.S
Category 3 on the EF (Enhanced Fujita) Scale
Insured losses
(in USD millions)
767 (PCS)
Fatalities: 8
The southern and Mid-Atlantic U.S.A. states impacted damaging tornadoes and strong winds.
A total of 46 tornadoes (NWS) impacted 10 U.S. states with worst observed damages in the states of Louisiana, Florida, Alabama, and Virginia (NWS).
Highest category of tornadoes (EF3) with wind speed as high as 165 mph (265.5 km/h) reported in Evergreen, Appomattox County of Virginia state (NWS).
8 fatalities; many injured 420 buildings damaged; damages to roofs,
windows and siding; downed trees. Strong wind knocked trees and downed powers
lines, causing power outage and fatalities. 111,000 power outage reported from different states, majority from Louisiana, Florida, Alabama, North Carolina and Virginia.
Worst damages reported in the area of Covent, St. James Parish of Louisiana causing damage to at least 100 mobiles home.
There have been more tornadoes in February than usual this year in the region.
Figure 2: Total snow depths as of January 24 (Source: AIR and Community Collaborative Rain, Hail and Snow Network)
Figure 3: Tornado Outbreak between February 23 to 24, 2016 in the Southern and Mid-Atlantic United States (Source: US Tornadoes)

eVENT™ Natural catastrophes in 2016 3
FL U.S.A. March 7 to 14, 2016
Louisiana, Texas, Arkansas, Mississippi
Insured losses
(in USD millions)
295 (PCS)
Fatalities: 6
March 7, 2016 brought on record breaking rainfall and flash flooding to Louisiana, Texas, Arkansas and Mississippi.
It was the result of upper level trough carrying moisture inland from the Eastern Pacific and the Gulf of Mexico.
The rainfall continued for days leading to massive floods ceasing finally on March 14.
Some areas received more than 20 in (500 mm) of rain.
Over a period of 72 hours, parts of Louisiana received 20 in (500 mm) of rain, Eastern Texas; Southeast Arkansas received 7.9 in (200 mm) of rain.
The water receding into rivers caused river flooding downstream in Mississippi, southern Louisiana and southeast Texas.
> 6 fatalities, > 4,900 rescued. In Texas around 10,000 people affected, including thousands evacuated.
> 11,000 properties in Louisiana, 1,600 homes in Mississippi, > 400 homes in Texas damaged due to flooding.
Dozens of roadways closed in the 3 states. Most due to river flooding.
Multiple bridges washed away in Texas. Severe weather, strong winds led to
cancelling of more than 150 flights in and out of Dallas – Fort Worth International Airport.
Figure 4: The distribution of rainfall from March 7 through 14, 2016 over the south central U.S. Purple indicates highest rainfall amounts (Source: NASA)

eVENT™ Natural catastrophes in 2016 4
HL U.S.A. March 13 to 18, 2016
Southern, Central, and Eastern states of U.S.A.
Insured losses
(in USD millions)
600 (ICT) 692 (PCS)
Fatalities: 0
Severe thunderstorm hit the areas of southern, central and eastern United States with hail and tornadoes.
Hail size as large as 3 in (76 mm) in diameter Worst impacted was the Fort Worth city area of
north central Texas. Other impacted areas include Arkansas,
Mississippi, Illinois, Iowa, and Louisiana. At least 40 homes damaged in Illinois. Over 50,000 vehicles damaged (ICT); storm
pounded cars and smashed windshields Hail also impacted Forth Worth Zoo, roof
damages to several businesses.
HL U.S.A. April 10 to 12, 2016
Southern States of U.S.A.
Insured losses
(in USD millions)
2688 (PCS)
Fatalities: 0
Costliest Hailstorm in Texas History. Severe weather brought large hail and strong
winds to several southern U.S. states, with parts of northern and southern Texas the worst affected.
Hailstones as large as 3.9 in (10 cm), wind speeds observed over 65 mph (104 km/h).
Some minor injuries reported in Wylie. Over 6,000 properties damaged in areas of
Antonio, Wylie and Plano. Hundreds of roof homes, as well around 90
solar panels, were damaged in Wylie. Parts of Montague County reported breaking of
exterior siding and windows. Over 15,000 vehicles damaged. Many vehicles traveling on highways sustained
hail damage resulting in at least 6 accidents causing injuries.
The San Antonio area of southern Texas was impacted by large size hail, which damaged thousands of cars, broke through windows and damaged roofs.
Figure 5: Catastrophic Hail Storm Impacts Fort Worth, Texas (Source: commericalclaimpro.com)
Figure 6: Radar detected hail activity on April 11, 2016 (Source: stormsite.com)

eVENT™ Natural catastrophes in 2016 5
EQ Japan April 16, 2016
Kumamoto Prefecture
Magnitude 7.0
Max. Intensity: IX – violent (MMI)
Insured losses
(in USD millions)
800 – 1200 (RMS)
1700 – 3200 (AIR)
Insured losses
(in USD billions)
4.8 (Willis Re) 2.9 (GIAJ)
Economic losses
(in USD billions)
5.5 – 7.5 (RMS) 10 (with 72%
probability, USGS)
Economic losses
(in JPY billions)
2400 – 4600 (www.japan.go.jp)
Fatalities: > 65
An earthquake of magnitude Mw 7.0 struck around .62 mi (1 km) west-northwest of the city of Kumamoto on the island of Kyushu, Japan, on April 16 at 00:25 local time impacting Kumamoto and Oita Prefectures.
Earthquake occurred as a result of strike-slip faulting at a shallow depth of 6.2 mi (10 km) on a crustal fault within the upper Eurasia plate; shallow earthquakes with a moderate or large magnitude are infrequent in Kyushu (USGS).
The earthquake occurred one day after a series of foreshocks in the same region, which included Mw 6.2 and Mw 6.0 earthquakes (USGS).
The earthquake induced extensive landslides in Kyushu Island including a major one in Minami-aso.
A moderate magnitude earthquake (Mw 6.2) considered as foreshock of the main earthquake (April 15, 2016 EQ Mw 7.0) occurred April 14, at 9:26 p.m. local time at an estimated depth of 14 mi (22.5 km) with epicenter near the town of Mashiki in Kumamoto Prefecture (USGS).
> 65 fatalities and 1,400 injuries reported; this may include fatalities from April 14, 2016 Mw 6.2 events (FDMA).
> 1,952 houses completely collapsed; > 9,291 partially damaged, additionally, around 445 public buildings suffered some damage (FDMA).
Almost all of the residential building damage occurred in Kumamoto Prefecture, although Fukuoka, Oita, and Miyazaki prefectures also experienced some damage.
The two quakes caused power and water outages; damage to highways, bridges, and other infrastructure; short-term cancellation of some airline and train service; and significant supply-chain and production interruption for regional industries.
Japan Rail suspended all operations on the Kyushu Shinkansen (bullet train) line as the ground shaking caused a train to derail on the line.
Landslide triggered by earthquake caused blockage in many highways and rail lines.
The earthquake also impacted a number of manufacturing plants in Kumamoto City, including Toyota Motor Corp., Honda Motor Co., Mitsubishi Electric Corp., Fujifilm Holdings Corporation, Suntory Holdings Ltd., Sony Corp., and Renesas Electronics Corp., which is likely to cause a significant drop in production.
Figure 7: The April 15 Kumamoto, Japan Earthquake (Source: USGS)
eVENT™ Natural catastrophes in 2016 6
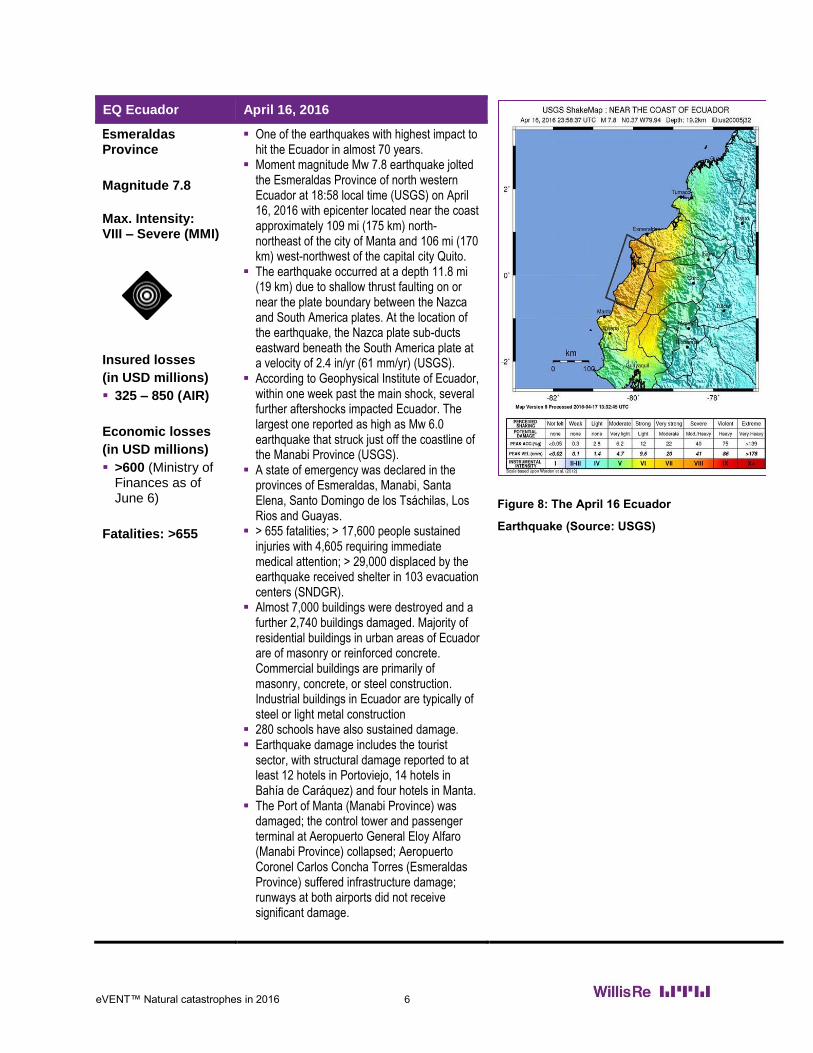
EQ Ecuador April 16, 2016
Esmeraldas Province
Magnitude 7.8
Max. Intensity: VIII – Severe (MMI)
Insured losses
(in USD millions)
325 – 850 (AIR)
Economic losses
(in USD millions)
>600 (Ministry of Finances as of June 6)
Fatalities: >655
One of the earthquakes with highest impact to hit the Ecuador in almost 70 years.
Moment magnitude Mw 7.8 earthquake jolted the Esmeraldas Province of north western Ecuador at 18:58 local time (USGS) on April 16, 2016 with epicenter located near the coast approximately 109 mi (175 km) north-northeast of the city of Manta and 106 mi (170 km) west-northwest of the capital city Quito.
The earthquake occurred at a depth 11.8 mi (19 km) due to shallow thrust faulting on or near the plate boundary between the Nazca and South America plates. At the location of the earthquake, the Nazca plate sub-ducts eastward beneath the South America plate at a velocity of 2.4 in/yr (61 mm/yr) (USGS).
According to Geophysical Institute of Ecuador, within one week past the main shock, several further aftershocks impacted Ecuador. The largest one reported as high as Mw 6.0 earthquake that struck just off the coastline of the Manabi Province (USGS).
A state of emergency was declared in the provinces of Esmeraldas, Manabi, Santa Elena, Santo Domingo de los Tsáchilas, Los Rios and Guayas.
> 655 fatalities; > 17,600 people sustained injuries with 4,605 requiring immediate medical attention; > 29,000 displaced by the earthquake received shelter in 103 evacuation centers (SNDGR).
Almost 7,000 buildings were destroyed and a further 2,740 buildings damaged. Majority of residential buildings in urban areas of Ecuador are of masonry or reinforced concrete. Commercial buildings are primarily of masonry, concrete, or steel construction. Industrial buildings in Ecuador are typically of steel or light metal construction
280 schools have also sustained damage. Earthquake damage includes the tourist
sector, with structural damage reported to at least 12 hotels in Portoviejo, 14 hotels in Bahía de Caráquez) and four hotels in Manta.
The Port of Manta (Manabi Province) was damaged; the control tower and passenger terminal at Aeropuerto General Eloy Alfaro (Manabi Province) collapsed; Aeropuerto Coronel Carlos Concha Torres (Esmeraldas Province) suffered infrastructure damage; runways at both airports did not receive significant damage.
Figure 8: The April 16 Ecuador
Earthquake (Source: USGS)

eVENT™ Natural catastrophes in 2016 7
FL U.S.A. April 17 to 21, 2016
Houston, Texas
Insured losses
(in USD millions)
4.0 (ICT)
Fatalities: 8
Most severe flood for Houston since tropical storm Allison in 2001.
Heavy rainfall on April 17 to April 21 triggered flash flooding then river flooding in south east Texas.
Characterized by extremely heavy rainfall over a short period leading to surface flooding. Houston contains minimal water absorption capacity due to paved surfaces leading to flash floods.
The event caused by a low pressure system getting stuck behind a blocking high over the East and Great Lakes.
Water levels 9.8 – 15 ft (3.0 – 4.6 m) deep in some parts during peak flooding. Harris County received 6 in (152 mm) of rain; some parts receiving more than 12 in (305 mm). Houston International Airport recorded 10 in (252 mm) of rain.
8 fatalities reported. Over 1,200 people rescued from floodwaters.
> 270,000 people without power. Harris County worst affected with over 6,700
homes flooded. Another 300 homes damaged in Waller County.
Significant transport disruption due to the floods. Another 1,000 flights cancelled.
TS U.S.A. April 29 to May 3, 2016
Plains and Midwest, Southeast, and Mid-Atlantic of U.S.A.
Insured losses
(in USD millions)
753.0 (PCS)
Fatalities: 6
Powerful thunderstorm and torrential rain caused widespread damage across Texas, Louisiana, Arkansas, Oklahoma and Mississippi.
Heavy rain 6 to 9 in (152 – 229 mm) caused significant flooding in southern Louisiana.
6 fatalities reported, of which 5 were the result of flooding in eastern Texas.
Windows of few homes were blown out due to high wind gust (75 mph/121 km/h) in Bastrop County.
Some trees were downed in the far north Houston metro area in Montgomery and northern Harris Counties.
Reports of cars submerged in some parts. High speed wind gust (60 mph/96.6 km/h)
shifted and damaged two planes at Austin-Bergstrom International Airport
Figure 9: Map representing total rainfall on Monday, April 18, 2016 (Source: NWS))
Figure 10: Thunderstorm report on April 29 (Source: SPC, NOAA)
eVENT™ Natural catastrophes in 2016 8
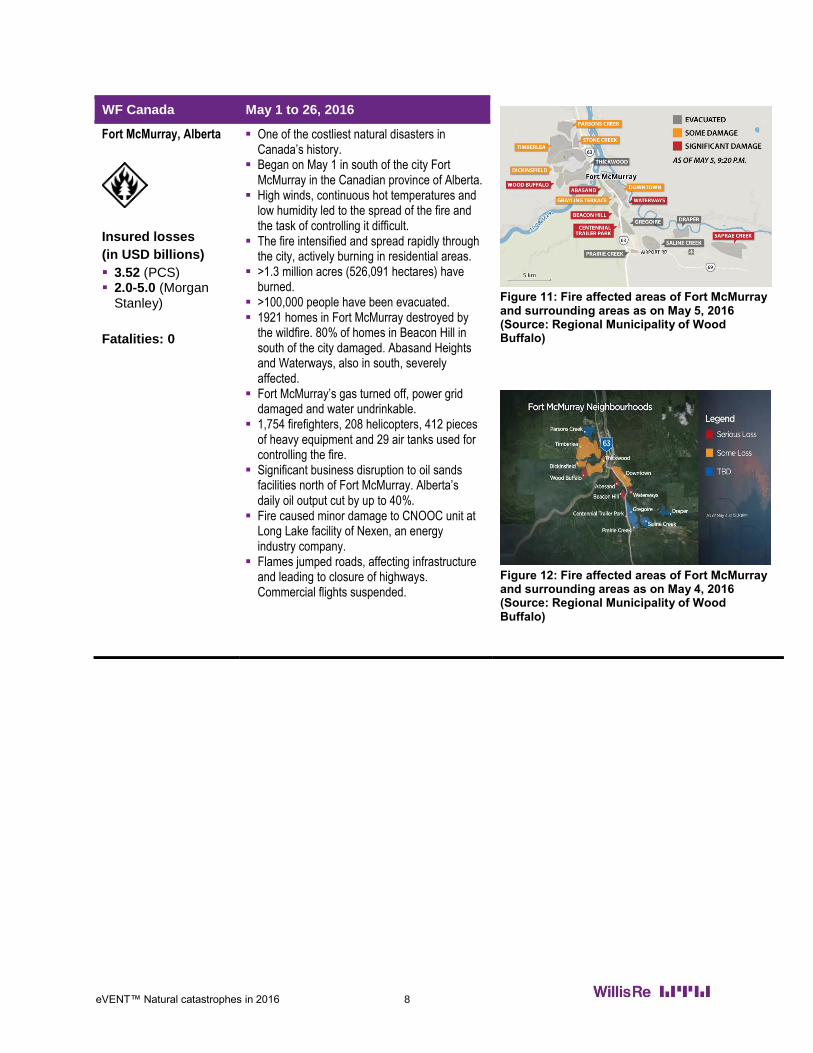
WF Canada May 1 to 26, 2016
Fort McMurray, Alberta
Insured losses
(in USD billions)
3.52 (PCS) 2.0-5.0 (Morgan
Stanley)
Fatalities: 0
One of the costliest natural disasters in Canada’s history.
Began on May 1 in south of the city Fort McMurray in the Canadian province of Alberta.
High winds, continuous hot temperatures and low humidity led to the spread of the fire and the task of controlling it difficult.
The fire intensified and spread rapidly through the city, actively burning in residential areas.
>1.3 million acres (526,091 hectares) have burned.
>100,000 people have been evacuated. 1921 homes in Fort McMurray destroyed by
the wildfire. 80% of homes in Beacon Hill in south of the city damaged. Abasand Heights and Waterways, also in south, severely affected.
Fort McMurray’s gas turned off, power grid damaged and water undrinkable.
1,754 firefighters, 208 helicopters, 412 pieces of heavy equipment and 29 air tanks used for controlling the fire.
Significant business disruption to oil sands facilities north of Fort McMurray. Alberta’s daily oil output cut by up to 40%.
Fire caused minor damage to CNOOC unit at Long Lake facility of Nexen, an energy industry company.
Flames jumped roads, affecting infrastructure and leading to closure of highways. Commercial flights suspended.
Figure 11: Fire affected areas of Fort McMurray and surrounding areas as on May 5, 2016 (Source: Regional Municipality of Wood Buffalo)
Figure 12: Fire affected areas of Fort McMurray and surrounding areas as on May 4, 2016 (Source: Regional Municipality of Wood Buffalo)
Figure 14
eVENT™ Natural catastrophes in 2016 9
WS Elvira
+Friederike May 28 to June 5, 2016
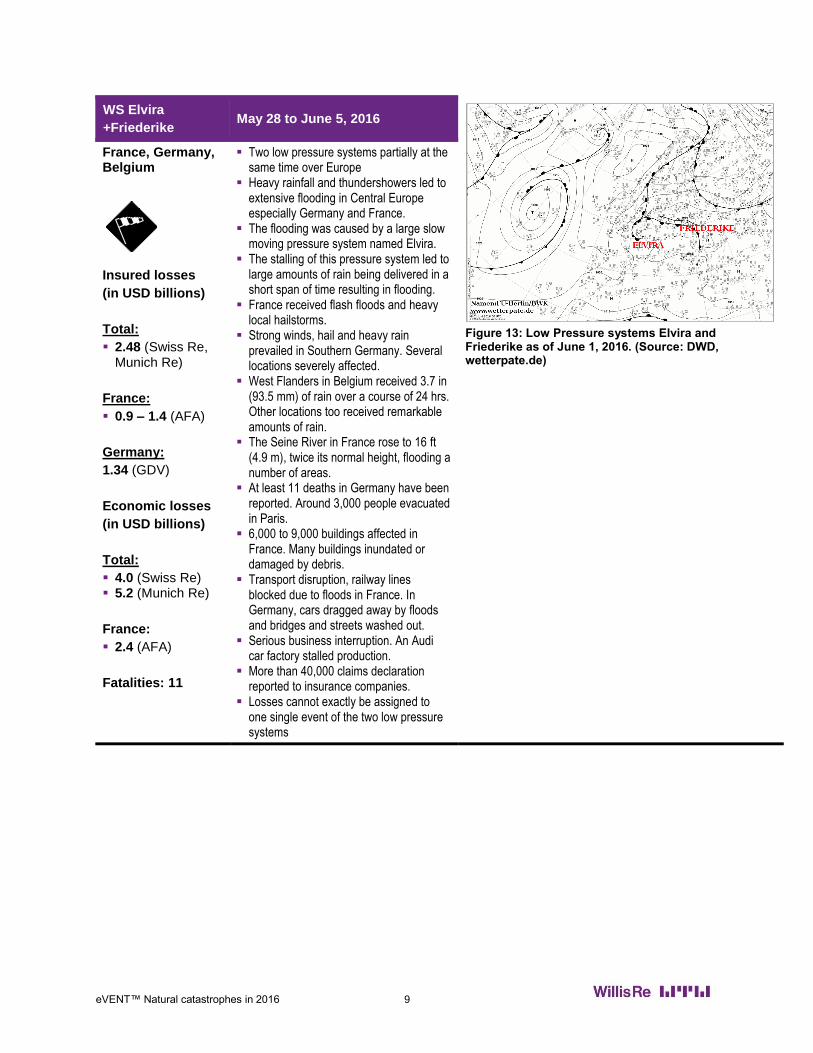
Figure 13: Low Pressure systems Elvira and Friederike as of June 1, 2016. (Source: DWD, wetterpate.de)
France, Germany, Belgium
Insured losses
(in USD billions)
Total:
2.48 (Swiss Re, Munich Re)
France:
0.9 – 1.4 (AFA)
Germany:
1.34 (GDV)
Economic losses
(in USD billions)
Total:
4.0 (Swiss Re) 5.2 (Munich Re)
France:
2.4 (AFA)
Fatalities: 11
Two low pressure systems partially at the same time over Europe
Heavy rainfall and thundershowers led to extensive flooding in Central Europe especially Germany and France.
The flooding was caused by a large slow moving pressure system named Elvira.
The stalling of this pressure system led to large amounts of rain being delivered in a short span of time resulting in flooding.
France received flash floods and heavy local hailstorms.
Strong winds, hail and heavy rain prevailed in Southern Germany. Several locations severely affected.
West Flanders in Belgium received 3.7 in (93.5 mm) of rain over a course of 24 hrs. Other locations too received remarkable amounts of rain.
The Seine River in France rose to 16 ft (4.9 m), twice its normal height, flooding a number of areas.
At least 11 deaths in Germany have been reported. Around 3,000 people evacuated in Paris.
6,000 to 9,000 buildings affected in France. Many buildings inundated or damaged by debris.
Transport disruption, railway lines blocked due to floods in France. In Germany, cars dragged away by floods and bridges and streets washed out.
Serious business interruption. An Audi car factory stalled production.
More than 40,000 claims declaration reported to insurance companies.
Losses cannot exactly be assigned to one single event of the two low pressure systems
eVENT™ Natural catastrophes in 2016 10
FL China June 18 to 23, 2016
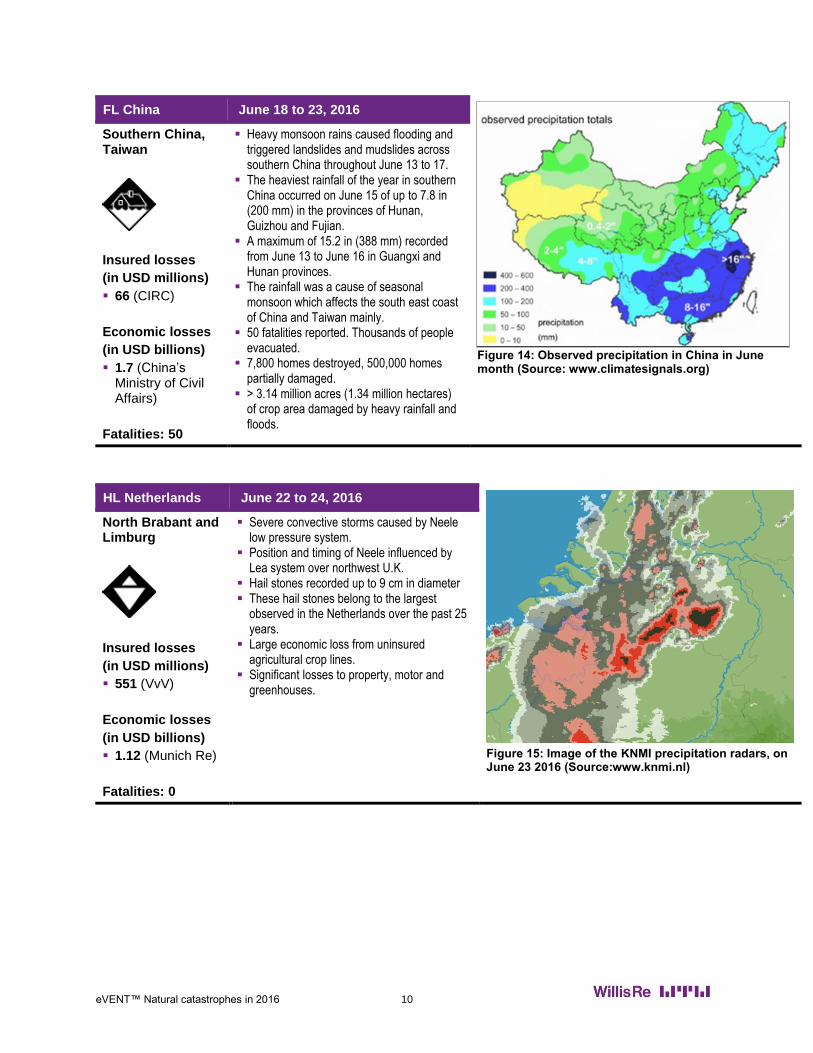
Figure 14: Observed precipitation in China in June month (Source: www.climatesignals.org)
Southern China, Taiwan
Insured losses
(in USD millions)
66 (CIRC)
Economic losses
(in USD billions)
1.7 (China’s Ministry of Civil Affairs)
Fatalities: 50
Heavy monsoon rains caused flooding and triggered landslides and mudslides across southern China throughout June 13 to 17.
The heaviest rainfall of the year in southern China occurred on June 15 of up to 7.8 in (200 mm) in the provinces of Hunan, Guizhou and Fujian.
A maximum of 15.2 in (388 mm) recorded from June 13 to June 16 in Guangxi and Hunan provinces.
The rainfall was a cause of seasonal monsoon which affects the south east coast of China and Taiwan mainly.
50 fatalities reported. Thousands of people evacuated.
7,800 homes destroyed, 500,000 homes partially damaged.
> 3.14 million acres (1.34 million hectares) of crop area damaged by heavy rainfall and floods.
HL Netherlands June 22 to 24, 2016
Figure 15: Image of the KNMI precipitation radars, on June 23 2016 (Source:www.knmi.nl)
North Brabant and Limburg
Insured losses
(in USD millions)
551 (VvV)
Economic losses
(in USD billions)
1.12 (Munich Re)
Fatalities: 0
Severe convective storms caused by Neele low pressure system.
Position and timing of Neele influenced by Lea system over northwest U.K.
Hail stones recorded up to 9 cm in diameter These hail stones belong to the largest
observed in the Netherlands over the past 25 years.
Large economic loss from uninsured agricultural crop lines.
Significant losses to property, motor and greenhouses.

eVENT™ Natural catastrophes in 2016 11
FL U.S.A. June 23 to 25, 2016
Figure 16: Rainfall in West Virginia, 24 hour from 23 to 24 June 2016 (source: NOAA)
West Virginia
Insured losses
(in USD millions)
122 (PCS)
Fatalities: >20
Heavy rainfall on June 23 to24 led to flash flooding in West Virginia.
The flooding is the third deadliest flood event on record for the state.
Flooding caused due to rainfall on a mountainous region which drained down into the valleys thereby flooding communities, either by surface flooding or by river flooding.
State of emergency declared in 44 counties.
> 20 fatalities, around 500 people stranded after a bridge being washed away.
Approximately 1,200 homes were affected. 14 businesses destroyed.
Over 58,000 homes without power Several counties experienced damage to
water infrastructure. Old White TPC golf course suffered damage leading to PGA tour being cancelled.

eVENT™ Natural catastrophes in 2016 12
TY Nepartak July 3 to 9, 2016
Figure 17: Super typhoon Nepartak track.
(Source: HKO)
Taitung County, Taiwan;
Fujian, China
Category 5 (SSHWS)
Category 2-4 at landfall
Economic losses
(in USD millions)
24.1 (Taiwan Council of Agriculture)
Fatalities:
China:
85
Taiwan:
3
Tropical cyclone Nepartak formed on July 3 in the West Pacific around 267 miles (430 km) south of Guam. It gained strength and became a typhoon of category 2 on the Saffir – Simpson Hurricane Wind Scale (SSHWS) on July 5.
Super typhoon Nepartak rapidly intensified overnight to a category 5 storm due to light wind shear and very warm ocean temperatures over the Philippine Sea with maximum sustained winds of 175 mph (280 km/h).
Nepartak made landfall on Taitung County, southeast Taiwan on July 8 at around 07:00 local time with varying intensity from category 2 to category 4 on the SSHWS.
It then made a second landfall over Fujian province in southeast China as a tropical storm at around 11:00 local time with maximum sustained winds of 50 – 55 mph (85-90 km/h).
Taiwan received heavy rainfall amidst the lingering southwest airflow from the system. China received 5.9 – 11.4 in (150 – 290 mm)of rain between July 9 – 10.
85 people killed in China, 3 people in Taiwan and thousands injured.
> 25 million people evacuated in China and 17,396 evacuated in Taiwan.
In China, nearly 2,300 houses collapsed and 15,000 others damaged, mostly due to flooding. In Taiwan, > 545,000 houses without power, 24,500 without running water.
Streets inundated with floodwaters, blocked with large boulders, bridges washed away in China. Nearly 1,836 trees and signboards downed in Taiwan.
59.2 million acres (24.1 million hectares) of crops damaged in China, Taiwan’s agricultural sector suffered damages of 678 million Taiwanese dollars (USD 21.1 million).
Taiwan railways suspended services. > 600 domestic and international flights cancelled. 390 flights cancelled in Fujian Province, China.

eVENT™ Natural catastrophes in 2016 13
FL South Africa July 24 to 26, 2016
Figure 18: Rainfall affecting coastal areas of South Africa (Source: Met Office, U.K.)
KwaZulu-Natal, Eastern Cape and Western Cape provinces, South Africa
Fatalities: 5
Heavy rain from July 24 to 26 caused flooding in the KwaZulu-Natal, Eastern Cape and Western Cape provinces of South Africa.
Flooding was a result of heavy rain and led to mudslides with rivers bursting from their banks.
Maximum rainfall accumulations of 10.7 in (272.6 mm) were recorded in Margate, KwaZulu-Natal province.
Intense rainfall of 2 in/hr (52 mm/hr) recorded in Barkley East, Eastern Cape which was a record for the region.
Gale force winds of 40 – 60 mph (65 – 75 km/h) recorded along the southern coastlines of the Eastern and Western Cape provinces.
5 deaths, > 10,000 people affected. Around 2,300 buildings in informal settlements
flooded in Cape Town. Buildings flooded in Durban. 1,500 structures affected in Philippi and 800 in Khayelitsha.
Relief being provided in the form of hot meals, blankets and flood kits.
More than 500 insurance claims for damage to residential and commercial property in Durban.
Main roads and railway lines flooded.
HL Wyoming July 27, 2016
Figure 19: NWS Filtered Storm Reports for July 27 (Source: SPC, NOAA)
Wyoming, Pine Bluffs,
Nebraska, Minnesota, Wisconsin, Montana, South Dakota, Colorado, Kansas, North Carolina
Insured losses
(in USD millions)
704 (PCS)
Fatalities: 0
Severe weather brought a hailstorm to southeast Wyoming with Pine Bluffs facing the worst.
Maximum hail size reported was 3 in (7.6 cm) in Minnesota. The maximum hail size in Pine Bluffs was 1.75 in (4.4 cm).
No fatalities or injuries reported. Around 500 homes damaged in Pine Bluffs.
Buildings damaged in Cheyenne, capital of Wyoming and one home damaged in Bushnell in Nebraska.
Damage to vehicles in Pine Bluffs and Cheyenne.
Widespread crop damage occurred in Pine Bluffs. Number of trees toppled.

eVENT™ Natural catastrophes in 2016 14
TY Nida July 30 to August 3, 2016
Figure 20: Typhoon Nida Track (Source: HKO)
China, Hong Kong
Category 1-2 at landfall (SSHWS)
Economic losses
(in USD millions)
122.18 (Ministry of Civil Affairs)
Fatalities: 0
Tropical storm Nida formed on July 30 and made landfall near Shenzhen over Guangdong Province on China’s southeast coast at around 04:00 local time on August 2. Landfall intensity varied from category 1 to category 2 storms on the Saffir-Simpson Hurricane Wind Scale.
Rainfall accumulations of 7.8 in – 11.8 in (198 mm – 300 mm) recorded in Guangdong Pearl River Delta region. Hong Kong received rainfall of 4.8 in (122 mm).
68.2 million people affected, 6.9 million people evacuated and > 2,200 people given emergency life assistance.
Nearly 2,000 workers constructing the Hong Kong – Zhuhai – Macau Bridge were evacuated and more 2,000 others working on an offshore oil platform were relocated.
Approximately 600 houses destroyed and 3,200 houses damaged.
More than 7,907 acres (3200 hectares) of crops destroyed.
Fallen trees, lamp ports and signs caused traffic delays.
All production and school classes suspended. > 220 flights from Shenzhen and Zhuhai ,
cancelled. 180 flights cancelled from Hong Kong airport. Hundreds of trains delayed or cancelled.
FL U.S.A. July 30, 2016
Figure 21: Rainfall in Ellicott City, July 30 2016 (Source: NOAA)
Maryland and
New Jersey
Insured losses
(in USD millions)
122.5 (PCS)
Fatalities: 2
Heavy rainfall and thunderstorms triggered flash flooding in parts of Maryland and New Jersey
Rainfall levels of approximately 6.5 in (165.1 mm) recorded across Maryland on July 30, equivalent to a 1 in 1,000 year event. 5 in (127 mm) of rain fell in New Jersey in a span of 3 hours which led to flooding.
State of emergency declared in both Maryland and New Jersey.
2 fatalities, more than 100 rescued in Maryland. In Maryland > 13,000 homes were without
power. > 19,000 homes without power in New Jersey.
In Maryland > 200 buildings damaged, with 20-30 significantly so and five destroyed.
Parts of Main Street in Maryland collapsed, 170 vehicles swept away. In New Jersey, roads were flooded and became impassable.
Newark Liberty International airport cancelled around 92 flights along with delays.

eVENT™ Natural catastrophes in 2016 15
HU Earl August 2 to 6, 2016
Figure 22: NHC Advisory on August 5 (Source: NOAA)
Mexico, Belize, Central America and Caribbean
Category 1 at landfall (SSHWS)
Insured losses
(in USD millions)
50-150 (AIR) 25 (Willis Re)
Economic losses
(in USD millions)
183.6 (Government of Belize)
Fatalities: 51
Hurricane Earl originated in the Caribbean Sea on August 2 at around 12:00 local time.
It made first landfall over Belize at around 06:00 UTC as a category 1 storm on the Saffir Simpson Hurricane Wind Scale (SSHWS).
It crossed the Gulf of Mexico and made a second landfall on August 6 over southeast of Veracruz City, Mexico. Due to the high terrain of Mexico, the storm dissipated on August 6.
Mexico received 100 200 mm (4 8 in) of rain. Belize City flooded due to storm surge of
about 3 5 ft (1 2 m). Honduras too hit by heavy rains.
51 fatalities reported. Most due to mudslides. > 15 injuries.
In Mexico an entire hill collapsed onto a village damaging > 200 houses. Mudslides buried hillsides, trees fell and buildings collapsed.
In Belize, most households without power, roofs blown off, power lines were down, trees uprooted.
Bridges swept off, utility poles downed. Schools, colleges and commercial airports
closed.

eVENT™ Natural catastrophes in 2016 16
FL Louisiana August 12 to 14, 2016
Figure 23: NWS Estimated Rainfall on August 12 (Source: RMS)
Louisiana, U.S.A.
Insured losses
(in USD millions)
1,058.17(PCS)
Fatalities: 13
Heavy rainfall in the early hours of August 12 caused widespread river flooding across 20 parishes in Louisiana.
Led to the breaking of several river records. Amite river in Magnolia exceeded its previous flood record by 6 ft (1.8 m).
The rainfall was caused due to a slow moving low pressure system across Southern Louisiana and the Gulf of Mexico leading to high rainfall in a relatively smaller area.
The worst affected parishes were Livingston, Ascension, East and West Baton rouge and Tangipahoa.
Large parts of south eastern Louisiana received over 10 in (250 mm) of rain in a 48 hour period, with the highest record being 31 in (780 mm) in Watson, Louisiana.
Emergencies declared in the 20 parishes across Louisiana.
At least 13 people confirmed dead. > 30,000 rescued.
64,000 homes flooded across Louisiana. 75% of homes, equivalent to 39,000 properties, at a loss in Livingston. > 15,000 homes flooded in Ascension parish. > 7,500 buildings flooded in Tangipahoa parish.
>200 roads closed due to flooding. Significant number of bridges damaged.
Schools and offices closed down.

eVENT™ Natural catastrophes in 2016 17
WF California August 13 to 22, 2016
Figure 24: Fire perimeter (Source: RMS)
Kenwood Avenue, San Luis Obispo County, Lake County
Fatalities: 0
The event was a result of three large wildfires which have burned over 68,000 acres (27,518 hectares) of land across California.
The Bluecut wildfire started on August 16 at around 10:30 local time in the Cajon Pass near Kenwood Avenue. The Chimney Wildfire started on August 13 in San Luis Obispo County. The Clayton Fire started in Lake County.
All of the wildfires were triggered and spread rapidly due to dry surface fuel, strong winds, high temperatures and low humidity.
Extreme high temperatures of above 38 degrees Celsius hampered the attempts at controlling the wildfire.
> 82,640 people were evacuated in case of the Bluecut fire. Evacuations ordered in case of both Clayton and Chimney fires.
In the Bluecut fire, over 100 homes and over 200 outbuildings were destroyed while eight structuressustained damage. The Chimney wildfire has destroyed 45 structures and damaged seven, >1000 at risk. Clayton wildfire led to the destruction of 300 structures, > 316 buildings at risk.
Transport services severely hit.
TS Dianmu August 17 to 20, 2016
Figure 25: TS Dianmu Track (Source: GDACS)
Guangdong Province, China; Haiphong and Ninh Binh Province, Vietnam
Fatalities: 9
Tropical storm Dianmu formed in the West Pacific on August 17 at 22:00 UTC and made landfall over Guangdong Province, China after 08:00 UTC on August 18. It made a second landfall over Haiphong and Ninh Binh Province in northern Vietnam at 14:00 local time on August 19 with maximum sustained winds of 90 km/h.
Hainan province has been majorly affected by the storm. Guangdong wasn’t highly affected despite the landfall.
9 people killed in Vietnam and 8 others injured due to landslides, flash floods and collapsing houses.
40,000 people evacuated in Hainan, 35,000 people relocated in Zhanjiang. 2,100 households evacuated in Vietnam.
200 homes damaged in Hainan. 2,200 homes damaged, destroyed or flooded in Vietnam.
Red alert issued in the capital of Hainan, Haikou, due to the heavy rain leading to flooding. People in mountainous regions warned of flash flooding.
Uprooted trees causing disruption to transport in Vietnam.
14 small bridges destroyed in many sections of the national and provincial highways in Vietnam.
Public transport suspended. Train services halted. Shipping suspended. Flights cancelled in both China and Vietnam.
eVENT™ Natural catastrophes in 2016 18
TY Lionrock August 17 to 30, 2016
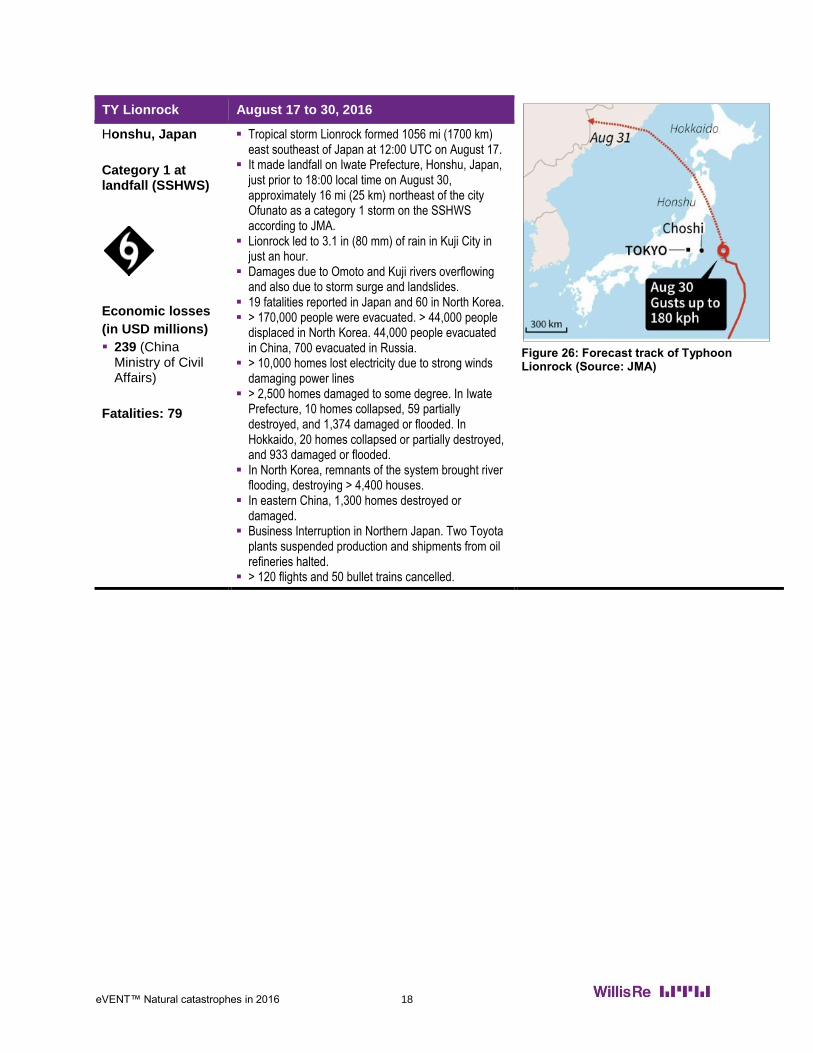
Figure 26: Forecast track of Typhoon Lionrock (Source: JMA)
Honshu, Japan
Category 1 at landfall (SSHWS)
Economic losses
(in USD millions)
239 (China Ministry of Civil Affairs)
Fatalities: 79
Tropical storm Lionrock formed 1056 mi (1700 km) east southeast of Japan at 12:00 UTC on August 17.
It made landfall on Iwate Prefecture, Honshu, Japan, just prior to 18:00 local time on August 30, approximately 16 mi (25 km) northeast of the city Ofunato as a category 1 storm on the SSHWS according to JMA.
Lionrock led to 3.1 in (80 mm) of rain in Kuji City in just an hour.
Damages due to Omoto and Kuji rivers overflowing and also due to storm surge and landslides.
19 fatalities reported in Japan and 60 in North Korea. > 170,000 people were evacuated. > 44,000 people
displaced in North Korea. 44,000 people evacuated in China, 700 evacuated in Russia.
> 10,000 homes lost electricity due to strong winds damaging power lines
> 2,500 homes damaged to some degree. In Iwate Prefecture, 10 homes collapsed, 59 partially destroyed, and 1,374 damaged or flooded. In Hokkaido, 20 homes collapsed or partially destroyed, and 933 damaged or flooded.
In North Korea, remnants of the system brought river flooding, destroying > 4,400 houses.
In eastern China, 1,300 homes destroyed or damaged.
Business Interruption in Northern Japan. Two Toyota plants suspended production and shipments from oil refineries halted.
> 120 flights and 50 bullet trains cancelled.

eVENT™ Natural catastrophes in 2016 19
EQ Italy August 24, 2016
Figure 27: Intensity (MMI) map of affected area (Source: RMS)
Amatrice, Italy
Magnitude 6.2
Max. Intensity: IX – violent (MMI)
Insured losses
(in USD millions)
71 (PERILS) 105 (Willis Re)
Economic losses
(in USD billions)
At least 4.5 (Italian Prime Minister)
11 (Italian Civil Protection Department)
> 10 (with 21% probability, USGS)
Fatalities: 247
An earthquake of magnitude Mw 6.2 struck 10 km southeast of Norcia, Italy on August 24 at 03:36 local time.
The earthquake rated a IX (violent) on the Modified Mercali Intensity Scale.
Shortly after, an earthquake of magnitude Mw 5.5 struck 2.6 mi (4.2 km) north of Norcia at around 04:33 local time.
It occurred along one of the normal faults of Apennines, in a geological setting which promotes extension of the crust. Italy has a high seismic risk, prone to rare but high energy quakes.
247 claimed to be dead. >368 injured. Dozens of people were trapped in Amatrice,
Accumoli and Pescara del Tronto. The worst affected was Amatrice with half the
town getting destroyed. All buildings in the town of Pescara del Tronto
destroyed. Tunnel collapsed in the Tre Valli area resulting
in roads being closed. A bridge on the verge of collapsing. Landslide triggered by earthquake caused
blockage in many highways near Amatrice

eVENT™ Natural catastrophes in 2016 20
HU Hermine August 31 to Sep 7, 2016
Figure 28: Hurricane Hermine storm Track on 2 September 2014 (Source: NOAA)
Gulf of Mexico
Category 1 at landfall
(SSHWS)
Insured losses
(in USD millions)
< 400 (RMS) 500 (KCC)
Economic losses
(in USD billions)
1.0 (KCC)
Fatalities: 0
Tropical storm Hermine formed on August 31 in the Gulf of Mexico, 423 mi (680 km) southwest of Tampa, Florida.
Hermine intensified overnight into a category 1 hurricane (SSHWS) and made landfall at 02:00 local time over northwest Florida with maximum sustained winds of 81 mph (130 km/h).
The town of Cedar Key experienced a 6.6 ft (2 m) storm surge, raising the high tide to 10 ft (3 m).
This portion of the gulf coast is subject to significant risk of storm surge flooding due to the shallow- sloping underwater coastline.
Storm surge also observed in North West Florida with water rising to 6.64 ft (2 m).
After making landfall, Hermine weakened to a tropical storm, passing over Georgia, South and North Carolina and entered the Atlantic.
Near record warm ocean temperatures in the gulf helped feed moisture into Hermine.
State of emergency declared in 51 countries. > 70,000 households without power in
Tallahassee and coastal areas. 325,000 houses in Florida, 107,000 in Georgia, and 100,000 in South Carolina without power. Most of them caused by falling trees.
Villages on Hatteras Island sustained up to 5ft of sound side flooding.
Few buildings damaged or collapsed. Roads blocked. Beaches and ferry services
closed.

eVENT™ Natural catastrophes in 2016 21
TY Meranti September 10 to 17, 2016
Figure 29: Path of Super Typhoon Meranti (JTWC)
China, Taiwan, Philippines
Category 5 (SSHWS)
Category 3 at landfall
Insured losses
(in USD millions)
< 400 (RMS) 650-1150 (AIR)
Economic losses
(in USD millions)
249 (China Ministry of Civil Affairs)
Fatalities: 30
Super Typhoon Meranti is the strongest storm of 2016.
Super Typhoon Meranti formed at 06:00 UTC on September 10 in the west Pacific around 845 km west of Guam and intensified quickly to category 4 strength on the Saffir Simpson Hurricane Wind Scale (SSHWS) with maximum sustained winds of 130 mph (210 km/h).
Meranti, named as Ferdie in the Philippines, further intensified into a category 5 storm (SSHWS) with maximum sustained winds of 155 mph (250 km/h).
Super Typhoon Meranti made landfall as a category 3 storm on the Saffir Simpson Hurricane Wind Scale (SSHWS) over the coast of Fujian Province, China at around 20:00 UTC on September 14.
The storm dissipated over north east China on September 17 but has caused major impacts in both Taiwan and China.
29 fatalities in China, 1 fatality in Taiwan. 7,300 homes collapsed and 61,000 homes
damaged across China. 292 homes destroyed and 932 homes damaged across Philippines.
Nearly 3.2 million homes without power and water supply in Xiamen in China. > 874,000 households without power in Taiwan.
Xiamen severely affected with flooding in the city, shattered windows, fallen trees, crushed cars, etc. In Taiwan, wind caused the major damage with trees, vehicles, railway pylons and metal signs toppling, glass windows being shattered.
Significant disruption to business and transport in Taiwan. Rainfall leading to mudslides.
Aircrafts damaged in Xiamen-Gaoqi International airport. In China, industrial production shut down.
Schools and offices remained closed. Flight services disrupted severely.

eVENT™ Natural catastrophes in 2016 22
HU Matthew October 1 to 8 , 2016
Figure 30: Area affected by Hurricane Matthew (Source: www.mapsofworld.com)
Figure 31: Hurricane Matthew path as on October 7, 2016 (Source: NOAA)
Haiti, Dominican Republic, Cuba, Bahamas, North Carolina, South Carolina, Florida, Georgia
Category 5 (SSHWS)
Category 4,3,1 at landfall
Insured losses
(in USD billions)
1.5 - 5.0 (RMS US) 1.0 - 3.0 (RMS CB) 2.2 - 6.8 (AIR US) 0.6 – 2.0 (AIR CB) 4.0 – 7.0 (KCC US) 2.3 (PCS US)
Economic losses
(in USD billions)
10+ (Moody’s Analytics)
10+ (Goldman Sachs)
Fatalities:
> 10,00 (Caribbean)
40 (U.S.A.)
Hurricane Matthew has been the most powerful hurricane in the Atlantic since Hurricane Felix in 2007.
Matthew formed as a tropical storm on September 28 off northwest Barbados. It strengthened into a category 5 storm by October 5 and subsequently weakened to a category 4 storm while over the Caribbean Sea.
Hurricane Matthew made landfall on Haiti’s Tiburon Peninsula on October 4 at 12:00 (UTC) as a category 4 storm on the Saffir Simpson Hurricane Wind Scale (SSHWS) with maximum sustained winds of 120 mph (190 km/h).
It then made landfall over Cuba’s Guantanamo as a category 4 storm.
Matthew then proceeded towards the Bahamas and made a third landfall as a category 4 and category 3 storm on October 5 to 6.
It continued to weaken as it made its way along the coast of Florida, Georgia and South Carolina and made landfall at Mc Clellanville, South Carolina as a category 1 storm on October 8.
Matthew resulted in heavy flooding in North Carolina due to heavy rains. In South Carolina, flood records broken. Storm surge of more than 6ft in Charleston and of 8.5 ft (2.6 m) in Georgia on October 8. Haiti severely affected with rainfall, storm surge and tornadoes in Haiti, Dominican Republic and Cuba.
Emergency declared across all affected states. > 1,000 killed in the Caribbean. Around 40 deaths
in U.S.A. > 2,270 people rescued and 1,500 people left
stranded due to flooding on October 9 due to flooding in North Carolina. > 175,000 people evacuated in Haiti, Around 96,000 people affected in Guantanamo.
342,000 people without power in North Carolina, 370,000 in South Carolina, 124,000 in Georgia, 100,000 in Florida.
> 880 buildings flooded in North Carolina, 300 structures damaged in South Carolina. Roofs and buildings damaged in Florida. In Haiti, 2,381 houses flooded, 25,160 ‘highly damaged’, 500 completely destroyed. Bahamas faced severe damage due to strong winds and storm surge.
Significant damage to beaches in Florida. Trees uprooted and power lines downed. Major roads and highways closed or inaccessible across all affected regions.
Three dams breached in South Carolina. Airports closed down.
eVENT™ Natural catastrophes in 2016 23
TY Chaba October 3 to 6, 2016
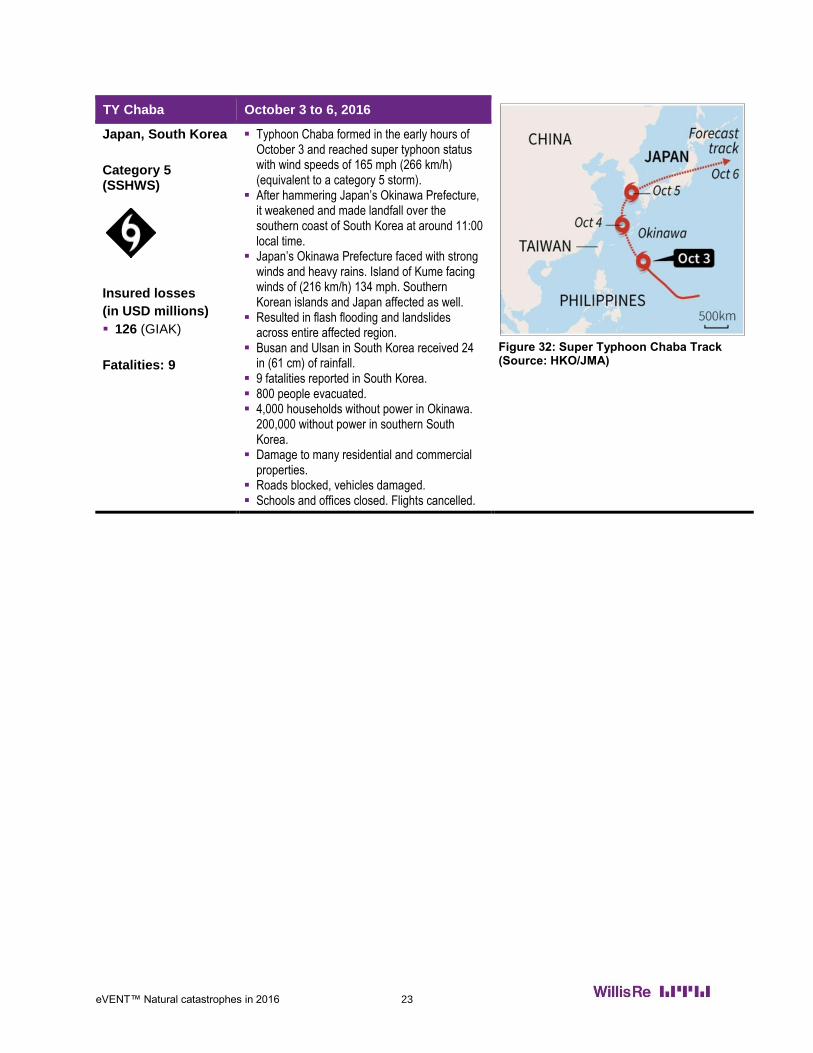
Figure 32: Super Typhoon Chaba Track (Source: HKO/JMA)
Japan, South Korea
Category 5 (SSHWS)
Insured losses
(in USD millions)
126 (GIAK)
Fatalities: 9
Typhoon Chaba formed in the early hours of October 3 and reached super typhoon status with wind speeds of 165 mph (266 km/h) (equivalent to a category 5 storm).
After hammering Japan’s Okinawa Prefecture, it weakened and made landfall over the southern coast of South Korea at around 11:00 local time.
Japan’s Okinawa Prefecture faced with strong winds and heavy rains. Island of Kume facing winds of (216 km/h) 134 mph. Southern Korean islands and Japan affected as well.
Resulted in flash flooding and landslides across entire affected region.
Busan and Ulsan in South Korea received 24 in (61 cm) of rainfall.
9 fatalities reported in South Korea. 800 people evacuated. 4,000 households without power in Okinawa.
200,000 without power in southern South Korea.
Damage to many residential and commercial properties.
Roads blocked, vehicles damaged. Schools and offices closed. Flights cancelled.

eVENT™ Natural catastrophes in 2016 24
TY Sarika October 13 to 18, 2016
Figure 33: The forecast path of typhoon Sarika as on October 16, 2016
(Source: www.nchmf.gov.in)
Philippines, China
Category 3,2 at landfall (SSHWS)
Economic losses
(in USD millions)
670 (Ministry of Civil Affairs, China)
Fatalities: 2
Tropical storm Sarika formed at 13:00 (UTC) on October 13.
It made landfall over Luzon, Philippines on October 16 at (03:00 local time) as a category 3 storm on the Saffir Simpson hurricane Wind Scale (SSHWS) with maximum sustained wind speeds of around 125 mph (201 km/h).
It then weakened into a category 1 storm and entered the South China Sea on October 16.
Typhoon Sarika made a second landfall over Hainan, China on October 18 at 10:00 (local time) as a category 2 storm on the SSHWS with maximum sustained winds of 105 mph (169 km/h).
It made a third landfall over China’s Guangxi Province on October 18 as a tropical storm on the SSHWS.
2 fatalities and 15,700 people displaced in Philippines.
246,000 people without power in Philippines 500 homes destroyed and 2,000 homes
damaged to varying degrees in Hainan. 500,000 people evacuated in Haikou,
China. Flooding and landslides in Philippines.
Trees uprooted. Telephone services disrupted in Philippines.
Flights and ferry services, fishing cancelled in both China and Philippines.

eVENT™ Natural catastrophes in 2016 25
TY Haima October 16 to 21, 2016
Figure 34: China Meteorological Advisory as on 21st October 2016 (Source: CMA)
Philippines, China
Category 4,2 at landfalls (SSHWS)
Economic losses
(in USD millions)
702 (3 provinces only, Ministry of Civil Affairs)
Fatalities: 13
Typhoon Haima formed on October 16 around 360 mi (580 km) south-southwest of Guam.
It intensified into a super typhoon and made landfall over Cayagan Province, Philippine, at 22:00 local time on October 19 as a category 4 storm on the Saffir Simpson Hurricane Wind Scale (SSHWS) with maximum sustained wind speeds of 134 mph (215 km/h).
Haima made a second landfall on China’s Guangdong Province as a category 2 storm on the SSHWS with maximum sustained winds of 96.3 mph (155 km/h).
Resulted in strong winds, flooding and landslides and severe damages in Luzon, China and in Philippine.
13 fatalities reported in Philippine. 600,000 people without power in Philippine.
2,120,000 people without power in China. Almost all homes in Philippine damaged.
6,551 homes completely destroyed. Schools and other structures damaged too. > 1,000 homes destroyed and 5,900 homes damaged in Fujian and Guangdong provinces in China.
Roads blocked, vans overturned in Philippines.
Metro train services and buses cancelled in Hong Kong.
Schools, banks, offices closed in Hong Kong. Flights cancelled.

eVENT™ Natural catastrophes in 2016 26
EQ Norcia October 30, 2016
Figure 35: Intensity (MMI) map of affected area (Source: USGS)
Norcia, Italy
Magnitude 6.6
Max. Intensity: IX – violent (MMI)
Insured losses
(in USD millions)
134 (PERIL AG) 160-215 (Willis
Re preliminary estimate at January 2017)
Economic losses
(in USD billions)
Between 1 and 10 (with 35% probability, USGS)
Fatalities: 0
An earthquake of magnitude Mw 6.6 struck 3.7 mi (6 km) north of Norcia, Italy on October 30 at 07:40 local time.
The earthquake rated as IX (violent) on the Modified Mercalli Intensity (MMI) Scale.
More than 100 aftershocks followed the main event, measuring between Mw 4.0 and Mw 5.0.
The earthquake was a result of crustal normal faulting at a shallow depth of 6.2 mi (10.0 km)
Significant damage in the town of Norcia and nearby places.
> 14,000 people displaced. Damaging of structures as far away as
Rome. Structures in Norcia completely destroyed.
TS U.S.A. November 4 to 6, 2016
Figure 36: NWS filtered storm report for November, 5 2016 (Source: SPC, NOAA)
Texas, New Mexico
Insured losses
(in USD millions)
260 - 280 (PCS)
Fatalities: 0
A series of severe thunderstorms hit southern areas of New Mexico and western Texas from November 4 to 6.
Resulted in flash floods and large quantities of hailstones, which led to huge disruptions in El Paso, Texas.
Almost 10,000 homes and businesses damaged.
Vehicles damaged.

eVENT™ Natural catastrophes in 2016 27
EQ Kaikoura November 13, 2016
Figure 37: Intensity (MMI) map of affected area (Source: USGS)
Kaikoura, New Zealand
Magnitude 7.8
Max. Intensity: IX – violent (MMI)
Insured losses
(in USD billions)
2.5 – 3.5 (RMS) 0.76 – 3.5 (AIR) 0.70 – 3.5
(RBNZ)
Economic losses
(in USD billions)
2.1 -- 5.7 (RBNZ)
Fatalities: 2
A powerful earthquake of magnitude Mw 7.8 struck 39.1 mi (63 km) southwest of Kaikoura, New Zealand at a depth of 9.3 mi (15 km) on November 14 at 00:02 local time.
The earthquake was a result of reverse faulting of tectonic plates.
It measured IX on the Modified Mercalli Intensity (MMI) scale (USGS).
At least 27 aftershocks reported, ranging between Mw 5.0 and Mw 6.5 with the largest a Mw 6.5 quake that occurred 12 km north northwest of Kaikoura.
The worst affected were Wellington and Kaikoura. A tsunami measuring 8.2 ft (2.5 m) in Kaikoura led to the destruction of a cottage. Landslides occurred too.
2 fatalities. 300 displaced in Wellington. Almost
1,000 displaced in Kaikoura. > 300 buildings damaged or destroyed. Electricity, telephone and water supply
disrupted. Roads and railway lines closed down.
Tunnels blocked. Communication severely hampered.
Schools and offices closed.
eVENT™ Natural catastrophes in 2016 28
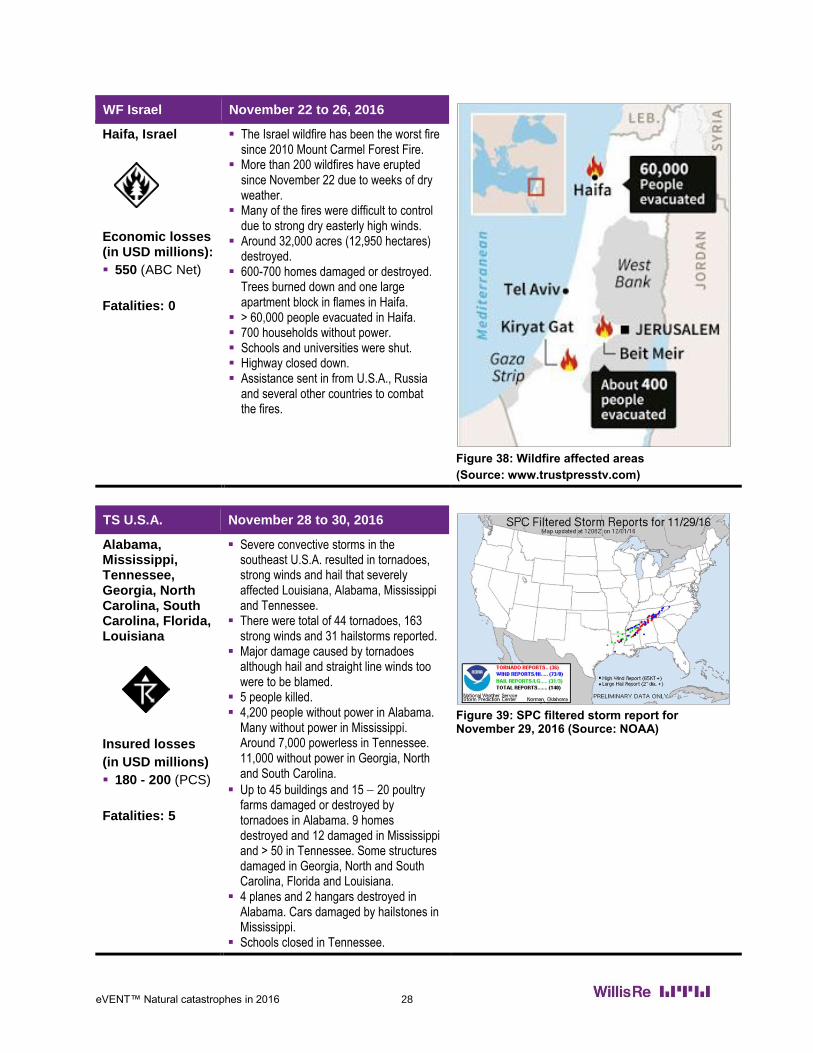
WF Israel November 22 to 26, 2016
Figure 38: Wildfire affected areas
(Source: www.trustpresstv.com)
Haifa, Israel
Economic losses (in USD millions):
550 (ABC Net)
Fatalities: 0
The Israel wildfire has been the worst fire since 2010 Mount Carmel Forest Fire.
More than 200 wildfires have erupted since November 22 due to weeks of dry weather.
Many of the fires were difficult to control due to strong dry easterly high winds.
Around 32,000 acres (12,950 hectares) destroyed.
600-700 homes damaged or destroyed. Trees burned down and one large apartment block in flames in Haifa.
> 60,000 people evacuated in Haifa. 700 households without power. Schools and universities were shut. Highway closed down. Assistance sent in from U.S.A., Russia
and several other countries to combat the fires.
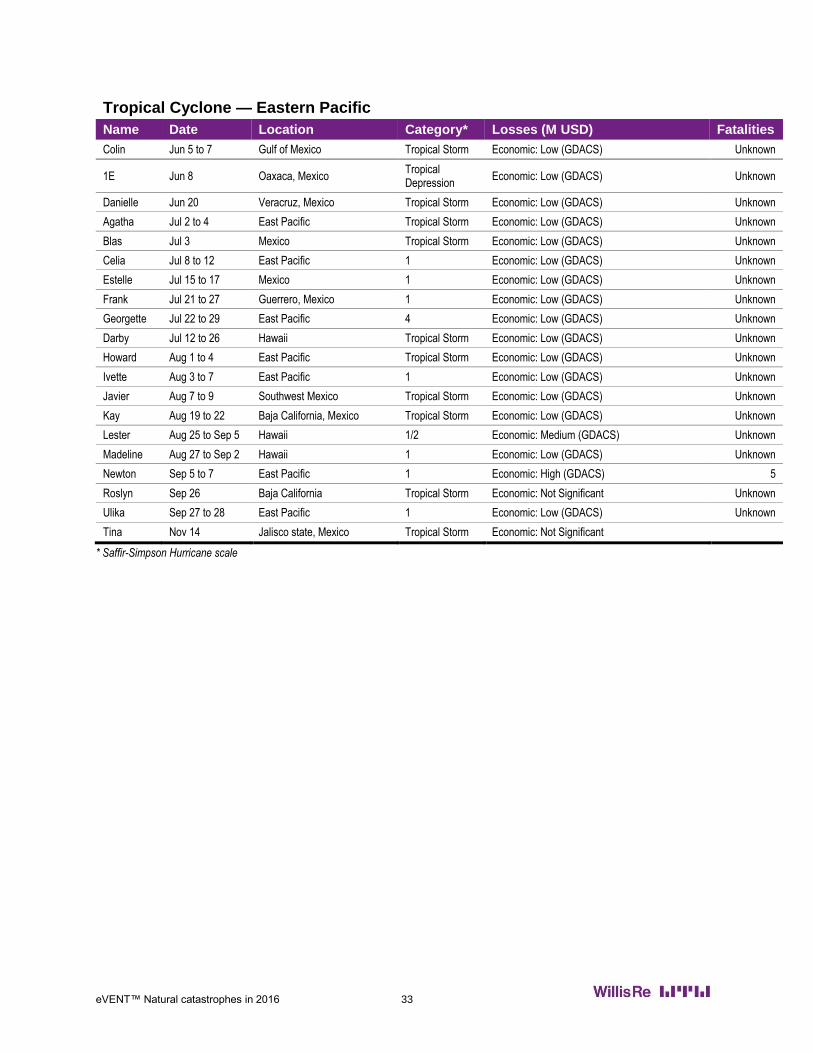
TS U.S.A. November 28 to 30, 2016
Figure 39: SPC filtered storm report for November 29, 2016 (Source: NOAA)
Alabama, Mississippi, Tennessee, Georgia, North Carolina, South Carolina, Florida, Louisiana
Insured losses
(in USD millions)
180 - 200 (PCS)
Fatalities: 5
Severe convective storms in the southeast U.S.A. resulted in tornadoes, strong winds and hail that severely affected Louisiana, Alabama, Mississippi and Tennessee.
There were total of 44 tornadoes, 163 strong winds and 31 hailstorms reported.
Major damage caused by tornadoes although hail and straight line winds too were to be blamed.
5 people killed. 4,200 people without power in Alabama.
Many without power in Mississippi. Around 7,000 powerless in Tennessee. 11,000 without power in Georgia, North and South Carolina.
Up to 45 buildings and 15 20 poultry farms damaged or destroyed by tornadoes in Alabama. 9 homes destroyed and 12 damaged in Mississippi and > 50 in Tennessee. Some structures damaged in Georgia, North and South Carolina, Florida and Louisiana.
4 planes and 2 hangars destroyed in Alabama. Cars damaged by hailstones in Mississippi.
Schools closed in Tennessee.

eVENT™ Natural catastrophes in 2016 29
WF Tennessee Nov 29 to Dec 5, 2016
Figure 40: Southeast Wildfire locations
(Source: USA Today)
Sevier County, Gatlinburg, Pigeon Forge, Tennessee
Insured losses
(in USD millions):
620 - 650 (PCS)
Fatalities: 7
A wildfire on Chimney Top Mountain in the Smoky Mountains National Park of Tennessee that started on November 29 burned over 17,000 acres (6880 hectares).
High winds leading to falling power lines might be the probable cause of the fire. Strong winds and high temperatures helped in aggravating and spreading the fire.
Sevier County, Gatlinburg and Pigeon Forge affected by the wildfire.
7 deaths occurred. 14,000 people evacuated in Sevier County and
Gatlinburg, 500 in Pigeon Forge. 10,500 homes without power in Sevier County. 300 properties damaged or destroyed in
Gatlinburg, 400 in Sevier County, at least 50 in Pigeon Forge.
Great Smoky National Park closed down. Governor declared the Catastrophe as “the
largest wildfire in the last hundred years of Tennessee.”
TC Vardah December 8 to 12, 2016
Figure 41: Tropical cyclone Vardah track (Source: EERC)
Tamil Nadu, Andaman and Nicobar Islands
Insured losses
(in USD millions)
52 (Business line)
Economic losses
(in USD billions)
1.0 (ASSOCHAM)
Fatalities: 23
Tropical storm Vardah formed at 12:00 UTC on December 8 around 149 mi (240 km) southwest of Port Blair, Andaman and Nicobar Islands.
The system brought rainfall to the islands in the Andaman Sea. Resulted in floods in southern Thailand and Port Blair.
It then intensified into a very severe cyclonic storm and made landfall over Chennai, Tamil Nadu, India, on December 12 between 15:00 and 17:00 local time with wind speeds of 62.1
– 68.4 mph (100 110 km/h). Rainfall of up to 8.8 in (224 mm) in Chennai
between December 12 and 13 led to flooding. Resulted in 23 fatalities. Around 15,000 people displaced. 7,000 huts damaged. > 12,000 trees uprooted due to the storm
leading to widespread disruption of power and transactions.
800 transformers and 10,000 electricity poles damaged.
312 roads blocked which severely impacted traffic.
Substantial damage to crops. Schools and colleges, offices in Tamil Nadu
remain shut. Train services affected. A number of flights
cancelled.

eVENT™ Natural catastrophes in 2016 30
Other natural catastrophe events by peril
and location
Events highlighted in the following tables represent those with detailed information presented in the first
part of the report.
Windstorm
Name Date Location Losses (USD millions)
Fatalities
Gertrude Jan 28 Scotland. Ireland Economic: Not significant Unknown
Imogen Feb 8 to 9 Ireland, U.K., France, Germany
Economic: Not significant Unknown
Katie Mar 27 to 28 U.K., France Economic: Not significant Unknown
Elvira+Friederike May 28 to June 5 France, Germany, Belgium
Insured: 2,480 (Swiss Re)
Economic: 4,000 (Swiss Re)
5,200 (Munich Re)
11
Australia East Coast Low June 4 to 8 Australia Economic: Not significant Unknown
Nanette/ Angus Nov 20 U.K., Ireland Economic: Significant Unknown
Blizzard
Name Date Location Losses (USD millions)
Fatalities
Jonas Jan 23 to 24 Mid Atlantic U.S.A.
Insured: 220-250 (PCS)
Economic: 350 (Planalytics)
2,500-3,000 (Moody)
5,00-1,000 (IHS)
30
Eastern Asia Jan 25 Japan, Taiwan, South Korea, China
Economic: Not Significant 90

eVENT™ Natural catastrophes in 2016 31
Severe Thunderstorm (Tornado/Hail/Straight wind)
Name Date Location Losses (USD millions) Fatalities
U.S.A. Outbreak Feb 23 to 24 Southern and Mid Atlantic U.S.A.A. Insured: 750-770 (PCS)
Economic: Significant 8
U.S.A. Severe Weather
Mar 13 to 18 Southern, Central, Eastern U.S.A.A
Insured: 600 (ICT)
692 (PCS)
Economic: Significant
0
U.S.A. Severe Weather Outbreak
Mar 30 to 31 Southern U.S.A.A. Economic: Not significant Unknown
Texas Hailstorm Apr 10 to 12 U.S.A.A. Insured: 2,600-2,700 (PCS) 0
Uruguay tornado Apr 15 Dolores, Uruguay Economic: Not significant 4
U.S.A. Severe Weather Outbreak
Apr 29 to May 3 U.S.A.A. Insured:740-760 (PCS) 6
U.S.A. Plains and Midwest Severe Convective Storms
May 7 to 11 U.S.A.A. Economic: Not significant 0
Florida tornadoes May 17 to 19 U.S.A.A. Economic: Not significant 0
Central U.S.A. Hail
May 21 to 22 Central U.S.A. Economic: Not significant 0
Netherlands Hail June 22 to 24 North Brabant and Limburg Economic: 1,120 (Munich Re)
Insured: 550 (VvV) 0
Yancheng June 23 Jiangsu Province, Eastern China Economic: Significant 98
U.S.A. Severe Weather
June 6 to 7 Colorado, U.S.A.A Insured: 114.7 (PCS)
Economic: Significant Unknown
U.S.A. Severe Weather
June 16 to 18 Mid-Atlantic, Southeast, Northeast, Midwest U.S.A.A
Insured: 110.6 (PCS)
Economic: Significant Unknown
U.S.A. Severe Weather
July 4 to 9 Plains, Midwest, Mid-Atlantic, Rockies, Southeast
Insured: 371(PCS)
Economic: Significant Unknown
U.S.A. Severe Weather
July 13 to 15 Rockies, Plains, Midwest, and Southeast Insured: 299 (PCS)
Economic: Significant Unknown
U.S.A.A. Severe Weather
July 20 to 21 Upper Midwest Insured: 88 (PCS)
Economic: Significant Unknown
Pine Bluffs Hailstorm
July 27 Wyoming, U.S.A.A. Insured: 704 (PCS)
Economic: Significant 0
Madison Hail Sep 19 Wisconsin, U.S.A. Economic: Significant Unknown
South Australia
Severe Weather Sep 28 South Australia Economic: Not Significant Unknown
Thunderstorm U.S.A.
Nov 4 to 6 Texas, New Mexico Insured: 277 (PCS) 0
Thunderstorm Australia
Nov 11
South Australia
Victoria
New South Wales
Insured: 195 (Willis Re)
Economic: 75 (Agricultural Adelaide) 0
Southern U.S.A. Severe Weather
Nov 28 to 30 Louisiana, Alabama, Mississippi, Tennessee
Insured: 194 (PCS)
Economic: Significant 5

eVENT™ Natural catastrophes in 2016 32
Tropical Cyclone – Atlantic
Name Date Location Category* Losses (USD millions)
Fatalities
Alex Jan 15 to 17 Azores, Canada Tropical Storm Economic: Low (GDACS) Unknown
Earl Aug 2 to 6 Mexico, Belize, Central America, Caribbean
1 Insured: 50-150(AIR)
Economic: High (GDACS) 51
Fiona Aug 17 to 21 Cape Verde Tropical Storm Economic: Low (GDACS) Unknown
Gaston Aug 23 to Sep 4
Cape Verde Tropical Storm Economic: Low (GDACS) Unknown
Hermine Aug 31 to Sep 7
Gulf of Mexico 1
Insured: <400 (RMS)
500 (KCC)
Economic: 1,000 (KCC)
0
Eight Aug 30 to 31 North Carolina, U.S.A.A. Tropical Depression
Economic: Low (GDACS) Unknown
Orlene Sep 11 to 17 Colima State, Mexico 1 Economic: Low (GDACS) Unknown
Ian Sep 12 to 14 Central North Atlantic Tropical Storm Economic: Low (GDACS) Unknown
Julia Sep 14 to 17 Florida Tropical Storm Economic: Low (GDACS) Unknown
Karl Sep 15 to 25 Bermuda Tropical Storm Economic: Low (GDACS) Unknown
Paine Sep 18 to 21 Central Mexico 1 Economic: Low (GDACS) Unknown
Lisa Sep 20 to 24 Cape Verde Tropical Storm Economic: Low (GDACS) Unknown
Matthew Sep 29 to Oct 8
Carolina, Florida, Georgia, Caribbean
5
Insured: U.S.A.: 1,500 – 5,000 (RMS)
CB: 1,000 – 3,000 (RMS)
Economic: 10,000+ (Moody)
>1000
Nicole Oct 4 to 13 Bermuda 3 Economic: Low 0
Seymour Oct 23 Manzanillo, Mexico Tropical Storm Economic: Low 0
Otto Nov 21 Panama, Costa Rica, Nicaragua 2 Economic: Low 0
* Saffir-Simpson Hurricane scale
eVENT™ Natural catastrophes in 2016 33
Tropical Cyclone — Eastern Pacific
Name Date Location Category* Losses (M USD) Fatalities
Colin Jun 5 to 7 Gulf of Mexico Tropical Storm Economic: Low (GDACS) Unknown
1E Jun 8 Oaxaca, Mexico Tropical Depression
Economic: Low (GDACS) Unknown
Danielle Jun 20 Veracruz, Mexico Tropical Storm Economic: Low (GDACS) Unknown
Agatha Jul 2 to 4 East Pacific Tropical Storm Economic: Low (GDACS) Unknown
Blas Jul 3 Mexico Tropical Storm Economic: Low (GDACS) Unknown
Celia Jul 8 to 12 East Pacific 1 Economic: Low (GDACS) Unknown
Estelle Jul 15 to 17 Mexico 1 Economic: Low (GDACS) Unknown
Frank Jul 21 to 27 Guerrero, Mexico 1 Economic: Low (GDACS) Unknown
Georgette Jul 22 to 29 East Pacific 4 Economic: Low (GDACS) Unknown
Darby Jul 12 to 26 Hawaii Tropical Storm Economic: Low (GDACS) Unknown
Howard Aug 1 to 4 East Pacific Tropical Storm Economic: Low (GDACS) Unknown
Ivette Aug 3 to 7 East Pacific 1 Economic: Low (GDACS) Unknown
Javier Aug 7 to 9 Southwest Mexico Tropical Storm Economic: Low (GDACS) Unknown
Kay Aug 19 to 22 Baja California, Mexico Tropical Storm Economic: Low (GDACS) Unknown
Lester Aug 25 to Sep 5 Hawaii 1/2 Economic: Medium (GDACS) Unknown
Madeline Aug 27 to Sep 2 Hawaii 1 Economic: Low (GDACS) Unknown
Newton Sep 5 to 7 East Pacific 1 Economic: High (GDACS) 5
Roslyn Sep 26 Baja California Tropical Storm Economic: Not Significant Unknown
Ulika Sep 27 to 28 East Pacific 1 Economic: Low (GDACS) Unknown
Tina Nov 14 Jalisco state, Mexico Tropical Storm Economic: Not Significant
* Saffir-Simpson Hurricane scale

eVENT™ Natural catastrophes in 2016 34
Tropical Cyclone — North-Western Pacific
Name Date Location Category* Losses (M USD) Fatalities
Pali Jan 11 to 12 Central Pacific Hurricane Economic: Not Significant Unknown
Nepartak Jul 3 to 9 Taiwan, China 2-4 Economic: 24.1 (Taiwan Council of
Agriculture) 88
Mirinae Jul 26 to 28 South China Sea, China Tropical Storm Economic: Not Significant 1
Nida Jul 30 to Aug
3 China, Hong Kong 1
Economic: 122.18 (China Ministry of Civil
Affairs) 0
Omais Aug 4 to 8 Tokyo, Japan Tropical Storm Economic: Not Significant Unknown
Conson Aug 8 to 12 Northwest Pacific Tropical Storm Economic: Not Significant Unknown
Chanthu Aug 14 to 17 Hokkaido Island, Japan Tropical Storm Economic: Not Significant Unknown
Lionrock Aug 17 to 30 Honshu, Japan 1 Economic: 239 (China Ministry of Civil Affairs) 79
Dianmu Aug 17 to 20 China, Vietnam Tropical
Storm Economic: Significant 9
Mindulle Aug 18 to 22 Chiba Prefecture, Japan 1 Economic: Not Significant 1
Kompasu Aug 19 to 22 Tokyo, Japan Tropical Storm Economic: Not Significant 1
Namtheun Sep 2 to 5 Ishigaki Islands, Japan Tropical Storm Economic: Not Significant Unknown
Meranti Sep 10 to 17 China, Taiwan, Philippines 3 (CMA) Insured: >400 (Willis Re) 650 – 1150 (AIR)
Economic: 249 (China Ministry of Civil Affairs) 30
Malakas Sep 12 to 20 Kyushu, Japan 3 Economic: Significant 1
Megi Sep 23 to 27 China, Taiwan 1/2 Economic: Significant 4
Chaba Oct 3 to 6 Japan, South Korea Super
Typhoon
Insured: 126 (GIAK)
Economic: Significant 9
Aere Oct 7 South China Sea, HongKong Tropical Storm Economic: Not Significant 0
Songda Oct 10 Western Pacific 2 Economic: Not Significant 0
Sarika Oct 13 to 18 Philippines, China 3 Economic: 0.89 (Ministry of Civil Affairs) 2
Haima Oct 16 to 21 Philippines, China 4 Economic: 702 (Ministry of Civil Affairs) 13
Meari Nov 3 Guam Tropical Storm Economic: Not Significant 0
Ma-on Nov 11 Northern Mariana Islands Tropical Storm Economic: Not Significant 0
Tokage Nov 24 Visayan Sea, Philippines Tropical Storm Economic: Not Significant 0
Nock-Ten Dec 25 Luzon 3 Economic: Not Significant 3
* Saffir-Simpson Hurricane scale

eVENT™ Natural catastrophes in 2016 35
Tropical Cyclone — Southern Pacific and Oceania
Name Date Location Category* Losses (M USD) Fatalities
Victor Jan 15 to 21 Asia Pacific 1 Economic: High (GDACS) Unknown
Stan Jan 29 to 31 Australia Tropical Storm Economic: Low (GDACS) Unknown
Solo Feb 11 New Caledonia, Queensland Tropical Storm Economic: Not significant Unknown
Uriah Feb 13 to 19 Asia Pacific Tropical Storm Economic: Not significant Unknown
Winston Feb 20 Asia Pacific, Australia 5 Economic: Not Significant 43
14P Feb 25 Asia Pacific Tropical Storm Economic: Not Significant Unknown
Zena Apr 5 to 7 Fiji 1 Economic: Medium (GDACS) Unknown
Yvette Dec 21 Port Hedland, Western Australia
1 Economic: Not Significant Unknown
* Saffir-Simpson Hurricane scale
Tropical Cyclone — Indian Ocean
Name Date Location Category* Losses (M USD) Fatalities
Corentin Jan 21 to 25 South Indian Ocean Tropical Storm Economic: Not Significant Unknown
Daya Feb 10 to 12 Africa Tropical Storm Economic: Low (GDACS) Unknown
Fantala Apr 11 to 24 Madagascar Tropical Storm Economic: Low (GDACS) Unknown
Roanu May 18 to 21 Bangladesh Tropical Storm Economic: Significant 116
Two- Arabian Sea
June 27 to 30 Asia Pacific Tropical Storm Economic: Not Significant Unknown
Abela July 16 to 19 Africa Tropical Storm Economic: Not Significant Unknown
Kyant Oct 25 Dhaka, Bangladesh Tropical Storm Economic: Not Significant Unknown
Nada/ Four
Nov 30 to Dec 1 Tamil Nadu, India Tropical Depression
Economic: Not Significant Unknown
Vardah Dec 8 to 12 Tamil Nadu, India Very Severe Cyclonic storm
Insured: 52 (Businessline)
Economic: 1000 (ASSOCHAM) 23
* Saffir-Simpson Hurricane scale

eVENT™ Natural catastrophes in 2016 36
Flood
Name Date Location Losses (M USD) Fatalities
Ireland and U.K. Jan 4 Ireland, United Kingdom Economic: Not Significant Unknown
Albania Jan 5 to 7 Balkan Peninsula Economic: Not Significant Unknown
Parana State, Brazil Jan 9 to 12 South America Economic: Not Significant Unknown
Indonesia and Malaysia Feb 5 to 7 Asia Pacific Economic: Not Significant 12
Southwest Europe Feb 12 to 14 Europe Economic: Not Significant 1
Indonesia and Malaysia Feb 19 to 20 Asia Pacific Economic: Not Significant 1
Northern and Western Haiti Feb 28 Central America Economic: Not Significant 1
Java Feb 25 to Mar 1 Indonesia Economic: Not Significant 1
Serbia Mar 6 to 7 Europe Economic: Medium impact (GDACS) 14
Southeast Brazil Mar 10 to 12 Brazil Economic: Not Significant 24
Southern U.S.A. Mar 7 to 14 U.S.A. Insured: 290-310 (PCS)
Economic: Significant >6
Oman Mar 8 to 11 Oman, UAE Insured: 15.3 (Middle East Insurance Review) Unknown
Southern China Mar 19 China Economic: Medium (GDACS) 10
Fiji Apr 3 to 6 Asia Pacific Economic: Not Significant 1
Argentina and Uruguay Apr 4 to 9 South America Economic: Significant 3
Western Russia Apr 12 Russia Economic: Medium (GDACS) Economic
Houston Texas Apr 17 to 21 U.S.A. Insured: 4 (ICT) 8
South Eastern China May 4 to 16 China Economic: Not Significant >66
South China Jun 13 to 17 Southern China Insured: 66(CIRC)
Economic: 1700 (Ministry of Civil Affairs) 50
Southern Japan Jun 20 to 23 South Japan Economic: Significant 6
West Virginia Jun 23 to 25 West Virginia Insured: 122.39(PCS)
Economic: Significant > 20
South Africa Jul 24 to 26 KwaZulu Natal, Eastern Cape, Western Cape
Economic: Significant 3
Maryland and New Jersey Jul 30 U.S.A.A. Insured:122.5(PCS)
Economic: Significant 2
Macedonia Flash Flooding Aug 6 to 7 Skopje, Macedonia Economic: Significant > 21
Asia Monsoon Jun 30 to Jul 25 Bangladesh, China, India, Nepal, Pakistan
Economic: Significant 735
Louisiana Flooding Aug 12 to 14 Louisiana, U.S.A.A. Insured:1058(PCS)
Economic: Significant 13
Greece Flooding Sep 7 Greece, Europe Economic: Medium impact (GDACS) 4
U.K. Flooding Sep 15 to 16 Southern and Southeast England
Economic: Significant 24
North Carolina Flooding Sep 19 to 22 North Carolina, U.S.A.A. Economic: Not Significant 0
Forbes, Australia Flooding Sept 25 Forbes, New South Wales, Australia
Economic: Significant Unknown
Central Vietnam Flooding Oct 14 Vietnam Economic: Significant 25
Italy and France Flooding Nov 24 to 25 Northwest Italy, Southeast France
Economic: Significant 1
Southern Spain Flooding Dec 3 to 4 Spain Economic: Significant 2

eVENT™ Natural catastrophes in 2016 37
Earthquake
Name Local time Location Mw Losses (M USD) Fatalities
Jan 3 04:35 Manipur, India 6.7 Economic: Not Significant 15
Jan 6 06:42 Banning, California 4.4 Economic: Not Significant Unknown
Jan 12 00:38 Talaud Islands, Indonesia 6.5 Economic: Not Significant Unknown
Jan 14 12:25 Hokkaido, Japan 6.3 Economic: Not Significant Unknown
Jan 21 01:13 Qinghai Province, China 5.9 Economic: Not Significant Unknown
Jan 24 01:30 Offshore Alaska, U.S.A. 7.1 Economic: Not Significant Unknown
Jan 25 05:22 Offshore Morocco 6.1 Economic : Not Significant
1
Jan 30 15:25 Kamchatka, Russia 7.2 Economic: Not Significant Unknown
Feb 6 03:57 South Taiwan 6.4 Insured: 7.5 (Asia Insurance Review) 47
Feb 9 21:33 Coquimbo, Chile 6.3 Economic: Not Significant 1
Feb 12 17:02 Sumba, Indonesia 6.5 Economic: Not Significant Unknown
Feb 14 13:13 Offshore Christchurch, New Zealand
5.7 Economic: Not Significant Unknown
Feb 16 15:04 Big Pine, California 4.8 Economic: Not Significant Unknown
Feb 24 16:02 Kern, California 4.9 Economic: Not Significant Unknown
Apr 3 18:23 Offshore Espiritu Santo Island, Vanuatu
6.9 Economic: Not Significant Unknown
Apr 10 14:58 Northeast Afghanistan 6.6 Economic: Not Significant 6
Apr 13 20:25 Naypyidaw, Myanmar 6.9 Economic: Not Significant > 2
Apr 14 02:21 Offshore Mindanao Island, Philippines
5.9 Economic: Not Significant Unknown
Apr 14 12:26 (UTC) Kyushu, Japan 6.1 Economic: Not Significant 9
Apr 16 18:58 Esmeraldas Province, Ecuador
7.8
Insured: 325 – 850 (AIR)
Economic: 0.1 – 1 B ( with 32% probability, USGS)
>600 M (Ministry of Finances)
>655
Apr 16 00:25 Kumamoto, Japan 7.0
Insured: 1,700 – 3,200 (AIR)
800 – 1,200 (RMS);
4,800( Willis Re)
Economic: 5,500 – 7,500 (RMS), >10 (with 72% probability, USGS)
>66
April 29 05:33 Malakula Island, Vanuatu 7.0 Economic: Not Significant 0
May 12 11:17 Yilan County, northeast Taiwan
5.6 Economic: Not Significant 0
May 18 02:57 Esmeraldas Province 6.7 Economic: Not Significant 1
Jun 01 04:56 Sumatra, Indonesia 6.5 Economic: Not Significant 0
Jun 10 21:25 Puerto Morazan, Honduras
6.1 Economic: Not Significant 0
Jun 10 01:04 Riverside County, California
5.2 Economic: Not Significant Unknown
Jun 26 11:17 (UTC) Sary-Tash, Kyrgyzstan 6.4 Economic: Not Significant 0
Jul 10 21:01 Esmeraldas Provinces 5.8 Economic: Not Significant Unknown
Aug 3 21:55 Janesville, California 4.5 Economic: Not Significant Unknown
Aug 15 21:58 Chivay, Peru 5.4 Economic : Not Significant 4

eVENT™ Natural catastrophes in 2016 38
Aug 18 14:30 Bowen, Queensland, Australia
5.7 Economic: Not Significant Unknown
Aug 24 17:04 Chauk, Burma 6.8 Economic: Not Significant 0
Aug 24 03:36 Amatrice, Italy 6.2
Insured: 71 (Perils)
105 (Willis Re)
Economic: 11 (Italian Civil Protection Department)
>10 (USGS)
247
Sep 02 04:37 North Island, New Zealand
7.1 Economic: Not Significant Unknown
Sep 3 06:42 Pawnee County, Oklahoma
5.6 Economic: Not Significant Unknown
Sep 4 10:38 Mindanao, Philippines 5.9 Economic: Not Significant Unknown
Sep 10 15:27 Nsunga, Tanzania 5.9 Economic: Not Significant 16
Sep 11 15:10 Skopje, Macedonia 5.3 Economic: Not Significant 0
Sep 12 20:32 Kyonju, South Korea 5.4 Economic: Not Significant 0
Sep 14 20:58 Mutata, Colombia 6.0 Economic: Not Significant 0
Sep 22 21:06 Southern Mozambique 5.6 Economic: Not Significant Unknown
Oct 02 21:40 Balingasay, Philippines 5.7 Economic: Not Significant 0
Oct 21 14:07 Kurayoshi, Japan 6.2 Economic: Not Significant 0
Oct 26 21:8 Visso, Italy 6.1 Economic: Not Significant 0
Oct 30 07:40 Norcia, Italy 6.6
Insured: 134 (Peril AG)
160-215 (Willis Re preliminary)
Economic: 1000-10000 (USGS)
0
Nov 4 13:20 Curico, Chile 6.4 Economic: Not Significant 0
Nov 6 20:44 Cushing, Oklahoma 5.0 Economic: Not Significant 0
Nov 14 00:02 Kaikoura, New Zealand 7.8
Insured: 2500-3500 (RMS)
762-3500 (AIR)
705-3500 (RBNZ)
Economic: 2100-5700 (RBNZ)
2
Nov 22 05:59 Offshore Namie, Japan 6.9 Economic: Not Significant 0
Dec 01 17:40 Huarichancara, Peru 6.3 Economic: Not Significant 0
Dec 7 05:03 Sigli, Indonesia 6.5 Economic: Significant 102
Dec 25 14:22(UTC) Chile 7.6 Economic: Not Significant 0

eVENT™ Natural catastrophes in 2016 39
Wildfire
Name Month Location Acres Burnt Losses (M USD) Fatalities
Waroona- Yarloop Bushfire
Jan 6 Western Australia 176,326 Insured: 71.25 (ICA) 2
Canada Wildfire May 1 to 26
Fort McMurray 1,300,000
Insured: 3,520 (PCS)
2,000 – 5,000 (Morgan Stanley)
Economic: Significant
0
Erskine Wildfire Jun 23 to 30
California, U.S.A.A. > 43,460 Economic: Significant 2
California Wildfires
Jul 22 California, U.S.A.A. > 68,000 Economic: Significant 2
Madeira Wildfire Aug 8 to 10 Madeira, Portugal Unknown Economic: Not Significant 3
California Wildfires
Aug 13 to 22
California, U.S.A.A. > 68,000 Economic: Significant 0
Israel Wildfires Nov 22 to 28
Israel 32,000 Economic: 550 (ABC Net) 0
Tennessee Wildfires
Nov 29 to Dec 5
Sevier County, Tennessee 17,000 Insured: 637 (PCS)
Economic: Significant 7

eVENT™ Natural catastrophes in 2016 40
Abbreviations
Symbols from Federal Geographic Data Committee (FGDC)
BL Blizzard
HL Hail
TS Thunderstorm
Chemical Explosion
ME Meteoroid
VE Volcanic Eruption
DR Drought
TC Tropical Cyclone
WF Wildfire
EQ Earthquake
TO Tornado
WS Windstorm
FL Flood
Sources ABC Net (abc.net.au), ABI (Association of British Insurers: abi.org.uk), Accuweather (accuweather.com), Adelaide now (adelaidenow.com), AFA (
Association Française de l’assurance), AIR (AIR Worldwide: air-worldwide.com), AMIS (Asociación Mexicana de Instituciones de Seguros (Mexican
Association of Insurance Institutions): amis.org.mx), Artemis (artemis.bm), Bahamas First Holdings (bahamasfirst.com), BoM (Australian Government
Bureau of Meteorology: bom.gov.au), Business Insurance (businessinsurance.com), Brisbane Times (brisbanetimes.com.au), CDI (California
Department of Insurance: insurance.ca.gov), CEDIM (Center for Disaster Management and Risk Reduction Technology: cedim.de), Chicoer News
(chicoer.com), China Daily (chinadaily.com.cn), CIRC(China Insurance Regulatory Commission), China’s National Earthquake Network Centre
(csndmc.ac.cn), Chinese Today (chinesetoday.com), Climate Signal (www.climatesignals.org), CNTV (english.cntv.cn), CoCoRaHS (Community
Collaborative Rain, Hail & Snow Network: cocorahs.org), CoreLogic (corelogic.com), Credit Suisse (credit-suisse.com), Dailymail (dailymail.co.uk),
DWD (Deutscher Wetterdienst: dwd.de), Earth observatory (by NASA (National Aeronautics and Space Administration, U.S.A.):
earthobservatory.nasa.gov), Earthquake report (by CEDIM/KIT (Center for Disaster Management and Risk Reduction Technology/Karlsruhe Institute of
Technology): earthquake-report.com), ECMWF (European Centre for Medium-Range Weather Forecasts: ecmwf.int), Express (express.co.uk),
Extreme Storm (extremestorms.com.au), FGDC (Federal Geographic Data Committee: fgdc.gov), Fitch (Fitch Ratings: fitchratings.com), FU Berlin
(Freie Universität Berlin: fu-berlin.de), GDACS (Global Disaster Alert and Coordination System: gdacs.org), GDV (Gesamtverband der Deutschen
Versicherungswirtschaft e. V. (German Insurance Association): gdv.de), GeoMAC (Geospatial Multi-Agency Coordination by USGS: geomac.gov),
GIAJ (General Insurance Association of Japan: sonpo.or.jp), GIAK (General Insurance Association of Korea: knia.or.kr), Guardian (theguardian.com),
HKO(Hong Kong Observatory), ICA (Insurance Council of Australia: insurancecouncil.com.au), Insurance Journal (insurancejournal.com), International
Federation of Red Cross and Red Crescent Societies (www.ifrc.org), IHS (www.ihs.com), JMA (Japan Meteorological Agency: jma.go.jp), JTWC (Joint
Typhoon Warning Center: jtwccdn.appspot.com/JTWC), KAC (Kinetic Analysis Corporation: kinanco.com), KCC(Karen Clark and Company), KNMI
(Koninklijk Nederlands Meteorologisch Instituut), Met Office (metoffice.gov.uk), Met Service (metservice.com), Meteo France (meteofrance.com),
Munich Re (munichre.com), NASA (National Aeronautics and Space Administration, U.S.A.: nasa.gov), NBC Bay Area (nbcbayarea.com), NBC
Chicago (nbcchicago.com), NDRRMC (National Disaster Risk Reduction And Management Council: ndrrmc.gov.ph), NEOC (Nepal National
Emergency Operation Center: neoc.gov.np), NOAA (National Oceanic and Atmospheric Administration, U.S.A.: noaa.gov), North American Forest Fire
System (fires.globalincidentmap.com), NWS (NOAA National Weather Service: weather.gov), NY Times (nytimes.com), OCHA (United Nations Office
for the Coordination of Humanitarian Affairs: unocha.org), PCS (Property Claim Services: verisk.com/property-claim-services), PERIL AG (perils.org),
PERILS (perils.org), PwC (PricewaterhouseCoopers: pwc.co.uk), RBNZ (Reserve Bank of New Zealand), ReliefWeb (by OCHA (United Nations Office
for the Coordination of Humanitarian Affairs): reliefweb.int), Reuters (reuters.com), Risk Market News (riskmarketnews.com), RMS (Risk Management
Solutions: rms.com), Scientific American (scientificamerican.com), SPC (Storm Prediction Center, NOAA’s National Weather Service: spc.noaa.gov),
Swiss Re (swissre.com), The Actuary (theactuary.com), Tribune 242 (tribune242.com), USGS (United States Geological Survey: usgs.gov),
USTornadoes (United States Tornadoes: ustornadoes.com), Verisk Climate (veriskclimate.com), VvV (The Dutch Insurance Association, Verbond van
Verzekeraars), Washington Post (washingtonpost.com), WEATHER (weather.com), Weather Underground (wunderground.com), Weatherzone
(weatherzone.com.au), Webcitation (webcitation.org), wetterpate.de (Institute for meteorology), Willis Re, Willis SpatialKey Application
© Copyright 2017 Willis Limited/Willis Re Inc. All rights reserved: No part of this publication may be reproduced, disseminated, distributed, stored in a retrieval system, transmitted or
otherwise transferred in any form or by any means, whether electronic, mechanical, photocopying, recording, or otherwise, without the permission of Willis Limited/Willis Re Inc. Some
information contained in this document may be compiled from third party sources and we do not guarantee and are not responsible for the accuracy of such. This document is for
general information only and is not intended to be relied upon. Any action based on or in connection with anything contained herein should be taken only after obtaining specific advice
from independent professional advisors of your choice. The views expressed in this document are not necessarily those of Will is Limited/Willis Re Inc., its parent companies, sister
companies, subsidiaries or affiliates, Willis Towers Watson PLC and all member companies thereof (hereinafter “Willis Towers Watson”). Willis Towers Watson is not responsible for the
accuracy or completeness of the contents herein and expressly disclaims any responsibility or liability for the reader's application of any of the contents herein to any analysis or other
matter, or for any results or conclusions based upon, arising from or in connection with the contents herein, nor do the contents herein guarantee, and should not be construed to
guarantee, any particular result or outcome. Willis Towers Watson accepts no responsibility for the content or quality of any third party websites to which we refer.
The contents herein are provided for informational purposes only and do not constitute and should not be construed as professional advice. Any and all examples used herein are for
illustrative purposes only, are purely hypothetical in nature, and offered merely to describe concepts or ideas. They are not offered as solutions to produce specific results and are not to
be relied upon. The reader is cautioned to consult independent professional advisors of his/her choice and formulate independent conclusions and opinions regarding the subject matter
discussed herein. Willis Towers Watson is not responsible for the accuracy or completeness of the contents herein and expressly disclaims any responsibility or liability for the reader's
application of any of the contents herein to any analysis or other matter, nor do the contents herein guarantee, and should not be construed to guarantee, any particular result or
outcome.