will the pension crisis really happen? the evidence from ... · ueps in different aged dependency...
TRANSCRIPT
Will the Pension Crisis Really Happen? The Evidence from the
China
Zhenhe Chi Richard. Freeman
Abstract: The population aging has been becoming more and more serious in the China due to the
industrialization and the “one family one children” policy from the early 1980s, which will give
rise to a rapid growth of pension benefit demand in the future. The relationship between the
pension benefit and the economic growth, the population aging, and the pension fund surplus is
responsibly investigated based on both a pay-as-you-go (PAYG) and a funded pension schemes in
a demand-supply framework. The pension benefit in both a PAYG and a funded pension schemes
are positively correlated to the economic growth and negatively correlated to the population aging
and the pension fund surplus. And then, a regression with the penal data of the Urban Employee
Pension Scheme (UEPS) in China 31 provinces is made to test the conclusion and the result
confirms the new finding. At last, a serious of projections on the pension benefit demand of the
UEPS in different aged dependency ratios are made and they show that the pension benefit
demand created by the population aging is great in the future, but that demand can be met by an
economy growth or a subsidy of the UEPS or the mix of both. Compared to the pension benefit
demand created by the population aging, the demand given rise by the increasing of the pension
benefit of the UEPS is much more. When the average pension benefit grows by 1% in each year
until 2050, the per capita output in the China should maintain a yearly growth rate of 7.61% to
meet that demand, when old dependency ratio and the ratio of the pension fund surplus and total
expenditure keep unchanged. A pension crisis may break out in the China caused by a fast growth
of the pension benefit, not by the increasing of the population aging in the future.
Keywords: Social Security Pension Benefit Population Aging
1. Introduction
In the beginning of 1980s, the policy of “one family one child” was introduced by China
government and powerfully put it into action, which causes sharp declining of the fertility rate in
China. At the same time, the restarted industrialization fundamentally changed people’s belief on
the birth of children, so the young people are no longer willing to have too many children.
Consequently, the young generation population of age 15-65 grows at a low rate in past ten years,
and even turns into declining in 2014. For example, the population size of age 15-64 drops from
1.00557 billion in 2013 to 1.00246 billion in 2016. Besides the declining of fertility rate, the life
expectancy has been rising considerably in the China, and it goes from 67.9 years in 1981 up to
76.5 years in 20161. The longer life expectancy induces a repaid growth of the number of the old,
which has been 149.33 million by the end of 2016. Because of the declining fertility rate and the
longer life expectancy, the old dependency ratio (ratio of the elderly of 65 and above and the
young between 15 and 64) goes up quickly in past ten years in the China (Figure 1). In 1990, the
aged dependency ratio of China was just 8.3%, and the young generation suffers light financial
pressure from supporting the old generation, which is one of the reasons for China's high
economic growth in past decades, called “Demographic Dividend” (Bloom, Canning et al. 2003,
1 National Bureau of Statistics of China, 2017, China Statistic Yearbook 2017, Beijing: China Statistic Press.

Wang and Mason 2007, Cai 2010, Cai and Lu 2013). When it experienced a mild growth from
1990 to 2008, the old-age dependency ratio began to speed up and its annual growth rate increased
from 1.73% during 1990 and 2008 to 3.74% during 2008 and 2016. In 2016, the old dependency
ratio reaches 15% which is almost as two times much as that in 1990. Now, China become a
country of the population aging, because its’ old dependency ration has been higher than the
national standard for the country of population aging (Gavrilov and Heuveline 2003).
Figure 1 the Old Dependency Ratio of Population from 1990 to 2016 in the China
Data source: National Bureau of Statistics of China, 2017, China Statistic Yearbook 2017, Beijing:
China Statistic Press.
The Population aging has many important socio-economic consequences and it presents a big
challenge to the pension scheme system in the country of population aging. A pension fund would
be in deficit because of the rapid increasing of the pension benefit demand created by the
population aging. By the end of 2016, the fund of the Urban Employee Pension Scheme (UEPS) in
7 provinces of China has been in deficit due to the high old dependency ratio. For example, the
UEPS in Heilongjiang province uses up the fund income in 2016 and all surplus accumulation in
previous years, and the pension fund has a deficit of RMB23.2 billion yuan by the end of 2016(S.
2017). Because of the increasing of the population aging in the China, the pension benefit demand
is going to increase quickly, and more and more provincial funds of the UEPS will be in deficit.
Jun Ma (2013) predicts funds of the UEPS in some provinces would begin to be in deficit and
must get subsidies from provincial governments to pay for the pension benefit. The sum of the
deficits will be equal to 5.5% of the GDP in 2050 and the sum of the subsidy from governments
will be as much as 20% of governments’ total expenditures. The accumulation of the pension
deficit from 2012 to 2050 is 75% of GDP in 2012 and its value is RMB 3.896 trillion yuan (Jun,
Xiaorong et al. 2012). The other projection on the deficit of the UEPS also shows that its’ size is
very great in next decades, and the accumulation of the deficit of all pension schemes in the China
from 2010 to 2050 would be RMB 5.75 trillion, which is equal to 143% of China's GDP in 2010.
Meanwhile, most deficit of all pension schemes comes from the UEPS (Xueliang 2014).
How to deal with the challenge of the pension scheme caused by the population aging is an
issue confronted by most countries all over the world. One measure is to transit the pay-as-you-go
model to a funded or a “multi-pillar” model. The transition of the pension scheme has happened to
7.00
8.00
9.00
10.00
11.00
12.00
13.00
14.00
15.00
16.00
199
0
199
1
199
2
199
3
199
4
199
5
199
6
199
7
199
8
199
9
200
0
200
1
200
2
200
3
200
4
200
5
200
6
200
7
200
8
200
9
201
0
201
1
201
2
201
3
201
4
201
5
201
6
Old Dependency Ratio(%)

many countries, such as the Chile, Argentina, Singapore, and Hong Kong in China (Asher and
Newman 2001, Mesa-lago 2002, De Mesa and Mesa-Lago 2006, Alzua and Ruffo 2011). In 1997,
a transition from a pay-as-you-go pension scheme model to a new “there pillars” model happened
to China’s pension scheme for the employee in urban area, and the UEPS is composed of a first
pillar financed on the pay-as-you-go basis, a second pillar like a personal saving account and an
optimal enterprise annuity. The motivation of the transition to the UEPS in the China is that a
funded or a mutipillar model pension scheme could alleviate the financial challenge to the UEPS
caused by population aging or is good for the economic growth by adding total saving (Mundial
1994, Shaoguang 1998, Feldstein 1999, Li 2000, Feldstein 2005). It is difficult to put the “there
pillars model” plan into action for China central government and local governments, because the
transition needs a great deal of money to fill individual accounts for who had joined the
enterprise-base pension. However, China governments do their best to push the structural reform
of the NEPS. In the multipillar scheme, an elderly retiree gets his pension benefit from two
sources, the basic pension benefit come from the first pillar and the other part of his pension is
paid by his individual account. While China has accomplished the structural reform of the UEPS,
researches on the pension scheme argue that a funded pension scheme doesn’t have a better
performance than a PAYG with reference to dealing with the challenge caused by the population
aging (Barr 2001, Barr 2002, Yonghong 2005, Barr and Diamond 2006). A new version of the
reform plan of the NEPS is put forward based on the new researches, i.e. a transition of the
multipillar model to the notional defined-contribution model financed on a pay-as-you-go basis
(Williamson 2003, Holzmann and Palmer 2006, Barr and Diamond 2010). The new findings are
frustrated, because China and other countries of the population aging are still at a risk of the
pension crisis, even though they have established a funded or “multi-pillar model” pension. If a
funded pension scheme doesn’t have a better performance on being against the population aging
than a PAYG scheme, does it have a worse performance than a PAYG scheme? if the answer is yes,
it should return to a PAYG pension scheme in countries whose pension schemes have transited to a
funded or multipillar model. if the answer is no, does it mean that both the PAYG and the funded
pension schemes can’t meet the pension benefit demand created by the population aging in the
future and the pension crisis will break out in countries of population aging? we make a
investigation to answer these two question.
2. The Basic Framework
2.1 The General Framework
A PAYG pension scheme is based on two-generations or consumption-loan model, and it is
lately developed by Peter. Diamond to the Overlap Generations Model (OLG) (Figure 2)
(Samuelson 1958, Diamond 1965, Samuelson 1975, Samuelson 1976). In the OLG model, a
young worker gets his job in a labor market and is paid a wage in every month. When he gets his
wage, he must pay some percent of his wage to a government in the term of the social security tax
in the U.S.A or social security contribution in the China. At the same time, the government
distributes pension revenue raised by the social security tax or social security contribution to a
elderly retiree in term of the pension benefit. The basis of a funded pension scheme is different
from a PAYG and it is based on Life-Cycle model (Shaoguang 1998, shaoguang 1998).In a
Life-Cycle model, a person save money when he is young and spend those saving when he is old,
so a retiree just consume his own saving, so his consumption has nothing to do with the social
security tax or contribution from young workers (Modigliani 1966, Feldstein 1974, Modigliani

1988, Imrohoroglu, Imrohoroglu et al. 1995, Shaoguang 1998). As a result, a funded pension
doesn’t affect by population aging. At the beginning of the time 1t , a young worker doesn’t
have any finical assets and the wage is his only income source, and he divides his wage into two
parts. One part is consumed immediately to meets his basic need, the other part is saved for the
consumption when he is in risk of losing income, such as sickness and oldness. The young
worker’s saving converts into the capital through financial markets to produce more products.
When it goes to the next time t , the young worker in time 1t retires and exchanges necessities
with another group of young workers in t to maintain his/her living, using his financial assets
accumulated in the time 1t . Why is the exchange feasible? Because the old retiree own
financial assets and want to exchange with the young worker for necessities to meet their basic
needs. Meanwhile, the young worker own necessities and want to exchange with the old retiree for
the financial assets to save goods they earned but can’t consumed up immediately to meet their
needs in the future. The necessities that retirees could get through the exchanging depend on
workers’ demand for financial assets or their willingness to save more products for the future in
time t , which is constrained by their wages. Thereby, the mechanism of a funded pension scheme
is the same as a PAYG, which is the distribution of the total income between the young worker
and the old retiree living at the same time. However, two kinds of the pension schemes allocate
products between two generations by two diverse ways. The PAYG pension scheme allocates is by
the government plan, while a funded pension scheme does that through markets.
Figure 2 Flow Chart of PAYG and Funded Pensions
2.2 The Mechanism of a PAYG Pension
Labor
Wag
e
PAYG pension
Return of K Formulation
of K
Wag
e
Labor
Worker
(Yong Generation)
Retiree
(Old Generation)
Y=F (A, K, L)
Government
The Financial
Market
Funded pension

In a PAYG pension scheme, there are two generations living at the time t, m workers (the
young generation) and n retirees (the old generation). Each worker pays social security tax
(contribution),it , to a government and each retiree gets his/her pension benefit,
jb , from the
government. The total demand of pension benefits for all retirees is D , and1
n
j
j
D b
; the total
supply of social security tax (contribution) from all workers is S , and1
m
i
i
S t
. Because the
social security tax (contribution) paid by each worker is a percent of his/her wage, so the total
supply of social security tax(contribution) could be expressed in the term of each worker’s wage,
iw , and the total wage,W , i.e.
1 1
.m n
i i
i i
S w w W
(1)
In equation (1), is the social security tax (contribution) rate in a PAYG pension. In an economy,
the percentage of the total wage accounting for total output always keeps constant, so the total
supply of social security tax(contribution) can finally be written in term of total output and per
capita output(Kaldor 1961), i.e.
( ).S Y y m n (2)
In equation (2), , ,Y y respectively denote the percentage of the total wage accounting for total
output, total output and per capita output, and ( )m n is the size of population in time t . When
the old dependency ratio of n retirees and m workers is , the size of the retirees, n , could be
expressed in *( )(1 )
m n
. Finally, the total demand of the benefits could be written in
term of the population, i.e.
1
( ) .(1 )
n
j
j
D b nb m n b
(3)
In equation (3), b denotes the average pension benefit received by all retirees in a PAYG pension
scheme. In a PAYG pension, the sum of total demand for pension benefits, D , and the surplus of
pension fund, Z , is equal to total supply of the social security tax(contribution), S , i.e.
.D Z S (4)
If 0Z , it denotes a surplus in a PAYG pension; if 0Z , it denotes a subsidy from the
government. The pension fund surplus Z is supposed to be a percent of the total demand of
pension benefits, Z D , and the equation (4) could be in the term of , D ,and , S , i.e.
(1 ) ,
( ) (1 ) ( ).(1 )
D S
m n b y m n
(5)
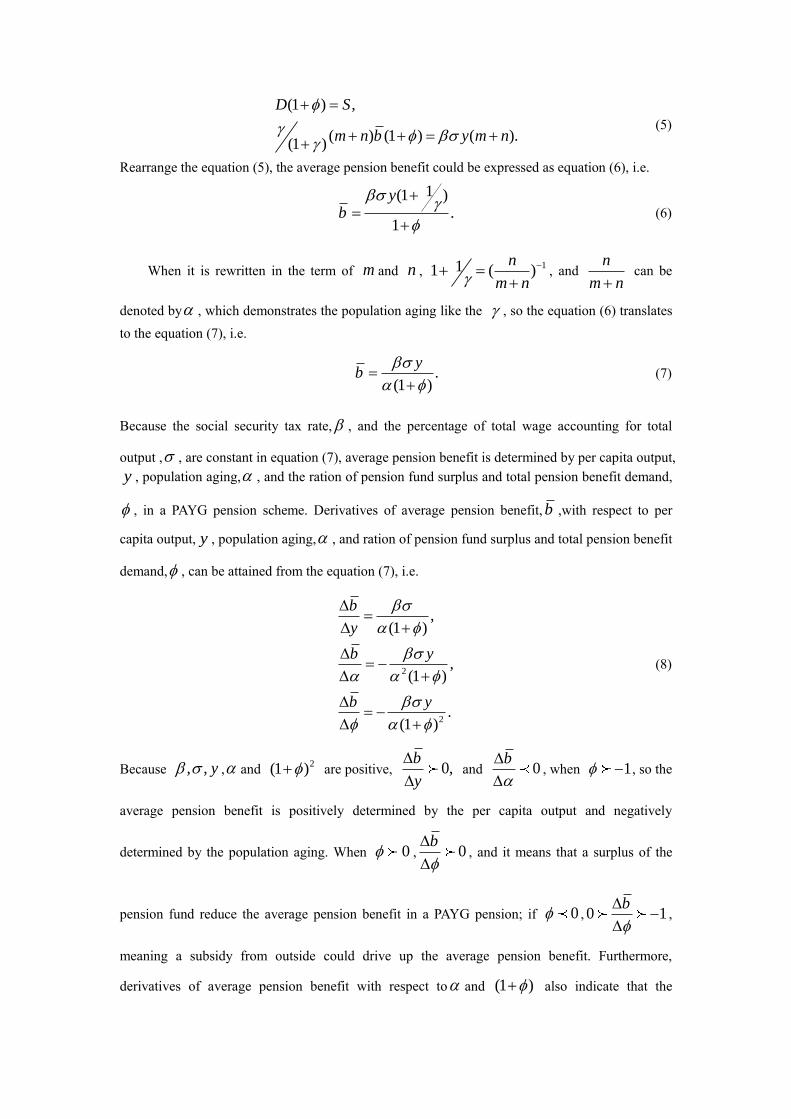
Rearrange the equation (5), the average pension benefit could be expressed as equation (6), i.e.
1(1 ).
1
yb
(6)
When it is rewritten in the term of m and n , 111 ( )
n
m n
, and
n
m n can be
denoted by , which demonstrates the population aging like the , so the equation (6) translates
to the equation (7), i.e.
.(1 )
yb
(7)
Because the social security tax rate, , and the percentage of total wage accounting for total
output , , are constant in equation (7), average pension benefit is determined by per capita output,
y , population aging, , and the ration of pension fund surplus and total pension benefit demand,
, in a PAYG pension scheme. Derivatives of average pension benefit, b ,with respect to per
capita output, y , population aging, , and ration of pension fund surplus and total pension benefit
demand, , can be attained from the equation (7), i.e.
2
2
,(1 )
,(1 )
.(1 )
b
y
b y
b y
(8)
Because , , y , and 2(1 ) are positive, 0,
b
y
and 0
b
, when 1 , so the
average pension benefit is positively determined by the per capita output and negatively
determined by the population aging. When 0 , 0b
, and it means that a surplus of the
pension fund reduce the average pension benefit in a PAYG pension; if 0 , 0 1b
,
meaning a subsidy from outside could drive up the average pension benefit. Furthermore,
derivatives of average pension benefit with respect to and (1 ) also indicate that the
population aging, and the pension fund surplus have two-way effects on the average pension
benefit in a PAYG pension. On one hand, the raising of the population aging, and the pension fund
surplus weaken the supply of the pension benefit; on the other hand, it would expand the demand
for the pension benefit.
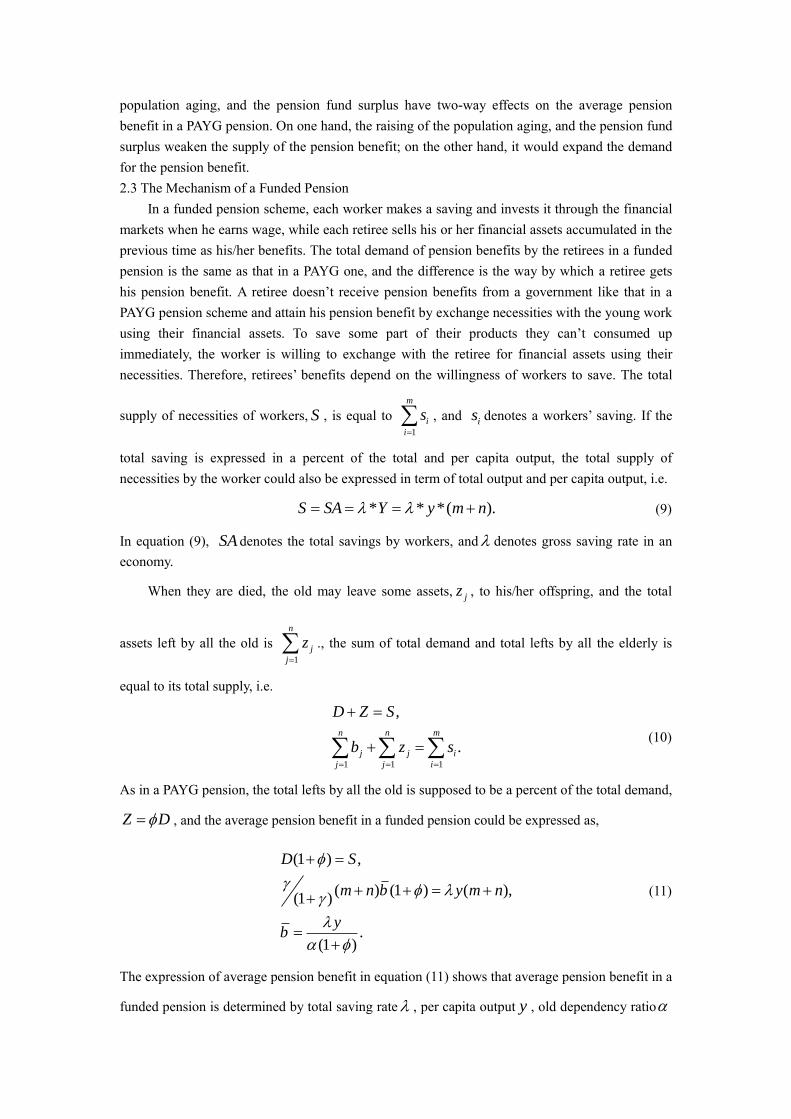
2.3 The Mechanism of a Funded Pension
In a funded pension scheme, each worker makes a saving and invests it through the financial
markets when he earns wage, while each retiree sells his or her financial assets accumulated in the
previous time as his/her benefits. The total demand of pension benefits by the retirees in a funded
pension is the same as that in a PAYG one, and the difference is the way by which a retiree gets
his pension benefit. A retiree doesn’t receive pension benefits from a government like that in a
PAYG pension scheme and attain his pension benefit by exchange necessities with the young work
using their financial assets. To save some part of their products they can’t consumed up
immediately, the worker is willing to exchange with the retiree for financial assets using their
necessities. Therefore, retirees’ benefits depend on the willingness of workers to save. The total
supply of necessities of workers, S , is equal to 1
m
i
i
s
, and is denotes a workers’ saving. If the
total saving is expressed in a percent of the total and per capita output, the total supply of
necessities by the worker could also be expressed in term of total output and per capita output, i.e.
* * *( ).S SA Y y m n (9)
In equation (9), SA denotes the total savings by workers, and denotes gross saving rate in an
economy.
When they are died, the old may leave some assets, jz , to his/her offspring, and the total
assets left by all the old is 1
n
j
j
z
., the sum of total demand and total lefts by all the elderly is
equal to its total supply, i.e.
1 1 1
,
.n n m
j j i
j j i
D Z S
b z s
(10)
As in a PAYG pension, the total lefts by all the old is supposed to be a percent of the total demand,
Z D , and the average pension benefit in a funded pension could be expressed as,
(1 ) ,
( ) (1 ) ( ),(1 )
.(1 )
D S
m n b y m n
yb
(11)
The expression of average pension benefit in equation (11) shows that average pension benefit in a
funded pension is determined by total saving rate , per capita output y , old dependency ratio

and the ratio of the fund surplus of an pension scheme and the total pension benefit demand, .
The gross saving rate of an economy always fluctuates in a very small interval. For example, the
household saving rate is about 20% in the China (Kuijs 2005, Xiaochuan 2009). Hence, the gross
saving rate is supposed to be a constant, especial for the household saving, so the average pension
benefit in a funded pension is determined by the per capita output y , the old-age dependency ratio
and the ratio of the fund surplus and the total pension benefit demand, . Derivatives of
average pension benefitb with respect to per capita output, y , aged dependency ratio, ,and the
percent of the lefts by all the old, , are presented in equation (12) .
2
2
,(1 )
,(1 )
.(1 )
b
y
b y
b y
(12)
In brief, the average pension benefit in both a PAYG and a funded pension schemes is
determined by the per capita output, the old-age dependency ratio, and the ratio of the pension
fund surplus and the total pension benefit demand, since the social security tax rate, , and the
percentage of total wage and total output, , in PAYG pension scheme and the gross saving rate,
, in a funded pension scheme are constant. When the 1 , the pension benefit is positively
correlated to the per capita output and negatively correlated to the old-age dependency ratio. If
0 1 , the ratio of the pension fund surplus and the total pension benefit demand positively
determines the average pension benefit; if the 0 , the ratio negatively determines the average
pension benefit.
3. The Empirical Test using China’s Provincial Panel Data
3.1 Model Specification
The linear expression of average pension benefit could be derived from the
log-transformation of equation (7) or equation (11), i.e.
0 1 2 3log log log log(1 ) .it i it it it itb y u (13)
In equation (13), 0 1, 2, 3,i are coefficients of the model, and , , ,it it it itb y respectively
denote average pension benefit, per capita output, old dependency ratio, and the ration of pension
fund surplus and the total pension benefit demand.
A series of tests are made to choose a model to fit the data. First, it needs to test if there is
unobserved heterogeneity in our data. If there is no unobserved heterogeneity in data, a pool
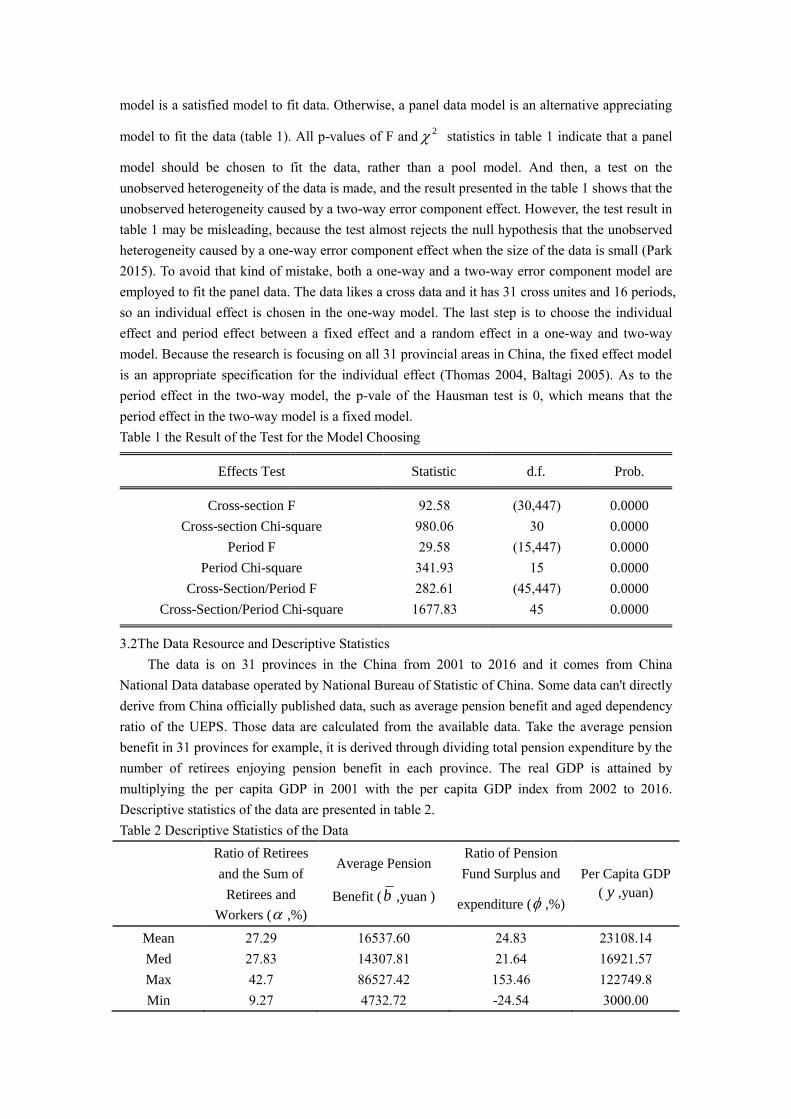
model is a satisfied model to fit data. Otherwise, a panel data model is an alternative appreciating
model to fit the data (table 1). All p-values of F and2 statistics in table 1 indicate that a panel
model should be chosen to fit the data, rather than a pool model. And then, a test on the
unobserved heterogeneity of the data is made, and the result presented in the table 1 shows that the
unobserved heterogeneity caused by a two-way error component effect. However, the test result in
table 1 may be misleading, because the test almost rejects the null hypothesis that the unobserved
heterogeneity caused by a one-way error component effect when the size of the data is small (Park
2015). To avoid that kind of mistake, both a one-way and a two-way error component model are
employed to fit the panel data. The data likes a cross data and it has 31 cross unites and 16 periods,
so an individual effect is chosen in the one-way model. The last step is to choose the individual
effect and period effect between a fixed effect and a random effect in a one-way and two-way
model. Because the research is focusing on all 31 provincial areas in China, the fixed effect model
is an appropriate specification for the individual effect (Thomas 2004, Baltagi 2005). As to the
period effect in the two-way model, the p-vale of the Hausman test is 0, which means that the
period effect in the two-way model is a fixed model.
Table 1 the Result of the Test for the Model Choosing
Effects Test Statistic d.f. Prob.
Cross-section F 92.58 (30,447) 0.0000
Cross-section Chi-square 980.06 30 0.0000
Period F 29.58 (15,447) 0.0000
Period Chi-square 341.93 15 0.0000
Cross-Section/Period F 282.61 (45,447) 0.0000
Cross-Section/Period Chi-square 1677.83 45 0.0000
3.2The Data Resource and Descriptive Statistics
The data is on 31 provinces in the China from 2001 to 2016 and it comes from China
National Data database operated by National Bureau of Statistic of China. Some data can't directly
derive from China officially published data, such as average pension benefit and aged dependency
ratio of the UEPS. Those data are calculated from the available data. Take the average pension
benefit in 31 provinces for example, it is derived through dividing total pension expenditure by the
number of retirees enjoying pension benefit in each province. The real GDP is attained by
multiplying the per capita GDP in 2001 with the per capita GDP index from 2002 to 2016.
Descriptive statistics of the data are presented in table 2.
Table 2 Descriptive Statistics of the Data
Ratio of Retirees
and the Sum of
Retirees and
Workers ( ,%)
Average Pension
Benefit (b ,yuan )
Ratio of Pension
Fund Surplus and
expenditure ( ,%)
Per Capita GDP
( y ,yuan)
Mean 27.29 16537.60 24.83 23108.14
Med 27.83 14307.81 21.64 16921.57
Max 42.7 86527.42 153.46 122749.8
Min 9.27 4732.72 -24.54 3000.00

Std. Dev. 5.98 9213.49 19.79 19913.21
Observations 496 496 496 496
3.3 Regression Result
The one-way fixed model is firstly used to fit the data, and the result is presented in the table
3. The Adjusted R-squared is 0.964, so the independent variables can collectively explain most
variance of the dependent variable, and the model (13) can fit the data very well. All independent
variables, , , ,it it itc y , have significant effect on the dependent variableitb , since all the p-values
of the estimates of 0 1 2 3, , , all less than 0.05 and all estimates of coefficients are not equal
to 0. The p-value of the F statistic of the model is 0, so the null hypothesis,
0 1 2 3 0. , is rejected. Overall, one-way fixed model could fit the data very well.
However, some assumption of the model may not be met and causes biased statistical inference,
such as serial correlation, cross-sectional dependence, and heteroscedasticity. We re-estimate the
one-way fixed model with the Driscoll and Kraay standard errors (the DK model), since the
statistics of the DK model are heteroscedasticity consistent and robust to very general forms of
cross-sectional and temporal dependence (Driscoll and Kraay 1998, Hoechle 2007) (table 3). The
p-values of the estimate of coefficients,1 2 3, , , are still less than 0.05 in the the DK model, so
independent variables have significant effect on the dependent variable. Meanwhile, the within R
squared is 0.962, which is the same as that in the fixed model. Estimates of1 2 3, , are1.016,
-0.267 and -0.292, and their signs are coincided with those in expression (8) or (12), confirming
the new findings. However, the value of the 1 is more than 1, and it means that 1% of the per
capita GDP could raise the average pension benefit 1.016%. In fact, the growth rate of the average
pension benefit of the UEPS is much less than 1 when the per capita GDP grow by 1%, so the
model should switch to a two-way fixed model.
When the data is fitted by a two-way fixed model, the p-values of estimates and the F
statistics are also less than 0.05 indicating that every independent variable and they together have
significant effect on the dependent variable. The2R and adjusted
2R are 0.983 and 0.981 and are
higher than those in a one-way, so the two-way fixed model have better performance on fitting the
data than the one-way fixed model. Besides a better performance, the test on the period effect also
shows that the time effect in the two-way fixed model is valid, so a two-way fixed model is better
choice to estimate the coefficients of the independent variables. In the estimation of the two-way
fixed model, the Driscoll and Kraay standard errors is employed to correct statistics. Although
there are some differences in the stand errors and t statistics between the FE model and DK model,
all p-values of the estimates show that they are significant in the DK model. In the two-way fixed
model, estimates of 0 1 2 3, , , are 7.658, 0.181, -0.134 and -0.14, and their signs are
coincided with that in expressions (8) and (12), so the two-way fixed model confirms effects of
the economic growth, the population aging and the the pension fund surplus on the average
pension benefit, i.e., the economic growth have a positive effect on the pension benefit; the

population aging, and pension fund surplus have a negative effect on the pension benefit.
Furthermore, vales of the estimate of 2 and
3 are less than the estimate of 1 , so the
negative effect of the population aging or pension fund surplus is weaker than positive effect of
the economic growth.
Because the ratio of the fund surplus in a pension scheme is affected by the average pension
benefit, an endogeneity problem is arisen in the estimation, which leads to the inconsistency of the
estimates in the two-way FE and DK model. To solve the problem of the endogeneity, an
estimation method of the IV-GMM is employed, and the lag 1 and 2 terms of the (1 ) are
picked up as instruments. A two-way fixed regression is made by a Stata command of the xtivreg2
and the result is presented in table 3(Schaffer 2010). At the first stage of the estimation, the
IV-GMM make a regression between the ratio of the fund surplus, (1 ), and its lag 1 and la 2
terms and other independent variables, such as the per capita output and the population aging.
P-values of the F-statistics in both a F test and SW multivariate F test is equal to 0, so the
instruments are correlated to the independent variable in the first stage regression. The Hansen J
statistic in table 3 is an index to indicate whether instruments are valid in the IV-GMM, and its’
value is 0.001, whose2 value is 0.9213, so instruments in the IV-GMM are uncorrelated to the
residual and they are valid. At the second stage, a regression between the average pension benefit
of the UEPS and the estimate of the (1 ) attained from the regression at the first stage and
other exogenous variables is made, such as the per capita GDP, the old dependency ratio. The
value of the F statistic is 528.83 and its’ p-value is 0, so the model used at the second stage of the
IV-GMM could fit the data and the independent variables together affect the dependent variable.
Both the centered R squared and uncentered R squared are 0.9801, so the model could fit the data
very well. The estimate of 1 is 0.131 and its’ p value is 0.287, so the estimate of the
1 may
be 0. However, the analysis in the demand-supply framework shows that the per capita output is a
key factor determining the average pension benefit, the per capita GDP should be kept in the
model. Estimates of 2 and 3 are -0.158 and -0.155 and their p-values are less than 0.05, so
both them have significant effect on the average pension benefit of the UEPS. The absolute value
of the estimate of 1 is smaller than that of the 2 or
3 , so the positive effect of the per
capita GDP on the average pension benefit is weaker than negative effect of the population aging
or the ratio of the pension fund surplus. Overall, the IV-GMM fits the data very well and remove
the endogeneity in the two-way fixed model, and its result confirms the conclusion attained from a
demand-supply framework.
Table 3 the Regression Result
Variable Coefficient Std. Error t-Statistic Prob.
One-Way
FE c -0.647 0.121 -5.356 0.000

y 1.016 0.010 103.664 0.000
-0.267 0.047 -5.666 0.000
1 -0.292 0.044 -6.632 0.000
R-squared 0.966 F-stat 403.167
Adjusted
R-squared 0.964 Prob (F-stat) 0.000
Durbin-Watson
stat 0.530
DK
c -0.647 0.416 -1.560 0.130
y 1.016 0.037 27.100 0.000
-0.267 0.053 -5.040 0.000
1 -0.292 0.082 -3.550 0.001
within R-squared 0.962
Two-Way
FE
c 7.658 0.572 13.381 0.000
y 0.181 0.058 3.139 0.002
-0.134 0.035 -3.843 0.000
1 -0.140 0.037 -3.795 0.000
R-squared 0.983 F-stat 543.578
Adjusted
R-squared 0.981 Prob (F-stat) 0.000
Durbin-Watson
stat 0.722
DK
c 7.658 0.517 13.650 0.000
y 0.181 0.062 2.930 0.006
-0.134 0.043 -3.160 0.004
1 -0.140 0.036 -3.910 0.000
within R-squared 0.981
IV-GMM
F test F - statistic 182.9 P 0
SW multivariate
F test F-statistic 182.9 P 0
y 0.131 0.073 1.070 0.287
-0.158 0.069 -2.300 0.021
1 -0.155 0.077 -2.010 0.045
F-statistic 528.83 P=0 Centered R
squared 0.9801
Hansen J statistic 0.01 P=0.9213
KP rk LM 15.632 P=0.004
statistic
4. China’s Population Aging in the Future and Its’ Effect on the Pension Benefit Demand of
the UEPS
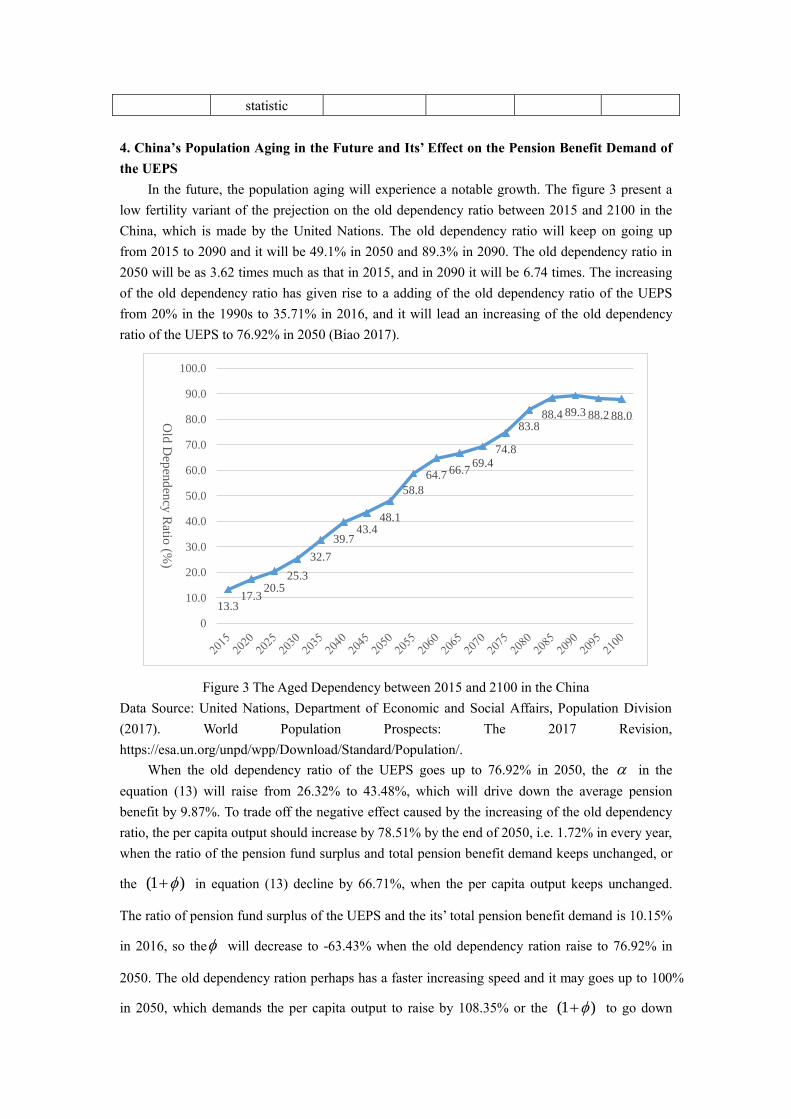
In the future, the population aging will experience a notable growth. The figure 3 present a
low fertility variant of the prejection on the old dependency ratio between 2015 and 2100 in the
China, which is made by the United Nations. The old dependency ratio will keep on going up
from 2015 to 2090 and it will be 49.1% in 2050 and 89.3% in 2090. The old dependency ratio in
2050 will be as 3.62 times much as that in 2015, and in 2090 it will be 6.74 times. The increasing
of the old dependency ratio has given rise to a adding of the old dependency ratio of the UEPS
from 20% in the 1990s to 35.71% in 2016, and it will lead an increasing of the old dependency
ratio of the UEPS to 76.92% in 2050 (Biao 2017).
Figure 3 The Aged Dependency between 2015 and 2100 in the China
Data Source: United Nations, Department of Economic and Social Affairs, Population Division
(2017). World Population Prospects: The 2017 Revision,
https://esa.un.org/unpd/wpp/Download/Standard/Population/.
When the old dependency ratio of the UEPS goes up to 76.92% in 2050, the in the
equation (13) will raise from 26.32% to 43.48%, which will drive down the average pension
benefit by 9.87%. To trade off the negative effect caused by the increasing of the old dependency
ratio, the per capita output should increase by 78.51% by the end of 2050, i.e. 1.72% in every year,
when the ratio of the pension fund surplus and total pension benefit demand keeps unchanged, or
the (1 ) in equation (13) decline by 66.71%, when the per capita output keeps unchanged.
The ratio of pension fund surplus of the UEPS and the its’ total pension benefit demand is 10.15%
in 2016, so the will decrease to -63.43% when the old dependency ration raise to 76.92% in
2050. The old dependency ration perhaps has a faster increasing speed and it may goes up to 100%
in 2050, which demands the per capita output to raise by 108.35% or the (1 ) to go down
13.317.3
20.525.3
32.7
39.743.4
48.1
58.8
64.7 66.769.4
74.8
83.888.4 89.3 88.2 88.0
0
10.0
20.0
30.0
40.0
50.0
60.0
70.0
80.0
90.0
100.0
Old
Dep
end
ency
Ratio
(%)

92.07% by the end of the 2050 to trade off the declining of the average pension benefit of the
UEPS, i.e. a yearly per capita output growth rate of 2.18% or a ratio of the pension fund surplus of
the UEPS to its’ expenditure of 91.26% (table 4). An increasing of the population aging in the
China will lead to a sharp going up of the pension benefit demand in the future, but the demand
could be met by a low per capita output growth. For example, a per capita output growth of 2.18%
in each year could meet the pension benefit demand created by a raising of the old dependency
ration to 100% in 2050. Besides that, a saving of worth more than RMB 5000 billion yuan from
the National Social Security Fund (NSSF) and the UEPS could provide subsidy to the UEPS to
meet the pension benefit demand caused by the increasing of the population aging. To sum up, the
increasing of the population aging creates a great pension benefit demand in the future, but it can
be met by an economic growth and a saving from the NSSF and the UEPS, when the average
pension benefit of the UEPS is kept unchanged until 2050.
Table 4 the Pension Benefit Demand of the UEPS Created by the Increasing of the Population
Aging (%)
b
g yg (1 )g
33.33 25.00 0.79 -6.02 5.11 15.78
33.90 25.32 0.60 -4.57 3.88 14.43
34.48 25.64 0.41 -3.09 2.62 13.04
35.09 25.97 0.21 -1.56 1.33 11.61
35.71 26.32 0.00 0.00 0.00 0.00
37.04 27.03 -0.43 3.25 -2.76 7.11
38.46 27.78 -0.88 6.69 -5.68 3.89
40.00 28.57 -1.36 10.32 -8.77 0.49
41.67 29.41 -1.86 14.16 -12.03 -3.11
43.48 30.30 -2.40 18.24 -15.50 -6.92
45.45 31.25 -2.97 22.57 -19.18 -10.98
47.62 32.26 -3.57 27.18 -23.10 -15.29
50.00 33.33 -4.22 32.10 -27.28 -19.90
52.63 34.48 -4.91 37.36 -31.75 -24.82
55.56 35.71 -5.65 43.00 -36.53 -30.09
58.82 37.04 -6.44 49.05 -41.68 -35.76
62.50 38.46 -7.30 55.56 -47.21 -41.85
66.67 40.00 -8.22 62.60 -53.19 -48.44
71.43 41.67 -9.23 70.23 -59.67 -55.58
76.92 43.48 -10.31 78.51 -66.71 -63.34
83.33 45.45 -11.50 87.56 -74.40 -71.80
100 50.00 -14.23 108.35 -92.07 -91.26
In fact, the average pension benefit of the UEPS can’t stay at the same level as that in 2016
until 2050, it will grow at some rate. If the average pension benefit will grow at the rate of 1% in
each year until 2050, it demands the per capita output to keep a growth rate of 7.61% in each year
when the population aging and the ratio of the pension fund surplus of the UEPS and its’
expenditure keep unchanged. The pension benefit demand caused by a 1% growth of the pension
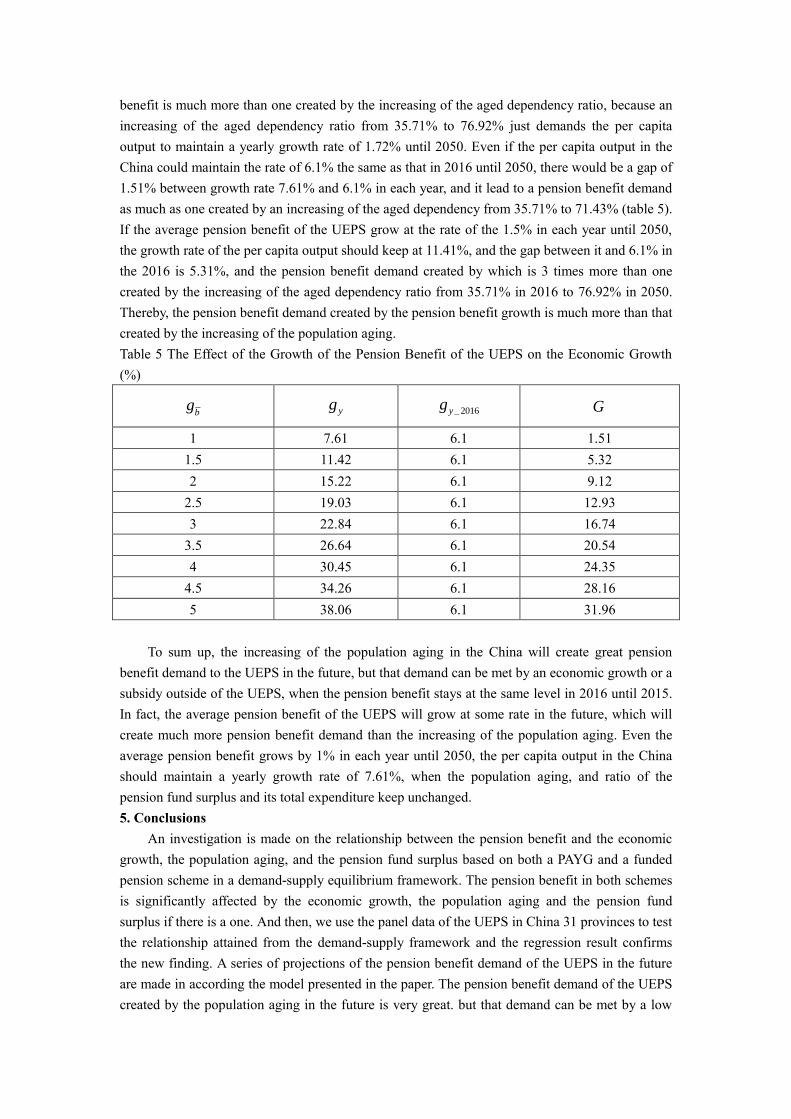
benefit is much more than one created by the increasing of the aged dependency ratio, because an
increasing of the aged dependency ratio from 35.71% to 76.92% just demands the per capita
output to maintain a yearly growth rate of 1.72% until 2050. Even if the per capita output in the
China could maintain the rate of 6.1% the same as that in 2016 until 2050, there would be a gap of
1.51% between growth rate 7.61% and 6.1% in each year, and it lead to a pension benefit demand
as much as one created by an increasing of the aged dependency from 35.71% to 71.43% (table 5).
If the average pension benefit of the UEPS grow at the rate of the 1.5% in each year until 2050,
the growth rate of the per capita output should keep at 11.41%, and the gap between it and 6.1% in
the 2016 is 5.31%, and the pension benefit demand created by which is 3 times more than one
created by the increasing of the aged dependency ratio from 35.71% in 2016 to 76.92% in 2050.
Thereby, the pension benefit demand created by the pension benefit growth is much more than that
created by the increasing of the population aging.
Table 5 The Effect of the Growth of the Pension Benefit of the UEPS on the Economic Growth
(%)
bg yg _ 2016yg G
1 7.61 6.1 1.51
1.5 11.42 6.1 5.32
2 15.22 6.1 9.12
2.5 19.03 6.1 12.93
3 22.84 6.1 16.74
3.5 26.64 6.1 20.54
4 30.45 6.1 24.35
4.5 34.26 6.1 28.16
5 38.06 6.1 31.96
To sum up, the increasing of the population aging in the China will create great pension
benefit demand to the UEPS in the future, but that demand can be met by an economic growth or a
subsidy outside of the UEPS, when the pension benefit stays at the same level in 2016 until 2015.
In fact, the average pension benefit of the UEPS will grow at some rate in the future, which will
create much more pension benefit demand than the increasing of the population aging. Even the
average pension benefit grows by 1% in each year until 2050, the per capita output in the China
should maintain a yearly growth rate of 7.61%, when the population aging, and ratio of the
pension fund surplus and its total expenditure keep unchanged.
5. Conclusions
An investigation is made on the relationship between the pension benefit and the economic
growth, the population aging, and the pension fund surplus based on both a PAYG and a funded
pension scheme in a demand-supply equilibrium framework. The pension benefit in both schemes
is significantly affected by the economic growth, the population aging and the pension fund
surplus if there is a one. And then, we use the panel data of the UEPS in China 31 provinces to test
the relationship attained from the demand-supply framework and the regression result confirms
the new finding. A series of projections of the pension benefit demand of the UEPS in the future
are made in according the model presented in the paper. The pension benefit demand of the UEPS
created by the population aging in the future is very great. but that demand can be met by a low

speed economic growth or a subsidy out of the UEPS or the mix of both, when the average
pension benefit stays at the same level in 2016. In fact, the average pension benefit will grow at
certain rate in the future, which will create much more pension benefit demand than one caused by
the increasing of the population aging. Even the average pension benefit grows by 1% in each year
until 2050, the per capita output in the China should maintain a yearly growth rate of 7.61%, when
the population aging, and the ratio of the pension fund surplus and the total expenditure keep
unchanged. Thereby, a pension crisis may break out caused by a so fast pension benefit growth,
not by the population aging in the future.
Reference:
Alzua, M. L. and H. Ruffo (2011). "Effects of Argentina's Social Security Reform on Labor Markets and
Poverty." PEP MPIA Working Paper No. 2011-11.
Asher, M. and D. Newman (2001). "Hong Kong and Singapore: Two approaches to the provision of
pensions in Asia." Pensions: An International Journal 7(2): 155-166.
Baltagi, B. (2005). Econometric Analysis of Panel Data, John Wiley & Sons.
Barr, N. (2001). "The truth about pension reform." Finance and development 38(3): 6-9.
Barr, N. (2002). "Reforming pensions: myths, truths, and policy choices." International social security
review 55(2): 3-36.
Barr, N. and P. Diamond (2006). "The economics of pensions." Oxford Review of Economic Policy 22(1):
15.
Barr, N. and P. Diamond (2010). Pension Reform in China: Issues, Options and Recommendations.
China Economic Research and Advisory Programme.
Biao, L. (2017). "It Will be 1.3 Youngers support 1 old Person in 2015 in the China, and A Tax-Deffered
Annunity Pilot will be put into Action." National Business Daily Retrieved 24/1, 2018, from
http://www.nbd.com.cn/articles/2017-03-30/1089748.html.
Bloom, D., D. Canning and J. Sevilla (2003). The Demographic Dividend: A New Perspective on the
Economic Consequences of Population Change, Rand Corporation.
Cai, F. (2010). "Demographic transition, demographic dividend, and Lewis turning point in China."
China Economic Journal 3(2): 107-119.
Cai, F. and Y. Lu (2013). "Population change and resulting slowdown in potential GDP growth in China."
China & World Economy 21(2): 1-14.
De Mesa, A. A. and C. Mesa-Lago (2006). "The Structural Pension Reform in Chile: Effects,
Comparisons with Other Latin American Reforms, and Lessons." Oxford Review of Economic Policy
22(1): 149.
Diamond, P. A. (1965). "National debt in a neoclassical growth model." The American Economic
Review 55(5): 1126-1150.
Driscoll, J. C. and A. C. Kraay (1998). "Consistent covariance matrix estimation with spatially
dependent panel data." The Review of Economics and Statistics 80(4): 549-560.
Feldstein, M. (1974). "Social Security, Induced Retirement, and Aggregate Capital Accumulation."
Journal of Political Economy 82(5): 905-926.
Feldstein, M. (1999). "Social Security Pension Reform in China." China Economic Review 10(2): 99-107.
Feldstein, M. (2005). "Structural Reform of Social Security." The Journal of Economic Perspectives
19(2): 33-55.
Gavrilov, L. A. and P. Heuveline (2003). "Aging of population." The encyclopedia of population 1:
32-37.
Hoechle, D. (2007). "Robust standard errors for panel regressions with cross-sectional dependence."
Stata Journal 7(3): 281.
Holzmann, R. and E. E. Palmer (2006). Pension reform: issues and prospects for non-financial defined
contribution (NDC) schemes, World Bank Publications.
Imrohoroglu, A., S. Imrohoroglu and D. H. Joines (1995). "A Life Cycle Analysis of Social Security."
Economic Theory: 83-114.
Jun, M., Z. Xiaorong, L. Zhiguo, X. Minzhi, X. Jiangang and H. Dong (2012). "The Alleviation of Midle
and Long Run Risk in China's Assets and Defits." Cai Jing 2012(15): 25-37.
Kaldor, N., Ed. (1961). Capital Accumulation and Economic Growth. The Theory of Capital. London,
Macmillan.
Kuijs, L. (2005). Investment And Saving In China. Policy Research Working Papers. Beijing, The World
Bank.
Li, H. (2000). "Economic Efficiency and Social Insurance Reforms in China." Contemporary Economic
Policy 18(2): 194-204.
Mesa-lago, C. (2002). "Myth and Reality of Pension Reform: The Latin American Evidence." World
Development 30(8): 1309-1321.
Modigliani, F. (1966). "The Life Cycle Hypothesis of Saving, the Demand for Wealth and the Supply of
Capital." Social Research: 160-217.
Modigliani, F. (1988). "The Role of Intergenerational Transfers and Life Cycle Saving in the
Accumulation of Wealth." The Journal of Economic Perspectives: 15-40.
Mundial, B. (1994). Averting the Old Age Crisis: Policies to Protect the Old and Promote Growth, World
Bank.
Park, H.-M. (2015). Practical Guides to Panel Data Analysis. Niigata-ken.
S., M. O. H. R. S. (2017). China Social Security Development Annual Report(2016). Beijing, China Labor
and Social Security Press.
Samuelson, P. A. (1958). "An Exact Consumption-Loan Model of Interest with or without the Social
Contrivance of Money." The Journal of Political Economy 66(6): 467-482.
Samuelson, P. A. (1975). "The Optimum Growth Rate for Population." International Economic Review:
531-538.
Samuelson, P. A. (1976). "The Optimum Growth Rate for Population: Agreement and Evaluations."
International Economic Review: 516-525.
Schaffer, M. E. (2010). xtivreg2: Stata module to perform extended IV/2SLS, GMM and AC/HAC, LIML
and k-class regression for panel data models.
Shaoguang, L. (1998). The Pension System and the Capital Market, Beijing: Development Press of
China (in Chinese).
shaoguang, L. (1998). "Pension: the Comparing between Pay-As-You-Go and Funded Model."
Economic Research Journal 1998(1): 59-65.
Thomas, A. (2004). Advanced Econometrics: Panel Data Econometrics and GMM Estimation. Doctoral.
Toulouse School of Economics.
Wang, F. and A. Mason (2007). Demographic dividend and prospects for economic development in
China. United Nations Expert Group Meeting on Social and Economic Implications of Changing
Population Age Structures.
Williamson, J. (2003). "The Applicability of the Notional Defined Contribution Model for China." China
& World Economy 3: 001.
Xiaochuan, Z. (2009). "The Raising of the Gross Saving Rate in China is Mainly Caused by Enterprises
and Goverments." The News of China Retrieved 10/31, 2017, from
http://www.gov.cn/jrzg/2009-07/05/content_1357492.htm.
Xueliang, L. (2014). "Study on the Financing Gap and Sustainability of China's Pension System." China
Industrial Economics 2014(09): 25-37.
Yonghong, C. (2005). "Quantifying Analysis on the Relationship between PAYG System and Population
Aging [J]." Economic Research Journal 2005(3): 57-68.