will renevable energy save and protect natural environment? · will renevable energy save and...
TRANSCRIPT

Will Renevable energy save andprotect natural ENVIRONMENT?
Dr inż. Jacek Wereszczaka University of Agriculture in Szczecin, POLAND
Eberswalde 2006

Strip mine of brown coal

The EU’s general target for renewable energy (1997)
By 2010, renewable energy’s share of gross inland energy consumption in the EU15 should reach 12%
(Source: 1997 White Paper “Energy for the future”, COM (1997) 599. Calculated under the classical method; equivalent to 14.5% under the substitution method)

Prime objectives of EU renewable energy policy:
Reduce CO2 emissionsMore secure supply
of energy
Renewable energy sources:
Günther HanreichDirector DG Energy and TransportEuropean Commission

Additional benefits:
-improve air quality
-create jobs andbusinesses, many in rural areas
Renewable energy sources:
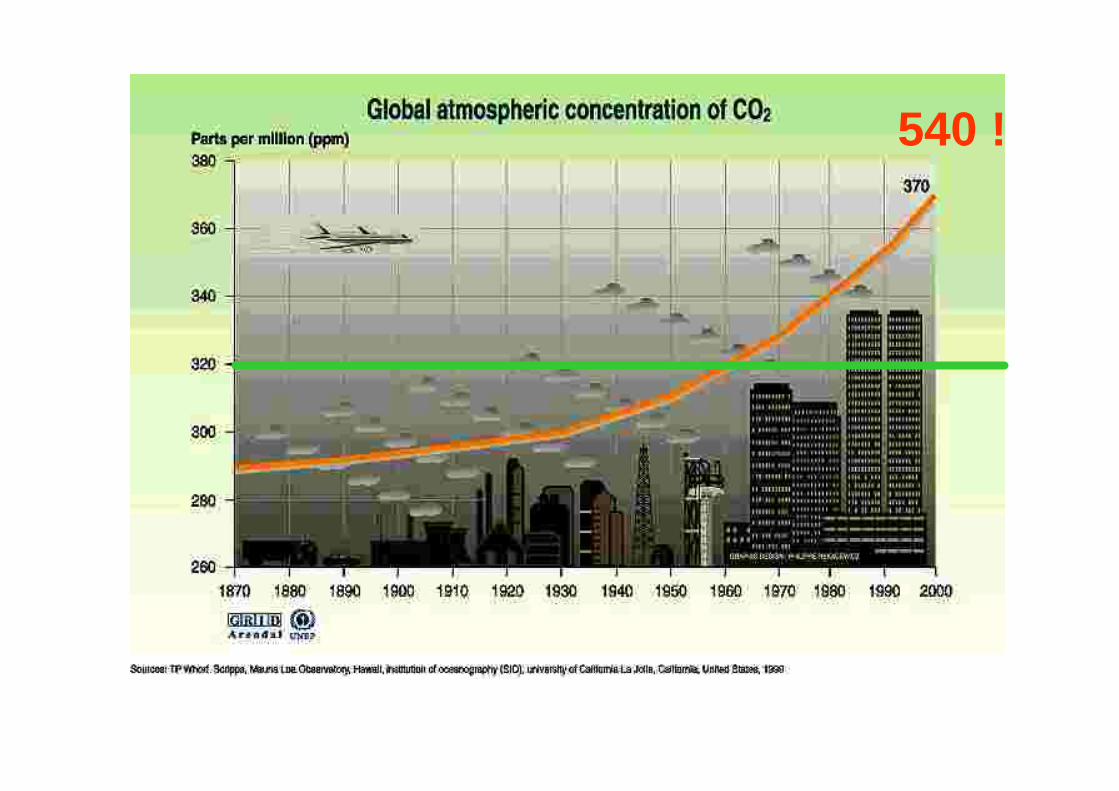
540 !

?

Źródło: IIASA 1995 – Global Energy Perspectives to 2050 and Beyond
CoalPetroleum
Gas Nuklear
RiverBiomass
Past Future

Where will the biomass come from?
- we probably need an additional
70-80 Mtoe per year

- Agriculture?
1. FOOD2. FEED3. FIBRE4. BIOMASS

- Wastes?

- Forestry?

Poland 1996 y.
Źródło: GUS 1997 – Gospodarka Paliwowo – Energetyczna w latach 1995 - 1996
4,7%

Poland – only 2,6% total energyconsumption becoming from
renewable sources
(Pruszyski i Gacek 2005)

• 8.07.2000 Rezolucja Sejmu RP:„W sprawie wzrostu wykorzystania energii ze źródeł odnawialnych”
• 9.09.2000 Rada Ministrów RP: „Strategia rozwoju energetyki odnawialnej”
• 23.08.2001 Sejm RP: „Strategia rozwoju energetyki odnawialnej”
Target:2010 y. – 7,5%2020 y. – 14%

Rok Year Procentowy udział energii z OZE w bilansieenergetycznym kraju % RES
2004 2,852005 3,102006 3,602007 4,202008 5,002009 6,002010 7,50źródło: wg Rozporzdzenia Ministra Gospodarki, Pracy i Polityki Społecznej z 30.05.2003 r.

Wielkość potencjału technicznego energii możliwa do pozyskania z odnawialnych źródeł energii w ciągu roku w Polsce.
4069,6Całkowite zużycie energii pierwotnej w Polsce w 1998 roku
ok. 14143372514Ogółem
370551340Promieniowanie słoneczne
4-5436Energia wiatru
ok. 200100200Zasoby geotermalne
305043Energia wodna
810128895Biomasa
Według raportu przygotowanego na potrzeby
Banku Światowego**PJ
Według strategii redukcji emisji gazów cieplarnianych
PJ
Według ekspertyzyEC BREC*Źródła energii
* ,, Ekologiczne i prawne aspekty wykorzystania ” (EC BREC, 2000)** Hauff, 1996

Wind energy in Poland

Geothermal energy in Poland

In an EU of 25 members, HOW MUCH RENEWABLE ENERGY DO WE NEED TO MEET OUR GENERAL TARGET?
Using the substitution method and extending the “12%” target to include the new Member State, we need to move from 146 Mtoe of renewable energy in 2000 to 260 Mtoe in 2010 - an increased contribution of 114 Mtoe
1995 2000 2010
Total energy consumption
1623 Mtoe
1700 1847
Renewable energy contribution
127 146 260

Renewable energy's contribution in the EU25 (Mtoe)
127 128 131 138 139 146 153
260
1995
1996
1997
1998
1999
2000
2001
2010
targe
t

Contribution of renewable energy sources, EU25 (Mtoe, substitution method)
74
1 3
5082
6 4
617237
8
143
hydro wind solar +geothermal
biomass
1995
2001
2010 (sketch)

Rosa sp.
Helianthus sp.

1,281,371,89Popiół, %
19,5619,2518,55Wartość kaloryczna drewna, MJ/kg s.m.
46,0549,6252,86Wilgotność drewna, %
21,616,114,9Plon suchej masy drewna, t/ha rocznie
co roku co 2 lata co 3 lata
Częstotliwość zbioru pędów
Rodzaj danych
Salix sp.
Miscanthus sp.
Sida sp.

Polygonumcuspidatum
as a additionalsource of
Bioenergy – thefield experimet

The present research was carried outover 2004-2005,
on good rye soil suitability complex.
In Agricultural Experiment Station Lipnik, near of Stargard Szczeciński – Poland.Long-term annual mean precipitation is
550 mm.
Polygonum cuspidatum(Sieb. & Zucc.)

The first factor (I): number of harvest per year:
A – one time per year,B – twice per year.
The second factor (II): nitrogenfertilization, on the first year only:
1- 0 kg.ha-1 ,2 - 25 kg.ha-1,3 - 50 kg.ha-1,4 - 75 kg.ha-1,
5 - 100 kg.ha-1.
(N)

A - oneB - twice
The first factor (cuttig)

12
34
5
The secound factor(N fertilization)

Growthdynamic ofPolygonum
30
40
50
60
70
80
90
150 160 170 180 190 200 210 220 230 240 250
dzień ka le nda rzow y roku
w ys okś ć c m
1 2 3 4 5
28,08.2004
The day of the year
Heigh of plant (cm)

Table 1. Yield of Polygonum cuspidatum(g dry matter per plant - the first year - 2004)
115,4140,8119119,5122,575,3Mean
159,7170,3154,9175,4184,3113,6B*
71,1111,383,0663,5360,6336,96A*
54321 Mean
N - fertilizationNumberof
cutting
LSD 0,05 I = 56,47LSD 0,05 II = 41,71LSD 0,05 II/ I = 58,99

2004
020406080
100120140160180200
A B
g DM

2004
0
50
100
150
200
0 25 50 75 100 kg N
g DM

Productivity of N (2004 y.)
Produktywność 1 g azotu wyrażona w plonie suchej masy rdestu ostrokończystego (g).
5,65,1555,23,564
12,22,35327,34,752
––1*
DMDM
BA*

DM
Sucha ma s a
0
5
10
15
20
25
30
0 2 4 6 8g * N
A
B
g. s . m.

Table 2. Yield of Polygonum cuspidatum(g dry matter per plant - the secound year - 2005)
425,0440,0420,8395,8,472,5395,8Mean
573,3525567537680558B*
276,7355275255265233A*
54321 Mean
N - fertilizationNumberof
cutting
LSD 0,05 I = 1,572LSD 0,05 II = 46,738LSD 0,05 II/ I = 71,165

2005
0
100
200
300
400
500
600
A B
g DM

2005
0
100
200
300
400
500
600
0 25 50 75 100 kg N
g DM

Productivity of N (2005 y.)
Produktywność 1 g azotu wyrażona w plonie suchej masy rdestu ostrokończystego (g).
-4,1715,251,46,94-5,45,4360,815,82
––1*
DMDM
BA*

DM
Suc ha ma s a
-10
0
10
20
30
40
50
60
70
0 2 4 6 8g * N
A
B
g. s . m.

Energy on dry matter
27
16
etanol
POLYGONUM CUSPIDATUM
38olej roślinny42olej opałowy32węgiel kamienny20węgiel brunatny16drewno15celuloza16trawa chińska
MJ x kg-1materiał
Source: Ekopartner 2001
Source: Cieśla 1998

Table 2. Yield of energy per one plant per year[MJ].
4,3204,654,324,124,783,77Mean
5,685,565,775,706,915,38
2,873,732,862,552,612,16
54321
A*
B*
Mean
N - fertilizationNumber ofcutting

Reduced emission of CO2
» T DM GJ Energy = t carbon kg CO2
• 12 500 3,38 54,04 1,58 371
• 20 000 5,40 86,46 2,52 592
• 30 000 8,11 129,7 3,78 880
Emission ofPlant number per 10 000 sqm

Conclusions• Polygonum cuspidatum can be an additionally
sources of renewably energy.• It can be recommended especially for
reclamation of devastated soils.• The best resoult will be recive in plot where the
two plants per 1 sqrm, with two times of cutting, with only 25 kg N per ha fertilization are apply(The yield of DM in 2005 -16,6 t .ha-1).
• Additional profit: we can decrease emission ofCO2 by-592 kg useing for energy biomass from1 ha of reclamation soil.

Thank you for your kindly attention