will global warming make hurricane forecasting …
TRANSCRIPT
As the climate continues to warm, hurricanes may intensify more rapidly just before
striking land, making hurricane forecasting more difficult.
WILL GLOBAL WARMING MAKE HURRICANE FORECASTING
MORE DIFFICULT?Kerry emanuel
S ince 1971, tropical cyclones have claimed about 470,000 lives, or roughly 10,000 lives per year, and caused 700 billion U.S. dollars in damages globally
(CRED 2016). Mortality is strongly dominated by a small number of extremely lethal events; for example, just three storms caused more than 56% of the tropical cyclone–related deaths in the United States since 1900.
Tropical cyclone mortality and injury have been reduced by improved forecasts and preparedness, espe-cially in developed countries (Arguez and Elsner 2001; Peduzzi et al. 2012), but through much of the world this has been offset by large changes in coastal popula-tions. For example, Peduzzi et al. (2012) estimate that the global population exposed to tropical cyclone hazards increased by almost threefold between 1970 and 2010, and they project this trend to continue for at least a few decades. This large increase in coastal population is reflected in rapidly increasing tropical
cyclone damage, rising on average 6% yr–1 in inflation-adjusted U.S. dollars between 1970 and 2015 (CRED 2016). Thus, appreciable increases in forecast skill and/or decreases of vulnerability, for example, through better preparedness, building codes, and evacuation procedures, will be required to avoid increases in cyclone-related casualties.
Unfortunately, there has been little improvement in tropical cyclone intensity forecasts over the period from 1990 to the present (DeMaria et al. 2014). While hurricane track forecasts using numerical prediction models have steadily improved, there has been only slow improvement in forecasts of intensity by these same models. Reasons for this include stiff resolu-tion requirements for the numerical simulations of tropical cyclone intensity (Rotunno et al. 2009), poor understanding and modeling of boundary layer processes (Nolan et al. 2009; Andreas et al. 2015), and the difficulty of correctly modeling the response of the upper ocean to storms (Yablonsky and Ginis 2009). In addition, assimilating observations into models containing intense localized features challenges most operational assimilation algorithms (Ravela et al. 2007).
Forecasting unusually rapid intensification of hurricanes is particularly problematic. A recent case in point is Hurricane Patricia, which affected the eastern North Pacific in 2015. During a 24-h period from 0600 UTC 22 October to 0600 UTC 23 October,
AFFILIATION: emanuel—Lorenz Center, Massachusetts Institute of Technology, Cambridge, MassachusettsCORRESPONDING AUTHOR E-MAIL: Kerry Emanuel, [email protected]
The abstract for this article can be found in this issue, following the table of contents.DOI:10.1175/BAMS-D-16-0134.1
In final form 8 August 2016©2017 American Meteorological Society
495MARCH 2017AMERICAN METEOROLOGICAL SOCIETY |

Patricia intensified by an astonishing 105 (kt; 1 kt = 0.51 m s–1), from a 75-kt category 1 storm to a 180-kt category 5 storm (Landsea and Franklin 2013; NHC 2016). During this same period, the National Hurricane Center (NHC) predicted an intensification by only 30 kt. Had the storm made landfall at the end of this period of rapid intensification, the result could have been catastrophic given the poor anticipation of the magnitude of the event.
Figure 1 displays the tracks and intensities of two notorious Atlantic hurricanes that intensified rapidly just before striking land. The first of these, Hurricane Audrey in 1957, was the sixth-deadliest hurricane to affect the United States, killing at least 416 (Blake et al. 2011), a death toll not exceeded again until Hurricane Katrina in 2005. Audrey formed late on 25 June in the Bay of Campeche and moved slowly northward while strengthening rapidly, reaching hurricane status only a few hours after being declared a tropical storm (Landsea and Franklin 2013; NHC 2015). The official forecast issued by the Weather Bureau in New Orleans, Louisiana, at 2200 local time 26 June noted winds of 85 kt and predicted that the storm would make landfall late the following day. News reports encouraged resi-dents to wait until morning to prepare or evacuate. But Audrey accelerated northward and intensified rapidly, reaching the coast the next morning with winds of around 130 kt. The unexpected intensity and early landfall caught residents off guard and contributed to the large loss of life.
Although Audrey was tracked by radar, there were no satellites in 1957, and numerical weather predic-tion of hurricanes was at least a decade away. All of this new technology was operating in 2007, but it did not prevent serious underprediction of the landfall intensity of Hurricane Humberto (Fig. 1). Humberto formed offshore from the Texas coast on 12 September and made landfall at High Island, Texas, one day later (Landsea and Franklin 2013; NHC 2015). In that one day, its peak winds increased from 25 to 80 kt at the time of landfall. A mere 18 h before landfall, the NHC predicted a landfall intensity of just 40 kt, increasing that estimate to 55 kt in a forecast issued 6 h later (Sampson and Schrader 2000, 2007). Fortunately, even with its exceptionally rapid intensification, Humberto was much weaker than Audrey at landfall, and dam-age was relatively light, with a single fatality reported.
By contrast, the residents of New Orleans had at least 60 h of notice (Sampson and Schrader 2000, 2007) that intense Hurricane Katrina, an exception-ally well-predicted storm, would affect their city. Yet, excellent forecasts did not prevent the loss of over 1,000 lives. To be sure, this high mortality was owing
mostly to failure of levees and to local government incompetence (Brinkley 2006), yet it seems likely that the toll would have been far greater had Katrina not weakened before landfall.
QUANTIFYING THE PROBABILITY OF RAPID INTENSIFICATION JUST BEFORE LANDFALL. Just how likely is a tropical cyclone to undergo rapid intensification right before land-fall? Answering this question with historical tropical cyclone data is problematic for a variety of reasons. Before the era of airborne reconnaissance, satellites, and coastal radar, estimates of wind speeds relied on chance encounters of storms with islands or ships. Although aircraft penetrations of tropical cyclones began in the mid-1940s in the Atlantic and western North Pacific regions, quantitative measurements of wind speeds were not possible until the late 1950s when inertial navigation was implemented on recon-naissance aircraft. While airborne missions continue to this day for storms threatening the United States and nearby nations, they were discontinued in the western North Pacific region in 1987. Thus, there are roughly 60 years of reliable measurements of near-coastal Atlantic storms, while elsewhere, storm intensity estimates have relied mostly on satellite-based inferences since about 1980. Yet, for many purposes of risk assessment, we are interested in storms whose return periods are 100 years or greater.
For this reason, and because we also wish to examine the effects of projected climate change on the probability of rapid intensification before landfall, we turn to numerically simulated storms. We begin with a set of 22,000 continental U.S. landfalling storms downscaled from National Centers for Environ-mental Prediction–National Center for Atmospheric Research (NCEP–NCAR) reanalyses (Kalnay et al. 1996) over the period 1979–2005 using the technique described in detail by Emanuel et al. (2008). Broadly, the technique begins by randomly seeding with weak proto-cyclones the large-scale, time-evolving state given by the reanalysis data. These seed disturbances are assumed to move with the reanalysis-provided, large-scale flow in which they are embedded, plus a westward and poleward motion owing to planetary curvature and rotation. Their intensity is calculated using the Coupled Hurricane Intensity Prediction System (CHIPS; Emanuel et al. 2004), a simple axisym-metric hurricane model coupled to a reduced upper-ocean model to account for the effects of upper-ocean mixing of cold water to the surface. Applied to the synthetically generated tracks, this model predicts that a large majority of the disturbances dissipate
496 MARCH 2017|

owing to unfavorable environments. Only the “fittest” storms survive; thus, the technique relies on a kind of natural selection. Extensive comparisons to historical events by Emanuel et al. (2008) and subsequent papers provide confidence that the statistical properties of the simulated events are in line with those of histori-cal tropical cyclones. Of particular importance to the present study, Kowch and Emanuel (2015) showed that the statistics of 2- and 6-h intensity changes of the synthetic events are statistically indistinguishable from those of historical storms; both have exponential prob-ability distributions. The response to global warming of both the frequency and intensity of the synthetic events compares favorably to that of more standard downscaling methods applied to the Coupled Model Intercomparison Project phase 3 (CMIP3) generation of climate models (Christensen et al. 2013).
This study uses monthly mean upper-ocean thermal structure from the CMIP5 models, as detailed in Emanuel (2015), varying from year to year as with the atmospheric model variables. One potential concern is the extent to which the CMIP5 models used here properly capture the spatial and temporal variability of upper-ocean thermal structure, which is so important for tropical cyclone intensity and intensity change (Bender et al. 1993), particularly in the Gulf of Mexico, where upper-ocean thermal variability can be quite large.
Here, we calculate the 24-h change in peak 1-min average wind speed at the standard measurement altitude of 10 m, between the 2-h data point at or just before landfall and the data point 24 h before that. We apply the same algorithm to historical events interpolated from their native 6-h resolution to 2 h.
Figure 2 shows the annual exceedance prob-abilities of intensity changes in the 24 h leading up to (continental) U.S. landfall and compares them to estimates based on historical storm data. We created 1,000 subsamples of the 22,000-member synthetic event set, each at the overall rate given by the his-torical data, and display in Fig. 2 intervals within which 90% of the probabilities from the subsamples lie. Thus, the historical data are consistent with the
Fig. 1. Tracks and intensities of Hurricanes (left) Audrey in 1957 and (right) Humberto in 2007.
Fig. 2. Annual exceedance probability of increases in peak wind speeds in tropical cyclones in the 24 h leading up to U.S. landfall from 22,000 synthetic events (yellow) and 284 historical events in the period 1950–2015 (blue). The probabilities are for 24-h intensity changes exceeding the values displayed on the abscissa. The error bars show limits between which 90% of limited subsamples of the synthetic distribution lie, subsampled at the rate of the historical events.
497MARCH 2017AMERICAN METEOROLOGICAL SOCIETY |
synthetic events to within the rather loose confidence intervals dictated by the small size of the historical dataset.
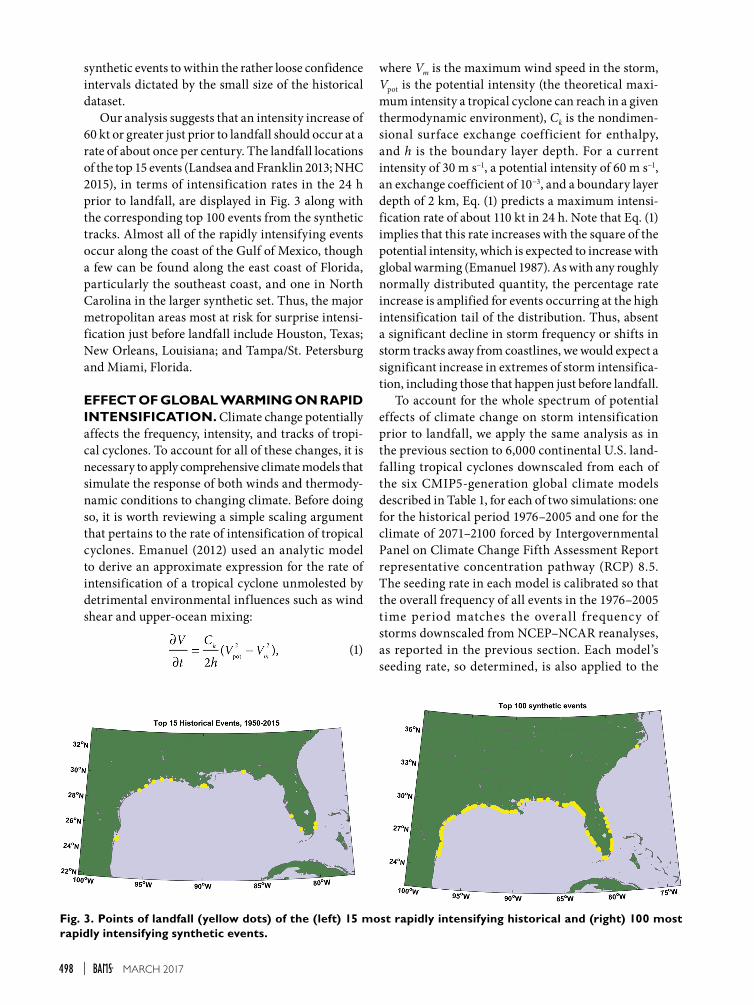
Our analysis suggests that an intensity increase of 60 kt or greater just prior to landfall should occur at a rate of about once per century. The landfall locations of the top 15 events (Landsea and Franklin 2013; NHC 2015), in terms of intensification rates in the 24 h prior to landfall, are displayed in Fig. 3 along with the corresponding top 100 events from the synthetic tracks. Almost all of the rapidly intensifying events occur along the coast of the Gulf of Mexico, though a few can be found along the east coast of Florida, particularly the southeast coast, and one in North Carolina in the larger synthetic set. Thus, the major metropolitan areas most at risk for surprise intensi-fication just before landfall include Houston, Texas; New Orleans, Louisiana; and Tampa/St. Petersburg and Miami, Florida.
EFFECT OF GLOBAL WARMING ON RAPID INTENSIFICATION. Climate change potentially affects the frequency, intensity, and tracks of tropi-cal cyclones. To account for all of these changes, it is necessary to apply comprehensive climate models that simulate the response of both winds and thermody-namic conditions to changing climate. Before doing so, it is worth reviewing a simple scaling argument that pertains to the rate of intensification of tropical cyclones. Emanuel (2012) used an analytic model to derive an approximate expression for the rate of intensification of a tropical cyclone unmolested by detrimental environmental influences such as wind shear and upper-ocean mixing:
(1)
where Vm is the maximum wind speed in the storm, Vpot is the potential intensity (the theoretical maxi-mum intensity a tropical cyclone can reach in a given thermodynamic environment), Ck is the nondimen-sional surface exchange coefficient for enthalpy, and h is the boundary layer depth. For a current intensity of 30 m s−1, a potential intensity of 60 m s−1, an exchange coefficient of 10−3, and a boundary layer depth of 2 km, Eq. (1) predicts a maximum intensi-fication rate of about 110 kt in 24 h. Note that Eq. (1) implies that this rate increases with the square of the potential intensity, which is expected to increase with global warming (Emanuel 1987). As with any roughly normally distributed quantity, the percentage rate increase is amplified for events occurring at the high intensification tail of the distribution. Thus, absent a significant decline in storm frequency or shifts in storm tracks away from coastlines, we would expect a significant increase in extremes of storm intensifica-tion, including those that happen just before landfall.
To account for the whole spectrum of potential effects of climate change on storm intensification prior to landfall, we apply the same analysis as in the previous section to 6,000 continental U.S. land-falling tropical cyclones downscaled from each of the six CMIP5-generation global climate models described in Table 1, for each of two simulations: one for the historical period 1976–2005 and one for the climate of 2071–2100 forced by Intergovernmental Panel on Climate Change Fifth Assessment Report representative concentration pathway (RCP) 8.5. The seeding rate in each model is calibrated so that the overall frequency of all events in the 1976–2005 time period matches the overall frequency of storms downscaled from NCEP–NCAR reanalyses, as reported in the previous section. Each model’s seeding rate, so determined, is also applied to the
Fig. 3. Points of landfall (yellow dots) of the (left) 15 most rapidly intensifying historical and (right) 100 most rapidly intensifying synthetic events.
498 MARCH 2017|

twenty-first-century simulations. Averaged over the six models, there is a 118% increase in the frequency of tropical cyclones and a 10% increase in their lifetime maximum wind speed. This is somewhat outside the range of roughly ±60% change in the frequency of North Atlantic tropical cyclones, and at the edge of the roughly ±10% change1 in lifetime maximum intensity reported by Christensen et al. (2013), though the latter pertains mostly to the A1B emissions scenario of the CMIP3 simulations while the present results pertain to the more rapid increase of CO2 concentration entailed in the CMIP5 RCP 8.5 emissions trajectory. The increase from the late twentieth century to the late twenty-first century in the CO2-related radiative forcing of the latter is about 2.3 times the increase in RCP 4.5 over the same period. Also, the Christensen et al. (2013) results pertain to the whole of the North Atlantic, whereas the present study pertains only to storms that make landfall in the continental United States. We pro-duced a much smaller set of downscaled events us-ing the same six models and two periods but for the whole of the North Atlantic, and we obtained a mean overall increase of 75% in the number of tropical cyclones. This shows that some of the 118% increase in continental U.S. landfalling events is owing to
changes in storm tracks.2 Were the frequency linear in radiative forcing, this would yield an increase in North Atlantic frequency of about 33%, well within the range of results reported by Christensen et al. (2013).
In Fig. 4 we display the results in terms of return periods, defined here as the inverse of the annual exceedance probabilities. The left panel shows the actual downscaled statistics, while in the right panel we have held the 2071–2100 overall Atlantic basin fre-quencies fixed at their 1976–2005 values, to separate the effect of an overall increase in frequency predicted by our downscaling from the effect of increased intensification rates alone. In each panel, the black curve represents the return periods of storms down-scaled from NCEP–NCAR reanalyses over the period 1979–2005. The shading represents plus or minus one standard deviation of the annual exceedance frequencies among the six models, converted to return periods.
These results suggest that a storm that intensifies 60 kt in the 24 h just before landfall, occurring on aver-age once per century in the climate of the late twentieth century, may occur every 5–10 years by the end of this century, while 24-h prelandfall intensifications
Table 1. Climate models used in this study.
Modeling center Institute ID Model nameAverage horizontal
resolution (lon × lat)
NOAA/Geophysical Fluid Dynamics Laboratory
GFDLGFDL Climate Model, version 3 (GFDL CM3)
2.5° × 2.0°
Met Office Hadley Center HadGEMHadley Centre Global Environment Model, version 2–Earth System (HadGEM2-ES)
1.875° × 1.25°
L’Institut Pierre-Simon Laplace IPSLIPSL Coupled Model, version 5A, low resolution (IPSL-CM5A-LR)
3.75° × 1.89°
Atmosphere and Ocean Research Institute (University of Tokyo), National Institute for Environmental Studies, and Japan Agency for Marine-Earth Science and Technology
MIROCModel for Interdisciplinary Research on Climate, version 5 (MIROC5)
1.4° × 1.4°
Max Planck Institute for Meteorology MPIMPI Earth System Model, medium resolution (MPI-ESM-MR)
1.88° × 1.86°
Meteorological Research Institute MRIMRI Coupled Atmosphere–Ocean General Circulation Model, version 3 (MRI-CGCM3)
1.12° × 1.12°
2 Colbert et al. (2013) model an increase in the recurvature of Atlantic tropical cyclones in CMIP3 scenario A1B, but the trends they obtain in U.S. landfalling storms are of mixed sign (see their Fig. 2d).
1 This is from the subjectively based Fig. 14.17 of Christensen et al. (2013), but Table 14.SM.4a of the supplement to that report shows a much broader range of intensity changes.
499MARCH 2017AMERICAN METEOROLOGICAL SOCIETY |

of 100 kt, which are essentially nonexistent in the late twentieth-century climate, may occur as frequently as once per century by the end of this century. Even holding the overall basin frequency constant, the incidence of storms that intensify rapidly just before landfall increases substantially as a result of global warming.
Fig. 4. Return periods (inverse annual exceedance probabilities) of prelandfall 24-h intensity changes from 22,000 events downscaled from NCEP–NCAR reanalyses for 1979–2005 (black) and 6,000 events downscaled from six climate models for 1976–2005 (blue) and 2071–2100 for the CMIP5 RCP 8.5 emissions scenario (red). The shading represents plus or minus one standard deviation of the annual exceedance frequencies among the six models, converted to return periods. (left) The full downscaling results are shown; (right) the overall frequency of the RCP 8.5 events has been adjusted to the 1976–2005 value.
An example of a storm that intensifies by more than 100 kt in the 24 hours before landfall, downscaled from a CMIP5 model in the year 2086, is shown in Fig. 5. This represents a roughly 1-in-100 year event by the end of this century.
DISCUSSION. Over the coming decades, one may reasonably expect the quality of hurricane track forecasts to continue to improve, and advances in model resolution, physics, and data assimilation may finally lead to substantial improvements in storm intensity forecasts. At the same time, projected increases in coast-al population will continue to expose more and more people to tropical cyclone hazards, making preparations and evacuations more difficult and costly. The present work suggests that the incidence of storms that intensify rapidly just before landfall could increase substantially by the end of this century, and as rapid intensification is difficult to forecast, there is a risk of an increased frequency of poorly anticipated, high-intensity landfalls, leading to higher rates of injury and death. This, coupled with rising sea levels, suggests that greater emphasis be placed on improving hurricane intensity prediction and on preparing populations to respond to high-intensity landfalling hurricanes at short notice.
ACKNOWLEDGMENTS. The author gratefully acknowledges support from the National Science Foundation through Grant AGS-1520683 and very helpful comments from Chris Landsea, Jim Kossin, and Isaac Ginis.
Fig. 5. Track and intensity of a rapidly intensifying trop-ical cyclone making landfall in Texas, from downscaling the HadGEM2-ES model in the RCP 8.5 emissions trajectory. This event occurs in the year 2086, and dates in September are indicated by black numerals. Intensity scale (kt) is at bottom. This storm intensifies by 104 kt in the 24 h before landfall and represents a roughly 100-yr event (Fig. 4a).
500 MARCH 2017|

REFERENCESAndreas, E. L, L. Mahrt, and D. Vickers, 2015: An im-
proved bulk air–sea surface flux algorithm, including spray-mediated transfer. Quart. J. Roy. Meteor. Soc., 141, 642–654, doi:10.1002/qj.2424.
Arguez, A., and J. B. Elsner, 2001: Trends in U.S. tropical cyclone mortality during the past century. Fla. Geogr., 32, 28–37.
Bender, M. A., I. Ginis, and Y. Y. Kurihara, 1993: Numerical simulations of tropical cyclone-ocean interaction with a high resolution coupled model. J. Geophys. Res., 98, 23 245–23 263, doi:10.1029/93JD02370.
Blake, E. S., C. W. Landsea, and E. J. Gibney, 2011: The deadliest, costliest, and most intense United States tropical cyclones of from 1851 to 2010 (and other frequently requested hurricane facts). NOAA Tech. Memo. NWS NHC-6, 47 pp. [Available online at www .nhc.noaa.gov/pdf/nws-nhc-6.pdf.]
Brinkley, D. G., 2006: The Great Deluge. William Morrow, 736 pp.
Christensen, J. H., and Coauthors, 2013: Climate phenomena and their relevance for future regional climate change. Climate Change 2013: The Physical Science Basis, T. F. Stocker et al., Eds., Cambridge University Press, 1217–1308.
Colbert, A. J., B. J. Soden, G. A. Vecchi, and B. P. Kirtman, 2013: The impact of anthropogenic cli-mate change on North Atlantic tropical cyclone tracks. J. Climate, 26, 4088–4095, doi:10.1175/JCLI -D-12-00342.1.
CRED, 2016: EM-DAT: The International Disaster Database. Centre for Research on the Epidemiology of Disasters, accessed 5 October 2016. [Available online at www.emdat.be/.]
DeMaria, M., C. R. Sampson, J. A. Knaff, and K. D. Musgrave, 2014: Is tropical cyclone intensity guid-ance improving? Bull. Amer. Meteor. Soc., 95, 387–398, doi:10.1175/BAMS-D-12-00240.1.
Emanuel, K., 1987: The dependence of hurricane inten-sity on climate. Nature, 326, 483–485, doi:10.1038 /326483a0.
—, 2012: Self-stratif ication of tropical cyclone outflow.Part II: Implications for storm intensifica-tion. J. Atmos. Sci., 69, 988–996, doi:10.1175/JAS -D-11-0177.1.
—, 2015: Effect of upper-ocean evolution on projected trends in tropical cyclone activity. J. Climate, 28, 8165–8170, doi:10.1175/JCLI-D-15-0401.1.
—, C. DesAutels, C. Holloway, and R. Korty, 2004: Environmental control of tropical cyclone inten-sity. J. Atmos. Sci., 61, 843–858, doi:10.1175/1520 -0469(2004)061<0843:ECOTCI>2.0.CO;2.
—, K., R. Sundararajan, and J. Williams, 2008: Hurri-canes and global warming: Results from downscaling IPCC AR4 simulations. Bull. Amer. Meteor. Soc., 89, 347–367, doi:10.1175/BAMS-89-3-347.
Kalnay, E., and Coauthors, 1996: The NCEP/NCAR 40-Year Reanalysis Project. Bull. Amer. Meteor. Soc., 77, 437–471, doi:10.1175/1520-0477(1996)077<0437: TNYRP>2.0.CO;2.
Kowch, R., and K. Emanuel, 2015: Are special pro-cesses at work in the rapid intensification of tropical cyclones? Mon. Wea. Rev., 143, 878–882, doi:10.1175 /MWR-D-14-00360.1.
Landsea, C. W., and J. L. Franklin, 2013: Atlantic hurri-cane database uncertainty and presentation of a new database format. Mon. Wea. Rev., 141, 3576–3592, doi:10.1175/MWR-D-12-00254.1.
Nat iona l Hu rr ica ne Center, 2016: Best t rack data(HURDAT2). Accessed 7 March 2016. [Available online at www.nhc.noaa.gov/data/#hurdat.]
Nolan, D. S., J. A. Zhang, and D. P. Stern, 2009: Evalu-ation of planetary boundary layer parameteriza-tions in tropical cyclones by comparison of in situ observations and high-resolution simulations of Hurricane Isabel (2003). Part I: Initialization, maximum winds, and the outer-core boundary layer. Mon. Wea. Rev., 137, 3651–3674, doi:10.1175 /2009MWR2785.1.
Peduzzi, P., B. Chatenoux, H. Dao, A. De Bono, C. Herold, J. Kossin, F. Mouton, and O. Nordbeck, 2012: Global trends in tropical cyclone risk. Nat. Climate Change, 2 , 289–294, doi:10.1038 /nclimate1410.
Ravela, S., K. Emanuel, and D. McLaughlin, 2007: Data assimilation by field alignment. Physica D, 230, 127–145, doi:10.1016/j.physd.2006.09.035.
Rotunno, R., Y. Chen, W. Wang, C. Davis, J. Dudhia, and C. L. Holland, 2009: Large-eddy simulation of an idealized tropical cyclone. Bull. Amer. Meteor. Soc., 90, 1783–1788, doi:10.1175/2009BAMS2884.1.
Sampson, C. R., and A. J. Schrader, 2000: The Automated Tropical Cyclone Forecasting System (version 3.2). Bull. Amer. Meteor. Soc., 81, 1231–1240, doi:10.1175/1520-0477(2000)081<1231:TATCFS>2.3.CO;2.
—, and —, 2007: Automated Tropical Cyclone Fore-cast (ATCF) database. Naval Research Laboratory, accessed 4 May 2016. [Available at www.nrlmry.navy .mil/atcf_web/docs/database/new/database.html.]
Yablonsky, R. M., and I. Ginis, 2009: Limitation of one-dimensional ocean models for coupled hurricane–ocean model forecasts. Mon. Wea. Rev., 137, 4410–4419, doi:10.1175/2009MWR2863.1.
501MARCH 2017AMERICAN METEOROLOGICAL SOCIETY |

Find out from the authoritative source
[ What’s a dust devil? ]
for d
efinitio
ns o
f meteo
rolo
gica
l terms.
With over 12,000 meteorological terms, you’ll be able to look up definitions online any time, any place, anywhere.
http://glossary.ametsoc.org/wiki
T h e A m e r i c A n m e T e o r o l o g i c A l S o c i e T y
Online Glossary of Meteorology
Also available in hardcover and CD formats at the AMS Bookstore, www.ametsoc.org/amsbookstore.
Phot
o: S
tan
Cele
stia
n
502 MARCH 2017|