wildlife ecology group. northwest forest plan (nwfp): 8 monitoring areas meta-analyses: 2004 --14...
TRANSCRIPT

Wildlife Ecology Group
Wildlife Ecology Group
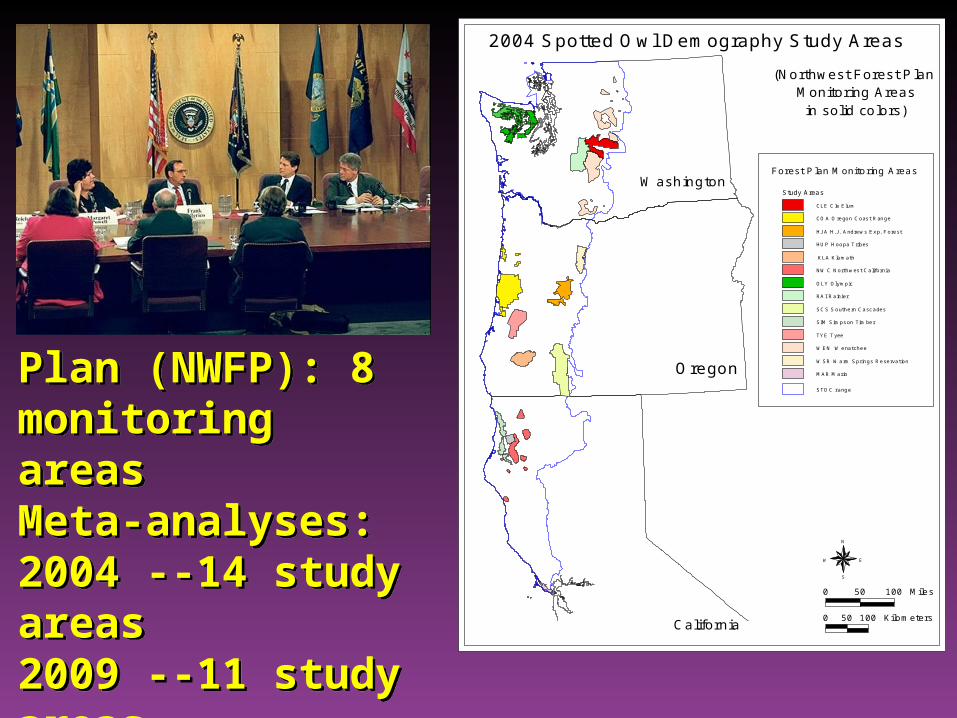
Northwest Forest Plan (NWFP): 8 monitoringareasMeta-analyses:2004 --14 study areas2009 --11 study areas
Northwest Forest Plan (NWFP): 8 monitoringareasMeta-analyses:2004 --14 study areas2009 --11 study areas
Washington
Oregon
California
2004 Spotted Owl Demography Study Areas
0 50 100 Miles
0 50 100 Kilometers
N
EW
S
(Northwest Forest Plan Monitoring Areasin solid colors)
Study Areas
CLE Cle Elum
COA Oregon Coast Range
HJA H.J. Andrews Exp. Forest
HUP Hoopa Tribes
KLA Klamath
NWC Northwest California
OLY Olympic
RAI Rainier
SCS Southern Cascades
SIM Simpson Timber
TYE Tyee
WEN Wenatchee
WSR Warm Springs Reservation
MAR Marin
STOC range
Forest Plan Monitoring Areas

Cle Elum Study Area/Cle Elum Ranger District:Cle Elum Study Area/Cle Elum Ranger District:
.-,90
.-,90
(/97
Cas
cad
e
Crest
To Seattle
To
Leav
enw
o rth
Cle Elum#Y
Area enlarged
Cle Elum Ranger DistrictGeneral Study Area Density Study Area LakesHighwaysCascade Crest
Prepared by S. Sovern, 2001
N
0 2 4 6 8 Miles
Scale

Because of the mixed ownership on the Cle Elum Study Area, we have cooperated with the
following landowners/contractors:
Because of the mixed ownership on the Cle Elum Study Area, we have cooperated with the
following landowners/contractors:
Plum Creek Timber CompanyPlum Creek Timber Company
Raedeke Associatescontractors
Raedeke Associatescontractors
American Forest Resources / Boise Cascade Corp.
American Forest Resources / Boise Cascade Corp.
Environmental Services Northwestcontractors
Environmental Services Northwestcontractors
Washington State DNRWashington State DNR

Two levels of survey effort: General Study Area
Return to historic owl territories each yearDetermine territory occupancy
Multiple (3) visits to each territoryBand new adults and all juvenilesDetermine reproduction
Density Study Area General study area survey plus:Attempt a total population count by surveying the
complete area 3 times/year
Methods for demography studies on the Cle Elum Study Area
Methods for demography studies on the Cle Elum Study Area

Yellow band with black dots on left leg
Yellow band with black dots on left leg Blue band right legBlue band right leg
Adult spotted owls with color bands
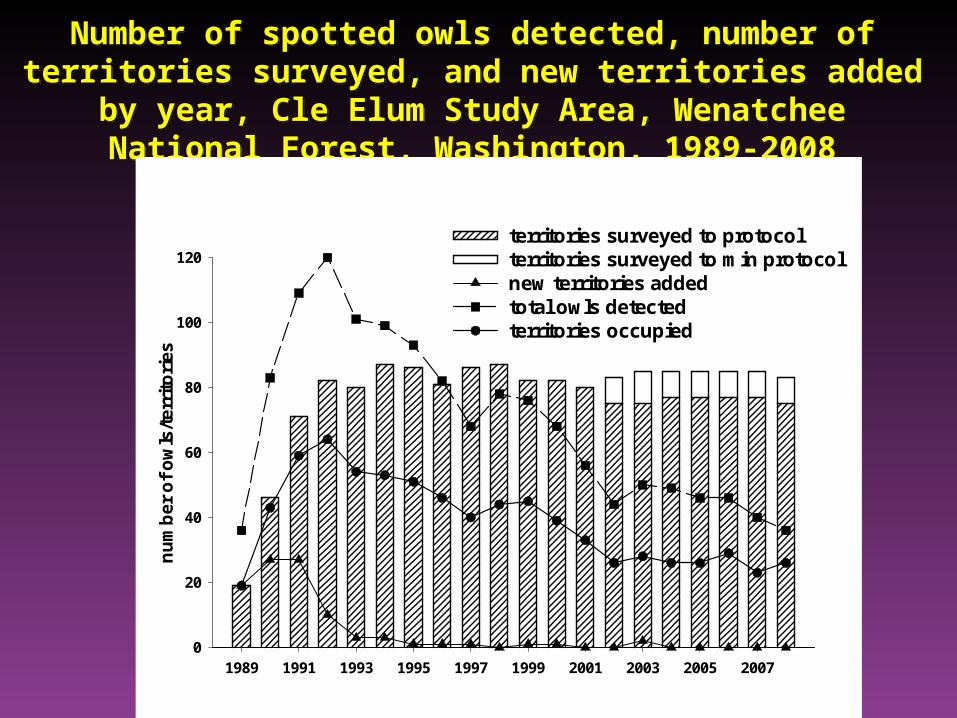
Number of spotted owls detected, number of territories surveyed, and new territories added by year, Cle Elum Study Area,
Wenatchee National Forest, Washington, 1989-2008
Number of spotted owls detected, number of territories surveyed, and new territories added by year, Cle Elum Study Area,
Wenatchee National Forest, Washington, 1989-2008
1989 1991 1993 1995 1997 1999 2001 2003 2005 2007
nu
mb
er o
f o
wls
/ter
rito
ries
0
20
40
60
80
100
120territories surveyed to protocol territories surveyed to min protocol new territories addedtotal owls detectedterritories occupied

Number of spotted owl territories occupied by pairs, singles, additional owls, or vacant, Cle
Elum Study Area, Washington, 1989-2008
Number of spotted owl territories occupied by pairs, singles, additional owls, or vacant, Cle
Elum Study Area, Washington, 1989-2008
1988 1990 1992 1994 1996 1998 2000 2002 2004 2006 2008
0
20
40
60
80
100vacantpairssinglesadditional owls
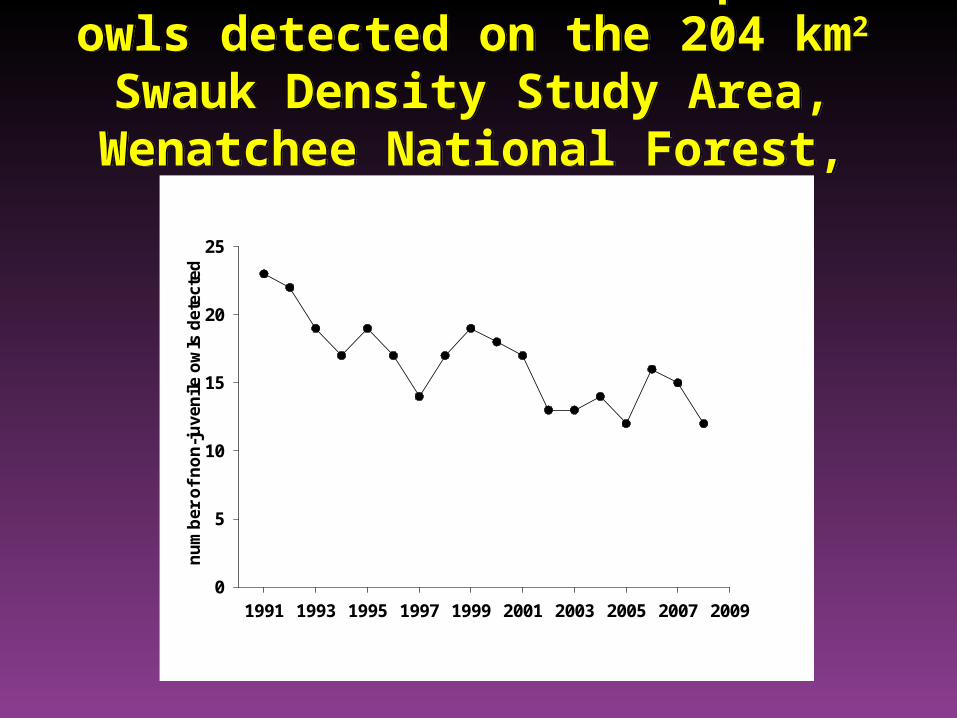
Number of territorial spotted owls detected on the 204 km2 Swauk Density Study Area,
Wenatchee National Forest, 1991-2008
Number of territorial spotted owls detected on the 204 km2 Swauk Density Study Area,
Wenatchee National Forest, 1991-2008
1991 1993 1995 1997 1999 2001 2003 2005 2007 2009
nu
mb
er o
f n
on
-ju
ven
ile o
wls
det
ecte
d
0
5
10
15
20
25

Reproductive indices of Spotted Owls on the Cle Elum Study Area, 1989-2008Reproductive indices of Spotted Owls
on the Cle Elum Study Area, 1989-2008
year
1989 1991 1993 1995 1997 1999 2001 2003 2005 2007 2009
sa
mp
le s
ize
(y2
)
0
10
20
30
40
50
60
pro
po
rtio
n n
es
tin
g/f
ec
un
dit
y
0.0
0.2
0.4
0.6
0.8
1.0
sample size (y2 axis)female fecundityproportion nestingave fecundity ave prop nesting

Raw estimates of mean annual fecundity of spotted owls from study areas in
Washington and Oregon
Raw estimates of mean annual fecundity of spotted owls from study areas in
Washington and Oregon
From Status and trends in Demography of Northern Spotted owls, 1985-2003
From Status and trends in Demography of Northern Spotted owls, 1985-2003
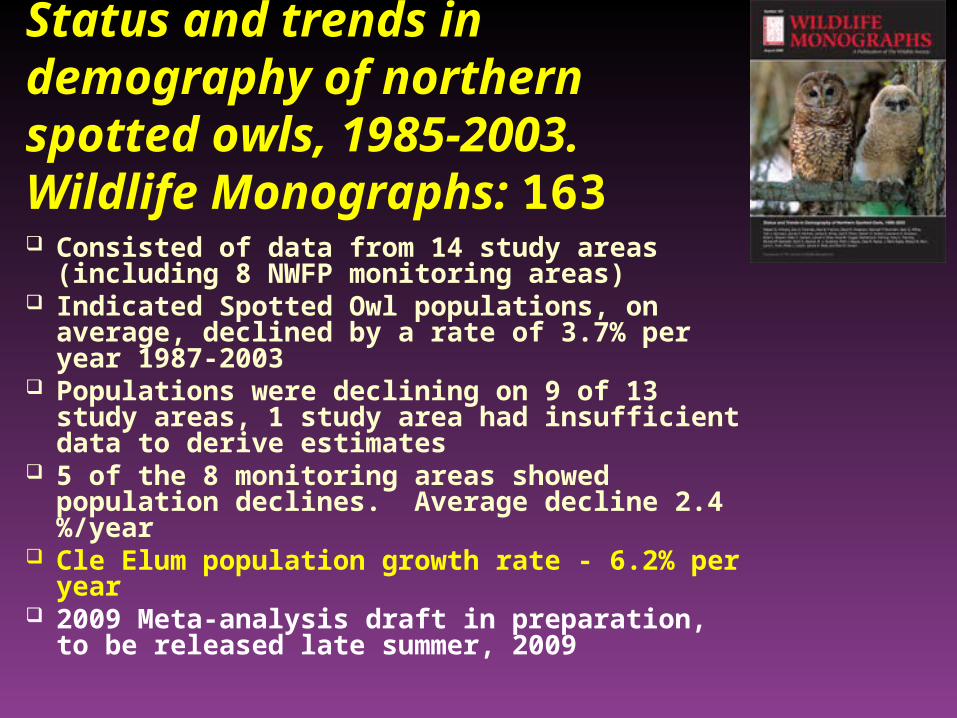
Status and trends in demography of northern spotted owls, 1985-2003.Wildlife Monographs: 163
Consisted of data from 14 study areas (including 8 NWFP monitoring areas)
Indicated Spotted Owl populations, on average, declined by a rate of 3.7% per year 1987-2003
Populations were declining on 9 of 13 study areas, 1 study area had insufficient data to derive estimates
5 of the 8 monitoring areas showed population declines. Average decline 2.4 %/year
Cle Elum population growth rate - 6.2% per year 2009 Meta-analysis draft in preparation, to be
released late summer, 2009

Barred owls in the Swauk Cr. Density Study Area, Cle Elum Demography Study Area,
Washington, 1991-2008
Barred owls in the Swauk Cr. Density Study Area, Cle Elum Demography Study Area,
Washington, 1991-2008
year
1991 1993 1995 1997 1999 2001 2003 2005 2007 2009
nu
mb
er o
f o
ccu
pie
d t
erri
tori
es i
n D
SA
0
2
4
6
8
10
12
14Spotted owlBarred owl


Cle Elum CrewDr. Eric Forsman
(Principle Investigator, USFS)Stan Sovern
Margy Taylor