wif - institute of economic research
TRANSCRIPT
WIF - Institute of Economic Research
Economics Working Paper Series
Eidgenössische Technische Hochschule ZürichSwiss Federal Institute of Technology Zurich
Principle guided investing: The use of negative
screens and its implications for green investors∗
Urs von Arx (ETH Zurich)†
November 2005
Abstract
In recent years Socially Responsible Investment (SRI) has received considerableattention from both private investors as well as pension funds. Despite thisproliferation in interest, several topics are still unresolved, namely selectionmethods, performance and effects regarding sustainability. This paper examineshow green investors can induce firms to invest in cleaner production technologyby using exclusionary investment screens. SRI is more likely to be successfulwhen abatement costs are low and if principle guided investors are numerous andhave homogenous investment principles. The transformation process becomesmore probable when shares of clean firms are viewed as a separate asset classby all investors. Green investors have to accept lower returns from shares ofclean firms, even in the case of positive externalities.
Keywords: Socially Responsible Investment, Pension FundsJEL classification: G10, Q5
∗The author thanks Lucas Bretschger, Hannes Egli and Gay Saxby from the Institute ofEconomic Research, ETH Zurich, and Andreas Schafer from the Center of Corporate Re-sponsibility and Sustainability, University of Zurich, for many valuable comments and helpfulsuggestions.
†Institute of Economic Research, ETH Zurich, ZUE F14, CH-8032 Zurich, Switzerland.Phone +41 44 632 55 05, Fax +41 44 632 13 62, Email: [email protected].

1 Introduction
Socially Responsible Investment has moved more and more into the spotlightof private and institutional investors. According to the American industry or-ganisation SIF (Social Investment Forum) “a total of USD 2.16 trillion in assetswas identified in the United States in professionally managed portfolios (pen-sion funds or public SRI funds) using one or more of the three core sociallyresponsible investing strategies – screening, shareholder advocacy, and commu-nity investing”.1 This amounts to about 11% of all investments. Also in EuropeSRI assets have grown considerably, albeit their proportion of total assets is notnearly as high as in the United States. The origins of SRI can be traced backto the 19th century, when members of methodist and quaker churches thoughtabout the consequences of their investments. The launch of the Pax WorldFund in 1971 can be seen as the starting signal for modern SRI products.
In the last thirty years investment methods and theoretical foundations ofSRI products have developed considerably. So-called principle guided invest-ments can make use of negative (exclusionary) and/or positive screens (e.g.highlighting eco-efficiency criteria for the positive choice of “sustainability-leaders”) and sometimes include also an engagement approach, in order toinfluence management decisions.2 However, there are still open questions withregard to current methods and procedures of SRI products; the most importantbeing financial and environmental performance as well as transparency.
First, evaluation of performance of SRI portfolios or indexes, which arebased upon the stakeholder model (Freeman, 1984), have delivered ambiguousresults so far. In the last twenty years there has been a steadily growing body ofliterature about the topic of the appropriateness of the stakeholder versus theshareholder model and many different stakeholder concepts and models havebeen proposed (Donaldson and Preston, 1995). Some studies empirically testtransmission links from stakeholder management to economic profits, in order togenerate implications for management and SRI investors. But they usually facethe problems of identifying the direction of causality and of unobserved factors(Berman et al., 1999). Some stakeholder theorists, drawing heavily on moralor ethical guidance for corporate behaviour, emphasise the normative aspect ofstakeholder theory. This point is of course the most controversial and Friedmanalready responded to it in 1970. Empirical evidence on whether recommenda-tion of the stakeholder or of the shareholder model is a better prescription forthe successful management of companies, is still inconclusive despite many sta-tistical studies. For literature surveys regarding empirical studies see Schroder(2004), Orlitzky et al. (2003) or Murphy (2002).
Second, both potential investors as well as firms quoted on the stock ex-change complain that it is not at all transparent to them how SRI analystsderive their ratings. This in turn seems to be a hindrance for further growth ofSRI (von Flotow et al., 2002). Additionally, the process of portfolio constructionis not very lucid, especially in those SRI funds which do not use exclusionary
1www.socialinvest.org/areas/reserchtrends/sri trends report2003.pdf2The terms exclusionary and negative screens will be used as synonyms in the rest of the
text.
1

screens, but also invest in so called “best-in-class” companies of every industry.Some SRI indices built upon these methods therefore have a very low trackingerror vs. traditional indices. To pinpoint differences between these two groupsof indices can be very difficult (Schepers and Sethi, 2003; Schroder, 2005). SomeSRI proponents argue that SRI is “just” a different investment style.
Third, it is unclear how big the positive impact on the environment ofSRI products really is. Many investors buying SRI products intend to supportand improve sustainability. But sustainability usually is very loosely definedand the link between actual investments and the effect on the environmentcan not be measured. Therefore, the question of how much sustainability aninvestor gets by buying a certain product cannot be answered. Generally, SRIproponents argue that firms will try to become best-in-class in the eyes of greeninvestors. With that mechanism the whole economy would be ideally gearedtoward sustainability.
This paper sheds light on the questions of performance, transparency andsustainability (implying less pollution) under the assumptions that firms aim tomaximise firm value and that green (SRI) investors use exclusionary screens. Itis shown how SRI funds through the use of negative screens can, indirectly in-duce polluting firms to switch to a clean technology. Chances of success mainlydepend upon the size of abatement costs, the distribution of green and neu-tral investors and the size of covariances between shares of clean and pollutingfirms. Also, if shares of clean firms have lower risk, a point stressed very oftenby SRI proponents, the transformation to a less polluting economy becomesmore likely. Because abatement is not free of charge, the return of shares ofclean firms is lower than the return of shares of polluting firms and since prin-ciple guided investors buy only shares of clean firms, they have a lower returnon their portfolios for an extended investment horizon.
This paper contributes to the literature regarding the relationship betweencorporate sustainability and economic performance by more closely examininghow switches to a cleaner production technology take place and by drawing con-clusions for principle guided investors. The model presented here is a two agentmodel (green and neutral investors) in a static one-period context. The agentscan invest in riskless assets or in shares of firms working with clean or pollut-ing technology. Green investors use exclusionary screens and invest in stocksonly if they are from firms with clean technology. Some firms with pollutingtechnology will switch to the state of a clean technology incurring additionalabatement costs when green investors are numerous. It can be shown, givennormal microeconomic assumptions (firms as shareholder-value maximising en-tities), that the current low population of SRI investors can only be effectiveif abatement costs are also very low. If abatement costs are substantial, thenthe proportion of green investors has to be almost half of the population. Andprinciple guided investors must be willing to accept a reduction of achievablereturns. If these opportunity costs are too high (which they most likely arefor example in the case of pension funds, which have to fulfill their fiduciaryobligations vis-a-vis their beneficiaries) the only open channel for change of thegreen investors’ community would be the political channel as Statman (2000)already suggests. All these cases are only possibly successful, if green investors
2

have homogenous beliefs with regard to the use of exclusionary screens, a con-dition which currently is not present, since it seems that product providers atthe moment are more interested in product differentiation. The paper also clar-ifies how neutral investors indirectly influence the success of the outcome, bothin the case that shares of clean firms form a different asset class and in thecase where they do not. Additionally, the paper sheds light on the question ofwhich properties positive externalities have to contain in order to influence the“greening process”. Finally, the paper investigates implicit return expectationsof neutral and green investors.
Despite the rise of SRI, there has been amazingly little research devoted tobuilding theoretical models evaluating the effectiveness of different SRI meth-ods. Most research concentrates on empirical evaluations regarding performanceof SRI portfolios. The model presented here builds on the model of Heinkel etal. (2001); in fact, it is a general version of what they term “the alternativemodel”. In their model, it is assumed that half of the firms have a clean tech-nology. Green investors can then only force some firms of the other half toreform.3 In the model presented here, firms switch to a clean technology byinvesting in abatement and therefore a change not only in the expected returnbut also in risk characteristics is assumed, which is intuitively more plausible.As a side effect an additional diversification effect occurs, in contrast to themodel of Heinkel et al. (2001). This additional diversification effect can have,under certain conditions, a big impact on the occurrence of switches: For ex-ample when abatement costs are relatively low and only a few green investorsare present, neutral investors will invest in shares of clean firms, not because ofprinciple guided beliefs, but for risk reduction reasons.
Beltratti (2003) investigates SRI with a two-period, two-agent model ina general equilibrium context, where the externality from production activitynegatively influences the utility of agents. His results are basically in line withour findings that SRI will not be very effective in the reduction of pollutionwhen the number of principle guided investors is relatively small, since theboycott by green investors using exclusionary screens will be undermined bysubstitutional investments of neutral, opportunistic investors.
These insights suggest that homogeneous beliefs of SRI are central, in orderto have any positive impact on the environment. Evaluation and appraisalof polluting firms and industries should either be conducted with generallyaccepted and precisely defined methods, or should be undertaken by only afew SRI rating agencies, as is the case in bond rating. This would lead toless product differentiation within SRI and would result in more homogeneousbeliefs of green investors. Currently there exist some undertakings which aimin this direction. The Global Reporting Initiative, for example, has the missionto develop and promote globally applicable sustainability reporting guidelines.
The remainder of the paper is organised as follows. In Section 2, the purpose3Since Heinkel et al. (2001) assume that so called reformed firms do not change their
characteristics with regard to original risk, they have to introduce a no-arbitrage conditionin order to impede neutral investors from making riskless arbitrage between reformed firms(which are more expensive) and still polluting firms, which both have still the same riskcharacteristics.
3

and functions of exclusionary screens in today’s SRI world are briefly described.Section 3 describes the model in detail. In Section 4, the equilibrium andcomparative statics are given, while Section 5 provides numerical examples.The connection between the use of exclusionary screens and the investmentreturn which green investors can achieve, will be elaborated in Section 6. InSection 7, theoretical considerations and practical implications will be given.Finally, Section 8 concludes.
2 Exclusionary screens: Purpose and applications
Exclusionary screens are transparent because they can be checked and verifiedby third parties. Application of such screens can be based upon ethical beliefs.As an example, some investors avoid tobacco stocks or shares of the gamingindustry, which they consider to be sinful or harmful according to their per-sonal beliefs. Negative screens can also be put in place with an ecological ideacombined with an economic rationale: These investors avoid investing in anenvironmentally harmful industry for ecological reasons and with the economicrationale of raising the cost of capital of such firms. Higher capital costs willraise relative prices of products and reduce sales. In this process, products ofboycotted industries should be substituted by goods of clean industries. Crite-ria for the application of exclusionary screens for environmental reasons couldbe chosen with regard to excessive environmental damage (resource extraction,CO2-emissions), which are mostly caused by certain industries.
But exclusionary screens are seldom put in place. According to Statman(2000), the Domini Social Index, an index of stocks of socially responsible com-panies modelled on the S&P500 Index and initiated in May 1990 by Kinder,Lydenberg, Domini & Company (KLD) uses exclusionary screens only for mil-itary weapon systems, alcohol and tobacco and gaming products or services.Very often negative screens are chosen for the sole reason of producing portfo-lios which are consistent with the belief of the sponsor. But exclusionary screensalso have their caveat: Firstly, conglomerates produce in many different indus-tries (and sometimes also operate partially in “sin” fields) – so sustainabilityanalysts have to use an arbitrary cut off point (usually a percentage limit ofrevenues), in order to judge if the relevant company should be included or ex-cluded. Secondly, if a green investor wants to use exclusionary screens in orderto avoid investments in e.g. resource extractive industries, but still invests inindustries in which products are mainly based upon that one critical resource,the positive effect on the environment will not be that big, namely only as faras capital costs for those products have increased.
The model in this paper assumes that green investors work with exclusionarynegative screens, e.g are not willing to invest in firms which have a pollutingtechnology. Green investors therefore restrict their stock investment universeto shares of clean companies.
4
3 The basic model
The model assumes a one-period world in which three categories of assets areavailable: riskfree assets, shares of companies producing with a polluting tech-nology (P ) and shares of companies which work with a clean technology (C).The total number of firms F , consists of FP polluting firms and FC clean firms.
In the model there are I investors, namely IN neutral and IG green in-vestors. Green investors only invest in the risk free asset and (if available) inshares of clean companies, since they use negative screens (no investments inshares of polluting firms). Neutral investors have no principle guided invest-ment preferences and optimise their portfolios considering both risk free assetsas well as all shares in the investment universe.
An FP firm can invest in abatement and by doing this, switch to the group ofFC firms. An FP firm will incur transformation costs of A, if enterprise value canbe raised. Each FC firm uses a clean technology and has a normally distributedexpected firm value with mean µC and variance σ2
C . The expected values of FC
firms are perfectly correlated with each other. Accordingly, each FP firm uses apolluting technology and generates a normally distributed expected value withmean µP and variance σ2
P . Also the expected values of FP firms are perfectlycorrelated with each other. The covariance between the expected values of FC
firms and FP firms is σPC . The expected value of a firm can be conceived asthe sum of the discounted cash flows over the “lifetime” of the firm. Since thebasic model is static, the factor time is not included, and therefore the label“expected value” was chosen.
The following two equations describe the utility functions of neutral (IN )and green (IG) investors. The utility functions consist of the expected (andnot discounted) return (expected value minus price of shares) from which theweighted risk of the portfolio is subtracted. As usual in this literature, bothgroups of investors have a constant absolute risk aversion (CARA) with a risktolerance parameter τ .
uN = xNP (µP − PP ) + xNC(µC − PC)
−x2NP σ2
P + x2NCσ2
C + 2xNP xNCσPC
2τ(1)
uG = xGC(µC − PC)− x2GCσ2
C
2τ(2)
where xIF is the number of shares of firms of category F ∈ [P,C], held by typeI investor (I ∈ [N, G]) and PF is the price of shares of category F .
Equation (1) shows that neutral investors will regard the full set of assetsin order to find their optimal portfolio. They consider investments in riskfreeassets, the rate of which is determined exogenously under the assumption of aperfectly elastic supply, investments in firms with polluting technology as well
5
as potential investments in firms with clean technology.
As principle guided investors, green investors will confine themselves only toinvestments in the risk free assets and in shares of firms with clean technology,as can be seen from equation (2). Firms with clean technology exist when someof the firms (instantaneously) invest in abatement. Equation (3) depicts theexogenous condition for the switch of polluting firms to a clean technology:
invest in abatement
yes, if PC > PP + Aindifferent, if PC = PP + Ano, if PC < PP + A
(3)
where A is the cost of investment in abatement.When no green investors exist and abatement costs are sizeable, all firms
work with a polluting technology and all have therefore the same expectedvalue characteristics (µP , σP ). When abatement costs are not negligible and thenumber of green investors is very small, then these principle-guided investorscan only invest in the risk free asset, since no clean firm exists. An increase inthe proportion of green investors raises the chances that some polluting firmsimplement a cleaner production technology, because the higher the proportion ofgreen investors, the lower will be the share prices of polluting firms. If the shareprice of polluting firms PP is lower than the share price of clean firms PC minusabatement costs A, than some polluting firms will invest in abatement until theequilibrium is reached, as given by equation (3). By investing in abatement,the reforming firms can raise firm value and will then have the expected valuecharacteristics of clean firms (µC , σC). This transition is central to the modeland is possible because green and eventually also neutral investors buy sharesof firms with clean technology. But the switch to a cleaner production process(or the investment in end-of-pipe abatement) can be expensive, and shares offirms which switch to a clean technology will provide a lower return than theshares of polluting firms.
4 Equilibrium and comparative statics
In order to calculate the proportion of clean and polluting firms, we first com-pute the optimal portfolio holdings of each investor group. By taking the deriva-tives of uN with respect to xNP and xNC , we derive the first order conditionsfor optimal portfolio holdings of a neutral investor
τ(µP − PP )− (xNP σ2P + xNCσPC) = 0 (4)
τ(µC − PC)− (xNCσ2C + xNP σPC) = 0 (5)
By employing(4) and (5), we can solve for a neutral investor’s optimal port-folio holdings of shares of firms with polluting technology (x∗NP ) and of sharesof clean firms (x∗NC):
6

x∗NP =τ
φ[(µP − PP )σ2
C − (µC − PC)σPC ] (6)
x∗NC =τ
φ[(µC − PC)σ2
P − (µP − PP )σPC ] (7)
where φ = σ2P σ2
C − σ2PC .
By inspecting (6) and (7), we see that the optimal holdings of shares of neu-tral investors will increase with the risk tolerance of investors and will fall whenφ rises. φ takes a higher value, the higher the risk of shares of clean and/orpolluting firms. Equation (6) shows that optimal holdings of shares of pollut-ing firms by neutral investors will be higher, the higher the expected returns ofshares of polluting firms, the higher the risk (variance) of shares of clean firms,the lower the return of shares of clean firms and the lower the covariation ofshares of both groups. As we can see from (7), optimal holdings of shares ofclean firms by neutral investors will be higher, the higher the expected returnsof shares of clean firms, the higher the risk (variance) of shares of pollutingfirms, the lower the return of shares of polluting firms and the lower the covari-ation of shares of both groups.
Since a green investor invests only in shares of clean firms, we get one firstorder condition for a green investor. By taking the derivative of uG with respectto xGC , we have
τ(µC − PC)− (xGCσ2C) = 0 (8)
and by solving for x∗GC , we obtain a green investor’s optimal portfolio hold-ing of shares of clean firms as:
x∗GC =τ
σ2C
[(µC − PC)] (9)
The optimal portfolio holding of shares of clean firms of a green investorwill be higher, when these shares have a higher expected return and/or lowerrisk. When the risk tolerance of investors is higher, they will also hold moreshares of clean firms.
Since principle guided investors only buy shares of clean firms, whereasneutral investors buy shares of both groups, the following two market clearingconditions must hold:
INx∗NC + IGx∗GC = FC (10)
7

INx∗NP = FP (11)
By substituting the optimal portfolio holdings [eq. (6), (7) and (9)] in themarket clearing conditions [(eq. (10) and (11)], we can solve for the equilibriumshare prices of clean firms (PC) and polluting firms (PP )
PC = µc − 1Iτ
(FCσ2
C + FP σPC) (12)
PP = µp − 1Iτ
(FCσPC − FP
σ2PC
σ2C
IG
IN+ FP σ2
P
I
IN
)(13)
Equations (12) and (13) describe the equilibrium prices of shares of firmsworking with a clean or polluting technology. The share prices of each categorywill be higher, the higher their respective expected values and/or the higher therisk tolerance of investors. Equation (12) shows that the share price of a cleanfirm is independent from the distribution of neutral or green investors, becauseboth investor groups will invest in shares of firms with clean technology. Theprice of such shares will be smaller, the more firms with clean technology existand /or the higher their risk. When covariation of shares of clean and pollutingfirms is high and simultaneously a big number of polluting firms exist, then thiswill lead to a lower price of shares of clean firms. Equation (13) shows that theshare price of polluting firms depends upon the distribution of neutral and greeninvestors. If the number of green investors is zero, then the second term in thebrackets vanishes and the third term is analogous to the first term in equation(12), since I = IN ). The second and the third term will gain in importancewith a rising number of green investors and are therefore very important forthe probability of the conversion of polluting firms to clean technology. Thethird term basically shows that a higher risk of shares of polluting firms makesthose shares relatively less attractive for neutral investors, which leads to alower share price and to a faster conversion of some polluting firms. The sign ofthe second term depends upon the sign of the covariation of shares of clean andpolluting firms. If covariation is negative, then clean shares are very valuablefor neutral investors, because they offer excellent diversification. This effectwill be strengthened when the risk of clean shares is low.
Equation (3) defines the equilibrium condition for the switch of pollutingfirms to a clean technology, by imposing the condition that the price of sharesof clean firms has to be equal to the price of polluting firms plus the additionalabatement costs. If we solve (12) and (13) for FC and taking (3) into account,we get
FC = max
0,
Iτ(µC − µP −A) + F (−σPC − IGσ2PC
INσ2C
+ Iσ2P
IN)
σ2C − 2σPC − IGσ2
PC
INσ2C
+ Iσ2P
IN
(14)
8
As equation (14) shows, the number of firms with clean technology (FC) willbe higher, the higher the expected value of clean firms relative to the expectedvalue of polluting firms and abatement costs, and the higher the risk toleranceof investors. Also, the lower σC and σPC and the higher σP , the higher will bethe proportion of clean firms. The same obviously holds true for any rise in thenumber of green investors (IG).
5 Numerical Examples
After having examined the analytical results, we take a closer look at how sev-eral exogenous variables will influence the outcome of the proportion of cleanand polluting firms. By examining the impact of different parameter constella-tions, we can draw conclusions with regard to sensitivities. This is importantnot only for green (SRI) investors, whose aim is to reduce pollution with theirprinciple guided investments, but also for neutral investors, who want to attainoptimal portfolios with respect to return and risk.
From inspecting equation (3) it is easy to see that the size of abatementcosts A is a parameter of central importance for the process of switching toa clean technology. In this context it can also be shown that the magnitudeof covariation is of tremendous importance. SRI proponents often claim thatshares of sustainable investments carry less risk. According to the presentedmodel the switch to a clean technology is less likely, if this assumption of SRIproponents does not hold true.
In the first subsection we introduce and discuss the baseline set of param-eters. In this base case, green investors have to constitute about 40% of allinvestors in order to induce the first polluting firm to switch to a clean tech-nology. In subsection 5.2, we will examine how differences in the magnitude ofabatement costs will influence results. Since this relationship is of primary in-terest, it will be examined in depth. It will be shown that if abatement costs arelow, many switches to clean technology take place. In cases of higher abatementcosts, though, the population of green investors already has to be much higherthan today’s, in order to induce first positive effects. If abatement costs areprohibitively high, then either the population of green investors has to be thedominating group or policy has to set stricter regulations in order to introducea switch to a clean production technology. In subsection 5.3 we will examinehow the “greening” of the economy proceeds if shares of clean firms are viewedas a different asset class. When shares of clean firms have a low covariationwith regard to shares of polluting firms and/or if they have lower risk (stan-dard deviation), they can be regarded as a different asset class, which makesthem more interesting from the point of view of neutral investors. In subsection5.4 we will examine how the occurrence of switches to a clean technology willbe affected if we assume positive externalities of expected values of clean firms.
5.1 Baseline set of parameters
The following baseline set of parameters was chosen:
9

Table 1: Baseline set of parameters
Expected value: uP = uC = 10Standard deviation of expected values: σP = σC = 10Covariance of expected values: σPC = 50Aggregate risk tolerance of investors τ = 100Abatement costs: A = 1.0 (10% of expected value)
With one exception (abatement costs A) all parameter settings were selectedin line with the model of Heinkel et al. (2001), in order to compare results. Theychose this parameter setting in order to produce what they call “reasonablecost of capital” of firms (or expected rates of return from the point of view ofinvestors). The resulting cost of capital of about 8% translates to an “expectedequity risk premium” of the same size, since the riskless rate is assumed to bezero. But it has to be mentioned that this is not a “normal” risk premium,which usually represents the extra return of stocks vs. a riskless rate per year.In this case time does not enter the model, and the term “required return”represents more an “expected return or profit” (expected value minus shareprice divided by share price). The expected values could represent the sum ofundiscounted cash flows of the firms. The “cost of capital” or “expected return”corresponds to the amount by which the expected value (sum of undiscountedcash flows) surpasses stock prices. This will be further elaborated on in Section6.
For the economic calibration of the model abatement costs are not central.In the base case of the presented model abatement costs are set twice as highas in Heinkel et al.(2001), for the simple reason that their model assumes thatat least half of the firms work with clean technology in any case, whereas inthe presented model this restrictive assumption is not made. Calculations withassumption of their abatement costs of 0.2, 0.5 and 2.0 will be shown in thenext subsection.
0.2 0.4 0.6 0.8 1Ig
0.2
0.4
0.6
0.8
1
NC�������
N
50%
Figure 1: Ratio of clean firms to all firms with abatement costs of 1.0
Figure 1 shows the ratio of firms with clean technology to all firms with
10

the assumption that abatement costs A = 1, corresponding to 10% of expectedvalue of firms. When the number of green Investors IG is below 40% then nopolluting firm switches to a clean technology. At 40% the first switch takesplace. It has to be noted that this number is much higher than the currentproportion of green investors. If the investors with green beliefs become morepopulous, the ratio of clean firms to all firms (NC/N) monotonically increases.When all investors are green, all the firms are working with clean technology,because no neutral investors exist buying shares of firms working with pollutingtechnology.
5.2 Different abatement costs
To show the influence of the size of abatement costs, we assume the followingdifferent levels:
Abatement costs: A = 0.2(2% of expected value), A = 0.5(5%), A = 2.0(20%)
0.2 0.4 0.6 0.8 1Ig
0.2
0.4
0.6
0.8
1
NC�������
N
20.50.2
Figure 2: Ratio of clean firms to all firms in dependence of abatement costs
The case where abatement costs A are 0.5 (5% of expected value), corre-sponds to the base case of Heinkel et al (2001). If abatement costs are thatlow, the first switch takes place already with the presence of a few green in-vestors. When abatement costs are practically negligible (A corresponding toonly 2% of expected value), even in the absence of any green investors, morethan 30% of companies switch to clean technology, since it is in the interest ofneutral investors for risk reduction reasons. Of course neutral investors in thiscase are accepting only a slight reduction of return. As soon as green investorsbecome more numerous, the proportion of clean firms immediately and steadilyincreases. When abatement costs are economically very sizeable (A correspond-ing to 20% of expected values), than the vast majority of investors have to sharegreen beliefs before the first firm will switch to a clean technology. If abate-ment costs are that high, one can assume that only policy can improve theenvironmental situation, by imposing stricter laws and regulations concerningpolluting production technologies. The dashed vertical line at IG = 0.8 showsthat the proportion of clean firms strongly depends upon the size of abatementcosts; if abatement costs are 20% of expected value, the proportion of clean
11

firms is only just under 40%, whereas in the other two cases it is slightly belowand above 80%.
5.3 Different risk characteristics: Clean firms as a different as-set class
When shares of clean firms have the same risk characteristics (standard devia-tion and perfect correlation) as shares of polluting firms, neutral investors willnot buy such stocks, as they offer lower return without a reduction of totalportfolio risk. On the other hand, as the case of low abatement costs in theprevious example showed, the switch to a clean technology can happen evenin the absence of green investors, due to the motivation of neutral investors tooptimise the risk-return relationship of their portfolios. Since the diversifica-tion motive of neutral investors has such a big impact on results, we want toconsider first the influence of different covariances of firms with clean and pol-luting technology and afterwards examine the case of lower standard deviationsof shares of clean firms.
All parameters are set as in the baseline example, except the covariance ofexpected values: σPC = 50, σPC = 10, σPC = 90
0.2 0.4 0.6 0.8 1Ig
0.2
0.4
0.6
0.8
1
NC�������
N
10 9050
Figure 3: Different levels of covariances
Figure 3 shows how the covariance of the expected value of shares of cleanand polluting firms determines the proportion of each group. When sharesof green and polluting firms are highly correlated (covariance of 90), greeninvestors have to constitute 80% of the population in order to induce the firstfirms to switch to a clean technology. This is, of course, due to the fact that theexpected return of shares of clean firms is lower because of the abatement costof 10% of the original price and so offers little diversification (risk reduction)benefits. When covariance is markedly lower (10), then the switch happens witha much lower population of green investors, since neutral investors will investin shares of clean firms for diversification reasons, in order to get a better risk-return relationship. Since the diversification motive of neutral investors canplay such a decisive role, it is worth discussing here the baseline value for σPC
12
of 50. This value corresponds to a correlation coefficient of about 0.7, which canbe regarded as a “normal number” for stocks belonging to different industries.A covariance of 90 is certainly very high and would mirror the co-movement ofshares of firms within a homogenous industry. A covariance of 10 would depictthe (unrealistic) case where stocks of clean and polluting firms would show lowercorrelation than that observable between stocks and bonds in “normal times”,and would even come close to the hedge funds case (asset class unrelated toother asset classes).
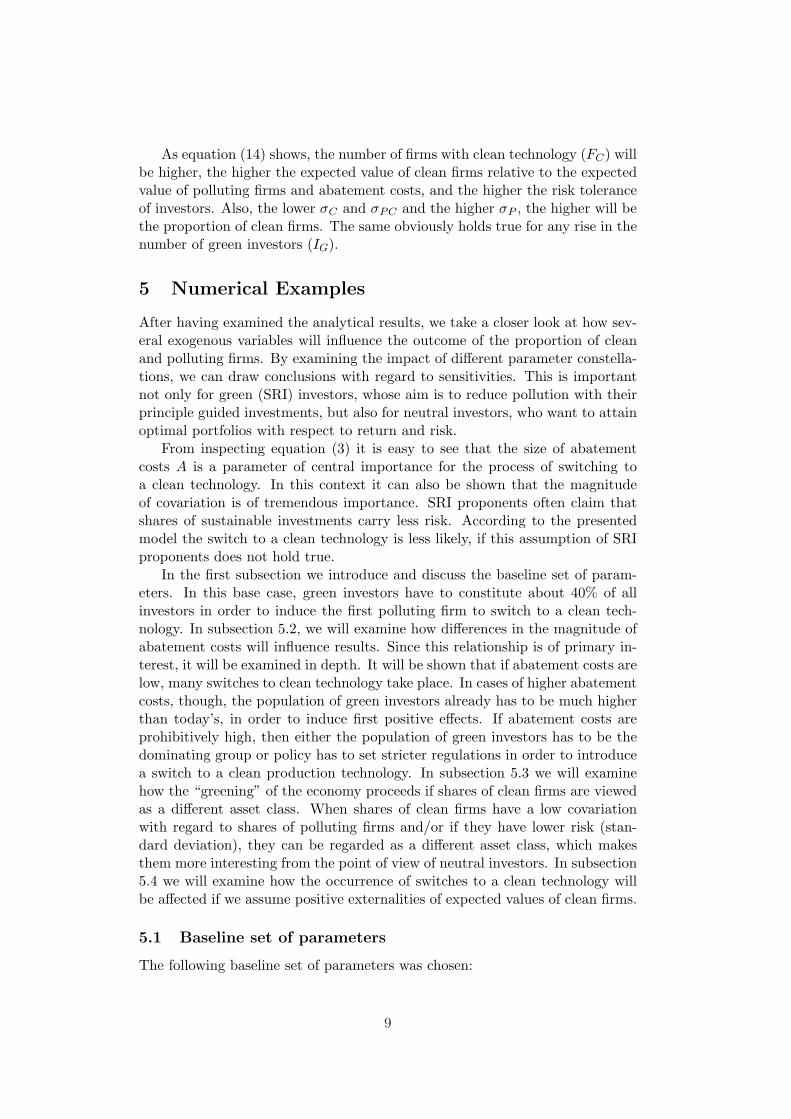
The second component to consider for calculation of total portfolio risk isthe standard deviation of shares of clean firms. For any switches to occur,shares of clean firms have to exhibit lower risk (standard deviation) than theircounterparts of polluting firms. The importance of this factor is demonstratedin Figure 4. While the solid line in Figure 4 represents the base case, thedotted line represents the situation in which firms with polluting technologieshave higher risk (σP = 12) and firms with a clean technology have lower risk(σC = 8). In order to eliminate the (small) impact from the induced change ofcorrelation, covariation was slightly reduced to 48.
0.2 0.4 0.6 0.8 1Ig
0.2
0.4
0.6
0.8
1
NC�������
N
Μp=Μc=10 ;
0.2 0.4 0.6 0.8 1Ig
0.2
0.4
0.6
0.8
1
NC�������
N
Μp=Μc=10 Σp=12,Σc=8,Σcp=48
Figure 4: Case where clean (polluting) firms have less (more) risk
When shares of clean firms have lower risk, clean firms will come into ex-istence at a much lower level compared to the base case. And afterwards thenumber of clean firms is consistently higher than in the base case, regardless ofhow many green investors exist. This is due to the obvious fact that c.p. the(clean) firms with less risk are also more attractive for neutral investors.
SRI proponents claim that socially responsible firms carry less financial risk.This argument, that SRI firms are safer (i.e. especially have less reputationand environmental damage risks) is underpinned by event studies (Hamilton,1995). For these cases SRI arguments have some merit and imply that throughthis risk reduction effect a “greening” of industry could be initiated by greeninvestors supported by neutral investors. But SRI proponents do not argue thatSRI shares have a low correlation to a traditional stock universe and therebyconstitute a different asset class. When green investors use exclusionary screens
13

and abatement costs are not negligible, the process of transformation would beconsiderably supported if it were possible to show that SRI is indeed a differentasset class. Quite contrary to that conclusion, some SRI proponents emphasisethat SRI is “just” a different investment style.
5.4 Positive externalities on expected value of clean firms
Very often SRI proponents assume that earnings of SRI firms could initiallybe lower than those of polluting firms, but will grow faster in the long term.This can be interpreted as the existence of intertemporal positive externalities,maybe due to learning effects. Such positive externalities can only work infavour of clean firms if they do not simultaneously positively affect pollutingfirms.4 If we assume that such positive effects are not confined to each singleclean firm, but raise respectively the value or the knowledge pool of all cleanfirms at the same time, we can incorporate the existence of such effects byintroducing a parameter λ which represents a degree of positive externality forthe expected value of clean firms. The expected value of clean firms will thenbe, according to equation (15)
uC = uP (1 + λFC
F) (15)
where λ has to fulfill to the following condition
0 ≤ λ ≤ A
uP(16)
If λ = 0, we have the model which was implicitly used so far. If λ surpassesthe upper bound, the transformation “explodes” after appearance of the firstclean firm, since the positive externality dominates abatement costs. Equation(15) can be substituted into the utility functions [equations (1) and (2)] andthen the model can be solved accordingly.
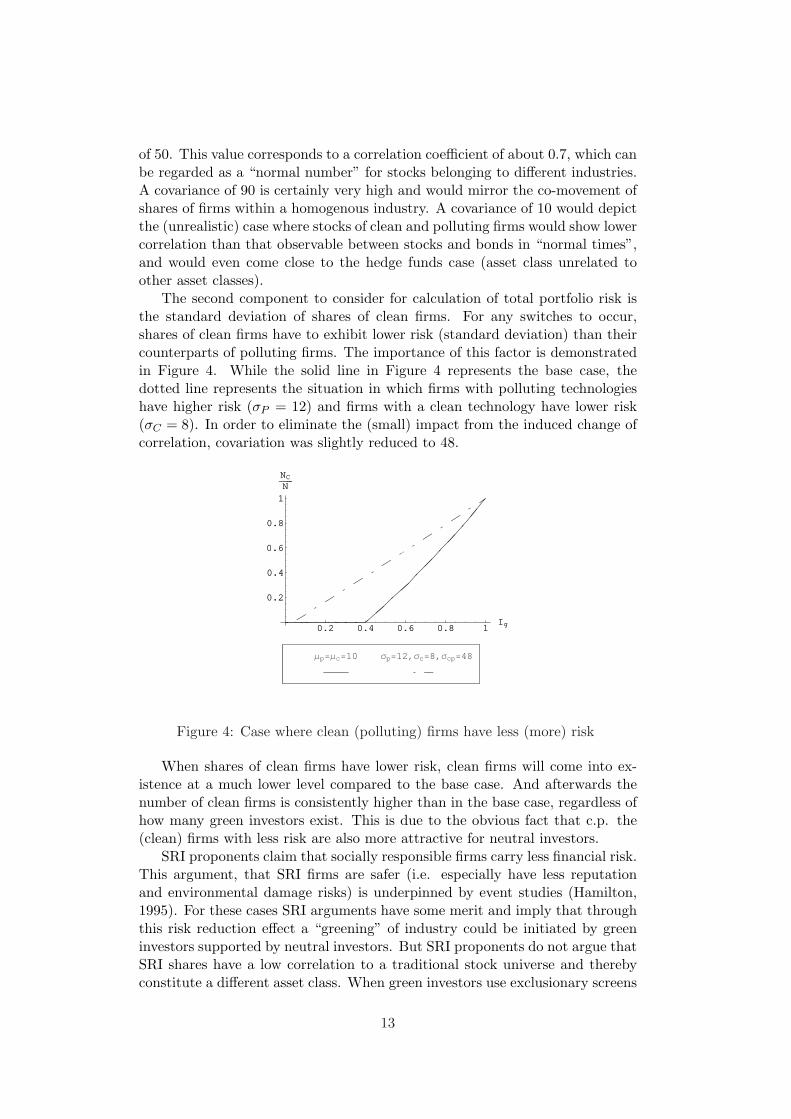
As Figure 5 shows, the curvature changes from convexity to concavity. Withthe onset of the first clean firm, switches happen with higher frequency. If suchpositive externalities exist, the transformation to clean technology takes placewith a much higher probability at all proportions of green investors. The dashedstraight vertical line at point 0.6 shows that the proportion of clean firms inthis case has doubled.
The nature of this externality is such that only firms with clean technol-ogy profit from it. There are different possible interpretations for this. First,knowledge simultaneously produced when investing in abatement could be thereason for such an externality. And that knowledge must be part of a common
4If we assume that externalities affect expected value of both clean as well as pollutingfirms this obviously has no impact on the relative valuation. If we assume that externalitiesaffect expected value of clean firms in just a linear way, then this equals only a change inabatement costs A.
14
0.2 0.4 0.6 0.8 1Ig
0.2
0.4
0.6
0.8
1
NC�������
N
Λ = 0.1
Base Case
Figure 5: Case where shares of clean firms have higher expected values due topositive externalities: λ = 0 (base case) and λ = 0.1.
knowledge pool, only available to clean firms. Or we could assume that cleanfirms have a higher reputation in the view of green and neutral investors alike:both investor groups are willing to assign a higher expected value to shares ofclean firms and additionally that value increases slightly the more clean firmsexist. In this regard it is important to note that expected value is synonymouswith future value. And this future value depends upon two factors: (i) earn-ings or cash flow development (not further addressed in this paper) and (ii)the interest rate used for discounting, incorporating appraisal of risk and timepreference of consumption. This will be discussed now in the following section.
6 Expected and required return, time horizon andrisk tolerance of investors
As already emphasised, the expected (and not discounted) return in the utilityfunctions of neutral and green investors does not correspond to a normal equityrisk premium. But it is possible to compute indirectly such a premium, whichgives the return per annum, if we assume that investors use a finite time horizonin their calculations. Investors calculate the expected and required future valueof their investment (uF ), according to the following formula:
uF − PF = (1 + gi)n − 1 (17)
where PF is the current stock price of firm F , gi the implied and requiredgrowth rate and n the investors’ time horizon in years. The term uF − PF
corresponds to the cost of capital or required rate of return in the terminologyof the article of Heinkel et al. (2001).
If we take the calibration value for “cost of capital” of 8% of Heinkel et al.(2001) and assume that investors discount future cash flows over the next 10years (n = 10), than this 8% translates to an implicit risk premium of about
15
0.77% p.a (=gi) a value which is too low in light of historical experience. A riskpremium of 3.75% of equity returns surpassing the return of a risk free asset(which in this case could be a 10-year government bond) is better suited forcalibration and is in line with historical evidence. If we assume that neutralinvestors demand a risk premium of 3.75%, then in 10 years the expected valueof shares has to be (1 + 0.0375)10 ≈ 1.445 higher than the current share price(abstracting from the appreciation of the bond in the following). But thisimplies also that the parameter τ for the risk tolerance has to be changed.Since the expected value has to surpass the share price not only by 8% butby about 45%, this is only possible if τ , the measure for risk tolerance of allinvestors, is much smaller. This reduced risk tolerance leads to the effect thatstock prices PP and PC are both much lower. In the case that the expectedshare price (expected value) in 10 years has to surpass the price investors arewilling to pay today by about 45% this translates into a sensible value of τ of25. The calibration values of τ of 25 and the assumption that investors discountfirm values of 10 years are closely intertwined: the longer the discount function,the lower the τ has to be in this model, where time is not directly included.But the line of reasoning always stays the same.
The aim of this section is to elaborate on differences in the required returnswhich neutral and green investors expect, i.e. to quantify the implicit costs ofapplication of exclusionary screens by green investors. One remark should bemade at this point though: green investors have the same risk aversion τ asneutral investors, but since they do not want to invest in shares of pollutingfirms at all, they are holding portfolios consisting only of stocks of clean firms,thereby foregoing higher possible investment returns at the same risk level. Infact, green investors use a lexicographical procedure (Dupre et.al., 2004), andthrough the use of this investment principle, they raise return possibilities forneutral investors in all the cases.
In the following, we assume that risk tolerance τ takes a value of 25. Thiscorresponds to an equity premium of about 3.75% of the stock market vs. re-turn of risk free assets per annum. One has to take into account that with suchparameter values abatement costs are relatively less important and switchesoccur even with a lower population of green investors. For example with pa-rameters of the base case of subsection 5.1 (except the change to a lower τ)switches already occur when green investors are less than 1%.
As a starting point, we assume that abatement costs are zero(A = 0). In thiscase firms can somehow switch from polluting to clean technology at no chargeand green investors can somehow perceive this even in the absence of abatementactivities. As can be seen in Figure 6 (line with A = 0), when no green investors(IG) are present, the required return (synonymous to capital costs from the viewof firms) for shares of polluting firms is lowest, amounting to a 10 year equityrisk premium of about 3.7% per annum. Since green investors refrain frompurchases of shares of polluting firms, the required returns of polluting firmsare higher, the higher is the proportion of green investors. When all investorsare principle guided, the required return of the last polluting firm has risen tomore than 5% p.a. This rise is entirely due to the fact that green investorshold undiversified portfolios and since they have the same risk tolerance as
16
0.2 0.4 0.6 0.8 1Ig
0.04
0.045
0.05
0.055
0.06
0.065
0.07
HΜP�������
PPL
1������10-1
A=0
A=1
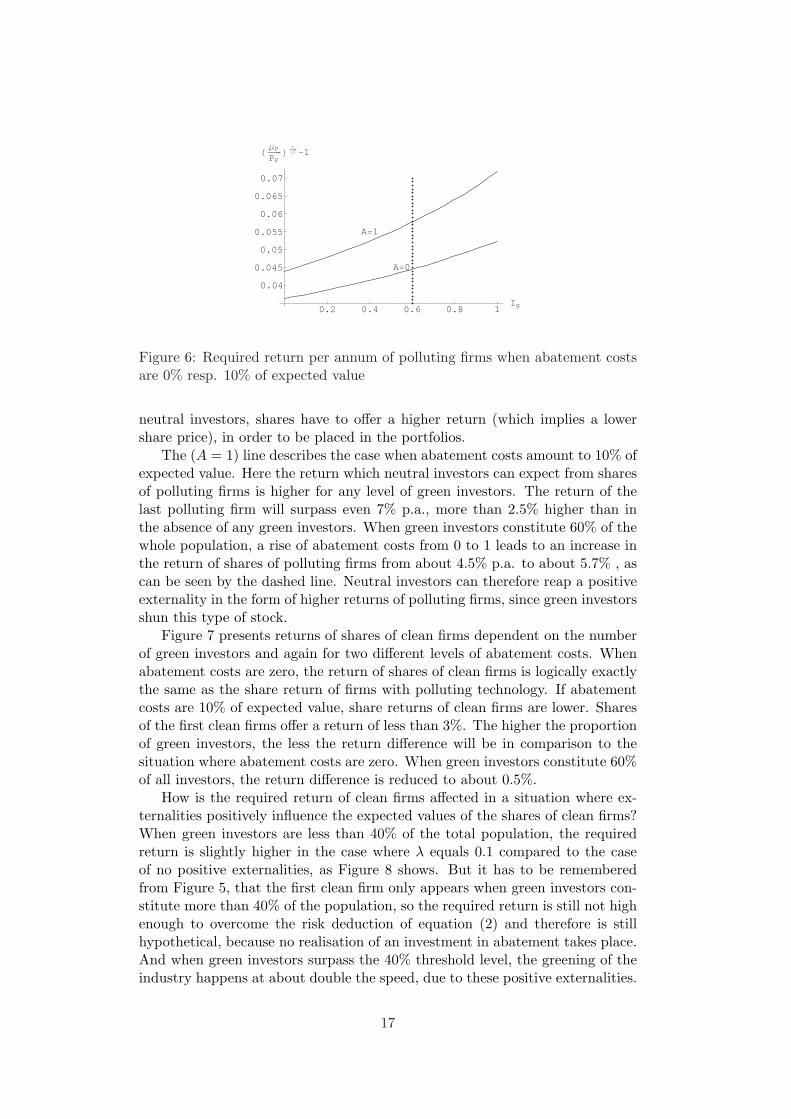
Figure 6: Required return per annum of polluting firms when abatement costsare 0% resp. 10% of expected value
neutral investors, shares have to offer a higher return (which implies a lowershare price), in order to be placed in the portfolios.
The (A = 1) line describes the case when abatement costs amount to 10% ofexpected value. Here the return which neutral investors can expect from sharesof polluting firms is higher for any level of green investors. The return of thelast polluting firm will surpass even 7% p.a., more than 2.5% higher than inthe absence of any green investors. When green investors constitute 60% of thewhole population, a rise of abatement costs from 0 to 1 leads to an increase inthe return of shares of polluting firms from about 4.5% p.a. to about 5.7% , ascan be seen by the dashed line. Neutral investors can therefore reap a positiveexternality in the form of higher returns of polluting firms, since green investorsshun this type of stock.
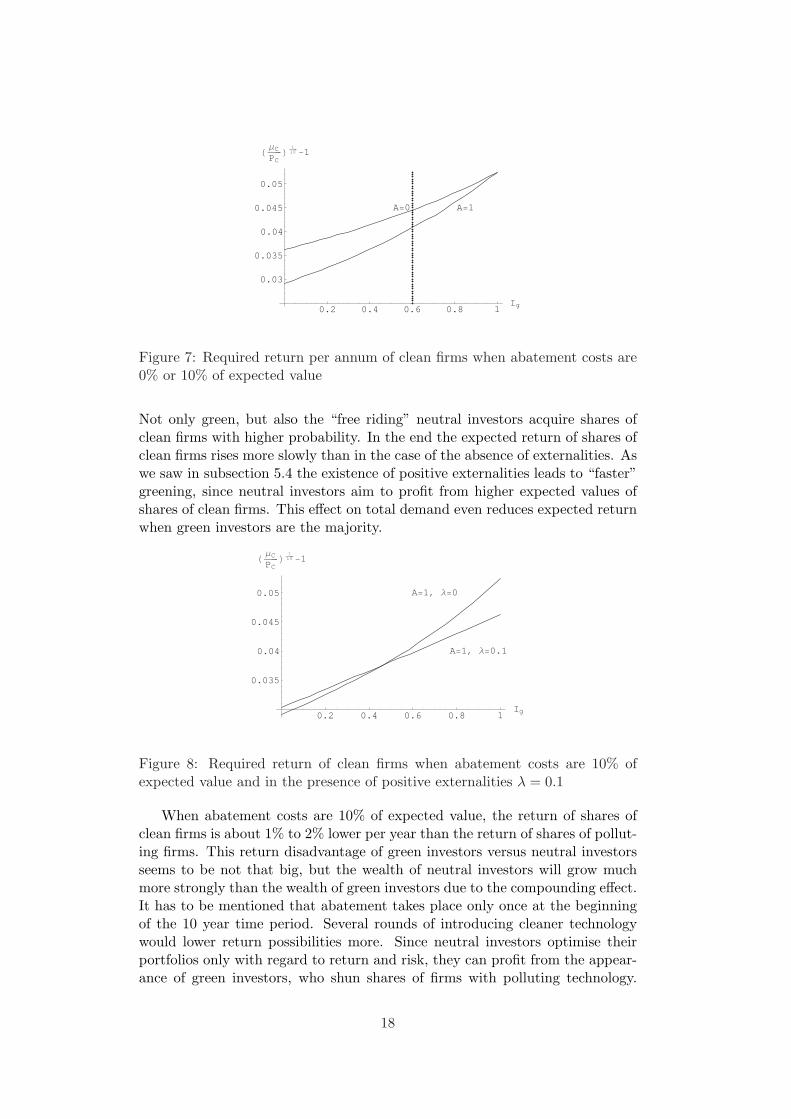
Figure 7 presents returns of shares of clean firms dependent on the numberof green investors and again for two different levels of abatement costs. Whenabatement costs are zero, the return of shares of clean firms is logically exactlythe same as the share return of firms with polluting technology. If abatementcosts are 10% of expected value, share returns of clean firms are lower. Sharesof the first clean firms offer a return of less than 3%. The higher the proportionof green investors, the less the return difference will be in comparison to thesituation where abatement costs are zero. When green investors constitute 60%of all investors, the return difference is reduced to about 0.5%.
How is the required return of clean firms affected in a situation where ex-ternalities positively influence the expected values of the shares of clean firms?When green investors are less than 40% of the total population, the requiredreturn is slightly higher in the case where λ equals 0.1 compared to the caseof no positive externalities, as Figure 8 shows. But it has to be rememberedfrom Figure 5, that the first clean firm only appears when green investors con-stitute more than 40% of the population, so the required return is still not highenough to overcome the risk deduction of equation (2) and therefore is stillhypothetical, because no realisation of an investment in abatement takes place.And when green investors surpass the 40% threshold level, the greening of theindustry happens at about double the speed, due to these positive externalities.
17
0.2 0.4 0.6 0.8 1Ig
0.03
0.035
0.04
0.045
0.05
HΜC�������
PCL
1������10-1
A=1A=0
Figure 7: Required return per annum of clean firms when abatement costs are0% or 10% of expected value
Not only green, but also the “free riding” neutral investors acquire shares ofclean firms with higher probability. In the end the expected return of shares ofclean firms rises more slowly than in the case of the absence of externalities. Aswe saw in subsection 5.4 the existence of positive externalities leads to “faster”greening, since neutral investors aim to profit from higher expected values ofshares of clean firms. This effect on total demand even reduces expected returnwhen green investors are the majority.
0.2 0.4 0.6 0.8 1Ig
0.035
0.04
0.045
0.05
HΜC�������
PCL
1������10-1
A=1, Λ=0
A=1, Λ=0.1
Figure 8: Required return of clean firms when abatement costs are 10% ofexpected value and in the presence of positive externalities λ = 0.1
When abatement costs are 10% of expected value, the return of shares ofclean firms is about 1% to 2% lower per year than the return of shares of pollut-ing firms. This return disadvantage of green investors versus neutral investorsseems to be not that big, but the wealth of neutral investors will grow muchmore strongly than the wealth of green investors due to the compounding effect.It has to be mentioned that abatement takes place only once at the beginningof the 10 year time period. Several rounds of introducing cleaner technologywould lower return possibilities more. Since neutral investors optimise theirportfolios only with regard to return and risk, they can profit from the appear-ance of green investors, who shun shares of firms with polluting technology.
18
Required return for such firms will rise, whereas the required return for sharesof clean firms will be lower. Neutral investors therefore profit indirectly fromstrategies of principle guided investors. This holds true also for the case ofpositive externalities on the expected value of clean firms.
7 Implications for SRI
The presented model operates with a clear differentiation between firms re-garding technology: clean (FC) or polluting (FP ) firms differ only because ofabatement (A). One could argue that neither of these terms is defined precisely.In theory, FC and FP could alternatively stand for a totally different dimension,e.g. socially acceptable behaviour in which case A would be an investment in asocietal cause. In the case of focussing on either dimension (environmental orsocial), A could also be just a marketing activity to give the impression thatthe firm belongs to the class of companies which would be bought by principleguided investors. But such window-dressing would only show effects if no ob-jectively verifiable variable is available which can be traced by outsiders. Andthe aforementioned argument can also be countered by the consideration thatthe crucial point of view from economics is the question of whether FC or FP
firms differ with respect to expected return and risk.An implication of the model results is that principle guided investors can
only have an impact if their number surpasses a (variable) threshold level, whichis mainly determined by the size of the abatement costs. And this result holdsonly if, additionally, the condition is fulfilled that green investors hold homoge-nous beliefs about what differentiates clean from polluting firms. Thereforewe conclude that for the organisation of sustainability research, only a clearlydefined, objectively measurable dimension for the differentiation between cleanand polluting firms should be used. This derives from the implicit assumptionof the model that all green investors have unilaterally agreed about which firmsare clean or polluting, e.g. have homogeneous beliefs and observations. If theyhave heterogeneous beliefs about which companies are clean or polluting, theeffectiveness of principle-guided investments will be weakened. In this situationgreen investors could agree on a few standard-setting agencies (sustainabilityrating agency analogous to bond rating agencies), in order to form homogeneousbeliefs or could agree on well-accepted methods of evaluating firms concerningtheir environmental impact.
This aforementioned abstractness of the model has the advantage of flexi-bility: The results of the model can be applied to the stock market as a whole,or to any subsegment of it, as, for example, on the industry level. If the ex-clusionary screen is used in an intra-industry sense, green investors could focuson the most important dimensions (e.g. reduction of CO2-emission, reductionof energy input, etc.). This would not only reduce monitoring costs immensely,but would also have the benefit that the knowledge of SRI analysts could beused to the fullest extent with regard to defining the most important negativeexternalities of industries and identifying better existing technologies. In cer-tain cases, environmentally better and economically feasible technology is not
19
put in place for reasons of short term cash flow optimisation, as for example inthe steel industry in the nineteen seventies (Hartel, 1987).
In the case of almost negligible abatement costs, investment returns to greeninvestors are not that much less than investment returns to neutral investors.In such cases, methodologies and current procedures of SRI funds can be ap-propriate. If the number of green investors is limited, only very few firms willwork with clean technology and additionally green investors will have a notice-able return disadvantage. In this situation a collective mutual action of SRIinvestors, which is focused on just one or few companies in a highly pollutingindustry, could be undertaken and/or SRI proponents could additionally focuson political action concerning changes of laws, regulations and introduction oftaxes on negative externalities (Statman, 2000).
8 Summary and conclusions
SRI proponents argue under the basic tenets of stakeholder theory that firmsaiming at achieving economic, social and environmental goals simultaneouslyshould have a better economic performance than firms which just focus oncorporate profits. Neoclassical proponents of shareholder value proclaim, onthe other hand, that management should only maximise firm profits. Empiricalresults of SRI versus traditional portfolios are still ambiguous so far. SRI’s lineof argumentation on how corporate sustainability should simultaneously leadto better environmental and economic performance is on the one hand vague,while on the other hand a firm in microeconomics is basically “a black box”.
The presented 2-agents, 1-period model shows, that mainly the size of abate-ment costs and the number of green investors determine if some firms switchto a clean production technology or not. When shares of clean firms form aclearly distinguishable asset class (not only with regard to return but also withrespect to standard deviation and covariation), the positive effect on environ-mental quality will be higher, because neutral investors will then also investmeaningfully in such shares of clean firms. In any case, the model unequivo-cally predicts that principle guided investors incur opportunity costs by havingportfolios which consist only of shares of clean firms, which deliver less return.
Under the assumption that avoidance of pollution incurs abatement costs,the presented model shows that the proportion of firms working with a cleantechnology highly depends upon the distribution of green and neutral investors.The model also implies that green investors have to forego some investmentreturns when implementing principle guided investment strategies. Assumingeven relatively low abatement costs, the population of green investors has to besizeable, in order to induce some polluting firms to switch to a clean technology.The model implies that green investors using exclusionary screens will be moresuccessful, the lower the covariation of shares of clean and polluting firms,the lower the risk tolerance of neutral investors and the less risky (standarddeviation) shares of clean firms are, and the more homogeneous the beliefs ofprinciple guided investors are.
SRI proponents often claim that shares of clean firms carry less risk and
20
event studies provide some empirical support for this argument. Implementingthese findings in the assumptions of our model leads to a higher proportionof clean firms, since neutral investors can find shares of clean firms attractivefor reduction of risks despite their lower return. If investment in abatementproduces a positive externality on expected values of clean firms, than this willresult in a higher proportion of clean firms as soon as the first switch has oc-curred. It could be better reputation or deepened knowledge about productionpossibilities which could be responsible for the existence of this positive exter-nality. But the economic rewards of these positive externalities will have to beshared between green and neutral investors.
The accurate description of the nature and effectiveness of such positiveexternalities is still open for further research. In a dynamic context, the factthat the wealth of green investors will grow at a slower pace than that ofneutral investors could bring additional fruitful insights on if and how SociallyResponsible Investment can be successful.
21

References
Beltratti, Andrea (2003), “Socially Responsible Investment in General Equilib-rium”, Nota di Lavoro 93.2003, Fondazione Eni Enrico Mattei.
Berman, Shawn L., Andrew C. Wicks, Suresh Kotha and Thomas J. Jones(1999), “Does Stakeholder Orientation Matter? The Relationship betweenStakeholder Managements Models and Firm Financial Performance”, Aca-demy of Management Journal, Vol. 42, No. 5, 488 - 506.
Donaldson, Thomas and Lee E. Preston (1995), “The Stakeholder Theory ofthe Corporation: Concepts, Evidence, and Implications”, Academy ofManagement Review, Vol. 20, No. 1, 65 - 91.
Dupre, Denis, Isabelle Girerd-Potin and Raghid Kassoua (2004), “Adding anEthical Dimension to Portfolio Management”, Finance India, Vol. XVIIISpecial Issue, 625 - 641.
Freeman, R. Edward (1984), “Strategic Management: A Stakeholder Approach”,Boston: Pitman.
von Flotow, Paschen, Rolf-D. Hassler and Johannes Schmidt (2002), “Umwelt-und Nachhaltigkeitstransparenz fur Finanzmarkte”, Institut fur Okologieund Unternehmensfuhrung an der European Business School e.V.http://www.instoec.de .
Friedman, Milton“The social responsability of business is to increase its profits”,New York Times Magazine, 122 -126.
Hartel, Hans-Hagen, Klaus Matthies and Muaffac Mously (1987), “Zusammen-hang zwischen Strukturwandel und Umwelt”, Hamburg: Verlag Weltarchiv.
Hamilton, Jo T. (1995), “Media and Stock Market Reactions to the Toxics Re-lease Inventory Data”, Journal of Environmental Economics and Man-agement , Vol. 28, No. 1, 98 - 113.
Heinkel, Robert, Alan Kraus and Josef Zechner (2001), “The Effect of Green In-vestment on Corporate Behavior”, Journal of Financial and QuantitativeAnalysis , Vol. 36, No. 4, 431 - 449.
Murphy, Christopher J. (2002), “The Profitable Correlation Between Environ-mental and Financial Performance: A Review of the Research”, LightGreen Advisors, http://www.lightgreen.com/files/pc.pdf.
Orlitzky, Marc, Frank L.Schmidt and Sara L. Rynes (2003), “Corporate Socialand Financial Performance: A Meta-analysis”, Organization Studies, Vol.24, No.3), 403 - 441.
Schepers, Donald H. and Prakash Sethi (2003), “Do Socially Responsible Fundsactually deliver what they promise?”, Business and Society Review, Vol.108, Issue 1, 11 - 32.
22

Schroder, Michael (2004),“The Performance of Socially Responsible Invest-ments: Investment Funds and Indices”, Financial Markets and PortfolioManagement, Vol. 18, No. 2, 122-142.
Schroder, Michael (2005),“Is there a Difference? The Performance Charac-teristics of SRI Equity Indexes”, Zentrum fur Europaische Wirtschafts-forschung, Discussion Paper No. 05-50.
Statman, Meir (2000),“Socially Responsible Mutual Funds”, Financial AnalystsJournal, Vol. 56, No. 3, 30 - 39.
23

Working Papers of the Institute of Economic Research
(PDF-files of the Working Papers can be downloaded at www.wif.ethz.ch/research).
05/44 Ch. Bjørnskov, A. Dreher and J.A.V. Fischer: The bigger the better? Evidence ofthe effect of government size on life satisfaction around the world
05/43 L. Bretschger: Taxes, Mobile Capital, and Economic Dynamics in a GlobalisingWorld
05/42 S. Smulders, L. Bretschger and H. Egli: Economic Growth and the Diffusion of CleanTechnologies: Explaining Environmental Kuznets Curves
05/41 S. Valente: Tax Policy and Human Capital Formation with Public Investment inEducation
05/40 T.M. Steger and L. Bretschger: Globalization, the Volatility of Intermediate GoodsPrices and Economic Growth
05/39 H. Egli: A New Approach to Pollution Modelling in Models of the EnvironmentalKuznets Curve
05/38 S. Valente: Genuine Dissaving and Optimal Growth
05/37 K. Pittel, J.-P. Amigues and T. Kuhn, Endogenous Growth and Recycling: A Ma-terial Balance Approach
05/36 L. Bretschger and K. PittelInnovative investments, natural resources, and intergenerational fairness: Are pen-sion funds good for sustainable development?
04/35 T. Trimborn, K.-J. Koch and T.M. StegerMulti-Dimensional Transitional Dynamics: A Simple Numerical Procedure
04/34 K. Pittel and D.T.G. RubbelkePrivate Provision of Public Goods: Incentives for Donations
04/33 H. Egli and T.M. StegerA Simple Dynamic Model of the Environmental Kuznets Curve
04/32 L. Bretschger and T.M. StegerThe Dynamics of Economic Integration: Theory and Policy
04/31 H. Fehr-Duda, M. de Gennaro, R. SchubertGender, Financial Risk, and Probability Weights
03/30 T.M. StegerEconomic Growth and Sectoral Change under Resource Reallocation Costs
03/29 L. BretschgerNatural resource scarcity and long-run development: central mechanisms when con-ditions are seemingly unfavourable

03/28 H. EgliThe Environmental Kuznets Curve - Evidence from Time Series Data for Germany
03/27 L. BretschgerEconomics of technological change and the natural environment: how effective areinnovations as a remedy for resource scarcity?
03/26 L. Bretschger, S. SmuldersSustainability and substitution of exhaustible natural resources. How resource pricesaffect long-term R&D-investments
03/25 T.M. StegerOn the Mechanics of Economic Convergence
03/24 L. BretschgerGrowth in a Globalised Economy: The Effects of Capital Taxes and Tax Competition
02/23 M. Gysler, J.Kruse and R. SchubertAmbiguity and Gender Differences in Financial Decision Making: An ExperimentalExamination of Competence and Confidence Effects
01/22 S. RutzMinimum Participation Rules and the Effectiveness of Multilateral EnvironmentalAgreements
01/21 M. Gysler, M. Powell, R. SchubertHow to Predict Gender-Differences in Choice Under Risk: A Case for the Use ofFormalized Models
00/20 S.Rutz, T. BorekInternational Environmental Negotiation: Does Coalition Size Matter?
00/19 S. DietzDoes an environmental Kuznets curve exist for biodiversity?