wiens page: 1 16 february 2004 running head: points of...
TRANSCRIPT

Wiens Page: 1
16 February 2004
Running Head: Points of View
The Role of Morphological Data in Phylogeny Reconstruction
John J. Wiens
Department of Ecology and Evolution,Stony Brook University
Stony Brook, NY 11794-5245, USA; E-mail: [email protected]
Key Words: combining data, fossils, incongruence, morphology, phylogenetics

Wiens Page: 2
We live in the age of comparative genomics, and it may seem that there is not much pointin reconstructing phylogenies using morphological data anymore. As more and moregenes and genomes are being sequenced, the possibility that thousands or even millionsof informative, independently evolving molecular characters can be brought to bear on agiven phylogenetic problem is quickly becoming a reality (e.g., Rokas et al., 2003).Given the rate that new sequence data are being added, and the rate at which newinnovations continue to accelerate this process, it seems possible that in the not-too-distant future we will be able to have a perfectly accurate and well-supported phylogenyof most living species on earth using molecular data alone. So why bother withmorphology?
A recent paper by Scotland et al. (2003; SEA hereafter) offered a reappraisal ofthe role of morphology in phylogeny reconstruction. This is certainly an important andtimely topic to discuss, and their main thesis is bold and controversial. They state that“We view any attempt to include more morphological data in phylogeny reconstructionas inherently problematic” (p. 545). Unfortunately, most of their arguments are based onunsupported speculation, and they fail to mention numerous studies that clearly contradicttheir conclusions. Given that many of their comments are written as responses to bookchapters written by my collaborators and myself (e.g. Hillis and Wiens, 2000; Poe andWiens, 2000; Wiens, 2000a), I feel obligated to elucidate some of these problems. Manyof the issues raised are central to how systematics is done and will be conducted in thefuture. I will argue that, despite many undeniable advantages of molecular data, it is stillabsolutely necessary that we continue to collect additional morphological data forphylogenetic analysis, and continue to improve our methods for morphology-basedphylogenetics. Note that Jenner (2004) has provided an independent rebuttal of the SEApaper, and he describes a large number of substantive criticisms which show only limitedoverlap with my own.
WHY WE STILL NEED TO COLLECT MORE MORPHOLOGICAL DATAThe Future
There are many reasons to continue to do morphological phylogenetics. Butgiven the incredible rate of advances in molecular systematics, it may be useful to dividethese reasons into those pertaining to the present and future. Those pertaining to thefuture may actually be the most relevant, because many present-day limitations ofmolecular phylogenetics seem likely to be overcome very soon. I will focus on theputative future first, and then deal with present-day issues.
The most compelling reason to continue to collect morphological data long intothe future is to resolve the phylogenetic relationships of fossil taxa and their relationshipsto living taxa (e.g., Maddison, 1996; Hillis and Wiens, 2000; Jenner, 2004). Thereconstructed Tree of Life must include fossil taxa. Considering all the species that haveever evolved, most are now extinct (> 99% according to some estimates; Novacek andWheeler, 1992), and many extinct groups were diverse, ecologically important, and verydistinct from their closest living relatives. For now and the immediate future, therelationships of most fossil taxa can only be determined through phylogenetic analysis ofmorphological data (despite impressive molecular studies of very recent fossil taxa).Contrary to what SEA imply (p. 543), fossils are not merely important for their potentialto help resolve relationships of living taxa, and Hillis and Wiens (2000) did not advocate

Wiens Page: 3
thorough taxon sampling solely because of its potential benefits for phylogenyestimation.
Our understanding of the rate and timing of macroevolutionary processes in bothliving and fossil taxa also requires phylogenetic information from fossils. Althoughmethods are available that allow divergence dates for living taxa to be estimated withmolecular data (e.g., Sanderson, 1997, 2002; Yoder and Yang, 2000; Thorne andKishino, 2002), they still require external calibration. That calibration usually comesfrom fossil evidence, which requires correctly assigning fossils to groups of living taxa.Because older fossils are rarely identical or conspecific with living species, we cannotsimply assign fossils to living groups based on overall similarity. We need to estimate aphylogeny for the fossil and living taxa, and this can only be done using morphologicaldata.
Perhaps most importantly, given that the earth’s biota has changed dramaticallyand repeatedly through time, understanding how the modern world became the way that itis requires studying fossils. When we look at a fossil the first thing we need to know is“what is it?,” which really means “to what clade does it belong?” Again, this is aquestion that is best answered through phylogenetic analysis. Understandingevolutionary processes (e.g., character evolution) in fossil taxa also requires knowledgeof their phylogenetic relationships, just as in living taxa (e.g., Gatesy and Dial, 1996).
SEA do mention fossils (p. 543), but mostly in the context of how their inclusioneffects estimated relationships among living species. They question whether addition offossil taxa can improve accuracy for phylogenetic studies focusing on living taxa, basedon three points: (1) their belief that studies showing improved accuracy from increasedtaxon sampling used only large (>1,000) numbers of characters, (2) a single examplefrom seed plant phylogeny, and (3) the problem of missing data.
SEA question the benefits of increased taxon sampling in morphological studies,stating “less clear is the role of dense taxon sampling when there are fewer characters, asin morphological studies” (p. 542). Yet, contrary to what SEA imply, simulation studieshave confirmed the benefits of increased taxon sampling for phylogenetic accuracy evenwhen the number of characters is limited (e.g., 100 characters, Huelsenbeck, 1991 [citedbut not mentioned by SEA]; Wiens, 1998b).
SEA also question the benefits of including fossil taxa for phylogenetic accuracy,based on a single example involving conflicts between morphological and molecular datain angiosperms (p. 543). The obvious counterexample (cited but not mentioned by SEA)is the morphological study of amniote relationships by Gauthier et al. (1988), in whichlepidosaurs (tuataras, lizards and snakes) are placed as basal within amniotes if certainfossil taxa are excluded. Numerous molecular studies confirm the traditionalmorphological hypothesis, showing that lepidosaurs are not basal (Meyer and Zardoya,2003). Thus, the addition of fossil taxa seems to increase congruence between themolecular and morphological results in this case, suggesting that addition of fossil taxa isimportant for phylogenetic accuracy.
Finally, SEA suggest that the accuracy of phylogenetic analyses that include fossiltaxa is limited by their “large amounts of missing data” (p. 543). Recent simulationstudies suggest that the amount or proportion of missing data in incomplete taxa may beirrelevant to their accurate placement (i.e., taxa that are 90% incomplete with nearly2,000 missing data cells each can be placed with perfect accuracy on a phylogeny; Wiens,

Wiens Page: 4
2003a), although a high proportion of missing data may limit their ability to changerelationships among more complete taxa (Wiens, 2003b).
The PresentI have assumed a future in which the relationships of every living species are
well-established using molecular data. Although such a future seems likely (especially ifrates of genome sequencing and species extinction both continue to accelerate), we areclearly not there yet. Given this, there are a number of compelling reasons to continue toreconstruct phylogenies using morphological data.
First, there are many taxa that are extant but may still be very difficult to includein molecular studies. For example, many reptile and amphibian species are known from alimited number of specimens, are preserved so as to make obtaining molecular data verydifficult (i.e., formalin fixation), and may never be collected again (i.e., because oflimited distributions, habitat destruction, and other factors). Given present technology,the only way that we may know anything about the relationships of these species isthrough phylogenetic analysis of morphology. A similar situation may exist in other taxaas well (e.g., insects and plants; Wilson, 1992; Donoghue and Alverson, 2000), and manyspecies remain known from a single specimen that was collected decades ago.Nevertheless, such problems may be largely absent in other groups of organisms, and thetechnological barriers that presently limit obtaining significant DNA sequence data fromsome types of preserved specimens may soon be broken.
Second, until we reach the stage where all molecular phylogenies arereconstructed without error, it is still important to have rigorous, morphology-basedphylogenies as a “reality check” for molecular results (e.g., Doyle, 1992; Hillis andWiens, 2000; Jenner, 2004). There are many factors that may cause molecular analysesto reconstruct clades that are both incorrect and statistically well-supported, a possibilitynot considered by SEA. These factors include long-branch attraction (e.g., Felsenstein,1978; Huelsenbeck, 1997), deviations between gene and species trees (e.g., Doyle, 1992;Maddison, 1997), and more mundane problems such as contamination andmisidentification of specimens. Comparing molecular results to rigorous morphology-based phylogenies can help prevent us from being misled in these cases.
A real-world example illustrates this idea. Sites et al. (1996) presented aphylogeny for iguanid lizards based on mtDNA sequences from the ND4 gene, whichconflicted with a tree based on morphology (de Queiroz, 1987). An important source ofincongruence was the position of Cyclura. ND4 data placed Cyclura near the base of theiguanid tree, whereas de Queiroz’s data tentatively placed Cyclura with Iguana. Asubsequent morphological study, using many additional characters , showed strongsupport for the Cyclura + Iguana clade (Hollingsworth, 1998). Analyses based on twoadditional mtDNA data sets gave conflicting results, with cytochrome b supporting theND4 tree (Petren and Case, 1997), and ribosomal sequences (12S, 16S) supporting theCyclura + Iguana clade (with Sauromalus potentially included as well; Rassmann, 1997).Further analysis and parametric simulations (Wiens and Hollingsworth, 2000) showedthat the basal placement of Cyclura was likely an artifact of long-branch attraction inthese two fast-evolving protein-coding genes, associated with an accelerated rate ofchange in these genes in Cyclura (a seemingly widespread problem in cytochrome b athigher levels of divergence; Meyer, 1994). There are several interesting lessons from this

Wiens Page: 5
study: (1) the misleading results were concordant between two molecular data sets, andthe combined analyses of all three molecular data sets was misled by long-branchattraction, (2) long-branch attraction can be problematic even in well-sampled groups ofclosely-related species, even when using maximum likelihood and multiple genes, and(3) analysis of the molecular data alone would seemingly have led to the wrongphylogenetic placement of Cyclura, and the problem was detected primarily because ofdiscordance with a thorough phylogenetic analysis of the morphology.
Of course, problems in individual molecular data sets can also be detected bycomparison to other, independently evolving molecular data sets. But there may be caseswhere all molecular data sets may give the wrong answer (e.g., sequencing amisidentified specimen for many different genes). Furthermore, a typical set ofmorphological characters should draw on information from many different unlinkedgenes (Doyle, 1992; Hillis and Wiens, 2000), whereas the characters in a given moleculardata set are often linked and inherited as a single unit (i.e., nucleotide positions in a singlegene).
Finally, it is important to note that we are very far from describing all the livingspecies on earth, much less sequencing them. This issue is somewhat distinct from thatof using morphology to build trees (the sole focus of the SEA paper, and most othermorphology vs. molecules reviews), but is closely related and critically important(Maddison, 1996). Conservative estimates are that ~1.5 million species have beendescribed and 5–10 million more await description (e.g., Wilson, 1992; May, 2000).With some exceptions, new species are generally discovered, delimited and describedusing morphological data. Although species delimitation using morphological data istypically based on diagnostic characters rather than phylogenetic analysis, it can be, andperhaps should be, tree-based (Baum and Donoghue, 1995; Wiens and Penkrot, 2002). Infact, the best methodology for delimiting species using morphological data remainsentirely unresolved, and these different methods can give very different species limits forthe same morphological data (Wiens and Penkrot, 2002). In the context of morphology-based taxonomy, phylogenetic analysis of morphological data is also critical for placingnew species within a higher taxon, given the obvious shortcomings of using overallmorphological similarity to classify species (e.g. Wiley, 1981).
Despite the many advantages of molecular data, it is absolutely critical thatsystematists continue to be trained in morphological systematics as well, particularly forpoorly known groups (Hillis and Wiens, 2000). If students are trained exclusively inmolecular techniques, the next generation of systematists may be incapable of identifyingthe species in their study groups, and phylogenetic progress in these groups may quickly“grind” to a halt. Quick and accurate identification of species in the field and laboratorybased on morphological characters also is critical to many other areas of biology besidessystematics (e.g., ecology, behavior, physiology; Maddison, 1996).
WHY THE SEA APPROACH IS PROBLEMATICThe main thesis of the SEA paper is that morphological data are so intrinsically
problematic that they should not be used to reconstruct phylogenies. Instead, SEA arguethat “unambiguous” morphological characters should be merely mapped ontophylogenies established by molecular data to determine if they add further support tospecific nodes. This approach will not succeed. The most unassailable advantage of

Wiens Page: 6
morphological data is that it allows us to address the phylogeny of fossil taxa and theirrelationships to living taxa. Yet, their approach will not allow us to address the positionof fossil taxa for which molecular data cannot be obtained (i.e., almost all of them).Similarly, the phylogenetic placement of any extant taxa known only from morphologicaldata will remain unresolved. Further, morphological data will not provide rigorousindependent corroboration for trees based on molecular data, because no newmorphology-based trees will be reconstructed. In fact, it is unclear what meaningfulpurpose morphological data would serve under their approach.
The SEA approach assumes that, for a given analysis, having more morphologicalcharacters is not necessarily better. Their reasoning is basically as follows. (1) Our pre-molecular knowledge of phylogeny comes mostly from morphological classifications, notmorphological phylogenetics. (2) The researchers who built these classifications foundthe best characters. (3) Any additional characters are likely to be problematic in terms ofhomology assessment and character coding. (4) Even though adding characters generallyincreases accuracy in simulation studies, adding characters in morphologicalphylogenetics will not, because the problematic nature of these characters (e.g., missingdata, polymorphism, continuous variation, uncertain homology assessment) willoutweigh their potential benefits. SEA are wrong about each of these points.
Morphology-based Classification = Morphology-based PhylogenyFundamental to the SEA approach is the assumption that pre-phylogenetic
morphology-based classifications are largely equivalent to modern morphology-basedphylogeny estimates, and make phylogenetic studies of morphology unnecessary. They(p. 543) took exception to my statement (Wiens, 2000a) that most of our knowledge ofthe Tree of Life is based on phylogenetic studies of morphological data. They claimedthat most of our knowledge of phylogeny is based on classifications instead, but withoutany supporting evidence or citations. My statement was based largely on the observationthat, in the 1980s and early 1990s, researchers undertook morphology-based phylogeneticanalyses of many of the major groups of multi-cellular organisms, including plants (e.g.,Mishler and Churchill, 1985; Doyle and Donoghue, 1986), animals (Brusca and Brusca,1990), arthropods (Kristensen, 1981, 1991, Schultz, 1990), fish (Lauder and Liem, 1983),amphibians (Duellman and Trueb, 1986; Trueb and Cloutier, 1991), amniotes (Gauthieret al., 1988), mammals (Novacek, 1986), turtles (Gaffney and Meylan, 1988), birds(Cracraft, 1988), and squamates (Estes et al., 1988). These morphological studies, andmany others at similar or lower taxonomic levels, revealed that many traditionallyrecognized higher-taxa are not monophyletic (e.g., Class Pisces, Class Reptilia). Thesestudies also supported the monophyly of many traditionally recognized taxa. Theimportant point is that the classifications of these major groups were tested withphylogenetic analyses of morphology, long before the current explosion of DNAsequence studies. Contrary to what SEA assert (without any supporting citations), not allclassifications were handed down untested from pre-Hennigian days.
Adding Morphological Characters: All the Good Ones Are TakenSEA claim (p. 541) that “…there are few characters that seem to be
uncontroversial in relation to homology assessment. These characters typically areidentified in traditional classifications and are the first characters to be included in a

Wiens Page: 7
phylogenetic data set. Increasing the number of characters increases the level ofambiguous or problematic characters.” There is no support for this claim. SEA do citetheir own graphs showing the relationship between problematic homology assessment,problematic character coding, and number of characters (their Fig. 1). But these graphslack any supporting data, and instead merely represent the unsupported opinion of theauthors (see also Jenner, 2004). There is no a priori reason to assume that previousworkers exhausted all the potentially useful characters. In fact, it may be more logical toassume that traditional workers primarily reported characters that supported their favoredhypothesis, and not ones that they considered to be unimportant or misleading. My ownexperience in morphological phylogenetics (e.g., Wiens, 1993a,b; Reeder and Wiens,1996; Wiens and Reeder, 1997; Wiens and Penkrot, 2002; Stephens and Wiens, 2003;Wiens and Etheridge, 2003; Wiens et al., 2003) suggests that traditional workers did notreport all of the potentially informative morphological characters, and they tended not tosynthesize many different types of morphological characters in a single study. Thus,character lists in my own studies often credit many previous authors (but rarely a singleauthor or set of authors) and contain characters not used by any of them. Furthermore,many types of morphological data may not have been available in older studies (e.g.,from SEM of microscopic structures).
Adding “Problematic” Types of Morphological Characters will not IncreasePhylogenetic Accuracy
SEA assume that traditional researchers found the best morphological characters,and that characters added subsequently will not increase accuracy because they aresomehow problematic or ambiguous. Nonetheless, SEA report the claim made by Poeand Wiens (2000), that there is no justification for excluding characters because ofvariation within terminal taxa, continuous and quantitative variation, unknown polarity,and assumed levels of homoplasy. SEA disagree with this claim.
What is fundamentally different between the views of SEA and Poe and Wiens(2000)? Clearly, SEA think that adding “ambiguous” characters will not increasephylogenetic accuracy, whereas Poe and Wiens (2000) think that they will. So who isright? In fact, SEA have no support for their statement; their single empirical example(see below) is entirely lacking data on the number of “ambiguous” characters. Incontrast, the assertions of Poe and Wiens (2000) were based explicitly on numerousstatistical, simulation and congruence studies which showed that these types of so-calledambiguous characters do contain useful phylogenetic information (i.e., continuous andquantitative variation [Thiele, 1993, see also Wiens, 2001], polymorphic characters[Wiens, 1995, 1998a,b, 1999, 2000b; Wiens and Servedio, 1997, 1998], characters withmissing data [Wiens, 1998c]). Furthermore, many of these studies specifically addressedthe question of whether accuracy was increased more by excluding these problematiccharacters or including them (Wiens and Servedio, 1997; Wiens, 1998a,b,c). The resultsshowed that accuracy was increased more by including these problematic characters thanexcluding them. In other words, the benefits of increasing the number of charactersoutweighed the potential costs of including so-called problematic characters.Remarkably, SEA failed to mention any of these results, although they are discussedextensively in the paper by Poe and Wiens (2000) which they quote.
Wiens Page: 8
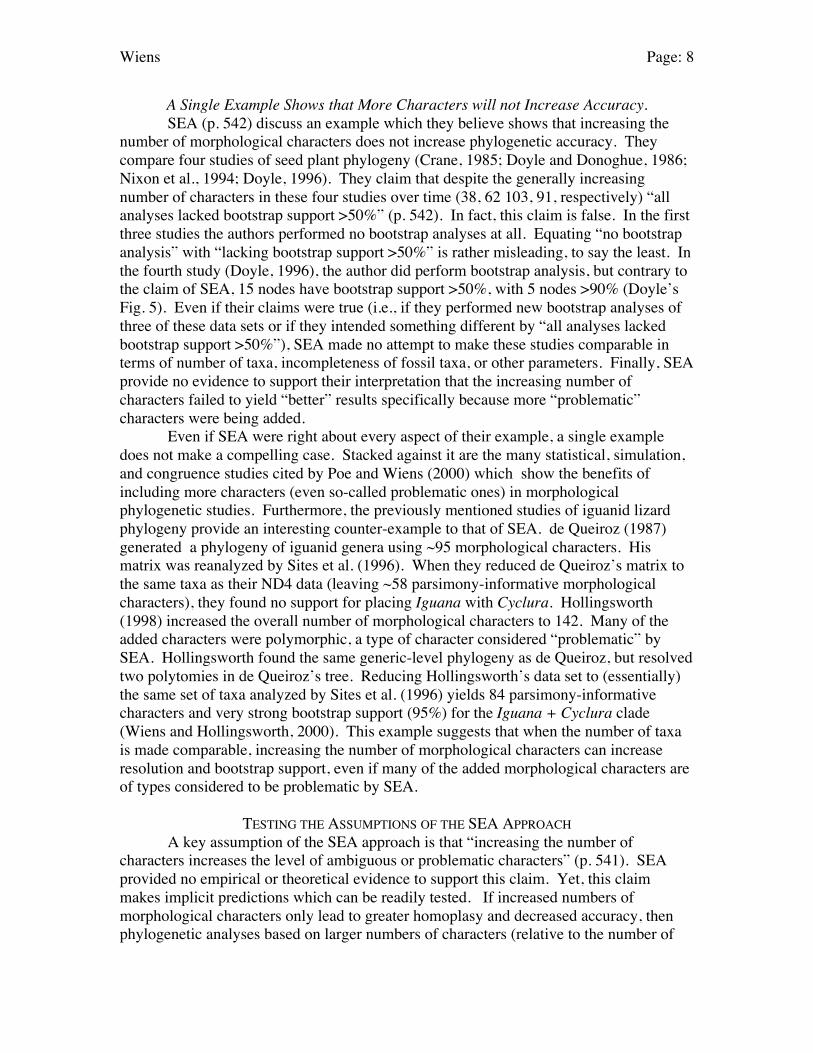
A Single Example Shows that More Characters will not Increase Accuracy.SEA (p. 542) discuss an example which they believe shows that increasing the
number of morphological characters does not increase phylogenetic accuracy. Theycompare four studies of seed plant phylogeny (Crane, 1985; Doyle and Donoghue, 1986;Nixon et al., 1994; Doyle, 1996). They claim that despite the generally increasingnumber of characters in these four studies over time (38, 62 103, 91, respectively) “allanalyses lacked bootstrap support >50%” (p. 542). In fact, this claim is false. In the firstthree studies the authors performed no bootstrap analyses at all. Equating “no bootstrapanalysis” with “lacking bootstrap support >50%” is rather misleading, to say the least. Inthe fourth study (Doyle, 1996), the author did perform bootstrap analysis, but contrary tothe claim of SEA, 15 nodes have bootstrap support >50%, with 5 nodes >90% (Doyle’sFig. 5). Even if their claims were true (i.e., if they performed new bootstrap analyses ofthree of these data sets or if they intended something different by “all analyses lackedbootstrap support >50%”), SEA made no attempt to make these studies comparable interms of number of taxa, incompleteness of fossil taxa, or other parameters. Finally, SEAprovide no evidence to support their interpretation that the increasing number ofcharacters failed to yield “better” results specifically because more “problematic”characters were being added.
Even if SEA were right about every aspect of their example, a single exampledoes not make a compelling case. Stacked against it are the many statistical, simulation,and congruence studies cited by Poe and Wiens (2000) which show the benefits ofincluding more characters (even so-called problematic ones) in morphologicalphylogenetic studies. Furthermore, the previously mentioned studies of iguanid lizardphylogeny provide an interesting counter-example to that of SEA. de Queiroz (1987)generated a phylogeny of iguanid genera using ~95 morphological characters. Hismatrix was reanalyzed by Sites et al. (1996). When they reduced de Queiroz’s matrix tothe same taxa as their ND4 data (leaving ~58 parsimony-informative morphologicalcharacters), they found no support for placing Iguana with Cyclura. Hollingsworth(1998) increased the overall number of morphological characters to 142. Many of theadded characters were polymorphic, a type of character considered “problematic” bySEA. Hollingsworth found the same generic-level phylogeny as de Queiroz, but resolvedtwo polytomies in de Queiroz’s tree. Reducing Hollingsworth’s data set to (essentially)the same set of taxa analyzed by Sites et al. (1996) yields 84 parsimony-informativecharacters and very strong bootstrap support (95%) for the Iguana + Cyclura clade(Wiens and Hollingsworth, 2000). This example suggests that when the number of taxais made comparable, increasing the number of morphological characters can increaseresolution and bootstrap support, even if many of the added morphological characters areof types considered to be problematic by SEA.
TESTING THE ASSUMPTIONS OF THE SEA APPROACHA key assumption of the SEA approach is that “increasing the number of
characters increases the level of ambiguous or problematic characters” (p. 541). SEAprovided no empirical or theoretical evidence to support this claim. Yet, this claimmakes implicit predictions which can be readily tested. If increased numbers ofmorphological characters only lead to greater homoplasy and decreased accuracy, thenphylogenetic analyses based on larger numbers of characters (relative to the number of

Wiens Page: 9
taxa) should presumably show higher levels of homoplasy, lower levels of resolution, andlower levels of support (e.g., bootstrapping) than studies of morphologically similarorganisms based on fewer characters.
Even a crude analysis shows that none of these predictions are supported.Sanderson and Donoghue (1996) summarized levels of homoplasy, resolution, andbootstrap support for 50 morphological data sets for green plants (i.e., organisms withcomparable morphology), along with the number of taxa and characters for each data set.I performed simple regression analyses of the relationship between the character/taxonratio and levels of homoplasy (retention index), resolution (proportion of resolved nodesin a strict consensus of the shortest trees from a parsimony analysis), and branch support(proportion of clades with bootstrap support >50%) for each data set (see Sanderson andDonoghue [1996] for details of how these measures were obtained). Given that“increasing the number of characters” presumably means that the number of taxa is heldconstant, I used the character/taxon ration instead of the number of characters alone (andfollowing SEA p. 540). One data set was a clear outlier in terms of the character /taxonratio and was removed. The results (Fig. 1) do not support the claims of SEA. There isno significant relationship between the number of characters and levels of homoplasy, butthere is a significant positive relationship between the relative number of characters andlevels of resolution and bootstrap support. In many ways, these results are hardlysurprising, and there are many problematic aspects to the analyses (e.g., studies ofdifferent groups are not directly comparable, autapomorphies were not removed,resolution and bootstrap support are related to accuracy but not strictly equivalent).However, the assumptions of SEA clearly are not supported, and they have provided nosimilar test or supporting data themselves.
A more fundamental assumption that is implicit in the SEA paper is the idea thatmorphological data are much more homoplasious than molecular data. If morphologicaldata were found to have lesser or similar levels of homoplasy to DNA sequence data,then their claims for greater problems of homology assessment in morphological datawould be refuted, or at least rendered irrelevant. This issue has been addressed inempirical surveys of independent phylogenetic analyses of molecular and morphologicaldata (e.g., Sanderson and Donoghue, 1989; 1996; Givnish and Sytsma, 1997). The mostrecent studies show that morphological data may be (on average) slightly lesshomoplasious than DNA sequence data (Sanderson and Donoghue, 1996; based on theretention index in their Table 2) or slightly more (Givnish and Sytsma, 1997; based onthe consistency index, their Fig. 2). Obviously, these studies do not support theassumption that morphological data show much greater levels of homoplasy than DNAsequence data. Yet, these studies provide a somewhat indirect comparison because levelsof homoplasy in different characters in different groups of organisms are typically beingcompared.
The strongest evidence that one type of data is more homoplasious than the otherwould come from comparing levels of homoplasy in morphological and molecular datasets obtained for the same taxa. Baker et al. (1998) found that the consistency index ofthe morphological data was higher than that of the molecular data in 26 of 31 studies withmatched molecular/morphological taxon sampling, indicating lower levels homoplasy inthe morphological data. A paired sign test shows that this difference is highly significant(P = 0.0002). Thus, the empirical results that are most directly relevant to this issue
Wiens Page: 10
strongly reject the fundamental assumption of the SEA approach (that morphological dataare more homoplasious than molecular data), and show that the opposite pattern isactually more common.
INTEGRATING MOLECULAR AND MORPHOLOGICAL DATASEA suggest that the best approach for integrating molecular and morphological
data is to map a limited number of “unambiguous” morphological characters onto themolecular phylogeny. Yet it is unclear what this approach really tells us about theveracity of the molecular or morphological results. The typical outcome of this exerciseseems easy to predict; some morphological characters will be concordant with themolecular tree and some will not (e.g., Fig. 2 of SEA). This is what we might also expectfrom mapping morphological characters onto a morphological tree, or molecularcharacters onto a molecular tree (i.e., some characters will be homoplastic, some willnot). Without a relevant null hypothesis and an associated statistical test, their charactermapping approach seems pointless.
A better approach to integrating molecular and morphological data may be to: (1)perform separate analyses to identify areas of strongly supported incongruence betweendata sets (i.e., areas where combined analysis might be expected to fail; de Queiroz et al.,1995; Huelsenbeck et al., 1996), (2) perform a combined analysis, and (3) considerregions of the tree that are strongly contested by different data sets to be ambiguouslyresolved until the source of error is identified, or (if the source is unknown) a majority ofindependent data sets clearly supports one hypothesis over another. This approach maybe advantageous relative to unilateral separate or combined analysis, or even relative tothose that focus on testing for overall congruence between data sets to decide whetherthey are generally “combinable” or not (e.g., Bull et al., 1993; Farris et al., 1994). Thereason is simple. For any phylogenetic problem with more than four taxa, trees fromdifferent data sets may contain a mixture of concordant, weakly discordant, and stronglydiscordant clades. Thus, combined analysis and separate analysis may each be favored indifferent parts of the same tree, almost guaranteeing that both approaches will besuboptimal in some part of the tree if applied globally to a complex phylogeny (Wiens,1998d). The approach outlined above (see Wiens and Reeder, 1997; Wiens, 1998d)utilizes the results from combined analysis in those parts of the tree where combinedanalysis should succeed (i.e., no or weakly supported incongruence) and should treat thecombined-data results as ambiguous in those sections of the tree where combinedanalysis might be expected to fail (i.e., strongly supported incongruence).
SEA state that they consider combined analysis as “another possible solution” (p.545). However, none of the approaches that they advocate allows for trees to bereconstructed from the morphological data alone. Thus, there is no opportunity formorphological data to help identify potential problems in the molecular results or toprovide real corroboration for molecular phylogenies in the form of a rigorousindependent phylogenetic analysis.
IMPROVING MORPHOLOGICAL PHYLOGENETICSThe main premise underlying the SEA paper is that morphological phylogenetics
is so problematic that trees should no longer be reconstructed using morphological data.Although I would readily agree that there are serious problems in the current practice of
Wiens Page: 11
morphological phylogenetics, we are not as helpless in the face of these problems assuggested by SEA. For example, many of the ambiguities in character analysis that theylament (p. 541) may be solved by simply treating morphological characters as continuousquantitative traits (Felsenstein, 1988; Wiens, 2001). Furthermore, several approaches canbe used to address the accuracy of different methods for selecting, coding and analyzingmorphological characters, including simulations and congruence studies (i.e., comparinghow well different methods of analyzing morphological data recover clades that arestrongly supported by independent, non-morphological data sets; Wiens 1998a). My ownwork on methods for coding polymorphic morphological characters suggests that thesedifferent approaches for testing phylogenetic accuracy can give highly concordant results(Wiens, 1999, 2000a). I think that the 21st century should be an exciting time formorphological phylogenetics as well as molecular phylogenetics, as new methods forcollecting and analyzing morphological data are developed (e.g., high-resolutioncomputed tomography scanning; Rowe et al., 1997; new likelihood/Bayesian methods formorphological data; Lewis, 2001) and the performance of morphology-based methodscan be more readily tested using a wealth of new molecular data. In contrast, SEAbasically advocate giving up on using morphological data to reconstruct phylogenies.
CONCLUSIONSThe wealth of new molecular data raises the question: what should be the role of
morphological data in phylogeny reconstruction? SEA have suggested thatmorphological data should not be used to build trees and new morphological data shouldnot be collected. I have argued that their approach is built on a series of mistakenpremises, and is bound to fail. Most importantly, their approach ignores fossil taxa, andthey do not consider the importance of morphology in comprehensive sampling of livingtaxa, in alpha taxonomy, and in identifying problematic molecular results. Althoughthere are many areas where morphological phylogenetics can be improved, the bestsolution to these problems is not to simply give up on using morphology to build trees.Instead, many of these problems may be solved through more explicit methodology,development and application of new methods, and rigorous testing of these methodsusing simulations and congruence studies.
ACKNOWLEDGMENTSFor many helpful comments on the manuscript, I thank Tim Collins, Alan de Queiroz,Michael Donoghue, Tag Engstrom, R. Geeta, Lucinda McDade, Steve Poe, Chris Simon,Patrick Stephens, Dan Stoebel, and Chris Wolfe. My research was supported by NSFgrant DEB-0129142.
REFERENCESBAKER, R. H., X. YU, AND R. DESALLE. 1998. Assessing the relative contribution of
molecular and morphological characters in simultaneous analysis trees. Mol.Phylogenet. Evol. 9:427–436.
BAUM, D. A., AND M. J. DONOGHUE. 1995. Choosing among alternative "phylogenetic"species concepts. Syst. Bot. 20:560–573.
BRUSCA, R. C., AND G. J. BRUSCA. 1990. Invertebrates. Sinauer Associates, Inc.,Sunderland, Massachusetts.

Wiens Page: 12
CRACRAFT, J. 1988. The major clades of birds. Pages 333–355 in The phylogeny andclassification of the tetrapods. (M. J. Benton, ed.). Systematics Assoc. SpecialVol. No. 35A, Clarendon Press, Oxford, United Kingdom.
CRANE, P. R. 1985. Phylogenetic analysis of seed plants and the origin of angiosperms.Ann. Mo. Bot. Gard. 72: 716–793.
DE QUEIROZ, A., M. J. DONOGHUE, AND J. KIM. 1995. Separate versus combinedanalysis of phylogenetic evidence. Annu. Rev. Ecol. Syst. 26:657–681.
DE QUEIROZ, K. 1987. Phylogenetic systematics of iguanine lizards. A comparativeosteological study. Univ. Calif. Publ. Zool. 118:1–203.
DONOGHUE, M. J., AND W. S. ALVERSON. 2000. A new age of discovery. Ann. MissouriBot. Gard. 87: 110-126.
DOYLE, J. A. 1996. Seed plant phylogeny and the relationships of Gnetales. Int. J. PlantSci. 157 (suppl.):S3–S39.
DOYLE, J. A., AND M. J. DONOGHUE. 1986. Seed plant phylogeny and the origin ofangiosperms: an experimental cladistic approach. Bot. Rev. 52:321–431.
DOYLE, J. J. 1992. Gene trees and species trees: Molecular systematics as one-charactertaxonomy. Syst. Bot. 17:144–163.
DUELLMAN, W. E., AND L. TRUEB. 1986. Biology of amphibians. Johns HopkinsUniversity Press, Baltimore.
ESTES, R., K. DE QUEIROZ, AND J. A. GAUTHIER. 1988. Phylogenetic relationshipswithin Squamata. Pages 119–281 in Phylogenetic relationships of the lizardfamilies (R. Estes and G. K. Pregill, eds.) Stanford University Press, Stanford,California,
FELSENSTEIN, J. 1978. Cases in which parsimony or compatibility methods will bepositively misleading. Syst. Zool. 27:401–410.
FELSENSTEIN, J. 1988. Phylogenies and quantitative characters. Ann. Rev. Ecol. Syst.19:445–471.
GAFFNEY, E. S., AND P. A. MEYLAN. 1988. A phylogeny of turtles. Pages 157-219 inThe phylogeny and classification of the tetrapods, Vol.1 (M.J. Benton, ed.).Clarendon Press, Oxford.
GATESY, S. M., AND K. P. DIAL. 1996. Locomotor modules and the evolution of avianflight. Evolution 50:331-340.
GAUTHIER, J., A. G. KLUGE, AND T. ROWE. 1988. Amniote phylogeny and theimportance of fossils. Cladistics 4: 105-209.
GIVNISH, T. J., AND K. J. SYTSMA. 1997. Homoplasy in molecular and morphologicaldata: The likelihood of correct phylogenetic inference. Pages 55–101 inMolecular evolution and adaptive radiation (T. J. Givnish and K. J. Sytsma, eds.).Cambridge Univ. Press, New York.
HILLIS, D. M. AND J. J. WIENS. 2000. Molecules versus morphology in systematics:Conflicts, artifacts, and misconceptions. Pages 1–19 in Phylogenetic analysisof morphological data (J. J. Wiens, ed.). Smithsonian Institution Press,Washington, D.C.
HOLLINGSWORTH, B. D. 1998. The systematics of chuckwallas (Sauromalus) with aphylogenetic analysis of other iguanid lizards. Herpetol. Monogr. 12:38–191.
HUELSENBECK, J. P. 1991. When are fossils better than extant taxa in phylogeneticanalysis? Syst. Zool. 40:458–469.
Wiens Page: 13
HUELSENBECK, J. P. 1997. Is the Felsenstein Zone a fly trap? Syst. Biol. 46:69–74.HUELSENBECK, J. P., J. J. BULL, AND C. W. CUNNINGHAM. 1996. Combining data in
phylogenetic analysis. Trends Ecol. Evol. 11:152–158.JENNER, R. A. 2004. Accepting partnership by submission? Morphological
phylogenetics in a molecular millennium. Syst. Biol. 53: (in press).KRISTENSEN, N. P. 1981. Phylogeny of insect orders. Annu. Rev. Entomol.
26:135–157.KRISTENSEN, N. P. 1991. Phylogeny of extant hexapods. Pages 125–140 in The insects
of Australia. Cornell University Press.LAUDER, G. V., AND K. F. LIEM. 1983. The evolution and interrelationships of
actinopterygian fishes. Bull. Mus. Comp. Zool. 150:95–197.LEWIS, P. O. 2001. A likelihood approach to inferring phylogeny from discrete
morphological characters. Syst. Biol. 50:913–925.MADDISON, W. P. 1996. Molecular approaches and the growth of phylogenetic biology.
Pages 47–63 in Molecular zoology: Advances, strategies, and protocols (J. D.Ferraris and S. R. Palumbi, eds.), Wiley-Liss, New York.
MADDISON, W. P. 1997. Gene trees in species trees. Syst. Biol. 46:523–536.MAY, R. M. 2000. The dimensions of life on earth. Pages 30–45 in Nature and human
society: the quest for a sustainable world (P. R. Raven and T. Williams, eds.).National Academy of Sciences Press, Washington, D.C.
MEYER, A. 1994. Shortcomings of the cytochrome b gene as a molecular marker.Trends Ecol. Evol. 9:278–280.
MEYER, A., AND R. ZARDOYA. 2003. Recent advances in the (molecular) phylogeny ofvertebrates. Annu. Rev. Ecol. Evol. Syst. 34:311–338.
MISHLER, B. D., AND S. P. CHURCHILL. 1985. Transition to a land flora: phylogeneticrelationships of the green algae and bryophytes. Cladistics 1:305-28.
NIXON, K. C., W. L. CREPET, D. STEVENSON, AND E. M. FRIIS. 1994. A re-evaluation ofseed plant phylogeny. Ann. Mo. Bot. Gard. 81:484–533.
NOVACEK, M. J. 1986. The skull of lepticid insectivorans and the higher-levelclassification of eutherian mammals. Bull. Am. Mus. Nat. Hist. 183:1–112.
NOVACEK, M. J., AND Q. D. WHEELER. 1992. Extinct taxa –accounting for 99.9990...%of the earth's biota. Pages 1–16 in Extinction and phylogeny (M. J. Novacek andQ. D. Wheeler, eds.), Columbia University Press, New York.
PETREN, K., AND T. J. CASE. 1997. A phylogenetic analysis of body size evolution andbiogeography in chuckwallas (Sauromalus) and other iguanines. Evolution51:206–219.
POE, S., AND J. J. WIENS. 2000. Character selection and the methodology ofmorphological phylogenetics. Pages 20–36 in Phylogenetic analysis ofmorphological data. (J. J. Wiens, ed.). Smithsonian Institution Press,Washington, D.C.
RASSMANN, K. 1997. Evolutionary age of the Galápagos iguanas predates the age of thepresent Galápagos islands. Mol. Phylogenet. Evol. 7:158–172.
REEDER, T. W., AND J. J. WIENS. 1996. Evolution of the lizard family Phrynosomatidaeas inferred from diverse types of data. Herpetol. Mon. 10:43–84.
Wiens Page: 14
ROKAS, A., B. L. WILLIAMS, N. KING, AND S. B. CARROLL. 2003. Genome-scaleapproaches to resolving incongruence in molecular phylogenies. Nature 425:798-804.
ROWE, T., J. KAPPELMAN, W. D. CARLSON, R. A. KETCHAM, AND C. DENISON. 1997.High-resolution computed tomography: a breakthrough technology for Earthscientists. Geotimes 42:23–27.
SANDERSON, M. J. 1997. A nonparametric approach to estimating divergence times inthe absence of rate constancy. Mol. Biol. Evol. 14:1218–1231.
SANDERSON, M. J. 2002. Estimating absolute rates of molecular evolution anddivergence times: A penalized likelihood approach. Mol. Biol. Evol. 19:101–109.
SANDERSON, M. J.. AND M. J. DONOGHUE. 1989. Patterns of variation in levels ofhomoplasy. Evolution 43:1781–1795.
SANDERSON, M. J.. AND M. J. DONOGHUE. 1996. The relationship between homoplasyand confidence in a phylogenetic tree. Pages 67–89 in Homoplasy. Therecurrence of similarity in evolution (M. J. Sanderson and L. Hufford, eds.),Academic Press, San Diego, California.
SHULTZ, J. W. 1990. Evolutionary morphology and phylogeny of Arachnida. Cladistics6:1–38.
SCOTLAND, R. W., R. G. OLMSTEAD, AND J. R. BENNETT. 2003. Phylogenyreconstruction: the role of morphology. Syst. Biol. 52:539–548.
SITES, J. W., JR., S. K. DAVIS, T. GUERRA, J. B. IVERSON, AND H. L. SNELL. 1996.Character congruence and phylogenetic signal in molecular and morphologicaldata sets: A case study in the living iguanas (Squamata: Iguanidae). Mol. Biol.Evol. 13:1087–1105.
STEPHENS, P. R., AND J. J. WIENS. 2003. Ecological diversification and phylogeny ofemydid turtles. Biol. J. Linn. Soc. 79:577–610.
THIELE, K. 1993. The holy grail of the perfect character: the cladistic treatment ofmorphometric data. Cladistics 9:275–304.
THORNE, J. L., AND H. KISHINO. 2002. Divergence time and evolutionary rate estimationwith multilocus data. Syst. Biol. 51:689–702.
TRUEB, L., AND R. CLOUTIER. 1991. A phylogenetic investigation of the inter- andintrarelationships of the Lissamphibia (Amphibia: Temnospondyli). Pages223–313 in Origins of the higher groups of tetrapods-Controversy and consensus(H.-P. Schultze and L. Trueb, eds.). Comstock Publishing Associates, Ithaca,New York.
WIENS, J. J. 1993a. Phylogenetic systematics of the tree lizards (genus Urosaurus).Herpetologica 49:399–420.
WIENS, J. J. 1993b. Phylogenetic relationships of phrynosomatid lizards and monophylyof the Sceloporus group. Copeia 1993:287–299.
WIENS, J. J. 1995. Polymorphic characters in phylogenetic systematics. Syst. Biol.44:482–500.
WIENS, J. J. 1998a. Testing phylogenetic methods with tree-congruence: Phylogeneticanalysis of polymorphic morphological characters in phrynosomatid lizards. Syst.Biol. 47:427–444.
WIENS, J. J. 1998b. The accuracy of methods for coding and sampling higher-level taxafor phylogenetic analysis: A simulation study. Syst. Biol. 47:381–397.
Wiens Page: 15
WIENS, J. J. 1998c. Does adding characters with missing data increase or decreasephylogenetic accuracy? Syst. Biol. 47:625–640.
WIENS, J. J. 1998d. Combining data sets with different phylogenetic histories. Syst.Biol. 47:568–581.
WIENS, J. J. 2000a. Preface. Pages ix–x in Phylogenetic analysis of morphological data(J. J. Wiens, ed.). Smithsonian Institution Press, Washington, D.C.
WIENS, J. J. 2000b. Coding morphological variation for phylogenetic analysis:polymorphism and interspecific variation in higher taxa. Pages 115–145 inPhylogenetic analysis of morphological data (J. J. Wiens, ed.). SmithsonianInstitution Press, Washington, D.C.
WIENS, J. J. 2001. Character analysis in morphological phylogenetics: Problems andsolutions. Syst. Biol. 50:688–699.
WIENS, J. J. 2003a. Incomplete taxa, incomplete characters, and phylogenetic accuracy:What is the missing data problem? J. Vert. Paleontol. 23:297–310.
WIENS, J. J. 2003b. Missing data, incomplete taxa, and phylogenetic accuracy. Syst.Biol. 52:528–538.
WIENS, J. J., AND R. E. ETHERIDGE. 2003. Phylogenetic relationships of hoplocercidlizards: coding and combining meristic, morphometric, and polymorphic datausing step matrices. Herpetologica 59:375–398
WIENS, J. J., AND B. D. HOLLINGSWORTH. 2000. War of the iguanas: conflictingmolecular and morphological phylogenies and long-branch attraction in iguanidlizards. Syst. Biol. 49:143–159.
WIENS, J. J., AND T. L. PENKROT. 2002. Delimiting species based on DNA andmorphological variation and discordant species limits in spiny lizards(Sceloporus). Syst. Biol. 51:69–91.
WIENS, J. J., AND T. W. REEDER. 1997. Phylogeny of the spiny lizards (Sceloporus)based on molecular and morphological evidence. Herpetol. Mon. 11:1–101.
WIENS, J. J., AND M. R. SERVEDIO. 1997. Accuracy of phylogenetic analysis includingand excluding polymorphic characters. Syst. Biol. 46:332–345.
WIENS, J. J., AND M. R. SERVEDIO. 1998. Phylogenetic analysis and intraspecificvariation: Performance of parsimony, likelihood, and distance methods. Syst.Biol. 47:228–253.
WIENS, J. J., P. T. CHIPPINDALE, AND D. M. HILLIS. 2003. When are phylogeneticanalyses misled by convergence? A case study in Texas cave salamanders. Syst.Biol. 52:501–514.
WILEY, E. O. 1981. Phylogenetics. The theory and practice of phylogeneticsystematics. John Wiley and Sons, New York.
WILSON, E. O. 1992. The diversity of life. Harvard University Press, Cambridge,Massachusetts.
YODER, A. D., AND Z. YANG. 2000. Estimation of primate speciation dates using localmolecular clocks. Mol. Biol. Evol. 17:1081–1090.

Wiens Page: 16
FIGURE LEGENDS
FIGURE 1. Relationships between levels of character sampling (number ofcharacters/taxa) and (a) homoplasy (increasing values of the retention index indicatelower levels of homoplasy), (b) bootstrap support (proportion of clades with bootstrapvalues >50%), and (c) resolution (proportion of clades resolved in a strict consensus ofthe shortest trees), based on analyses of 49 morphological data sets for green plants (fromdata summarized in Sanderson and Donoghue, 1996).

Wiens Page: 17