wide-scale predator control for biodiversity conservation ... · 25 live trapping when required....
TRANSCRIPT

1
Wide-scale predator control for biodiversity conservation: a case study from 1
Hawke’s Bay, New Zealand 2
3
A. S. Glen1*, M. Perry2, I. Yockney2, S. Cave2, A. M. Gormley2, C. Leckie3, R. Dickson3, W. 4
Rakete-Stones3, P. Rakete-Stones3, G. L. Norbury4 and W. A. Ruscoe2,5 5
6
1 Landcare Research, Private Bag 92170, Auckland 1142, New Zealand 7
2 Landcare Research, PO Box 69040, Lincoln 7640, New Zealand 8
3 Hawke’s Bay Regional Council, 159 Dalton St, Napier 4110, New Zealand 9
4 Landcare Research, PO Box 282, Alexandra 9340 New Zealand 10
5 Institute for Applied Ecology, University of Canberra, ACT 2601, Australia 11
*Author for correspondence (Email: [email protected]) 12
13
Running head: Wide-scale predator control for biodiversity 14

2
Abstract 15
Invasive predators are controlled to protect native fauna in many parts of New Zealand. 16
However, this is usually localised within conservation reserves, wildlife sanctuaries or 17
remnants of native habitat; predators are rarely controlled across multi-tenure landscapes. We 18
controlled invasive predators by trapping over 6,000 ha of farmland adjacent to a conservation 19
reserve where intensive predator control had been in place for over a decade. The trapping 20
targeted feral cats (Felis catus) and mustelids (Mustela spp.), but other invasive mammals 21
(particularly hedgehogs Erinaceus europaeus) were also captured. We aimed to promote 22
recovery of native fauna in a pastoral landscape with fragments of native bush. Since 2011, 23
low-cost predator control has been conducted using a network of kill traps, supplemented by 24
live trapping when required. Predator populations were monitored using large tracking tunnels, 25
which also detected native lizards. Invertebrates were monitored using artificial shelters (weta 26
houses). Site occupancy rates of cats and mustelids, as well as hedgehogs, were significantly 27
lower than those in an adjacent non-treatment area. Occupancy of invasive rats was higher in 28
the treatment area, while occupancy of mice showed no difference between treatments. There 29
was evidence of positive responses of some native biodiversity, with occupancy rates of native 30
lizards increasing significantly in the treatment area, but not in the non-treatment. Counts of 31
cockroaches were higher in the treatment area, but other invertebrates were detected in similar 32
numbers in both areas. Our results show that low-cost predator control in a pastoral landscape 33
can reduce invasive predator populations, with apparent benefits for some native fauna. 34
35
Keywords: Feral cat; invasive predators; invertebrates; landscape-scale; lizards; mustelids; 36
rodents 37
38

3
Introduction 39
Invasive predators are controlled to protect native fauna in many parts of New Zealand (e.g. 40
Innes et al. 1999; Reardon et al. 2012; Russell et al. 2015). However, this is usually localised 41
within conservation reserves, wildlife sanctuaries or remnants of native habitat; predators are 42
rarely controlled at a landscape scale. Controlling species in the landscape between 43
conservation reserves can restore functional connectivity, with benefits for a range of native 44
species and ecological processes (Glen et al. 2013). 45
46
Although landscape-scale predator control is desirable, financial and logistical challenges often 47
prevent it. Tools and techniques used to control predators at localised scales (e.g. exclusion 48
fencing (Innes et al. 2012; Hayward et al. 2014)) may be prohibitively expensive at the 49
landscape scale (Norbury et al. 2014). Managing wildlife across different land tenures can also 50
be challenging, both logistically and socially (Epanchin-Niell et al. 2009; Glen et al. 51
submitted). Practical and affordable methods are therefore needed to reduce the impacts of 52
invasive predators across large, multi-tenure landscapes. 53
54
We controlled invasive predators over 6,000 ha of farmland adjacent to a conservation reserve 55
where intensive predator control had been in place for over a decade. The primary targets of 56
the trapping were feral cats (Felis catus) and mustelids (Mustela spp.); however, large numbers 57
of other invasive mammals, particularly hedgehogs (Erinaceus europaeus), were also captured. 58
By removing invasive predators we aimed to promote recovery of native fauna in a pastoral 59
landscape with fragments of native bush. Here we describe the results (changes in predator 60
populations) and outcomes (trends in native biodiversity) of this landscape-scale intervention. 61
62

4
Methods 63
Study area 64
Our study took place on four adjacent pastoral properties in Hawke’s Bay, North Island, New 65
Zealand: Opouahi, Rangiora, Toronui and Rimu stations (39⁰ 10’ S; 176⁰ 46’ E). These sheep 66
and cattle stations are vegetated mainly by introduced pasture grass with fragments of native 67
beech forest (Nothofagus solandri). Fragments range in size from about 10 to 100 ha. Adjoining 68
the study area to the north is Boundary Stream Reserve, which is managed by the Department 69
of Conservation (DOC). Elevation in the study area ranges from about 300 to 1000 m, and 70
climate varies accordingly from coastal to montane. Invasive predators have been controlled 71
over 800 ha in Boundary Stream since 1996 as part of DOC’s Mainland Island programme 72
(Saunders & Norton 2001; Abbott et al. 2013). There was no recent history of predator control 73
on the adjacent pastoral properties. Predator control was applied on Opouahi and Rangiora 74
stations, as well as three adjacent farms on which we did not monitor. Toronui and Rimu 75
stations served as a non-treatment area for comparison (Fig. 1). 76
77
[Figure 1 hereabouts] 78
79
Predator control 80
Invasive predator control was conducted by Hawke’s Bay Regional Council (HBRC). In 81
November 2011, 680 kill traps were deployed across an area of 6,000 ha and left in place year-82
round. These included 550 DOC-250 traps (Department of Conservation, Wellington) for 83
mustelids, and 130 Timms traps (KBL Rotational Moulders, Palmerston North) for cats. Traps 84
were spaced 100 m apart in bush fragments or 200 m apart on cleared farmland, and baited 85
with various combinations of fresh rabbit meat, a rabbit-based paste (Erayz®, Connovation Ltd, 86
Auckland) or a synthetic, rat-scented lure (Goodnature Ltd, Wellington). To minimise labour 87

5
costs, traps were set in locations that were easily accessible by an all-terrain vehicle (ATV). 88
Traps were checked every three weeks until November 2014, and thereafter four times a year 89
(January, April, June and November). 90
91
Kill trapping was supplemented in May and August each year with pulses of cat control using 92
a combination of live traps (cage (Havahart Traps, Lititz, Pennsylvania), leg-hold (Victor #11/2 93
soft-catch, Oneida Victor, Cleveland, Ohio)), and other kill traps (Timms and Possum Master 94
traps (Possum Master Industries, Tauranga)), as well as opportunistic shooting. Live traps were 95
checked daily and captured predators were euthanased. This additional ‘specialist control’ 96
targeted areas of high rabbit (Oryctolagus cuniculus) activity as rabbit abundance is a strong 97
predictor of cat abundance (Norbury & McGlinchy 1996; Norbury et al. 2002; Cruz et al. 2013). 98
After the first year, the Timms traps were removed from the permanent trap network as the 99
specialist control proved more effective for cats. The DOC 250 traps remained in place 100
throughout the study. 101
102
Monitoring 103
In October 2011, we established 15 monitoring lines in the treatment area and 14 lines in the 104
non-treatment area. However, due to access restrictions, the number of monitoring lines in the 105
non-treatment area was reduced to 12 from Spring 2014 onwards. Each line consisted of five 106
tracking tunnels (see below) spaced 100 m apart, spanning the interface between a native bush 107
fragment and the adjacent pasture. The first point was inside the bush fragment, 200 m from 108
the edge, the third point was on the edge of the fragment, and the fifth point was in cleared 109
pasture, 200 m outside the fragment. Where possible, monitoring lines were at least 1 km apart 110
to maximise spatial independence; however, steep topography made this impracticable in some 111
cases. The shortest distance between any two monitoring lines was 500 m. 112

6
113
We monitored mammalian predators using large tracking tunnels (20 x 20 x 100 cm) with a 114
removable floor, as described by Pickerell et al. (2014). Tracking ink (Black Track, Pest 115
Management Services, Wellington) was applied to the floor in the middle of each tunnel, and 116
sheets of tracking paper (18 x 30 cm) were fastened to the tunnel floor at each end with bulldog 117
clips and drawing pins. Each tunnel was baited with a cube of fresh rabbit meat in the middle 118
of the tracking ink. Tracking papers were retrieved after three days and labelled with tunnel 119
number and date; tunnels were left in place year-round. Footprints left on the tracking papers 120
were identified using field guides (Agnew 2009; Gillies & Williams unpubl; 121
www.pestdetective.org.nz). Tracking tunnels also detected native skinks. 122
123
The first and third point on each monitoring line also had an artificial shelter (weta house) for 124
monitoring invertebrates. Weta houses were 10 cm x 50 cm, with six galleries, a clear Perspex 125
cover and a wooden door. These were attached to tree trunks at approximately chest height and 126
left in place year-round. By opening the wooden door we were able to count and identify 127
invertebrates through the Perspex cover. 128
129
Monitoring lines were checked twice per year (spring and summer) from 2011–2014, after 130
which we sampled only once per year (in summer). 131
132
Data analysis 133
We analysed the tracking tunnel data using an occupancy modelling approach (MacKenzie et 134
al. 2006). Within a monitoring line, each tracking tunnel was treated as an independent survey 135
so that each monitoring line yielded a detection history with five ‘occasions’ per season. For 136
example, if a species was detected in the first and last tunnel in a line, this yielded a detection 137

7
history of ‘10001’. We used a multi-season dynamic occupancy model to estimate site 138
occupancy separately for each species in each area and sampling season. Probabilities of 139
colonisation, extinction and initial occupancy were allowed to vary between treatment and non-140
treatment. Analyses were conducted using the ‘unmarked’ package in R (Fiske & Chandler 141
2011). Differences between treatments were inferred visually using 95% confidence intervals 142
('inference by eye'; Cumming 2009). 143
144
For invertebrates, we calculated the mean number per monitoring line of each taxon counted 145
in the weta houses in each sampling season. Values for each season were compared between 146
the treatment and non-treatment areas using paired t-tests. 147
148
Results 149
The kill traps captured cats, mustelids, hedgehogs, ship rats (Rattus rattus), rabbits and 150
possums (Trichosurus vulpecula). Specialist control removed a large number of additional cats, 151
as well as some ferrets (Table 1). 152
153
[Table 1 hereabouts] 154
155
The tracking tunnels detected a range of invasive mammals, including cats (n = 45 detections), 156
stoats (Mustela erminea; n = 8), ferrets (M. furo; n = 5), weasels (M. nivalis; n = 2), hedgehogs 157
(n = 218), rats (Rattus spp.; n = 142), mice (Mus musculus; n = 202) and possums (n = 47). 158
159
Because cats and mustelids (the primary targets of the predator control) were detected in low 160
numbers, data for these species were pooled. Site occupancy estimates for cats and mustelids 161
(Fig. 1a) and hedgehogs (Fig. 1b) were similar in both areas during the first sampling season, 162

8
before predator removal began. However, wide 95% confidence intervals indicate high 163
uncertainty in these initial estimates. After predator removal, site occupancy estimates for these 164
species remained low in the treatment area, but increased in the non-treatment area. Low 165
overlap in the 95% confidence intervals shows that these differences were statistically 166
significant. 167
168
Site occupancy of rats was initially higher in the treatment area, and remained so for the 169
duration of the study (Fig. 1c). Mice showed no difference in site occupancy between the two 170
treatments (Fig. 1d). Skinks (Fig. 1e) were not detected in either area before predator removal 171
began. However, skink site occupancy estimates increased rapidly in the treatment area, while 172
remaining near zero in the non-treatment area. Due to low numbers of detections, we did not 173
estimate site occupancy for possums. 174
175
[Figure 2 hereabouts] 176
177
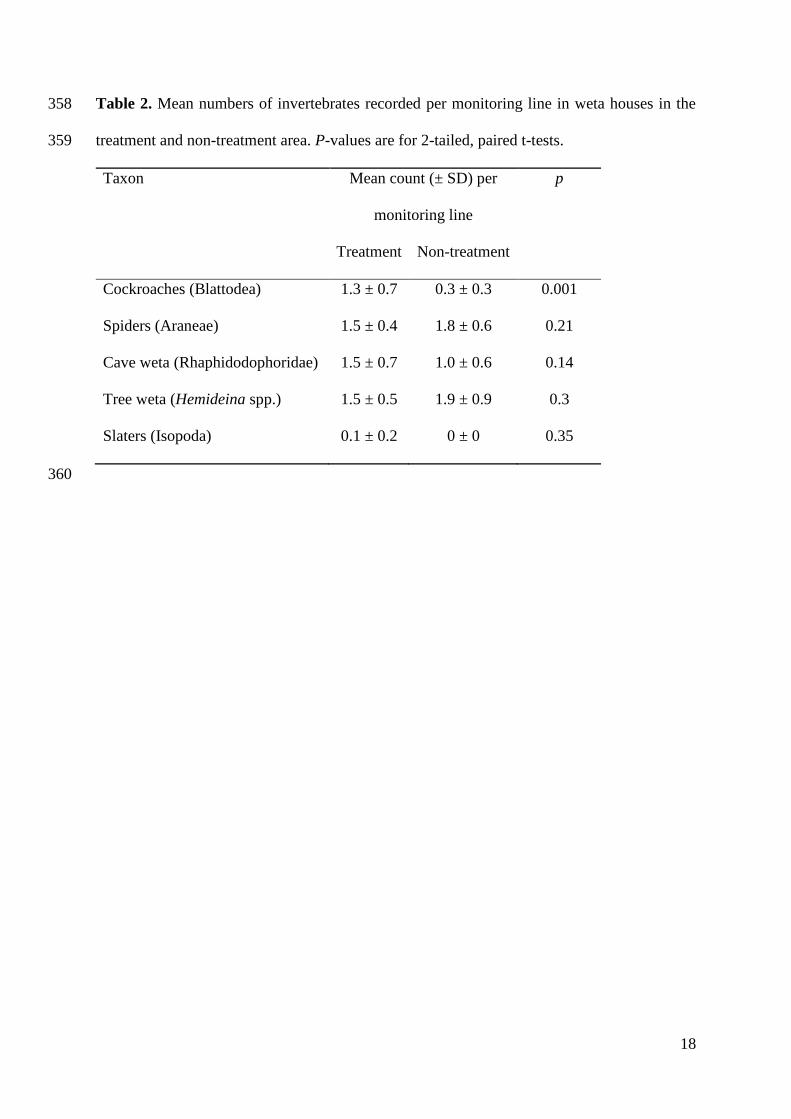
Taxa observed in weta houses included tree weta (Hemideina spp.), cave weta 178
(Rhaphidodophoridae), cockroaches (Blattodea), spiders (Araneae) and slaters (Isopoda). 179
During the pre-treatment period, no invertebrates had yet occupied the weta houses. During 180
subsequent seasons, counts of cockroaches were higher in the treatment area (p = 0.001). No 181
differences were observed between treatments for any other invertebrate taxon (Table 2). 182
183
[Table 2 hereabouts] 184
185

9
Discussion 186
Our results show that extensive trapping in a pastoral landscape was associated with lower site 187
occupancy of invasive predators, with apparent benefits for some native fauna. Detections of 188
feral cats, mustelids and hedgehogs were all lower than in the adjacent non-treatment area, 189
while detections of native skinks and cockroaches were higher. Invasive rats were more 190
frequently detected in the treatment area; however, this was true before predator control began. 191
While control of larger predators can lead to mesopredator release of rats (Ruscoe et al. 2011), 192
this does not appear to have been the case here. The difference in rat occupancy estimates 193
between the treatment and non-treatment areas remained consistent throughout the study. 194
195
While previous studies in New Zealand have also reported biodiversity responses to predator 196
control (e.g. Norbury 2001; Reardon et al. 2012), our case is unusual in that it covered a larger 197
area than most predator trapping programmes (but see Dilks et al. 2003; Whitehead et al. 2008), 198
and was focused on a predominantly pastoral landscape. The spatial coverage of our trapping 199
effort was made possible by placing traps in accessible locations where they could be checked 200
rapidly by staff on an ATV. This maximised the number of traps that could be checked in a 201
day, thereby increasing the area that could be trapped within the available budget. There may 202
be a trade-off between maximising the number of traps set and optimising capture probability 203
for each individual trap. Our approach may be effective when the management goal is to reduce 204
predator populations over a large area. For example, extensive predator control in areas of 205
mixed land-use may allow vulnerable native species to move between more intensively 206
managed patches of remnant habitat, increasing functional connectivity of the landscape (Glen 207
et al. 2013). More labour-intensive trapping methods may be preferable when the aim is to 208
reduce predators to zero or near-zero density. 209
210

10
Another likely factor contributing to the successful suppression of predators in our programme 211
was the use of a long-life lure. After comparing relative effectiveness of various lures (HBRC, 212
unpublished data) meat-based baits were withdrawn from use, and were replaced with the rat-213
scented oil lure, which maintains its attractiveness for weeks or months. This allowed traps to 214
be checked relatively infrequently while maintaining their attractiveness to predators. By 215
contrast, fresh rabbit meat loses attractiveness after about a week (Garvey et al. 2016; Garvey 216
et al. submitted). 217
218
Our network of kill traps also used mechanical signals that allowed the trapper to see whether 219
a trap had been triggered without dismounting the ATV. This allowed more traps to be checked 220
per day, reducing labour costs. Recent developments in wireless sensor networks (Jones et al. 221
2015) may further reduce costs of trapping by alerting managers when a trap is triggered. 222
223
Our study is also among the first to confirm the effectiveness of large tracking tunnels for 224
detecting cats and mustelids (see also Pickerell et al. 2014). However, tracking tunnels detected 225
low numbers of animals at both sites during the first sampling season. This may have been due 226
to neophobia as the tunnels had been in place for only a few days. Detection rates were much 227
higher after three months, suggesting that this was sufficient time for animals to become 228
habituated to the tracking tunnels. It is likely that predator occupancy was under-estimated in 229
the first sampling session; the apparent increase in predator occupancy in the non-treatment 230
area may be an artefact of this. We believe predator occupancy at both sites during the pre-231
treatment period was likely much higher than our estimates suggest, and probably declined in 232
the treatment area while remaining relatively stable in the non-treatment area. Future trials 233
should compare the efficacy of large tracking tunnels with other tools for detecting predators, 234
e.g. camera traps and wildlife detector dogs (Glen et al. 2014; 2016). Studies using large 235

11
tracking tunnels should include a longer period of repeated sampling in the pre-treatment period 236
to reduce the effect of neophobia and generate more reliable estimates of pre-treatment 237
occupancy or abundance. 238
239
Another limitation of the present study is lack of replication. Although predator site occupancy 240
was lower and native lizard detections increased in the treatment area, we cannot rule out the 241
possibility that these changes were unrelated to predator control. Spatial replication is a 242
cornerstone of experimental design (Underwood 1994), but is often unaffordable for large-243
scale adaptive management programmes such as ours. One solution would be to apply a 244
treatment reversal (e.g. Innes et al. 1999) in which the treatment and non-treatment areas are 245
switched. However, stopping predator control in our current treatment area would be contrary 246
to the aims of this conservation intervention. Another alternative may be to apply a ‘treatment 247
extension’ in which predator removal is applied to both areas. If similar results and outcomes 248
were observed in the former non-treatment area, this would increase confidence that the 249
observed changes were due to predator removal. 250
251
A secondary aim of our intervention was to decrease reinvasion by predators into the 252
neighbouring Boundary Stream Reserve. We lacked resources to monitor predator abundance 253
in the reserve. However, the potential benefits within Boundary Stream of predator control in 254
the surrounding landscape warrant further investigation. 255
256
Acknowledgements 257
Sincere thanks to R. Pech and M. Scroggie for advice on data analysis. We are grateful also to 258
D. Schaw (Toronui Station), C. Drysdale (Landcorp, Opouahi Station), G. & S. Maxwell 259
(Rangiora Station), and S. McNeil (Rimu Station) who allowed us access to their properties for 260

12
pest control and monitoring. We also thank the Department of Conservation – in particular M. 261
Melville, P. Abbott and D. Carlton – for providing accommodation in the field. D. Anderson 262
provided helpful comments on an earlier draft. 263
264
References 265
Abbott P, Melville M, Lee A, Lusk M 2013. Boundary Stream Mainland Island Annual Report 266
2012-2013. Wellington, Department of Conservation. 267
Agnew W 2009. What made these tracks? A guide to assist in interpreting the tracks of small 268
mammals, lizards and insects. Warkworth, Chappell Printing Ltd. 269
Cruz J, Glen AS, Pech RP 2013. Modelling landscape-level numerical responses of predators 270
to prey: the case of cats and rabbits. PLoS ONE 8: e73544. 271
Cumming G 2009. Inference by eye: Reading the overlap of independent confidence intervals. 272
Statistics in Medicine 28: 205-220. 273
Dilks P, Willans M, Pryde M, Fraser I 2003. Large scale stoat control to protect mohua 274
(Mohoua ochrocephala) and kaka (Nestor meridionalis) in the Eglinton Valley, 275
Fiordland, New Zealand. New Zealand Journal of Ecology 27: 1-9. 276
Epanchin-Niell RS, Hufford MB, Aslan CE, Sexton JP, Port JD, Waring TM 2009. Controlling 277
invasive species in complex social landscapes. Frontiers in Ecology and the 278
Environment 8: 210-216. 279
Fiske I, Chandler R 2011. unmarked: An R package for fitting hierarchical models of wildlife 280
occurrence and abundance. Journal of Statistical Software 43: 1-23. 281
Garvey P, Clout M, Pech R, Glen A 2016. A novel lure exploiting the scent signals of 282
competing predators. New Lure, deterrent and bait technologies – Science to 283
development, formulation and market, p 13. Wellington, Victoria University. 284

13
Garvey PM, Glen AS, Clout MN, Wyse SV, Nichols M, Pech RP submitted. Exploiting 285
interspecific olfactory communication to monitor predators. Ecological Applications. 286
Gillies C, Williams D unpubl. A short guide for identifying footprints on tracking tunnel 287
papers. 288
Glen AS, Anderson D, Veltman CJ, Garvey PM, Nichols M 2016. Wildlife detector dogs and 289
camera traps: a comparison of techniques for detecting feral cats. New Zealand Journal 290
of Zoology 43: 127-137. 291
Glen AS, Latham MC, Anderson D, Leckie C, Niemiec R, Pech RP, Byrom AE submitted. 292
Landholder participation in regional-scale control of invasive predators: an adaptable 293
landscape model. Biological Invasions. 294
Glen AS, Pech RP, Byrom AE 2013. Connectivity and invasive species management: towards 295
an integrated landscape approach. Biological Invasions 15: 2127–2138. 296
Glen AS, Warburton B, Cruz J, Coleman M 2014. Comparison of camera traps and kill traps 297
for detecting mammalian predators: a field trial. New Zealand Journal of Zoology 41: 298
155-160. 299
Hayward MW, Moseby K, Read JL 2014. The role of predator exclosures in the conservation 300
of Australian fauna. In: Glen, A.S.; Dickman, C.R. (Editors), Carnivores of Australia: 301
Past, Present and Future, pp 355-371. Collingwood, CSIRO Publishing. 302
Innes J, Hay R, Flux I, Bradfield P, Speed H, Jansen P 1999. Successful recovery of North 303
Island kokako Callaeas cinerea wilsoni populations, by adaptive management. 304
Biological Conservation 87: 201-214. 305
Innes J, Lee WG, Burns B, Campbell-Hunt C, Watts C, Phipps H, Stephens T 2012. Role of 306
predator-proof fences in restoring New Zealand’s biodiversity: a response to Scofield 307
et al. (2011). New Zealand Journal of Ecology 36: 232-238. 308

14
Jones C, Warburton B, Carver J, Carver D 2015. Potential applications of wireless sensor 309
networks for wildlife trapping and monitoring programs. Wildlife Society Bulletin 39: 310
341-348. 311
MacKenzie DI, Nichols JD, Royle JA, Pollock KH, Bailey LL, Hines JE 2006. Occupancy 312
Estimation and Modeling : Inferring Patterns and Dynamics of Species Occurrence. 313
Amsterdam, Academic Press. 314
Norbury G 2001. Conserving dryland lizards by reducing predator-mediated apparent 315
competition and direct competition with introduced rabbits. Journal of Applied Ecology 316
38: 1350-1361. 317
Norbury G, Heyward R, Parkes J 2002. Short-term ecological effects of rabbit haemorrhagic 318
disease in the short-tussock grasslands of the South Island, New Zealand. Wildlife 319
Research 29: 599-604. 320
Norbury G, Hutcheon A, Reardon J, Daigneault A 2014. Pest fencing or pest trapping: A bio-321
economic analysis of cost-effectiveness. Austral Ecology 39: 795-807. 322
Norbury G, McGlinchy A 1996. The impact of rabbit control on predator sightings in the semi-323
arid high country of the South Island, New Zealand. Wildlife Research 23: 93-97. 324
Pickerell GA, O’Donnell CF, Wilson DJ, Seddon PJ 2014. How can we detect introduced 325
mammalian predators in non-forest habitats? A comparison of techniques. New 326
Zealand Journal of Ecology 38: 86-102. 327
Reardon JT, Whitmore N, Holmes KM, Judd LL, Hutcheon AD, Norbury G, Mackenzie DI 328
2012. Predator control allows critically endangered lizards to recover on mainland New 329
Zealand. New Zealand Journal of Ecology 36: 141-150. 330
Ruscoe WA, Ramsey DSL, Pech RP, Sweetapple PJ, Yockney I, Barron MC, Perry M, Nugent 331
G, Carran R, Warne R, Brausch C, Duncan RP 2011. Unexpected consequences of 332

15
control: competitive vs. predator release in a four-species assemblage of invasive 333
mammals. Ecology Letters 14: 1035-1042. 334
Russell JC, Innes JG, Brown PH, Byrom AE 2015. Predator-free New Zealand: conservation 335
country. BioScience 65: 520-525. 336
Saunders A, Norton DA 2001. Ecological restoration at Mainland Islands in New Zealand. 337
Biological Conservation 99: 109-119. 338
Underwood AJ 1994. On Beyond BACI - sampling designs that might reliably detect 339
environmental disturbances. Ecological Applications 4: 3-15. 340
Whitehead AL, Edge K-A, Smart AF, Hill GS, Willans MJ 2008. Large scale predator control 341
improves the productivity of a rare New Zealand riverine duck. Biological 342
Conservation 141: 2784-2794. 343
344
345

16
Figure captions 346
Fig. 1. Map of the study area showing the treatment and non-treatment areas relative to 347
Boundary Stream Reserve. The locations of kill traps are indicated by dots. 348
349
Fig. 2. Site occupancy (with 95% confidence intervals indicated by grey shading) of (a) cats 350
(Felis catus) and mustelids (Mustela spp.), (b) hedgehogs (Erinaceus europaeus), (c) rats 351
(Rattus spp.), (d) mice (Mus musculus) and (e) skinks (Scincidae) in the treatment and non-352
treatment areas during each sampling season. Predator removal began in the treatment area 353
after the first sampling season. 354

17
Table 1. Numbers of animals removed by kill trapping and specialist control on pastoral 355
properties in Hawke’s Bay, North Island, New Zealand, November 2011 – November 2015. 356
Species Number removed
Kill trapping Specialist control
Cat (Felis catus) 111 134
Ferret (Mustela furo) 51 21
Stoat (Mustela erminea) 90
Weasel (Mustela nivalis) 2
Hedgehog (Erinaceus europaeus) 748
Rabbit (Oryctolagus cuniculus) 431
Ship rat (Rattus rattus) 463
357
18
Table 2. Mean numbers of invertebrates recorded per monitoring line in weta houses in the 358
treatment and non-treatment area. P-values are for 2-tailed, paired t-tests. 359
Taxon Mean count (± SD) per
monitoring line
p
Treatment Non-treatment
Cockroaches (Blattodea) 1.3 ± 0.7 0.3 ± 0.3 0.001
Spiders (Araneae) 1.5 ± 0.4 1.8 ± 0.6 0.21
Cave weta (Rhaphidodophoridae) 1.5 ± 0.7 1.0 ± 0.6 0.14
Tree weta (Hemideina spp.) 1.5 ± 0.5 1.9 ± 0.9 0.3
Slaters (Isopoda) 0.1 ± 0.2 0 ± 0 0.35
360

19
Fig. 1 361
362

20
Fig. 2 363
(a) 364
365
(b) 366
367 (c) 368
369 370

21
(d) 371
372 (e) 373
374 375