wide area a tm net exp erimen em t sources
TRANSCRIPT

Wide Area ATM Network Experiments
using Emulated Tra�c Sources
by
Beng-Ong Lee
B.S.E.E., University of Kansas, Lawrence, Kansas, 1995
Submitted to the Department of Electrical Engineering and
Computer Science and the Faculty of the Graduate School of the
University of Kansas in partial ful�llment of the requirements
for the degree of Master of Science.
Professor in Charge
Committee Members
Date thesis accepted

Dedicated to
My Parents, Lee Yam Hooi and Ong Chin Lian for their in�nite loves,
encouragements and supports.

Acknowledgments
I would like to express my sincere thanks to my advisor Professor Victor Frost
for all of his help, encouragement and guidance of my thesis.
I would also like to thank Professor David W. Petr, and Professor Douglas
Niehaus for being the members of my committee.
I personally want to thank Bill Machardy from Government System Divi-
sion, Sprint Corporation for his helps and e�orts in coordinating the ATM WAN
experiments. Without his supports, the experiments wouldn't be successful.
The idea of ATM WAN background tra�c experiments wouldn't be possible
without the tool of NetSpec 3.0. I really would like to thank the designer of Net-
Spec, Roel Jonkman, for his patience and supports in helping me implementing
the random tra�c models.

Abstract
Several wide area network testbeds have been deployed to study the performance
of Asynchronous Transfer Mode Networks (ATM). Experiments are being con-
ducted on these testbeds to measure their performance. However, one of the
weaknesses of testbed networks is the lack of realistic tra�c ows. To exper-
imentally evaluate networks, realistic ows must be generated to emulate the
actual tra�c. Such source models are needed for network design and to evaluate
tra�c shaping, routing algorithm, and control mechanisms. Future broadband
networks will carry the tra�c from commonly used applications, like telnet and
ftp. In addition, tra�c from video and voice services are expected to be a sub-
stantial portion of the network tra�c. The exponential-growth of the World Wide
Web (WWW) will also have a great impact on the design and the performance
of networks.
To emulate user tra�c on networks, empirically derived tra�c models were
collected and implemented in NetSpec 3.0, a sophisticated network performance
tool. Congestion experiments using these emulated tra�c models were designed
and conducted. User applications only see packet performance, not ATM per-
formance. As a result, packet delay jitter and packet loss were the performance
metrics here. However, the combination of transport level ow control and ATM
level tra�c shaping is also studied. This allows us to evaluate how lower level
4

layers a�ect the packet level performance.

Contents
1 Introduction 1
1.1 The AAI Network . . . . . . . . . . . . . . . . . . . . . . . . . . . 31.2 Organization . . . . . . . . . . . . . . . . . . . . . . . . . . . . . 4
2 Background 6
2.1 Asynchronous Transfer Mode (ATM) . . . . . . . . . . . . . . . . 62.2 Synchronous Optical NETwork (SONET) . . . . . . . . . . . . . . 82.3 Tra�c Management . . . . . . . . . . . . . . . . . . . . . . . . . . 92.4 ATM Local and Wide Area Networks . . . . . . . . . . . . . . . . 102.5 TCP and UDP in Long Delay, Large Bandwidth Environment . . 11
3 Source Modeling 13
3.1 Overview . . . . . . . . . . . . . . . . . . . . . . . . . . . . . . . . 133.1.1 Variation of Day . . . . . . . . . . . . . . . . . . . . . . . 14
3.2 Generic Tra�c Source . . . . . . . . . . . . . . . . . . . . . . . . 163.2.1 Interactive Tra�c . . . . . . . . . . . . . . . . . . . . . . . 163.2.2 Bulk Transfer Tra�c . . . . . . . . . . . . . . . . . . . . . 17
3.3 TELNET . . . . . . . . . . . . . . . . . . . . . . . . . . . . . . . 193.3.1 TELNET Call Level . . . . . . . . . . . . . . . . . . . . . 193.3.2 TELNET Session Level . . . . . . . . . . . . . . . . . . . . 21
3.4 FTP (File Transfer Protocol) . . . . . . . . . . . . . . . . . . . . 233.4.1 FTP Call Level . . . . . . . . . . . . . . . . . . . . . . . . 233.4.2 FTP Session Level . . . . . . . . . . . . . . . . . . . . . . 24
3.5 VBR Video Tra�c . . . . . . . . . . . . . . . . . . . . . . . . . . 263.5.1 Video Teleconference . . . . . . . . . . . . . . . . . . . . . 263.5.2 MPEG Video Stream . . . . . . . . . . . . . . . . . . . . . 28
3.6 World Wide Web Tra�c . . . . . . . . . . . . . . . . . . . . . . . 303.6.1 WWW Call Level . . . . . . . . . . . . . . . . . . . . . . . 313.6.2 WWW Session Level . . . . . . . . . . . . . . . . . . . . . 32
4 Real Time Implementation of Tra�c Models in NetSpec 33
4.1 Overview of NetSpec 3.0 . . . . . . . . . . . . . . . . . . . . . . . 344.1.1 Implementations of Interactive Tra�c . . . . . . . . . . . . 37
i

4.1.2 Implementations of Bulk Transfer Tra�c . . . . . . . . . . 384.2 TELNET Implementation in NetSpec . . . . . . . . . . . . . . . . 394.3 FTP Implementation in NetSpec . . . . . . . . . . . . . . . . . . 404.4 Video MPEG Implementation in NetSpec . . . . . . . . . . . . . . 414.5 Video Conferencing Implementation in NetSpec . . . . . . . . . . 42
5 Validation of Tra�c Models Implementation 43
5.1 FTP Models . . . . . . . . . . . . . . . . . . . . . . . . . . . . . . 445.2 WWW Models . . . . . . . . . . . . . . . . . . . . . . . . . . . . 475.3 MPEG Models . . . . . . . . . . . . . . . . . . . . . . . . . . . . 505.4 Video Conferencing Models . . . . . . . . . . . . . . . . . . . . . 51
6 WAN Experiments 52
6.1 Performance Metrics . . . . . . . . . . . . . . . . . . . . . . . . . 556.2 No Cell Level Pacing . . . . . . . . . . . . . . . . . . . . . . . . . 596.3 Cell Level Pacing on Target Flows . . . . . . . . . . . . . . . . . . 676.4 Cell Level Pacing on Background Tra�c . . . . . . . . . . . . . . 716.5 Comparison of Network Performance After Network Upgrades . . 76
6.5.1 No Cell Level Pacing . . . . . . . . . . . . . . . . . . . . . 786.5.2 Cell Level Pacing on Background Tra�c . . . . . . . . . . 79
7 Lessons Learned 83
7.1 ATM WAN Performance . . . . . . . . . . . . . . . . . . . . . . . 837.1.1 TCP and UDP Protocol Performance . . . . . . . . . . . . 837.1.2 Tra�c Shaping . . . . . . . . . . . . . . . . . . . . . . . . 847.1.3 Asymmetrical Network Structure . . . . . . . . . . . . . . 867.1.4 Early Packet Discard (EPD) Functionality and Performance 86
7.2 Doing Network Measurements . . . . . . . . . . . . . . . . . . . . 877.2.1 Network Connectivity . . . . . . . . . . . . . . . . . . . . 877.2.2 Host State . . . . . . . . . . . . . . . . . . . . . . . . . . . 887.2.3 Long Duration of Experiments . . . . . . . . . . . . . . . . 887.2.4 Large Amount of Collected Data . . . . . . . . . . . . . . 89
8 Conclusions and Future Work 91
8.1 Summary and Conclusions . . . . . . . . . . . . . . . . . . . . . . 918.2 Future Work . . . . . . . . . . . . . . . . . . . . . . . . . . . . . . 92
A NetSpec Scripts for Validation Experiments 94
A.1 FTP script for Validation Experiment . . . . . . . . . . . . . . . . 94A.2 WWW script for Validation Experiment . . . . . . . . . . . . . . 101A.3 MPEG script for Validation Experiment . . . . . . . . . . . . . . 107A.4 VideoConference script for Validation Experiment . . . . . . . . . 110

B NetSpec Scripts for WAN Experiments 112
B.1 TCP Target Flows scripts . . . . . . . . . . . . . . . . . . . . . . 112B.2 UDP Target Flows scripts . . . . . . . . . . . . . . . . . . . . . . 115B.3 25Mbps Background Tra�c script . . . . . . . . . . . . . . . . . . 117B.4 60Mbps Background Tra�c script . . . . . . . . . . . . . . . . . . 122

List of Tables
3.1 The parameters of I, P, B frame types . . . . . . . . . . . . . . . 30
4.1 Available Random Distributions in NetSpec 3.0 . . . . . . . . . . 36
5.1 Interarrival Rates and lambda for FTP Sessions . . . . . . . . . . 465.2 Interarrival Rates and lambda for WWW Connections . . . . . . 49
6.1 Con�guration of Contention Tra�c Rate . . . . . . . . . . . . . . 546.2 Target Flow Throughput . . . . . . . . . . . . . . . . . . . . . . . 556.3 Pacing Rates for Target Flows . . . . . . . . . . . . . . . . . . . . 676.4 25Mbps Background Tra�c Pacing Rates . . . . . . . . . . . . . . 746.5 60Mbps Background Tra�c Pacing Rates . . . . . . . . . . . . . . 74
7.1 Run Dates of the Experiments from ITTC to AAI cloud . . . . . 897.2 Run Dates of the Experiments from AAI cloud to ITTC . . . . . 90
iv

List of Figures
1.1 AAI Wide Area Network Map . . . . . . . . . . . . . . . . . . . . 4
2.1 ATM Cell Format . . . . . . . . . . . . . . . . . . . . . . . . . . . 72.2 ATM LANs and WANs . . . . . . . . . . . . . . . . . . . . . . . . 11
3.1 Mean, relative, hourly session arrival rates for telnet, ftp sessions,phone connections, WWW requests. . . . . . . . . . . . . . . . . . 14
3.2 Interactive Tra�c Setup . . . . . . . . . . . . . . . . . . . . . . . 173.3 Bulk Transfer Tra�c Setup . . . . . . . . . . . . . . . . . . . . . 183.4 TELNET Tra�c Setup . . . . . . . . . . . . . . . . . . . . . . . . 203.5 TELNET packet interarrival time distribution from tcplib . . . . . 213.6 TELNET packet size distribution from tcplib . . . . . . . . . . . . 223.7 FTP Tra�c Setup . . . . . . . . . . . . . . . . . . . . . . . . . . 233.8 FTP Number Of Items distribution from tcplib . . . . . . . . . . . 243.9 FTP Item Size distribution from tcplib . . . . . . . . . . . . . . . 253.10 Video Tra�c Setup . . . . . . . . . . . . . . . . . . . . . . . . . . 263.11 Compression pattern used to generate the video stream . . . . . . 293.12 WWW Tra�c Setup . . . . . . . . . . . . . . . . . . . . . . . . . 31
4.1 NetSpec's Implementation of Burst . . . . . . . . . . . . . . . . . 344.2 Example Script of User Level VBR Tra�c . . . . . . . . . . . . . 354.3 NetSpec's Implementation of Interactive Tra�c . . . . . . . . . . 374.4 NetSpec script for interactive tra�c . . . . . . . . . . . . . . . . . 384.5 NetSpec's Implementation of Bulk Transfer Tra�c . . . . . . . . . 384.6 NetSpec script for bulk transfer tra�c . . . . . . . . . . . . . . . 394.7 NetSpec script for telnet tra�c . . . . . . . . . . . . . . . . . . . 394.8 NetSpec script for ftp tra�c . . . . . . . . . . . . . . . . . . . . . 404.9 NetSpec script for MPEG video stream . . . . . . . . . . . . . . . 414.10 NetSpec script for teleconferencing video stream . . . . . . . . . . 42
5.1 Emulated Daily FTP Tra�c . . . . . . . . . . . . . . . . . . . . . 445.2 Calculated Mean of Daily FTP Tra�c . . . . . . . . . . . . . . . 455.3 Emulated Daily WWW Tra�c . . . . . . . . . . . . . . . . . . . . 475.4 Calculated Mean of Daily WWW Tra�c . . . . . . . . . . . . . . 48
v

5.5 Emulated Tra�c of 12 MPEG Video Streams . . . . . . . . . . . 505.6 Emulated Tra�c of 7 Videoconferencing Streams . . . . . . . . . 51
6.1 Network Con�guration for ITTC to AAI Connections . . . . . . . 536.2 E�ect of Cell Level Pacing . . . . . . . . . . . . . . . . . . . . . . 586.3 Standard Deviation (ms) of Network Jitter of TCP Target Flows
from ITTC to AAI cloud . . . . . . . . . . . . . . . . . . . . . . . 596.4 Standard Deviation (ms) of Network Jitter of TCP Target Flows
from AAI cloud to ITTC . . . . . . . . . . . . . . . . . . . . . . . 616.5 Standard Deviation (ms) of Network Jitter of UDP Target Flows
from ITTC to AAI cloud . . . . . . . . . . . . . . . . . . . . . . . 636.6 Standard Deviation (ms) of Network Jitter of UDP Target Flows
from AAI cloud to ITTC . . . . . . . . . . . . . . . . . . . . . . . 646.7 Percentage of UDP Segment Losses of UDP Target Flows from
ITTC to AAI cloud . . . . . . . . . . . . . . . . . . . . . . . . . . 656.8 Percentage of UDP Segment Losses of UDP Target Flows from
AAI cloud to ITTC . . . . . . . . . . . . . . . . . . . . . . . . . . 666.9 Standard Deviation (ms) of Network Jitter of Cell Level Paced
TCP Target Flows from ITTC to AAI cloud . . . . . . . . . . . . 686.10 Standard Deviation (ms) of Network Jitter of Cell Level Paced
TCP Target Flows from AAI cloud to ITTC . . . . . . . . . . . . 696.11 Standard Deviation (ms) of Network Jitter of Cell Level Paced
UDP Target Flows from ITTC to AAI cloud . . . . . . . . . . . . 706.12 Percentage of Segment Losses of Cell Level Paced UDP Target
Flows from ITTC to AAI cloud . . . . . . . . . . . . . . . . . . . 716.13 Standard Deviation (ms) of Network Jitter of Cell Level Paced
UDP Target Flows from AAI cloud to ITTC . . . . . . . . . . . . 726.14 Percentage of Segment Losses of Cell Level Paced UDP Target
Flows from AAI cloud to ITTC . . . . . . . . . . . . . . . . . . . 736.15 Standard Deviation (ms) of Network Jitter of TCP Target Flow
with Cell Level Paced Background Tra�c from ITTC to AAI cloud 756.16 Standard Deviation (ms) of Network Jitter of TCP Target Flow
with Cell Level Paced Background Tra�c from AAI cloud to AAI 766.17 Standard Deviation (ms) of Network Jitter of UDP Target Flows
with Cell Level Paced Background Tra�c from ITTC to AAI cloud 776.18 Standard Deviation (ms) of Network Jitter of UDP Target Flows
with Cell Level Paced Background Tra�c from AAI cloud to ITTC 786.19 Percentage of UDP Segment Losses of UDP Target Flows with Cell
Level Paced Background Tra�c from ITTC to AAI cloud . . . . . 796.20 Percentage of UDP Segment Losses of UDP Target Flows with Cell
Level Paced Background Tra�c from AAI cloud to ITTC . . . . . 806.21 Standard Deviation of UDP Target Flows under the non-cell level
paced 60Mbps Background Tra�c . . . . . . . . . . . . . . . . . . 80

6.22 Losses of UDP Segments of UDP Target Flows under the non-celllevel paced 60Mbps Background Tra�c . . . . . . . . . . . . . . . 81
6.23 Standard Deviation of UDP Target Flow under the cell level paced60Mbps Background Tra�c . . . . . . . . . . . . . . . . . . . . . 81
6.24 Losses of UDP Segments of UDP Target Flows under the cell levelpaced 60Mbps Background Tra�c . . . . . . . . . . . . . . . . . . 82

Chapter 1
Introduction
The idea of Asynchronous Transfer Mode (ATM) was �rst introduced in mid-
1980s. Since then, numerous studies had been conducted to fully understand the
performance and behavior of ATM wide area networks (WANs) and local area
networks (LANs). As more and more new ATM standards are being proposed
and set, the de�nition of ATM and its functionality are changing. Advanced
technology provides better ATM equipment and facilities at lower costs. All of
these lead to new research areas in network performance, switch queueing, and
new routing algorithms.
Several national wide large scale ATM testbeds, such as Multi-dimensional
Applications Gigabit Internetworking Consortium (MAGIC) and Advanced Tech-
nology Demonstration Network (ATDnet), have been deployed to experimentally
evaluate the ATM performance, such as network capacity, queueing performance.
One of the weaknesses of testbed networks is the lack of realistic tra�c ows on
the system. To experimentally evaluate networks, realistic tra�c ows must be
generated to emulate the actual tra�c. Such source models are needed for net-
work design and to evaluate tra�c shaping, routing algorithm, and control mech-
1

anisms. Future broadband networks, especially wide area networks (WANs), will
carry the tra�c from commonly used applications, like telnet and �le transfer
protocol (ftp). telnet is a widely common tool that allows a user at one site to
establish a connection to a login server at another. ftp is another tools that
provides �le accesses on remote machines. Tra�c from video and voice services
are expected to be a substantial portion of the network tra�c. The exponential-
growth of the World Wide Web (WWW) will also have a great impact on the
design and the performance of networks.
Many ATM WAN experiments have been conducted on the testbeds to mea-
sure point-to-point maximum throughput in bits/second [22]. These maximum
throughput experiments do not address the network performance under cross traf-
�c congestion scenarios. To truly understand ATM network performance from
the user prospective, realistic congestion experiments that include emulated user
tra�c must be conducted. In addition, user applications only see packet level
performance, not the ATM level performance. Packet loss and packet delay jitter
are the other important elements in describing network performance.
In this document, a summary of the empirically-derived analytic source mod-
els is described. Telnet and ftp connections, video streams, and the WWW tra�c
models are considered. The models were collected from various studies and notes
[1], [4] [9] [10] [11] [19]. These models represent tra�c ows from regular network
users. These source models have been successfully implemented in NetSpec 3.0
[21], a network testing tool. The details of NetSpec can be found in chapter 4
and [21]. Congestion experiments using these emulated user tra�c models have
been designed and conducted to evaluate network performance, such as packet
loss and packet delay jitter. In addition, e�ects of transport level ow control and
ATM level tra�c shaping are studied. All the WAN experiments were conducted
2

on the ACTS ATM Internetwork (AAI) testbed, a nation wide large scale ATM
testbed.
1.1 The AAI Network
The ACTS ATM Internetwork (AAI) is an Advanced Research Projects Agency
(ARPA) research network providing wide area Asynchronous Transfer Mode
(ATM) connectivity. It connects several DoD High Performance Computing
center and high speed wide area ATM testbeds, such as Multidimensional Ap-
plications and Gigabit Internetwork Consortium (MAGIC) and ATDnet gigabit
testbeds. The ATM cell relay service is being provided by Sprint. NEC M20
switches are interconnected to form the Sprint ATM backbone and FORE ASX-
200, ASX-200BX, ASX-1000 provide the connections at each site. AAI research
focuses on network signaling, congestion management, multicast (ATM and IP),
and Gateways to non-ATM LANs.
The University of Kansas (KU) is one of the AAI participants. Several work-
stations have been deployed by KU to di�erent geographical locations within the
AAI for the use of ATM WAN experiments. The workstations consist of DEC
Alpha 3000/700s and Sun SPARC-20s equipped with ATM OC-3 interface cards.
These workstations are capable of performing high speed ATM WAN experi-
ments. The DEC Alphas and Sun SPARC-20s have large TCP window size of up
to 20MEG bytes to perform long delay WAN experiments.
Figure 1.1 shows the AAI wide area network map and the locations of work-
stations deployed by KU. The largest Round Trip Ping Time (RTT) is 63ms from
ARL at Washington, D.C. to NCCOSC at San Diego, California.
3

AAI
FORE ASX 200BXNRL Switch
FORE ASX 200BX
NCCOSC Switch FORE ASX 1000
FORE ASX 1000FORE ASX 200GSD Switch
FORE ASX 200ARL Switch
DEC Alpha 3000/700
DEC Alpha 3000/700
Sun SPARC 20
OC-3
OC-3
OC-3
OC-3
OC-3
OC-3
OC-3
OC-3
OC-3
OC-3
OC-3 OC-12
WPAFB Switch
FORE ASX
OC-3
OC-3
Washington, D.C.
Kansas City, KansasLawrence, Kansas
San Diego, California
Wrigh Patterson, OhioDEC Alpha 3000/700
Washington, D.C.DEC Alpha 3000/700
Sun SPARC 20Sioux Falls, South Dakota
KU
EDC
GSD
WPAFBNRL
ARL
NCCOSC
TIOC Switch
ITTC Switch
Figure 1.1: AAI Wide Area Network Map
1.2 Organization
This report is divided into 8 chapters.
Chapter 2 brie y describes basic network background information. Common
tra�c management techniques are presented. The e�ect of TCP and UDP in a
long delay network environment is discussed.
Chapter 3 presents the telnet, ftp, video, WWW tra�c models collected from
various papers and books. Two generic models are developed. The modeling of
each tra�c type using the generic models is presented.
Chapter 4 brie y describes the overview of a network testing tool, NetSpec,
4

and discusses how the random tra�c models in Chapter 3 were implemented.
Chapter 5 presents the validation of tra�c models implementation.
Chapter 6 presents the ATMWAN experiments using the emulated user tra�c
models. The combined e�ect of transport level ow control and ATM cell level
tra�c shaping is studied. In addition, comparison of network performance was
made to re ect the network changes.
Chapter 7 discusses the lessons learned about the ATM WAN performance
and addresses some of the issues found during the experiments.
Chapter 8 summaries the conclusion and recommend some proposals for future
work.
5

Chapter 2
Background
This chapter aims to provide some background information about networking.
A brief description of ATM and Synchronous Optical NETwork (SONET) is
given. In addition, common tra�c management techniques to optimize network
utilization are listed in Section 2.3. The e�ects of Transmission Control Protocol
(TCP) and User Datagram Protocol (UDP) in a long delay network environment
are also discussed in Section 2.5.
2.1 Asynchronous Transfer Mode (ATM)
ATM is a packet-oriented transfer method. Multiple logical connections are al-
lowed to multiplex over a single physical connection. The basic idea of this high
speed transfer method is the �xed size ATM cells. The size of the cell is always
53 bytes. The cell has 5 bytes overhead and 48 bytes of payload. This �xed size
cell implementation enables the ATM network to intermingle voice, video, and
data without compromising the unique needs of each application. In addition, the
ATM switches can process and route the �xed size cells more quickly in hardware
6

since no additional processing is needed for the �xed size cells. Figure 2.1 shows
the ATM cell format.
B I T
HEC
PTIVCI
VPI
GFC
VCI
VCI
VPI
Payload (48 octets)
Octet
0 1 2 3 4 5 6 7
CLP
Figure 2.1: ATM Cell Format
Payload Type Indicator (PTI) and Cell Loss Priority (CLP) in the ATM
header are often used by various tra�c ow control methods. Virtual Path Iden-
ti�er (VPI) and Virtual Circuit Identi�er (VCI) are used to route cells through
networks. The Header Error Code (HEC) is used by the network equipment to
determine if any bits in the header have been corrupted during transmission.
Unlike other networks, ATM provides multiple classes of services to support
di�erent application needs. The de�ned service categories are as follows :
� Constant Bit Rate (CBR) is designed to provide support for applications
that need a highly predictable transmission rate.
� Variable Bit Rate (VBR) service is controlled by two parameters : Sus-
tainable Cell Rate (SCR) and Peak Cell Rate (PCR). SCR is the average
rate of transmission. PCS is the maximum transmission rate that a VBR
7

connection can burst out. There are two types of VBR service : Real Time
and Non-Real Time.
{ Real Time (VBR-rt) : This type of applications requires a real-time
environment. In other words, data transmission is time critical and
can not tolerate large cell delay variations. Video conferencing is a
good example.
{ Non-Real Time (VBR-nrt) : Applications that store information
for later retrieval, such as store-and-forward video usually use this type
of service. A timing relationship is not required on each end.
� Available Bit Rate (ABR) provides the maximum amount of network
resources available to the connection when needed. The data can tolerate
variation in transmission speed and network delay.
� Unspeci�ed Bit Rate (UBR) cells are the �rst to be dropped when
congestion occurs. This type of services provides the least QoS.
2.2 Synchronous Optical NETwork (SONET)
SONET is a world wide standard transport mechanism that utilizes the advan-
tages of high speed �ber optics. It is often found to be the physical infrastructure
of choice for carrier ATM networks. The most common SONET implementations
are OC-3 (155.52Mbps), OC-12 (622.08Mbps), OC-48 (2.4Gbps), and OC-192
(9.6Gbps). Unlike asynchronous protocols with bit stu�ng technique, SONET
achieves its high speed by adding pointers to identify the starting bit of the
payload.
8

SONET system con�gured in rings can recover from single �ber cuts or equip-
ment failures in less than 250ms. Most large-scale SONET networks use 4-�ber,
bidirectional, path/line-switched rings to ensure active network status. It allows
connections to be restored in milliseconds without interrupting tra�c transmis-
sion. This feature makes SONET ideal for mission-critical networks, such as
banking, hospital, military, and etc.
2.3 Tra�c Management
Network performance does not depend solely on the maximum speed of transmis-
sion. In an ATM network, congestion occurs and cells are discarded. To prevent
cell losses, ATM switches are equipped with large bu�ers to temporarily store
the cells until transient congestion passes. However, large bu�ers do not always
solve the congestion problem. Many techniques may be used individually or in
combination to have better congestion control. Below are some of the common
techniques to achieve better network utilization. The Payload Type Indicator
(PTI) and Cell Loss Priority (CLP) bits in the ATM header can be used to
selectively drop tra�c.
� Large Bu�ers : larger bu�ers are often the �rst choice for networks to
reduce the chances of tra�c congestion. Cells are temporarily stored in
the switch bu�ers during congestion instead of being dropped. However,
increasing switch bu�ers also increases cell delay and equipment cost. An
engineering approach is needed to determine the best bu�er size under the
constraint of cell delay and cost.
� Per VC Queueing : Instead of sharing the same queue for all connections,
an independent queue (bu�er) is allocated for a particular VC. In this case,
9

other connections won't be in uenced when congestion occurs on this par-
ticular VC.
� Packet Discarding : If an intermittent cell is missing at the receiving end,
the whole packet will be dropped by higher layer because of incomplete
packet error. When congestion occurs, the network only drops one of the
higher-layer packets instead of corrupting multiple packets with occasional
cell loss. There are two Packet Discarding techniques : Early Packet Discard
(EPD) and Partial Packet Discard (PPD).
{ EPD reserves the remaining bu�er space for packets that are already
in the bu�er when the threshold has been exceeded. This technique
maximizes the chances for these packets that already in the bu�er to
be successfully transmitted. The last cell of the packet is not discarded
since it indicates the next packet.
{ PPD discards all remaining cells in the packet that are already in the
bu�er when bu�er over ows. It can be combined with the use of EPD
to reduce the chance of discarding cells from multiple packets.
2.4 ATM Local and Wide Area Networks
ATM LANs often consist of multiple interconnected switches that support a va-
riety of link speeds per port. ATM WANs are often connected with 155Mbps
(OC-3) links or 622Mbps (OC-12) links to aggregate the tra�c from the LANs.
Figure 2.2 shows a typical ATM network. ATM standards have been set by In-
ternational Telecommunication Union (ITU), formerly known as CCITT. As a
result, switches are available and interconnectable from many vendors.
10

OC-3
25Mbps
25Mbps
25Mbps
OC-3
OC-12
25Mbps
OC-3OC-12
OC-12
622.02MbpsOC-12
155.52Mbps
25Mbps
SWITCH
HOST
Figure 2.2: ATM LANs and WANs
2.5 TCP and UDP in Long Delay, Large Band-
width Environment
Transmission Control Protocol (TCP) uses a sliding window scheme to provide
its ow control. The receiver returns an acknowledgment packet to the source for
every packet it receives. This acknowledgment packet indicates the transmitted
data has been successfully received with no error. Thus, it provides reliable
data delivery. Generally, under TCP, the source keeps transmitting a sequence of
packets before it receives acknowledgment packets back from the receiver. A well-
tuned TCP connection will keep the network completely saturated with packets.
As a result, it substantially improves the network utilization.
The performance of sliding window protocol depends on the window size and
the speed at which the network accepts packets. Especially on ATM WANs,
11

window size is often found to be the bottleneck of the throughput. For a simple
TCP connection with a RTT of 40 milliseconds on an OC-3 link, the window size
must be at least
WindowSize =135Mbits
seconds� 0:040seconds �
1byte
8bits
= 675; 000bytes
Note that, although the nominal OC-3 link rate is 155.02Mbps, the theoretical
maximum achievable throughput on TCP layer is 135.102Mbps. Today's work-
stations usually have a default of TCP windows less than 256K bytes. To take
advantage of high speed networks, TCP window size must be carefully set.
Unlike TCP, User Datagram Protocol (UDP) is an unreliable connectionless
packet delivery protocol. Data is transmitted from sources to receivers without
proper safety mechanisms to ensure that data arrives successfully. UDP does not
have a ow control method. Thus, UDP sources tend to transmit the data as fast
as possible. This often leads to severe network tra�c congestion. Experiments
have proven that UDP has poor throughput in a congestion environment [22].
12

Chapter 3
Source Modeling
3.1 Overview
For decades, source or tra�c modeling has been an active research area. Ana-
lytical modeling of tra�c sources provides the basis of performance analysis and
network design. Usually, empirical data is collected and evaluated to provide the
basis for analytical models. This data represents the behavior of network tra�c.
A mathematical expression is often developed based on the properties observed
from the empirical data. This mathematical model serves as an approximation
for the target tra�c. The model is used to analyze network performance, such as
queue length, queue delay, loss probability, etc. This chapter describes the source
models that were collected from various studies. The source models are telnet,
ftp, MPEG, Videoconference, and WWW. Two generic models are developed for
interactive and bulk transfer applications in Section 3.2.1 and 3.2.2, respectively.
Detailed models and characteristic of each type of tra�c are presented and sum-
marized from Section 3.3 to 3.6. As has been widely observed before, network
tra�c is dominated by a 24-hour pattern. In doing long duration experiments,
13

the hourly-varied tra�c must be taken into consideration. Section 3.1 brie y
describes the 24-hour tra�c pattern from di�erent applications.
3.1.1 Variation of Day
The network tra�c has been observed as a function of time and applications.
Network users seems to use the network according to their needs, hour of the
day, and day of the week. In addition, network tra�c is closely related to the
applications. Video, graphic, voice, and data tra�c have di�erent characteristics.
If the network tra�c is measured through the course of the whole day, it varies
from morning to midnight. Figure 3.1 shows the fraction of total connections of
di�erent tra�c types.
telnet
ftp
phone
WWW
0 5 10 15 20
0
0.02
0.04
0.06
0.08
0.1
0.12
Time of Day (Hours)
Frac
tion
of T
otal
Con
nect
ions
Figure 3.1: Mean, relative, hourly session arrival rates for telnet, ftp sessions,phone connections, WWW requests.
14

As observed from the Figure 3.1, each type of tra�c has its own pattern of
tra�c load from morning to midnight. For an example, telnet connections has
the highest peaks at morning and afternoon where as ftp has an additional peak
at evening. The characteristic of each type of tra�c is brie y described as follows
:
� telnet : telnet tra�c has two peak hours around morning and afternoon
hours. Telnet tra�c do not consume network bandwidth as much as other
tra�c types do because it transmits only text data.
� ftp : Unlike telnet tra�c, ftp tra�c has another peak during evening hours.
This is because users are taking the advantage of quiet hours of the net-
work. ftp tra�c has been known as bursty due to its nature of transmitting
multiple large-sized items.
� Telephone : telephone activity has two large peak hours around the morn-
ing and afternoon hours from business use. During lunch hours, phone traf-
�c reduces substantially. During the evening, tra�c increases due to the
residential use.
� WWW : Compared to other tra�c, WWW doesn't vary a lot during the
time of day. This is because WWW tra�c arises from a wider geographical
base..
15

3.2 Generic Tra�c Source
Basically, all the tra�c sources can be categorized into two types : (1) interactive,
and (2) bulk transfer. This section outlines the generic models to describe the
tra�c from interactive and bulk transfer applications. Models on session and call
level of each tra�c type presented in Section 3.2 to 3.6 are developed from these
generic models.
3.2.1 Interactive Tra�c
Interactive applications, like telnet, are dependent upon human behavior and
activities, such as typing speed and user think time. The tra�c pattern is bidi-
rectional. Two time scales are needed to describe the tra�c sources. The call
level models the multi-session behavior, such as the interarrival times and the
duration of each session. The session level models the tra�c patterns, such as
packet interarrival times and packet sizes, within each single session.
Call Level
The call level consists of two models. They are :
� Session Interarrival Time : the interarrival time between the sessions.
� Session Duration : the duration of login time or holding time of each session
or call.
Session Level
The session level contains two models to describe the variance within each con-
nection. They are :
16

Session
Size
Packet
Duration
Setup
Session
Setup
Call
Session
Interarrival Time
Packet
Interarrival Time
Figure 3.2: Interactive Tra�c Setup
� Packet Interarrival Time : the interarrival time of packets within a single
session.
� Packet Length or Packet Size : the size of each packet within a single
session.
3.2.2 Bulk Transfer Tra�c
The amount of data, which is usually transferred by applications like ftp, VBR
video, and WWW browsers, is more signi�cant in one direction compared to the
other. Unlike interactive applications, the characteristics of the generated tra�c
are mostly dependent on the network and host con�guration parameters. For
example, the maximum packet size of the ftp tra�c is limited by the Maximum
Transfer Unit (MTU) size of the hosts. The duration of each session is dominated
by the network's link rate. The faster the link rate, the shorter the duration of
17

each session. Di�erent network capacities will have di�erent performance for bulk
transfer tra�c.
Item
Setup
CallInterarrival Time
Session/Request
Number Of
Size
Setup
Session
Items
Figure 3.3: Bulk Transfer Tra�c Setup
Call Level
The call level for bulk transfer tra�c consists of one model.
� Session or Request Interarrival Time : the interarrival time between the
sessions or requests.
Session Level
The session level for bulk transfer tra�c consists of two models.
� Number Of Items : the number of items that needed to be transferred.
� Item/File/Document Size : the size of the item or �le or document needed
to be transferred.
18

3.3 TELNET
In [1], [2], and [3], the models associated with TELNET connections using the
collected LBL1 telnet test datasets are presented. These datasets contain 2.5 mil-
lion WAN TCP connections. There are four di�erent models for telnet protocol
:
� Session Interarrival Times (in seconds).
� Session Duration (in seconds).
� Packet Interarrival Times (in seconds).
� Packet Size (in bytes).
Figure 3.4 brie y describes the setup of the TELNET tra�c.
Since the random variables associated with the models described above have
a large range of values, the computed mean and standard deviation are greatly
skewed by the largest of the values. As a result, log2x logarithmic transformation
is used to reduce the range of input values.
3.3.1 TELNET Call Level
TELNET Session Interarrival Times
The pattern of TELNET session arrivals is dominated by a 24-hour pattern as
shown in Figure 3.1. Within one-hour intervals, TELNET session arrivals can be
well-modeled by a homogeneous Poisson process with �x hourly rates. In other
words, each of these arrivals re ects an individual user starting a new session.
1LBL : Lawrence Berkeley Lab
19

Call
Size
Packet
Packet
Duration
TELNET Session
TELNET Session
Interarrival Time
Interarrival TimeSession
Setup
Setup
Figure 3.4: TELNET Tra�c Setup
The session interarrival time is exponentially distributed. The probability density
function of exponential distribution is shown below.
fX(x) = �e��x ; � = 1=mean
X is the interarrival time between two sequential TELNET sessions. The
mean, which is 1=�, is adjusted to follow arrival rate at the corresponding hours
of the day shown in Figure 3.1.
TELNET Session Duration
Duration is the telnet connection time between login and logout. The duration
�ts into a simple log-normal distribution. From the LBL datasets, the log-mean
varied from 7.67 to 8.03 and the log-standard deviation varied from 2.83 to 3.02.
For the �xed model, the mean = log2 (240) = 7.91 and the standard deviation =
20

log2 (7.8) = 2.96. The unit is seconds. Below is the probability density function
of log-normal distribution, where X is the session duration of telnet in seconds.
fX(x) =1
p2��x
e�1
2�2[log2(x)�m]2 ; 7:67 � m � 8:03
; 2:83 � � � 3:02
3.3.2 TELNET Session Level
TELNET Packet Interarrival Times
The packet interarrival times within a TELNET session do not follow the pattern
of exponential distribution. Instead, they �t a Pareto distribution with shape
parameter � � 0:9. The traces show that the distribution is heavy-tailed [3]. The
packet interarrival time distribution from tcplib follows the pattern in Figure 3.5
interarrival time distribution from tcplib follows the pattern in Figure 3.5. The
X-axis is expressed in log2 scale.
−2 0 2 4 6 8 10 12 14
0
0.1
0.2
0.3
0.4
0.5
0.6
0.7
0.8
0.9
1
lg Packet Interarrival Time (in seconds)
Cum
ulat
ive
Pro
babi
lity
Figure 3.5: TELNET packet interarrival time distribution from tcplib
21

TELNET Packet Size
The TELNET packets are mostly 1-byte packets due to human typing. More
than 60% of packets are 1-byte in length[4][5]. The packet size distribution in
the 13 million TELNET connections from tcplib[5] follows the pattern in Figure
3.6. The X-axis is expressed in log2 scale.
0 1 2 3 4 5 6 7 8 9 10
0
0.1
0.2
0.3
0.4
0.5
0.6
0.7
0.8
0.9
1
lg Packet Size (in bytes)
Cum
ulat
ive
Pro
babi
lity
Figure 3.6: TELNET packet size distribution from tcplib
22

3.4 FTP (File Transfer Protocol)
The authors [1] [2] [3] describe the FTP connections in several di�erent models.
Figure 3.7 describes the setup of the FTP tra�c. Compared to TELNET tra�c
setup (Figure 3.4), the ftp doesn't have the duration and item interarrival time
setups. This is because the duration of each ftp session is dependent upon the
network capacity, such as link rate. The faster the link rate, the more items the
network can transfer in the same amount of time.
Session
FTP Session
Interarrival TimeCall
Setup
Size
Item
Number
Of Items
Setup
Figure 3.7: FTP Tra�c Setup
3.4.1 FTP Call Level
FTP Session Interarrival Times
Like TELNET session arrivals, FTP session arrivals can be modeled by a Poisson
process within one-hour intervals. As a result, the interarrival time between two
FTP sessions is exponentially distributed. The pattern is dominated by the 24
hour pattern as shown in Figure 3.1. The FTP arrivals have a similar hourly
pro�le like TELNET. However, it has higher arrival rates during the evening
hours while presumably users take advantage of lower networking delays. The
23

probability density function of exponential distribution is shown below.
fX(x) = �e��x ; � = 1=mean
X is the interarrival time (in seconds) between two ftp sessions. The mean,
which is 1=�, is adjusted to follow arrival rate at the corresponding hour of the
day shown in Figure 3.1.
3.4.2 FTP Session Level
FTP Number Of Items
During a single FTP session, there are multiple data transfers. Each data transfer
refers to the transfer of an item. The distribution of number of transfered items
per FTP session from tcplib[5] is shown in Figure 3.8. The x-axis is the log2 value
of the number of items. The mean of FTP Number of Items is 7.
0 1 2 3 4 5 6
0
0.1
0.2
0.3
0.4
0.5
0.6
0.7
0.8
0.9
1
lg Number of Items
Cum
ulat
ive
Pro
babi
lity
Figure 3.8: FTP Number Of Items distribution from tcplib
24

FTP Item Size
FTP Item Size model the bytes transfered during a FTP data transfer. This type
of connection can be modeled using a log-normal distribution. The distribution
of item size from tcplib[5] is shown in Figure 3.9. The x-axis is the log2 value of
the item size. The mean of FTP Item Size is 50K bytes.
2 4 6 8 10 12 14 16 18
0
0.1
0.2
0.3
0.4
0.5
0.6
0.7
0.8
0.9
1
lg FTP Item Size (bytes)
Cum
ulat
ive
Pro
babi
lity
Figure 3.9: FTP Item Size distribution from tcplib
25

3.5 VBR Video Tra�c
Broadband integrated networks are expected to carry substantial portions of the
video services. Accurate source modeling of VBR services is essential to develop
a network that achieves pre-de�ned quality of services and cost-e�ciency.
Figure 3.10 provides a general picture of the video tra�c setup on session
level.
Setup
Size
Constant Frame
Variable Frame
Interarrival Time
Session
Figure 3.10: Video Tra�c Setup
Generally, there are two types of video tra�c : (1) Teleconference video
stream, and (2) MPEG video stream. Each of these video streams have di�er-
ence characteristics based on its nature of object motions and use of compression
algorithms. NetSpec 3.0 is capable of producing both video tra�c streams as
speci�ed.
3.5.1 Video Teleconference
Video Teleconference sequences do not have scene changes or scene cuts and have
only moderate motion.
26

Frame Interarrival Times
The frame interarrival time is the direct inverse of the frame rate. The interarrival
time is a constant value. For National Television Standards Committee (NTSC)
standard systems, the interframe period is 33 milliseconds (30 frames/sec). For
PAL2 standard systems, the interframe period is 40 milliseconds (25 frames/sec).
A rate of 25 to 30 frames/sec will produce high quality video stream that requires
a large portion of network bandwidth. For video teleconference, high frame rate
is not usually required since the objects on screen have only moderate motions.
Typical conference calls with high compression technique that produce acceptable
quality often only require 5 to 15 frames/sec rates. Generally, 12 frame/sec (83
milliseconds/frame) is commonly used.
The Number of Cells per Frame
The number of cells per frame follows a gamma distribution[7]. From [7], � =
0:02353 and s = 3:066. The density function of the gamma distribution is given
by
f(t) =�(�t)s�1
�(s)e��t ; � = 0:02353
; s = 3:066
where �(s) is the gamma function de�ned as
�(s) =Z1
0ts�1e�tdt:
2Phase Alternation by Line. A television signal standard (625 lines, 50 Hz, 220 V primarypower) used in the United Kingdom, much of the rest of western Europe, several South Americancountries, some Middle East and Asian countries, several African countries, Australia, NewZealand, and other Paci�c island countries.
27

t is the frame size in bytes. The parameters of a gamma distribution are scale
and shape. As a result, scale = 1/� = 42.50 and shape = s � 3. Due to the
implementation and limitation of the gamma random generator, the shape must
be speci�ed as an integer instead of a fraction.
3.5.2 MPEG Video Stream
Compared to video teleconference streams, MPEG3 video streams are more bursty
due to the frequent scene changes and motions. To adequately model a MPEG
video stream, scene length, di�erent frame types (I, P, and B frame types) must
be taken into account. Without considering these factors, the tra�c pattern will
not be fully characterized.
Frame Interarrival Times
In order to produce high quality motion pictures, a high frame rate is often
required. The typical constant interframe period is at least 33 ms (30 frames/sec)
for NTSC standard systems and 40 ms (25 frames/sec) for PAL standard systems.
Scene Length
A video stream consists of several segments such that the sizes of I frames in
each segment are close in value. Each segment corresponds to a part of the movie
with no abrupt view shifts and is referred to as a scene. The length of a scene
(in I frames) can be modeled by a geometric distribution with a mean of 10.5 I
frames[11]. The density function of the geometric distribution is given below. X
3Motion Picture Experts Group
28

is the distribution of scene length in number of I frames.
fX(x) = p(1� p)x ; p =1
Mean + 1
The size of the �rst I frame in each scene is sampled from a lognormal distri-
bution. Consecutive I frames in the same scene have exactly the same size of the
�rst I frame. The same procedure is applied to each scene.
The Number of Cell per Frame
Compression Pattern (length = 15 frames)
I I
B B B B B B B B B B
P P PP
Figure 3.11: Compression pattern used to generate the video stream
There are three types of coded frames : Intra-coded (I); Prediction (P), and
Bidirectional (B) MPEG frames. These three coded frames are produced in
sequence as shown in Figure 3.11. In other words, the frame type sequence is
IBBPBBPBBPBBPBB. I frame is only sampled once for a scene length. B frame
and P frame are sampled every time they are produced. The sizes of all three
coded frames are found to follow lognormal distributions with di�erent mean
and standard deviation shown in Table 3.1. The density function of a lognormal
distribution is shown below. X is the size of the frames in ATM cells.
fX(x) =1
p2��x
e�1
2�2[ln(x)�m]2 ; X > 0
29

Frame Type Mean (m) Std. Deviation (�)
I 5.1968 0.2016P 3.7380 0.5961B 2.8687 0.2675
Table 3.1: The parameters of I, P, B frame types
3.6 World Wide Web Tra�c
The tra�c of World Wide Web (WWW) has increased exponentially due to the
explosion of the information superhighway. According to the International Data
Corporation, the number of people using the Internet is expected to quintuplet
in just �ve years, from approximately 40 million in 1995 to nearly 200 million by
the year 1999. The number of World Wide Web users is expected to increase by
15 times in the same period[20].
The network tra�c includes a signi�cant portion of tra�c that is generated
by the WWW browsers. The WWW tra�c has been proven to be self-similar
[17]. The model below describes the behavior of the WWW tra�c.
The authors modi�ed the source code of NSCA mosaic in order to collect the
traces and the URL [16]. At that time,Mosaic was the most commonly used web
browser. More recently, many browsers, such as NetScape andMicrosoft Explorer,
are in use. This may result in several di�erences among the characteristics of
the collected data because of the di�erent methods of caching and implemented
document retrieving algorithms.
The study shows that the remote sites account for 70% or greater of the
accesses to the server, and 60% or greater of the bytes transferred [19]. This
implies that the requests and transfers of WWW account for a large portion of
wide area network (WAN) tra�c.
30

Figure 3.12 provides a picture of the WWW tra�c setup. Each request cor-
responds to a data transfer.
Setup
Request
Size
Varible Item (File)
Interarrival Time
Session
Setup
Call
Figure 3.12: WWW Tra�c Setup
3.6.1 WWW Call Level
Mean Inter-Request Times
Depending on the popularity of the sites and the number of users, the system loads
vary. For a 200 user system, the average request load is about 1000 per day. For
a 21000 user system, a peak of 11,000 requests/day is possible. However, some
heavily accessed sites like NCSA4 will have about 400,000 requests/day. Like
TELNET, the WWW tra�c has almost the same 24-hour pattern as shown in
Figure 3.1.
Basically, for a single user, the mean number of requests is 5.75 and standard
deviation of requests is 7.73 over a half-hour period[18]. A homogeneous Poisson
process with a �xed rate can be used to model the tra�c within one-hour intervals.
In other words, the mean inter-request time is exponentially distributed. The
4National Center for Supercomputing Applications
31

probability density function of exponential distribution is shown below.
fX(x) = �e��x ; � = 1=mean
3.6.2 WWW Session Level
Document Transfer Size
The distribution of document transfer size is a Power Law (or Pareto) distribu-
tion. The probability mass function of a pareto distribution is
fX(x) = �k�x���1
and its cumulative distribution function is given by
FX(x) = 1� (k
x)� ; 0:40 � � � 0:63
k � 21 kilobytes
Because of the heavy tail resulting from Pareto distribution, WWW tra�c
contributes to a portion of the self-similarity present on network tra�c.
In another paper by M.F. Arlit and C.L. Williamson[19], the �le size distri-
bution is found to be a Pareto distribution with 0:40 � � � 0:63 and the mean
transfer size is � 21 kilobytes.
The high degree of variation in document size is due in part to the wide
variety of document types accessed on the server. These document types are
HTML, images (gif, jpeg, bitmap), Postscripts, audio (wav, au, ai�, aifc), and
video (MPEG, QuickTime). However, the HTML and image �les accounted for
90-100% of the total requests to the server.
32

Chapter 4
Real Time Implementation of
Tra�c Models in NetSpec
Often, the network performance is represented by the maximum throughput from
one point to another point. To fully understand network performance and be-
havior, more realistic testing scenarios are needed, e.g. ones containing multi-
cross connections, is needed. Due to the limitation of the network testing tools,
researchers are limited from performing more accurate testing of network per-
formance. This led to the development of a new network testing tool, NetSpec
[21].
NetSpec is a tool designed to provide convenient and sophisticated support for
experiments testing the functionality and performance of networks. To accurately
characterizing network behavior and performance, NetSpec provides a wide range
of test types. In addition, one of the NetSpec objectives is to support large scale
distributed experiments. It allows multiple connections over a WAN. The network
investigator speci�es a scenario by using the experimental scripting language. The
script describes how the connections are set up and how data are collected from
33

the experiments. The experiments are automatic and reproducible.
This chapter gives a general description of NetSpec 3.0 and presents how
the random tra�c models in Chapter 3 were implemented in NetSpec. The
implementation of each tra�c type is listed from Section 4.2 to Section 4.6.
4.1 Overview of NetSpec 3.0
NetSpec 3.0 contains many test types. It can generate multiple full blast streams,
CBR streams, and VBR streams at user level from multiple machines according
to user speci�cation.
blocksize blocksize
constant OR variable period
constant OR variable constant OR variable
Figure 4.1: NetSpec's Implementation of Burst
Figure 4.1 shows the basic implementation of bursts in NetSpec. In NetSpec,
tra�c is generated by bursts at the user level, e.g., TCP or UDP. Each burst is
modeled by using two parameters : blocksize in bytes and period in milliseconds.
If blocksize and period are assigned to constants, the tra�c is a CBR stream at
application level. Blocksize and period can be a random variable listed in Table
4.1 to generate any type of VBR tra�c at user level. More detailed information
can be found in [21].
Users may specify any random distributions listed in Table 4.1 to blocksize,
repeats and period by de�ning appropriate parameters. Each period will trigger
a burst. Each burst may consist of multiple number of blocks speci�ed by repeats
with a common size de�ned by blocksize. Other than the required parameters
34

listed in Table 4.1, each distribution can be bounded to a range by setting the
optional parameters, min and max. Figure 4.2 is a sample script of NetSpec
3.0 that generates a simple VBR stream. The blocksize uses an exponential
distribution with lambda = 0.000003815 (mean = 1/lambda � 262144 bytes). In
addition, blocksize is bounded to a min of 8 bytes and a max of 1048576 bytes
(1 MEG). The period uses an uniform distribution with a min of 20 milliseconds
and a max of 200 milliseconds. The duration of the test lasts for 10 seconds.
TCP protocol with a window size of 262144 bytes is implemented. The source
hostname is galaga and the sink hostname is hopper in this case.
cluster {
test galaga {
type = burstq (blocksize=exponential(lambda=0.000003815, min=8, max=1048576),
period=uniform(min=20000, max=200000),
duration=10);
protocol = tcp (window=262144);
own = galaga:53000;
peer = hopper:53000;
}
test hopper {
type = sink (blocksize=1048576, duration=10);
protocol = tcp (window=262144);
own = hopper:53000;
peer = galaga:53000;
}
}
Figure 4.2: Example Script of User Level VBR Tra�c
This simple scripting language allows the network investigator to provide
realistic testing of the network capacity.
35

Random Distributions NetSpec 3.0 Naming Required Parameters
Uniform uniform minmax
Exponential exponential lambdaNormal normal mean
stdDeviation(standard deviation)
Log-Normal logNormal meanstdDeviation
Geometric geometric meanPareto pareto shapeGamma gamma scale
shapeTelnet Session Interarrival Time telnetSessionInterarrival lambdaTelnet Session Duration telnetSessionDuration mean
stdDeviationTelnet Packet Interarrival Time telnetPacketInterarrival Fixed Model
Telnet Packet Size telnetPacketSize Fixed Model
FTP Session Interarrival Time ftpSessionInterarrival lambdaFTP Number Of Items ftpNOfItems Fixed Model
FTP Item Size ftpItemSize Fixed Model
Voice Session Interarrival Time voiceSessionInterarrival lambdaVoice Session Duration voiceSessionDuration lambdaVideo Teleconference Frame Size videoTeleConferenceFrameSize scale
shapeVideo MPEG Frame Size videoMPEGFrameSize sceneLengthMean
ImeanIstdDeviation
PmeanPstdDeviation
BmeanBstdDeviation
WWW Request Interarrival Times WWWRequestInterarrival lambdaWWW Item Size WWWItemSize shape
Table 4.1: Available Random Distributions in NetSpec 3.0
36

4.1.1 Implementations of Interactive Tra�c
(in seconds)
Size
Packet
Duration
Setup
Session
Setup
Call
Session
Interarrival Time
Packet
Interarrival Time
Session
Duration Of
The Test
duration = <distribution>
interarrival = <distribution>
duration = <integer>
period = <distribution>
blocksize = <distribution>
NetSpec 3.0 Script Naming
(in microseconds)
(in bytes)
(in seconds)
(in microseconds)
Figure 4.3: NetSpec's Implementation of Interactive Tra�c
Figure 4.3 illustrates the NetSpec Implementation of interactive tra�c that
described by the Figure 3.2. The script names for the corresponding layers are
duration, interarrival, period, and blocksize. Figure 4.4 shows the sample script
that deploys the interactive tra�c (TELNET tra�c in this example).
37

cluster {
test galaga {
type = session (type = burstq (blocksize=telnetPacketSize,
period=telnetPacketInterarrival,
buffer=262144,
duration=telnetSessionDuration(mean=7.91, stdDeviation=2.96)),
interarrival=telnetSessionInterarrival(lambda=0.0000001),
duration=900);
protocol = tcp (window=262144);
own = galaga:53000;
peer = hopper:53000;
}
test hopper {
type = sink (buffer=262144, duration=900);
protocol = tcp (window=262144, rcvlowat=8);
own = hopper:53000;
peer = galaga:53000;
}
}
Figure 4.4: NetSpec script for interactive tra�c
4.1.2 Implementations of Bulk Transfer Tra�c
(in microseconds)Setup
CallInterarrival Time
Session/Request
Number Of
Size
Setup
Session
Items
Item
Duration Of
The Test
blocksize = <distribution>
repeats = <distribution>
interarrival = <distribution>
duration = <integer>
NetSpec 3.0 Script Naming
(in bytes)
(integer value)
(in seconds)
Figure 4.5: NetSpec's Implementation of Bulk Transfer Tra�c
The NetSpec script names corresponding to the di�erent bulk transfer tra�c
layers are shown in Figure 4.5. Figure 4.6 shows the sample script to setup bulk
transfer tra�c (FTP tra�c in this example).
38

cluster {
test galaga {
type = burstq (blocksize=ftpItemSize,
repeats=ftpNOfItems,
period=ftpSessionInterarrival(lambda=0.00001),
buffer=262144,
duration=1800);
protocol = tcp (window=262144);
own = galaga:53000;
peer = hopper:53000;
}
test hopper {
type = sink (buffer=262144, duration=1800);
protocol = tcp (window=262144, rcvlowat=8);
own = hopper:53000;
peer = galaga:53000;
}
}
Figure 4.6: NetSpec script for bulk transfer tra�c
4.2 TELNET Implementation in NetSpec
cluster {
test galaga {
type = session (type = burstq (blocksize=telnetPacketSize,
period=telnetPacketInterarrival,
buffer=262144,
duration=telnetSessionDuration(mean=7.91, stdDeviation = 2.96),
interarrival=telnetSessionInterarrival(lambda=0.0000001),
duration=900);
protocol = tcp (window=262144);
own = galaga:42000;
peer = hopper:42000;
}
test hopper {
type = sink (buffer=262144, duration=900);
protocol = tcp (window=262144, rcvlowat=8);
own = hopper:42000;
peer = galaga:42000;
}
}
Figure 4.7: NetSpec script for telnet tra�c
Figure 4.7 shows the NetSpec script for telnet tra�c. The function of the
script names can be clearly explained by Figure 4.3. blocksize, period, telnetSes-
sionDuration and telnetSessionInterarrival are the speci�c build-in distributions
for telnet tra�c.
39

4.3 FTP Implementation in NetSpec
cluster {
test galaga {
type = burstq (blocksize=ftpItemSize,
repeats=ftpNOfItems,
period=ftpSessionInterarrival(lambda=0.00001),
buffer=262144,
duration=1800);
protocol = tcp (window=262144);
own = galaga:42000;
peer = hopper:42000;
}
test hopper {
type = sink (blocksize=262144, duration=1800);
protocol = tcp (window=262144);
own = hopper:42000;
peer = galaga:42000;
}
}
Figure 4.8: NetSpec script for ftp tra�c
Figure 4.8 shows the NetSpec script for FTP tra�c. The lambda = 0.00001
is in microsecond unit. It corresponds to 10 FTP session requests/second. Each
FTP session requests will generate multiple items as de�ned by repeats. Thus,
this FTP script generates an emulated FTP tra�c stream which has a mean of
about 10 requestssecond
� 7 items
request� 50000 bytes
item� 8 bits
byte= 28Mbits=sec:
40

4.4 Video MPEG Implementation in NetSpec
cluster {
test galaga {
type = burstq (blocksize=videoMPEGFrameSize(sceneLengthMean=10.5,
Imean=5.1968, IstdDeviation=0.2016,
Pmean=3.7380, PstdDeviation=0.5961,
Bmean=2.8687, BstdDeviation=0.2675),
period=33000,
duration=300);
protocol = tcp (window=262144);
own = galaga:42000;
peer = hopper:42000;
}
test hopper {
type = sink (blocksize=131072, duration=300);
protocol = tcp (window=262144, rcvlowat=8);
own = hopper:42000;
peer = galaga:42000;
}
}
Figure 4.9: NetSpec script for MPEG video stream
Figure 4.9 shows the NetSpec script for MPEG video streams. The frame rate
is speci�ed by period, which is 33msec/frame. This corresponds to 1/0.033 = 30
frames/sec. The frame output sequence is IBBPBBPBBPBBPBB. The means
and standard deviations of each frame are speci�ed by Imean, Pmean, Bmean,
IstdDeviation, PstdDeviation, and BstdDeviation. This script will generate a
single 0.44Mbps MPEG stream. The duration of the test is controlled by duration,
which is 900 seconds.
41

4.5 Video Conferencing Implementation in Net-
Spec
cluster {
test galaga {
type = burstq (blocksize=videoTeleConferenceFrameSize(scale=42.50, shape=3),
period=83000,
duration=600);
protocol = tcp (window=262144);
own = galaga:42000;
peer = hopper:42000;
}
test hopper {
type = sink (buffer=131072, duration=600);
protocol = tcp (window=262144, rcvlowat=8);
own = hopper:42000;
peer = galaga:42000;
}
}
Figure 4.10: NetSpec script for teleconferencing video stream
Figure 4.10 shows the NetSpec script for a single teleconferencing video stream.
The frame rate, inverse of period, is 1/0.083 = 12 frames/sec. The frame size is
represented by blocksize in the script and has a gamma distribution. Thus, scale
and shape are the primary parameters to specify the distribution of the frame
size. This script will generate a single 0.77Mbps teleconferencing video stream.
42

Chapter 5
Validation of Tra�c Models
Implementation
This section presents the validation of each individual tra�c model that has been
implemented in NetSpec 3.0. Each tra�c model is validated by generating its
tra�c using NetSpec from one workstation to another workstation. The emulated
tra�c is then captured by KU's ATM tra�c data collector. This data collector
sends multiple Simple Network Management Protocol (SNMP) queries to the
ATM switches to obtain data from various switch counters for every minute.
The data is collected and stored in KU AAI ATM tra�c database for analysis
purpose. The validation of ftp, WWW, MPEG, and Video Conference tra�c are
presented here.
43

5.1 FTP Models
0 100 200 300 400 500 600 700 8000
5
10
15
20
25
30
Time (Minutes)
Rat
e (M
bps)
Figure 5.1: Emulated Daily FTP Tra�c
Figure 5.1 is the emulated daily FTP tra�c generated by NetSpec and cap-
tured by KU's ATM data collector. Figure 5.2 is the calculated mean of FTP
tra�c. The NetSpec script is included in Appendix A.1. The tra�c consists of 24
segments. Each segment lasts half an hour. The interarrival rate of FTP session
requests is modeled as an exponential distribution. Each segment has di�erent
value of lambda (�) shown in Table 5.1. The peak hourly average rate of the
whole daily tra�c is set to be 10Mbps. The averages of FTP item and FTP
number of item per connection are 50000 bytes and 7 items. Interarrival rates of
FTP sessions can be easily derived by using the Equation 5.1. By closely exam-
ining the emulated tra�c in Figure 5.1, we can see the it matches the predicted
averages of the curve shown in Figure 5.2.
44

0 5 10 15 20 250
5
10
15
20
25
30
Time (Hours)
Cal
cula
ted
Mea
n of
FT
P T
raffi
c Lo
ad (
Mbp
s)
Figure 5.2: Calculated Mean of Daily FTP Tra�c
InterarrivalRate(second=session) = ThroughputMbits
sec�
1bytes
session� 8 bits
byte
(5.1)
45

Segment No. Interarrival Rate (second/session) Lambda (�)
1 0.8787 0.000001138
2 1.1723 0.000000853
3 1.5060 0.000000664
4 2.1097 0.000000474
5 1.9194 0.000000521
6 1.5060 0.000000664
7 1.0549 0.000000948
8 0.6394 0.000001564
9 0.4794 0.000002086
10 0.3836 0.000002607
11 0.3196 0.000003129
12 0.3014 0.000003318
13 0.3516 0.000002844
14 0.3458 0.000002892
15 0.2670 0.000003745
16 0.2971 0.000003366
17 0.2740 0.000003650
18 0.3638 0.000002749
19 0.5408 0.000001849
20 0.7813 0.000001280
21 0.6592 0.000001517
22 0.6394 0.000001564
23 0.5701 0.000001754
24 0.8969 0.000001185
Table 5.1: Interarrival Rates and lambda for FTP Sessions
46

5.2 WWW Models
0 100 200 300 400 500 600 700 8000
5
10
15
20
25
30
35
40
45
50
Time (Minutes)
Rat
e (M
bps)
Figure 5.3: Emulated Daily WWW Tra�c
Figure 5.3 is the emulated WWW tra�c generated by NetSpec. Figure 5.4
is the calculated mean of daily WWW tra�c. The NetSpec script is included
in Appendix A.2.. The script contains 24 segments. Each segment is con�gured
to have a duration of 30 minutes. The interarrival time of WWW requests is
modeled as an exponential distribution. The lambdas of each segment listed in
Table 5.2 are calculated to follow the variation of daily usage depicted in Figure
3.1 using the Equation 5.1. WWW items have an average of 95K bytes. Again, if
we closely examine Figure 5.3, we can notice that its average matches the curve
presented in Figure 5.4.
If we compare the emulated tra�c between FTP (Figure 5.1) and WWW
(Figure 5.3), we notice that the WWW tra�c is more bursty than FTP tra�c.
This is because the model of WWW tra�c is using a Pareto distribution, where
as the model of FTP tra�c is using �xed statistics from a table in NetSpec
47

0 5 10 15 20 250
5
10
15
20
25
30
35
40
45
50
Time (Hours)
Cal
cula
ted
Mea
n of
WW
W T
raffi
c Lo
ad (
Mbp
s)
Figure 5.4: Calculated Mean of Daily WWW Tra�c
implementation. Unlike FTP tra�c, WWW tra�c consists of many multimedia
transfers, such as graphic, voice, and video. Thus, WWW tra�c shows more
burstiness than FTP tra�c.
48

Segment No. Interarrival Rate (second/request) Lambda
1 0.3625 0.000002759
2 0.3346 0.000002989
3 0.3107 0.000003219
4 0.2899 0.000003449
5 0.2718 0.000003679
6 0.2416 0.000004139
7 0.0217 0.000004599
8 0.1318 0.000007588
9 0.0945 0.000010578
10 0.0870 0.000011498
11 0.0836 0.000011957
12 0.0870 0.000011498
13 0.0821 0.000012187
14 0.0791 0.000012647
15 0.0777 0.000012877
16 0.0725 0.000013797
17 0.0879 0.000011383
18 0.1087 0.000009198
19 0.1318 0.000007588
20 0.1611 0.000006209
21 0.1850 0.000005404
22 0.1933 0.000005174
23 0.2718 0.000003679
24 0.3625 0.000002759
Table 5.2: Interarrival Rates and lambda for WWW Connections
49

5.3 MPEG Models
0 200 400 600 800 1000 1200 1400 1600 18000
1
2
3
4
5
6
7
Time (seconds)
Rat
e (M
bps)
Figure 5.5: Emulated Tra�c of 12 MPEG Video Streams
Figure 5.5 is the emulated MPEG tra�c. The tra�c consists of 12 MPEG
streams. The mean throughput for each MPEG stream is about 0.44 Mbits/sec.
The total aggregate throughput is about 5 Mbits/sec. The duration of this test
is about half an hour. The NetSpec script is in Appendix A.3. From Figure 5.5,
we observe that the tra�c varies between 4 and 6 Mbits/sec and has a mean of
about 5 Mbits/sec.
50

5.4 Video Conferencing Models
0 200 400 600 800 1000 1200 1400 1600 18000
1
2
3
4
5
6
7
8
Time (seconds)
Rat
e (M
bps)
Figure 5.6: Emulated Tra�c of 7 Videoconferencing Streams
Figure 5.6 is the emulated Video Conferencing tra�c. The tra�c consists
of 7 video streams. The mean throughput for each video stream is about 0.7
Mbits/sec. The total aggregate throughput is about 5 Mbits/sec. The duration
of the test is about half an hour. The NetSpec script is in Appendix A.4. The
tra�c shown in Figure 5.6 varies between 4 and 6 Mbits/sec and has a mean of
about 5 Mbits/sec.
51

Chapter 6
WAN Experiments
ATM experiments are often limited to point-to-point maximum throughput mea-
surements. These experiments are designed to address the maximum capacity
of the link rate. However, maximum throughput is only part of network perfor-
mance. Networks are multi-user and multi-tra�c type environments. To fully
understand network performance, congestion scenarios must be taken into con-
sideration when doing network testing. This chapter presents the ATM WAN
congestion experiments using emulated tra�c to evaluate other network per-
formance factors, such as delay jitter, and packet loss. The emulated tra�c
represents the tra�c generated by regular network users. In addition, the combi-
nation of transport-level ow-control (TCP) and ATM level tra�c shaping tech-
nique (Cell Pacing) is also evaluated. There were several network changes after
September 1997 for the AAI network. It is interesting to evaluate how network
changes impact the performance. Therefore, several experiments were chosen to
rerun. Comparison of network performance before and after the network changes
is presented in section 6.5.
Figure 6.1 shows the basic network con�guration for the tra�c contention
52

Hostname : arl.atm.ittc.ukans.edu
FORE ASX 200ARL Switch
AAI
Hardware Platform : DEC Alpha AXP-3000/700Operating System : Digital Unix V4.0
ATM Interface : DEC ATMworks-750
Hardware Platform : DEC Alpha AXP-3000/700Operating System : Digital Unix V4.0
ATM Interface : DEC ATMworks-750
Hostname : nrl.atm.ittc.ukans.edu
Hardware Platform : DEC Alpha AXP-3000/700Operating System : Digital Unix V4.0
ATM Interface : DEC ATMworks-750
Hostname : nccosc.atm.ittc.ukans.edu
FORE ASX 200BXNCCOSC Switch
ATM Device Driver : Digital Unix 4.0 standard
ATM Device Driver : Digital Unix 4.0 standard
ATM Device Driver : Digital Unix 4.0 standard
GSD Switch
OC-3
FORE ASX 200
ATM Interface : DEC ATMworks-750
Hardware Platform : DEC Alpha AXP-3000/700Operating System : Digital Unix V4.0
ATM Device Driver : Digital Unix 4.0 standard
Hardware Platform : DEC Alpha AXP-3000/700Operating System : Digital Unix V4.0
Hostname : hopper.atm.ittc.ukans.edu
ATM Interface : DEC ATMworks-750ATM Device Driver : Digital Unix 4.0 standard
Hardware Platform : DEC Alpha AXP-3000/700Operating System : Digital Unix V4.0
ATM Interface : DEC ATMworks-750ATM Device Driver : Digital Unix 4.0 standard
Hostname : galaga.atm.ittc.ukans.edu
ITTC SwitchTarget Traffic Flow- Constant Bit Rate Stream
- WWW Traffic- Teleconferencing Video Streams
Background Traffic
- MPEG Video Streams- FTP TrafficBackground Traffic
Hostname : elmer.atm.ittc.ukans.edu
S_ForeThought_4.1.0 (1.74)
S_ForeThought_4.1.0 (1.74)FORE ASX 200BX
NRL Switch
S_ForeThought_4.1.0 (1.74) S_ForeThought_4.1.0 (1.74)
S_ForeThought_4.1.0 (1.74)
TIOC SwitchFORE ASX 1000
FORE ASX 1000
S_ForeThought_4.1.0 (1.74)
OC-12
OC-3
OC-3
OC-3
OC-3
OC-3
OC-3
OC-3
OC-3
OC-3
OC-3
Figure 6.1: Network Con�guration for ITTC to AAI Connections
experiments. A DEC Alpha AXP-3000/700 workstation (galaga.atm) at Infor-
mation & Telecommunication Technology Center (ITTC) at Lawrence, Kansas is
con�gured to generate emulated FTP tra�c and multiple MPEG video streams
as speci�ed in Table 6.1 . The destination of these ows are a similar workstation
(nrl.atm) at Naval Research Laboratory (NRL-DC), Washington, D.C.. Another
DEC Alpha AXP-3000/700 workstation (hopper.atm) at ITTC is also con�gured
to generate emulated WWW tra�c and multiple teleconferencing video streams
as speci�ed in Table 6.1 where the destination for these ows are a similar work-
station (arl.atm) at Army Research Laboratory at Washington, D.C.. These two
pairs of con�guration (galaga at ITTC to NRL-DC, hopper at ITTC to ARL)
are responsible to generate multi-type background tra�c using the TCP protocol.
53
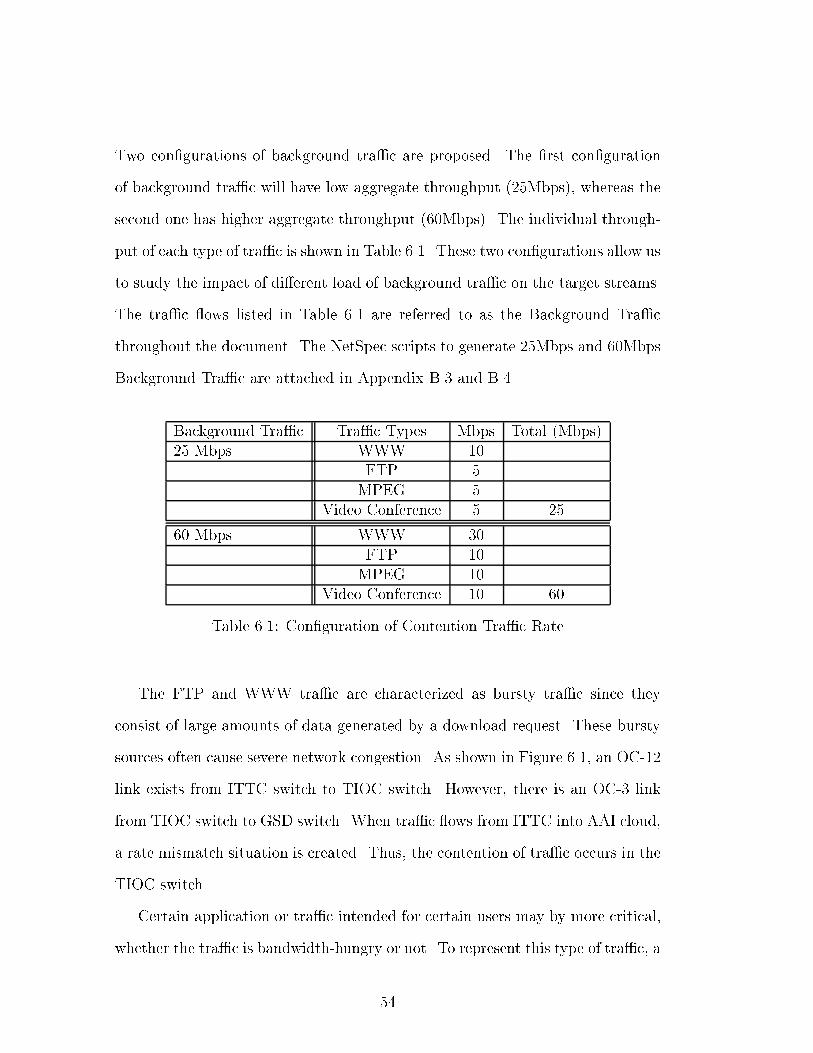
Two con�gurations of background tra�c are proposed. The �rst con�guration
of background tra�c will have low aggregate throughput (25Mbps), whereas the
second one has higher aggregate throughput (60Mbps). The individual through-
put of each type of tra�c is shown in Table 6.1. These two con�gurations allow us
to study the impact of di�erent load of background tra�c on the target streams.
The tra�c ows listed in Table 6.1 are referred to as the Background Tra�c
throughout the document. The NetSpec scripts to generate 25Mbps and 60Mbps
Background Tra�c are attached in Appendix B.3 and B.4.
Background Tra�c Tra�c Types Mbps Total (Mbps)25 Mbps WWW 10
FTP 5MPEG 5
Video Conference 5 25
60 Mbps WWW 30FTP 10MPEG 10
Video Conference 10 60
Table 6.1: Con�guration of Contention Tra�c Rate
The FTP and WWW tra�c are characterized as bursty tra�c since they
consist of large amounts of data generated by a download request. These bursty
sources often cause severe network congestion. As shown in Figure 6.1, an OC-12
link exists from ITTC switch to TIOC switch. However, there is an OC-3 link
from TIOC switch to GSD switch. When tra�c ows from ITTC into AAI cloud,
a rate mismatch situation is created. Thus, the contention of tra�c occurs in the
TIOC switch.
Certain application or tra�c intended for certain users may by more critical,
whether the tra�c is bandwidth-hungry or not. To represent this type of tra�c, a
54

DEC Alpha AXP-3000/700 workstation (elmer.atm) at ITTC will generate tra�c
ows at various rates to a similar workstation (nccosc.atm) at Naval Command
Control and Ocean Surveillance Center (NCCOSC), San Diego, California, using
TCP and UDP protocols de�ned in each experiment under the contention of the
background tra�c mentioned above. The tra�c ows are constant bit rate (CBR)
streams at user level (TCP or UDP) from 5Mbps to 30Mbps in an increment of
5Mbps (i.e. 5,10,15,20,25,30) listed in Table 6.2. This allows us to study how the
user level CBR target ows are a�ected at di�erent source rate. Throughout the
document, the tra�c ows are referred to as the Target Flows. The performance
of the target ows under the impact of bursty background tra�c is evaluated
and studied. The NetSpec scripts to generate TCP and UDP target ows from
5Mbps to 30Mbps are attached in Appendix B.1 and B.2.
Target Flow Blocksize (bytes) Period (ms) Rate (Mbps)5Mbps 9140 14 5.2210Mbps 18280 14 10.4515Mbps 27420 14 15.6720Mbps 36560 14 20.8925Mbps 45700 14 26.1130Mbps 54840 14 31.34
Table 6.2: Target Flow Throughput
6.1 Performance Metrics
Two performance metrics are de�ned and evaluated for each experiment. They
are listed as follow :
� Standard Deviation of Network Jitter (ms).
Tra�c congestion often occurs when multiple bursty streams compete for
55

the same destination. This results in cells being dropped in ATM net-
works. For TCP network connections, lost data will be retransmitted when
the TCP timer expires. However, this introduces inconsistent data arrival
intervals at the receiving ends, which is referred to as delay jitter or net-
work jitter. User applications only see packet level performance, not ATM
cell level performance. Some time-sensitive applications, such as video and
voice, are not tolerant of such delay jitter introduced by networks. For these
experiments, delay jitter of the target ows at packet level is evaluated.
Timestamp and sequence numbers of each packets are recorded both at the
transmitting and receiving ends. To derive the delay jitter, clock synchro-
nization is not necessary. This is because jitter is calculated as a di�erence
of time for two sequential packets. The formula to calculate delay jitter is
listed in Equation 6.1.
J(n) = [TR(n)� TR(n� 1)]� [TT (n)� TT (n� 1)] (6.1)
J(n) is the delay jitter of nth packet. TR(n) is the received timestamp of
nth packet. TT (n) is the transmitted timestamp of nth packet. Delay jitter
is de�ned as the di�erence of received timestamps minus the di�erence of
transmitted timestamps. As a result, there are n-1 delay jitter for a total
of n packets. To represent the variation of delay jitter, standard deviation
is used.
� Percentage of UDP Segment Losses.
Unlike TCP, UDP does not ensure data is safely received at the other end.
If cells are dropped because of tra�c congestion, other cells in the same
UDP packet are discarded due to incomplete error at the receiving host.
56

For the UDP experiments, the loss of UDP packets are evaluated. By co-
relating the records of UDP segments using the sequence number, we can
easily derive the UDP segment losses. The equation 6.2 is used to calculate
percentage of segment losses.
SegmentLosses(%) = NumberofMissingSegments
NumberofTransmittedSegments� 100% (6.2)
The design of transport-level ow control schemes, such as TCP, is to have
better control of the tra�c streams being transmitted in a resources-shared net-
work environment. However, especially in high-speed networks, the ow control
schemes alone are not e�cient enough. To optimize the network resources and to
achieve better performance, the combination of ow control and tra�c shaping
should be used.
The idea of cell level tra�c shaping is to alter the tra�c characteristics of the
stream of cells on every virtual connection in order to optimize the use of network
resources. The ow of ATM cells through each connection is regulated so as to
stay within the agreed limits. Short bursts of data are bu�ered on the board and
then released at a controlled rate. Several mechanisms, such as leaky-bucket,
have been adapted to control the ow of ATM cells. Often, the burstiness of the
tra�c is the major cause of congestion and cell drops in ATM networks. One of
the simplest ways is to limit the peak rate of all the virtual connections such that
the network resources are optimized. Cell level pacing allows the ATM cells are
transmitted at a �xed rate into the network. Figure 6.2 illustrates the e�ect of
cell level pacing on user tra�c.
Three cases are de�ned below to study the e�ect of tra�c shaping.
� No Cell Level Pacing.
57

Time
Traffic Shaping
Network
Time
Rat
e
User Traffic
Figure 6.2: E�ect of Cell Level Pacing
Each workstation is con�gured to fully utilized the OC-3 bandwidth. In
other words, all the hosts are able to transmit back-to-back cells into the
network and no tra�c shaping is applied. The results are presented in
section 6.2.
� Cell Level Pacing on Target Flows.
The workstation (elmer.atm) that transmits target ows is con�gured to
transmit cells at a �xed rate. In other words, cells of target ows are evenly
transmitted into the network. Tra�c shaping is applied to the target ows.
The results are presented in section 6.3.
� Cell Level Pacing on Background Tra�c.
The workstations (galaga.atm, hopper.atm) are con�gured to transmit cells
at a �xed rate. In other words, cells of background tra�c are evenly trans-
mitted into the network. Tra�c shaping is applied to the background tra�c.
Summary of results can be found in section 6.4.
58

6.2 No Cell Level Pacing
5 10 15 20 25 30
0
20
40
60
80
100
120
140
160
180
200
Target Flow Throughput (Mbps)
Std
Dev
iatio
n of
NJ
(ms)
No Background Traffic (6/4/97) 25Mbps Background Traffic (6/4/97)60Mbps Background Traffic (6/4/97)
Figure 6.3: Standard Deviation (ms) of Network Jitter of TCP Target Flows fromITTC to AAI cloud
In this experiment, each workstation was con�gured to fully utilize the OC-3
bandwidth. In other words, all the hosts were able to transmit back-to-back cells
at OC-3 rate into the network.
Figure 6.3 shows the standard deviation of delay jitter of packets from the
target ows using TCP protocol. The X-axis is the target ow throughput. The
Y-axis is the standard deviation of network jitter in milliseconds. The solid line is
the result of the target ow test alone. The workstation (elmer.atm) transmitted
the target ows from 5Mbps to 30Mbps in an increment of 5Mbps as speci�ed
in Table 6.2 to nccosc.atm. The objective of this test was intended to establish
the baseline for comparison when there was no tra�c contention in the network.
We observed no variation of interarrival time for TCP segments. However, note
that the standard deviation is not zero in Figure 6.3 even when no other cross
59

tra�c existed on the same path during the measurements. This is because the
workstation's timestamps at application level have a resolution of 1ms. Therefore,
the solid line in Figure 6.3 is not on the zero line.
The dashed line is the result of 25 Mbps Background Tra�c test. In this
test, we added 25Mbps Background Tra�c into the network. The workstations
galaga.atm and hopper.atm were con�gured to generate a total of 25Mbps Back-
ground Tra�c as speci�ed in Table 6.1 while elmer.atm transmitted the target
ows from 5Mbps to 30Mbps. Since the background tra�c consisted of bursty
streams and target ows were transmitted as chunks of back-to-back cells to the
same destination, tra�c congestion occurred. If some cells are lost in the network,
the source will retransmit the whole TCP packet when the TCP retransmission
timer expires. This introduces the delay in the delivery of the data. From the
Figure 6.3, we can see that the standard deviation of network jitter of target ows
increases linearly up to 120ms as the rate of target ows increases from 5Mbps to
30Mbps. The 25Mbps Background Tra�c competes with the target ows. Thus
cells are dropped at the congestion point and some of the TCP packets of target
ows have to be retransmitted. As a result, delay of data arrival is introduced.
The dashed line with asterisks is the result of 60Mbps Background Tra�c test.
The aggregate throughput of background tra�c was increased from 25Mbps to
60Mbps as speci�ed in Table 6.1 to show how Background Tra�c a�ected the
target ows. As the throughput of target ows increases from 5Mbps to 30Mbps
along with the 60Mbps Background Tra�c over the same link, the standard
deviation of network jitter as shown in Figure 6.3, increases up to about 190 ms.
Following the slopes of the curves, we conclude that the 60Mbps Background
Tra�c introduces more tra�c contention and cells are more likely to be dropped.
Thus, the standard deviations of network jitter for target ows in the 60Mbps
60

test are expected to b higher than those in the 25Mbps test.
5 10 15 20 25 30
0
100
200
300
400
500
600
Target Flow Throughput (Mbps)
Std
Dev
iatio
n of
NJ
(ms)
No Background Traffic (7/19/97) 25Mbps Background Traffic (7/26/97)60Mbps Background Traffic (7/26/97)
Figure 6.4: Standard Deviation (ms) of Network Jitter of TCP Target Flows fromAAI cloud to ITTC
Network connections are directional. The forward and backward paths of a
network connection, especially in WAN, often encounter tra�c congestion at dif-
ferent geographical locations within the networks. This asymmetrical network
structure may permit better performance for transmission for one direction com-
pared to the other one. In the next test, the directions of background tra�c and
target ows were reversed. In other words, the tra�c streams owed from AAI
cloud to ITTC site. This would create the congestion point inside the AAI cloud.
Figure 6.4 shows the standard deviation of network jitter of TCP target ows
from AAI cloud to ITTC. Note that the standard deviation increases proportion-
ally to the rate of target ow and background tra�c. However, it also shows that
the target ows exhibit more tra�c congestion when the congestion is inside the
AAI cloud. By comparing the results of Figure 6.4 and Figure 6.3, the target
ows have better performance when the connection is going from ITTC to AAI
61

cloud. This can be explained by the large bu�er setting in TIOC's FORE ASX
1000 switch and the OC-12 to OC-3 situation on the direction of forward path
from TIOC to GSD switch. When the tra�c ows from the three workstations
at ITTC to TIOC, the OC-12 connection is able to absorb the 3 smaller OC-3
tra�c streams even at the full bandwidth rate. In addition, the large bu�er at
TIOC switch will smooth the bursty tra�c from the OC-12 to OC-3 bottleneck.
All of these factors lead to better network performance under the scenario of the
TIOC switch as the congestion point.
62

5 10 15 20 25 300
1
2
3
4
5
6
Target Flow Throughput (Mbps)
Std
Dev
iatio
n of
NJ
(ms)
No Background Traffic (5/22/97) 25Mbps Background Traffic (5/22/97)60Mbps Background Traffic (5/22/97)
Figure 6.5: Standard Deviation (ms) of Network Jitter of UDP Target Flowsfrom ITTC to AAI cloud
Often, the retransmission of data will expand transient period of tra�c con-
gestion in networks since more data is transmitted. In addition, retransmission
is not necessary for some applications, such as real-time video and voice streams.
To examine the delay jitter without the e�ect of retransmission, UDP protocol
was used on target ows. UDP is also considered to evaluate the packet loss
characteristic of these networks. In the next test, we used the UDP protocol
instead of TCP protocol for target ows while maintaining the same network
con�gurations.
Figure 6.5 is the result of using UDP protocol on target ows for the ITTC to
AAI cloud scenario. The standard deviation of network jitter increases slowly as
the rate of target ows increases for two Background Tra�c tests. However, the
delays do not vary as much when compared to TCP result in Figure 6.3. This is
because there is not retransmission for UDP. Once some cells of UDP packets are
dropped in the network due to tra�c congestion, the whole UDP segment will
63

be discarded at the receiving end. However, note that the standard deviation
increased from about 1.5ms to 3ms. The slight increase of the standard deviation
is caused by the long delay of queueing due to the increase in the rate of target
ows and the background tra�c streams. Actually, the long queueing delay is
also included in the TCP results shown in Figure 6.3, but the delay introduced
by retransmission of data is more dominant.
5 10 15 20 25 30
0
5
10
15
20
25
30
35
Target Flow Throughput (Mbps)
Std
Dev
iatio
n of
NJ
(ms)
No Background Traffic (7/20/97) 25Mbps Background Traffic (8/4/97) 60Mbps Background Traffic (8/21/97)
Figure 6.6: Standard Deviation (ms) of Network Jitter of UDP Target Flowsfrom AAI cloud to ITTC
Figure 6.6 shows the standard deviation of network jitter of UDP target ows
from AAI cloud to ITTC. Compared to the result of forward path from ITTC
to AAI, the result of reserved path shows signi�cant increases in the delay jitter.
The standard deviation has increased from a maximum of 3ms on forward paths
to a maximum of 30ms on reserved paths. This increase obviously depicts the
asymmetrical network performance in the direction of connections because of the
change of tra�c congestion point.
64

5 10 15 20 25 30−0.2
0
0.2
0.4
0.6
0.8
1
1.2
1.4
Target Flow Throughput (Mbps)
Loss
es o
f UD
P S
egm
ents
(%
)
No Background Traffic (5/22/97) 25Mbps Background Traffic (5/22/97)60Mbps Background Traffic (5/22/97)
Figure 6.7: Percentage of UDP Segment Losses of UDP Target Flows from ITTCto AAI cloud
Since UDP does not retransmit the lost data, UDP packets are discarded at
the receiving ends when some cells are dropped. Figure 6.7 shows the losses of
UDP segments of target ows in percentage for the connection originated from
ITTC to AAI cloud. The target ows su�er up to 1.3% of segment losses. As
expected, the percentage of losses is proportional to the standard deviation of
network jitter.
65

5 10 15 20 25 30
0
5
10
15
20
25
Target Flow Throughput (Mbps)
Loss
es o
f UD
P S
egm
ents
(%
)
No Background Traffic (7/20/97) 25Mbps Background Traffic (8/4/97) 60Mbps Background Traffic (8/21/97)
Figure 6.8: Percentage of UDP Segment Losses of UDP Target Flows from AAIcloud to ITTC
Figure 6.8 shows the percentage of UDP segment losses on the reserved path.
A maximum of 22% UDP packet loss was observed. As expected, the target ows
su�er higher losses which are proportional to the delay jitter shown in Figure 6.6.
In this case, the packet losses are signi�cant.
66

6.3 Cell Level Pacing on Target Flows
To study how cell level pacing a�ects network performance, the host interface
of elmer.atm was con�gured to transmit cells at a �xed rate. All cells were
periodically transmitted from elmer.atm. The peak cell rates of the host interface
were con�gured as listed in Table 6.3 for each target ow. Notice that the pacing
rates in column 3 are slightly higher than the NetSpec throughput in column 2
of Table 6.3. This is to include the overhead of TCP layer, UDP layer, AAL5,
and ATM layer.
Target NetSpec Throughput (Mbps) Pacing Rate (Mbps)Flow at User Level at Host Interface5Mbps 5.22 6.26710Mbps 10.45 12.53525Mbps 15.67 18.80220Mbps 20.89 25.06925Mbps 26.11 31.33630Mbps 31.34 37.604
Table 6.3: Pacing Rates for Target Flows
The same set of tests described in the previous section were repeated and the
results were compared to examine the e�ect of cell level pacing in all cases. Figure
6.9 is the TCP result of cell level paced target ows for the ITTC to AAI cloud
experiment. The background tra�c were still transmitted as bursty streams and
were able to peak at OC-3 bandwidth. However, the cells of target ows were
transmitted at a �x interval instead of groups of back-to-back cells. Figure 6.9
implies that the existence of Background Tra�c does not induce any degradation
on performance of target ows. The nearly at lines in Figure 6.9 indicate that
the target ows did not su�er any tra�c contention once cell level pacing was
used on target ows. No cell losses on target ows were reported. However, cell
67

5 10 15 20 25 30−20
0
20
40
60
80
100
120
140
160
180
200
Target Flow Throughput (Mbps)
Std
Dev
iatio
n of
NJ
(ms)
No Background Traffic (6/22/97) 25Mbps Background Traffic (6/23/97)60Mbps Background Traffic (6/23/97)
Figure 6.9: Standard Deviation (ms) of Network Jitter of Cell Level Paced TCPTarget Flows from ITTC to AAI cloud
losses were observed on Background Tra�c.
On the contrary, the result of reversed path in Figure 6.10 shows tremendous
increase in delay jitter of target ows once cell level pacing technique is used.
The standard deviation jumps from 350ms of no cell level pacing to 600ms of cell
level pacing on target ows. This indicates that the cell level pacing on the target
ows does not necessarily improve the performance.
68

5 10 15 20 25 30
0
100
200
300
400
500
600
Target Flow Throughput (Mbps)
Std
Dev
iatio
n of
NJ
(ms)
No Background Traffic (7/19/97) 25Mbps Background Traffic (8/21/97)60Mbps Background Traffic (8/21/97)
Figure 6.10: Standard Deviation (ms) of Network Jitter of Cell Level Paced TCPTarget Flows from AAI cloud to ITTC
Similar result was observed for the UDP tests shown in Figure 6.11. The
increase of Background Tra�c from 25Mbps to 60Mbps does not have any e�ect
on target ows. In addition, no UDP segments were lost as observed from the
Figure 6.12. In other words, target ows, either using UDP or TCP, do not su�er
tra�c contention once cell level pacing is used for the paths from ITTC to AAI
cloud.
69

5 10 15 20 25 300
1
2
3
4
5
6
Target Flow Throughput (Mbps)
Std
Dev
iatio
n of
NJ
(ms)
No Background Traffic (6/5/97) 25Mbps Background Traffic (6/18/97)60Mbps Background Traffic (6/18/97)
Figure 6.11: Standard Deviation (ms) of Network Jitter of Cell Level Paced UDPTarget Flows from ITTC to AAI cloud
For UDP connection from AAI cloud to ITTC shown in Figure 6.13, the delay
jitter depicts the same behavior as that observed on the target ows encountered
in TCP connection. The standard deviation of UDP connection increases from
2ms of no cell level pacing to 23ms of cell level pacing on target ows. Similarly,
the percentage of UDP segment losses increases proportionally to the variation
of delay jitter.
70

5 10 15 20 25 30−0.2
0
0.2
0.4
0.6
0.8
1
1.2
1.4
Target Flow Throughputs (Mbps)
Loss
es o
f UD
P S
egm
ents
(m
s)
No Background Traffic (6/5/97) 25Mbps Background Traffic (6/18/97)60Mbps Background Traffic (6/18/97)
Figure 6.12: Percentage of Segment Losses of Cell Level Paced UDP Target Flowsfrom ITTC to AAI cloud
6.4 Cell Level Pacing on Background Tra�c
In the following tests, the background tra�c streams instead of target ows were
paced. Target ows were transmitted as groups of back-to-back cells, where as
the Background Tra�c were transmitted as evenly cell paced streams. The host
interfaces on both galaga.atm and hopper.atm were con�gured to have the peak
cell rates as listed in Table 6.4 and Table 6.5 for 25Mbps and 60Mbps Background
Tra�c tests, respectively.
The values of target ows listed in Table 6.3 were subtracted from the OC-3
bandwidth and then proportionally divided the remaining bandwidth and as-
signed to the two Background Tra�c pairs. Therefore, I explicitly and manually
set the maximum transmission rate for the two Background Tra�c links. The
background tra�c in this network con�guration can also be viewed as using an
ideal Available Bit Rate (ABR) service. In ABR service, connections are con�g-
71

5 10 15 20 25 30
0
5
10
15
20
25
30
35
Target Flow Throughput (Mbps)
Std
Dev
iatio
n of
NJ
(ms)
No Background Traffic (8/10/97) 25Mbps Background Traffic (8/4/97) 60Mbps Background Traffic (8/21/97)
Figure 6.13: Standard Deviation (ms) of Network Jitter of Cell Level Paced UDPTarget Flows from AAI cloud to ITTC
ured to utilize the maximum available amount of network resources (bandwidth
in this case).
72

5 10 15 20 25 30
0
5
10
15
20
25
Target Flow Throughput (Mbps)
Loss
es o
f UD
P S
egm
ents
(%
)
No Background Traffic (8/10/97) 25Mbps Background Traffic (8/4/97) 60Mbps Background Traffic (8/21/97)
Figure 6.14: Percentage of Segment Losses of Cell Level Paced UDP Target Flowsfrom AAI cloud to ITTC
Figure 6.15 and 6.16 are the TCP results of target ows with cell level paced
Background Tra�c for the forward (from ITTC to AAI cloud) and reversed (from
AAI cloud to ITTC) paths. Compared to the TCP results of no cell level pacing
in Figure 6.3 and 6.4, they show that the cell level paced background tra�c does
improve end-to-end performance even though the target ows are transmitted as
groups of back-to-back cells. This is because a certain bandwidth has been re-
served for the target ows. The Background Tra�c only consumes the remaining
bandwidth over the same link. This demonstrates the potential e�ciency of ABR
service in a "realistic" network.
73

Target ARL to hopper NRL to galagaFlow WWW and TeleConferencing FTP and MPEG5Mbps 87.55Mbps 57.70Mbps10Mbps 83.79Mbps 55.19Mbps15Mbps 80.03Mbps 52.68Mbps20Mbps 76.27Mbps 50.18Mbps25Mbps 72.51Mbps 47.67Mbps30Mbps 68.75Mbps 45.16Mbps
Table 6.4: 25Mbps Background Tra�c Pacing Rates
Target ARL to hopper NRL to galagaFlow WWW and TeleConferencing FTP and MPEG5Mbps 97.50Mbps 47.75Mbps10Mbps 93.32Mbps 45.66Mbps15Mbps 89.14Mbps 43.57Mbps20Mbps 84.96Mbps 41.48Mbps25Mbps 80.79Mbps 39.39Mbps30Mbps 76.61Mbps 37.31Mbps
Table 6.5: 60Mbps Background Tra�c Pacing Rates
For UDP tests of forward and reversed paths, the results shown in Figure 6.17
and 6.18 indicate that the standard deviation of network jitter remains constant
as the rate of target ow increases steadily. However, a small percent of UDP
packet losses is reported as shown in Figure 6.19 and Figure 6.20. Notice that the
results in Figure 6.17 have much higher values of standard deviation (about 5ms)
compared to Figure 6.11. This is because several scripts were running on the
workstations to capture the statistics on the host interface. Thus, a higher CPU
load was introduced. Consequently, the delay of processing is increased on the
workstations. This illustrates the potential impact of the host state on network
performance. This set of experiments was the �rst set of all the experiments and
74

5 10 15 20 25 30−20
0
20
40
60
80
100
120
140
160
180
200
Target Flow Throughput (Mbps)
Std
Dev
iatio
n of
NJ
(ms)
No Background Traffic (6/4/97) 25Mbps Background Traffic (7/3/97) 60Mbps Background Traffic (7/9, 7/10/97)
Figure 6.15: Standard Deviation (ms) of Network Jitter of TCP Target Flowwith Cell Level Paced Background Tra�c from ITTC to AAI cloud
was done on 5/22/971. The capturing scripts were later modi�ed and enhanced.
No similar problem was observed for the rest of the experiments.
1Please refer to the Table 7.1
75

5 10 15 20 25 30
0
100
200
300
400
500
600
Target Flow Throughput (Mbps)
Std
Dev
iatio
n of
NJ
(ms)
No Background Traffic (7/19/97) 25Mbps Background Traffic (8/9/97) 60Mbps Background Traffic (8/10/97)
Figure 6.16: Standard Deviation (ms) of Network Jitter of TCP Target Flowwith Cell Level Paced Background Tra�c from AAI cloud to AAI
6.5 Comparison of Network Performance After
Network Upgrades
Several network changes have occurred after 10/1/97. To evaluate the impact of
the network changes, the worst case scenarios, which are the 60Mbps Background
Tra�c tests, were selected and re-run. The following tests in this section were
conducted by Mike Linhart [23]. The network changes after 10/1/97 are listed
as follows :
� Nortel Vector ATM Switches were added as edge switches for the AAI net-
work.
Before the network upgrades, almost all the AAI sites were directly con-
nected to ATM core switches that made up the nation wide WAN backbone.
After the upgrade, AAI connections were moved to edge switches to provide
more stable network connections, better network management, and tighter
76

5 10 15 20 25 300
1
2
3
4
5
6
Target Flow Throughput (Mbps)
Std
Dev
iatio
n of
NJ
(ms)
No Background Traffic (5/22/97) 25Mbps Background Traffic (7/4/97) 60Mbps Background Traffic (7/10/97)
Figure 6.17: Standard Deviation (ms) of Network Jitter of UDP Target Flowswith Cell Level Paced Background Tra�c from ITTC to AAI cloud
tra�c management.
� AAI network connections were changed from using VBR to UBR service.
AAI sites were fully meshed by peak-rate VBR permanent virtual connec-
tions (PVCs). Because of their full peak-rate con�guration, every AAI VBR
PVC was able to utilize the full OC-3 bandwidth. After the upgrades, UBR
service is used. Although each UBR connection is still able to peak at the
full OC-3 bandwidth, Quality of Service (QoS) is not guaranteed.
� Early Packet Discard (EPD) was enabled where possible.
One of the tra�c management features from the edge switches is the EPD
function. Since AAI sites are connected to the edge switches, EPD is turned
on to prevent unwanted congestion from packet tra�c.
77

5 10 15 20 25 30
0
5
10
15
20
25
30
35
Target Flow Throughput (Mbps)
Std
Dev
iatio
n of
NJ
(ms)
No Background Traffic (7/20/97) 25Mbps Background Traffic (8/9/97) 60Mbps Background Traffic (8/10/97)
Figure 6.18: Standard Deviation (ms) of Network Jitter of UDP Target Flowswith Cell Level Paced Background Tra�c from AAI cloud to ITTC
6.5.1 No Cell Level Pacing
Figure 6.21 and Figure 6.22 are the standard deviation of network jitter and
percentage of packet loss of UDP Target Flows under the impact of 60Mbps
Background Tra�c before and after the network upgrades. The standard devia-
tion was reduced from 30ms to 2.5ms and UDP segment loss was reduced from
22 percent to 1 percent in the worst case. Network congestion within the AAI
backbone has been lowered for the latest test runs compared with the earlier test
runs. Those improvements are signi�cant.
The improvement of network performance shown in Figure 6.21 and Figure
6.22 can be mainly attributed to the EPD setting at the edge switches. Network
congestions are caused by bursty tra�c sources in the experiments. The main
functionality of EPD is to prevent unwanted congestion for packet tra�c. Thus,
many cells from the bursty background tra�c sources were dropped by the EPD
at the edge switches before they were admitted into the AAI backbone. When
78

5 10 15 20 25 30−0.2
0
0.2
0.4
0.6
0.8
1
1.2
1.4
Target Flow Throughput (Mbps)
Loss
es o
f UD
P S
egm
ents
(m
s)
No Background Traffic (5/22/97) 25Mbps Background Traffic (7/4/97) 60Mbps Background Traffic (7/10/97)
Figure 6.19: Percentage of UDP Segment Losses of UDP Target Flows with CellLevel Paced Background Tra�c from ITTC to AAI cloud
the target ows merged with the background tra�c at the core switches, tra�c
congestion were less likely to occur. As a result, we see a substantial improvement
for the performance of the target ows. However, background tra�c su�ered more
cell losses in this case. In fact, background tra�c had an increase of 50 percent
in number of cells being dropped in the tests after the network upgrades.
6.5.2 Cell Level Pacing on Background Tra�c
Figure 6.23 and Figure 6.24 are the performance of UDP target ows with cell
level paced 60Mbps background tra�c before and after the network upgrades.
There was only a slight improvement in this case because the standard deviation
of network jitter and lost UDP segments were very low in both test runs.
Overall, the additions of edge switches, UBR tra�c setting, and early packet
discard (EPD) setting have made a substantial improvement in performance of
the AAI ATM network.
79

5 10 15 20 25 30
0
5
10
15
20
25
Target Flow Throughput (Mbps)
Loss
es o
f UD
P S
egm
ents
(%
)No Background Traffic (7/20/97) 25Mbps Background Traffic (8/9/97) 60Mbps Background Traffic (8/10/97)
Figure 6.20: Percentage of UDP Segment Losses of UDP Target Flows with CellLevel Paced Background Tra�c from AAI cloud to ITTC
5 10 15 20 25 30
0
5
10
15
20
25
30
35
40
CBR Throughputs (Mbps)
Std
Dev
iatio
n of
NJ
(ms)
8/21/97 10/12/97
Figure 6.21: Standard Deviation of UDP Target Flows under the non-cell levelpaced 60Mbps Background Tra�c
80

5 10 15 20 25 30
0
5
10
15
20
25
CBR Throughputs (Mbps)
Loss
es o
f UD
P S
egm
ents
(%
)8/21/97 10/12/97
Figure 6.22: Losses of UDP Segments of UDP Target Flows under the non-celllevel paced 60Mbps Background Tra�c
5 10 15 20 25 30
0
5
10
15
20
25
30
35
40
CBR Throughputs (Mbps)
Std
Dev
iatio
n of
NJ
(ms)
8/10/97 10/13/97
Figure 6.23: Standard Deviation of UDP Target Flow under the cell level paced60Mbps Background Tra�c
81

5 10 15 20 25 30
0
5
10
15
20
25
CBR Throughputs (Mbps)
Loss
es o
f UD
P S
egm
ents
(%
)
8/10/97 10/13/97
Figure 6.24: Losses of UDP Segments of UDP Target Flows under the cell levelpaced 60Mbps Background Tra�c
82

Chapter 7
Lessons Learned
This chapter presents the summaries of lessons learned in this study. The lessons
learned are categorized into two sections as follows : (1) ATMWAN performance;
and (2) Doing Network Measurements.
7.1 ATM WAN Performance
This section documents the lessons learned related to the ATMWAN performance
drawn from the experimental results of this study.
7.1.1 TCP and UDP Protocol Performance
TCP and UDP are the popular protocols being used on internet protocol (IP)
networks. User applications only see packet performance, not ATM cell perfor-
mance. So, it is vital to have acceptable packet level performance, especially
in congested networks. This study �nds that the performance of packet tra�c
over ATM WAN in a congested and uncontrolled environment is poor. Delay
jitter and packet losses are large and intolerable in non-cell level paced TCP and
83

UDP tests. When the three multiple sources (two background tra�c sources
from ARL and NRL + target ow from NCCOSC) merged together in the core
switch and competed for the same destination, cells were dropped due to the
peak rate burstiness, particularly from the bursty elements (FTP and WWW)
of background tra�c sources. In ATM, a single 53-byte cell drop may cause an
9180-byte1 [24] packet discard at IP layer due to incomplete error. Network re-
sources are wasted to deliver the useless cells belong to the same corrupted IP
packet. In TCP, retransmission is triggered to recover the lost packets, but the
delay of delivery is added. In UDP, the discarded IP packets are unrecoverable
at the receiving ends. As a result, large delay jitter and losses on packet level
were observed. Tra�c shaping technique must be applied to alter the bursty IP
tra�c streams and have better controls of network tra�c. TCP protocol may be
used in conjunction of tra�c shaping to provide safe transmission of data.
7.1.2 Tra�c Shaping
In an ideal world, user tra�c should have been shaped before submitting to the
networks. Bursty tra�c sources in an uncontrolled environment will adversely im-
pact the network performance. The results in Section 6.2 (No Cell Level Pacing)
indicate poor network performance even though the aggregate average through-
put in the worst case scenario is about 100Mbps2 over a 155.52Mbps OC-3 link.
At �rst, cell level pacing was used on the target ows to evaluate its e�ects. The
results of cell level paced target ows show that its e�ects are dependent on the
direction of the ows and the network structure. In the case of the tra�c ow
from ITTC to AAI cloud, better network performance was observed. Paced cells
1The recommended Maximum Transfer Unit (MTU) for IP over ATM is 9180 bytes.2including the overhead of TCP/UDP, AAL, ATM, and SONET layers.
84

from the target ows were less likely to be dropped compared to the groups of
back-to-back cells because of the large bu�er setting and the OC-12 to OC-3 rate
mismatch situation in the TIOC switch. However, target ows su�ered more
delay and losses when they went from AAI cloud to ITTC. This is because the
congestion point was in the AAI cloud. The congestion situation was identi�ed
as the tra�c from three OC-3 links competed for the same output port which was
also another OC-3 link in the core switch where they merged together. In addi-
tion, the bu�er setting in core switches was considerately tighter and less than
the setting in TIOC switch. As a result, paced cells from target ows were more
likely to be discarded over a �xed period of time and worse packet performance
was observed for the connections from AAI cloud to ITTC.
The consistent network performance was gained when cell level pacing was
used on background tra�c sources regardless of the direction of the ows. This
time, the network only sees well-behaved tra�c streams coming in. The back-
ground tra�c was not able to transmit at full OC-3 bandwidth. Instead, the
pacing rate was speci�ed as to demonstrate the potential e�ectiveness of ABR
service. Bandwidth was reserved for the target ows. Although the target ows
were still transmitted as groups of back-to-back cells, the small bu�er setting
in core switches was able to absorb the small amount of back-to-back cells and
the bandwidth was available to transmit. Given this situation, the network per-
formance is substantially improved no matter what the direction of the ows
is.
The simplest tra�c shaping technique, cell level pacing, is found to be an
e�ective way to conform tra�c and avoid severe network congestion situation.
85

7.1.3 Asymmetrical Network Structure
In this study, tests were conducted from ITTC to AAI cloud, and AAI cloud
to ITTC separately. Di�erent ATM network performance was observed from
direction of ows. This is because of the asymmetrical network structure in
connection-oriented WANs. In the tests with the tra�c ow from ITTC to AAI
cloud, the congestion point is identi�ed as the OC-12 to OC-3 mismatch in the
TIOC switch. However, when the direction of all the tra�c ows was reversed,
this creates a congestion point within the AAI cloud for the tests with tra�c ow
from AAI cloud to ITTC. The reasons of why asymmetrical network performance
occurs are given in Section 7.1.2 (Tra�c Shaping). As a result, di�erent network
performance was obtained. In designing congestion experiments and evaluating
network performance, the direction of tra�c ows must be taken into consider-
ation. If not, underestimated and inaccurate conclusion might be drawn for the
network performance.
7.1.4 Early Packet Discard (EPD) Functionality and Per-
formance
The main functionality of EPD is to relieve network tension by reserving queue
bu�er in switches. In this study, EPD performance was evaluated. The com-
parison of network performance after network upgrades in Chapter 6 Section 6.5
show substantial gain in network performance and tra�c congestion was reduced
in AAI backbone once the EPD setting was enable. Although bursty background
tra�c sources were observed to have more cells being dropped, mission-critical
target ows have better performance and EPD provides better overall network
performance. The combination of the use of Early Packet Discard (EPD) and
86

Partial Packet Discard (PPD) is believed to provide greater network performance
of packet tra�c.
7.2 Doing Network Measurements
Although there are many documents about the results of measurements presented
nowadays, network researchers, especially beginners, often found the documents
about measurement process lacking or the information is not publicly available.
Network investigators usually gain their experience in doing experiments by trial
and error. Without careful preparation, this often leads to wasted resources for
the projects. This section is to address some of the observations made and issues
found in this study.
7.2.1 Network Connectivity
Maintaining network connectivity, especially in a WAN testbed environment, has
been a di�cult task. In the deployment of AAI network, KU has been struggling
to set up and maintain stable network connections to other sites. PVCs were set
up to interconnect the four experiment sites (ARL, NRL, NCCOSC, and ITTC).
Since the cell level pacing is done on a per PVC basis, speci�c PVCs were set up
to support the tests. Smart (Soft) permanent virtual connections (SPVCs) were
used to set up connections through multiple network switches. The SPVCs with
speci�c pacing rate were set up before and torn down after each experiment.
In addition, the workstations deployed by KU to the other AAI sites were not
stable due to the initial beta version of operating systems. The workstations were
needed to reboot occasionally. In doing the experiments, all four workstations
were needed to be operational and network connections were able to set up. Thus,
87
the problem of network connectivity partly contributes to the delays of schedule
in running the experiments.
7.2.2 Host State
Host state also plays an important role in doing network measurements. Note
that in the cell level paced background tra�c tests of Figure 6.17, the standard
deviation of UDP packet was about 3ms higher compared to the other tests. This
was because some statistic capturing scripts were running on the workstation.
NetSpec is a running process at the application level. As a result, it competes with
other processes to get operating system time. Thus, in this case, the result of the
experiment was adversely altered. To accurately measure network performance
using workstations, host machines must have low system load.
7.2.3 Long Duration of Experiments
Table 7.1 and 7.2 are the run dates of experiments for ITTC to AAI and AAI to
ITTC, respectively. One set of experiments took about 3 hours to complete. In
other words, more than 150 hours of successful experiment time, including the
24-hour validation experiments, were logged in this study.
One of the obstacles found when conducting these experiments was that these
experiments were congestion experiments. They were purposely designed to cause
severe congestion in the network in order to evaluate network performance. How-
ever, they also impacted other tra�c and negatively a�ected the performance of
production network of AAI. Tests were postponed several times to evaluate the
impact on production network in the beginning of this study. Toward to the end
of the study, the tests were conducted on weekend basis to avoid cross tra�c and
88

breakdown in production network of AAI.
5/22/97 UDP Target FlowsUDP Target Flows with 25Mbps Background Tra�cUDP Target Flows with 60Mbps Background Tra�c
6/4/97 TCP Target Flows aloneTCP Target Flows with 25Mbps Background Tra�cTCP Target Flows with 60Mbps Background Tra�c
6/5/97 Cell Level Paced UDP Target Flows6/18/97 Cell Level Paced UDP Target Flows with 25Mbps Background Tra�c
Cell Level Paced UDP Target Flows with 60Mbps Background Tra�c6/22/97 Cell Level Paced TCP Target Flows6/23/97 Cell Level Paced TCP Target Flows with 25Mbps Background Tra�c
Cell Level Paced TCP Target Flows with 60Mbps Background Tra�c7/3/97 TCP Target Flows with Cell Level Paced 25Mbps Background Tra�c7/4/97 UDP Target Flows with Cell Level Paced 25Mbps Background Tra�c7/9/97 TCP Target Flows with Cell Level Paced 60Mbps Background Tra�c (Part I)7/10/97 TCP Target Flows with Cell Level Paced 60Mbps Background Tra�c (Part II)
UDP Target Flows with Cell Level Paced 60Mbps Background Tra�c
Table 7.1: Run Dates of the Experiments from ITTC to AAI cloud
7.2.4 Large Amount of Collected Data
A total of 772 successful experiments had been conducted over the 3-month pe-
riod from May 1997 to August 1997 (Table 7.1 and Table 7.2), which is equivalent
to about 1G bytes of raw data. Each packet in the tests was timestamped and
recorded. This 1G byte of raw data approximately consumed 24 hours of pro-
cessing time.
89

7/19/97 TCP Target Flows aloneCell Level Paced TCP Target Flows alone
7/20/97 UDP Target Flows aloneCell Level Paced UDP Target Flows alone
7/26/97 TCP Target Flows with 25Mbps Background Tra�cTCP Target Flows with 60Mbps Background Tra�c
8/4/97 UDP Target Flows with 25Mbps Background Tra�cCell Level Paced UDP Target Flows with 25Mbps Background Tra�c
8/9/97 TCP Target Flows with Cell Level Paced 25Mbps Background Tra�cUDP Target Flows with Cell Level Paced 25Mbps Background Tra�c
8/10/97 Cell Level Paced UDP Target Flows aloneTCP Target Flows with Cell Level Paced 60Mbps Background Tra�cUDP Target Flows with Cell Level Paced 60Mbps Background Tra�c
8/21/97 Cell Level Paced TCP Target Flows with 25Mbps Background Tra�cCell Level Paced TCP Target Flows with 60Mbps Background Tra�c
8/21/97 Cell Level Paced UDP Target Flows with 60Mbps Background Tra�cUDP Target Flows with Cell Level Paced 60Mbps Background Tra�c
Table 7.2: Run Dates of the Experiments from AAI cloud to ITTC
90

Chapter 8
Conclusions and Future Work
8.1 Summary and Conclusions
Here, empirically-derived tra�c models were collected and implemented in Net-
Spec 3.0. Congestion WAN experiments using these emulated tra�c sources were
successfully conducted. Network performance in terms of delay jitter, and packet
loss, were successfully measured under the impact of bursty Background Tra�c
sources. In addition, the e�ects of transport level ow control and ATM level
tra�c shaping were studied and analyzed.
The results obtained from the experiments have shown the poor network per-
formance on target ows and negative impact of bursty background tra�c in
an uncontrolled network environment. Using TCP solely does not improve the
network performance in such a congested network condition. ATM level traf-
�c shaping is found to be a solution to signi�cantly reduce network tension in
addition to improving network performance on target ows. However, a small
percent of cell losses on target ows was still observed in the best case of cell level
pacing. To ensure safe transmission of data and optimized network performance,
91

the combination of TCP ow control and cell level pacing technique should be
used.
The results also indicate that the network performance is dependent on the
direction of the tra�c ows due to the asymmetrical network structure. The
change of direction of the tra�c ows will create a congestion point at di�erent
physical network location.
8.2 Future Work
This section addresses some of the bottlenecks in this study and present some
recommendations for future work.
As new technology advances and more standards are proposed, the user ap-
plications are changing, so is the user tra�c. For example, WWW standards and
browsers keep changing and improving. The generated tra�c is dependent on the
functionality and caching algorithms of the browsers. As a result, the user tra�c
pattern is di�erent from browser to browser, standard to another standard. More
tra�c models should be evaluated.
In the 25Mbps and 60Mbps Background Tra�c tests, there is only a single
TCP connection for WWW sessions. Similarly, FTP sessions only utilize a single
TCP connection. In a more realistic scenario, there are many active WWW and
FTP sessions at the same time. In other words, parallel TCP connections of
many WWW and FTP sessions compete with each other. This will draw more
realistic congestion environment for the tests.
In this study, the analysis of network performance mainly focuses on the target
ows. It will be interesting to evaluate how background tra�c performs in the
tests. Although statistic capturing scripts were running on each workstation,
92

they only show the number of background tra�c cells being dropped for the
whole experiments. More detailed analysis may be done to examine the network
performance on background tra�c.
93

Appendix A
NetSpec Scripts for Validation
Experiments
A.1 FTP script for Validation Experiment
serial {
cluster {
test galaga.atm.ittc.ukans.edu {
type = burstq (blocksize=ftpItemSize(min=8),
repeats=ftpNOfItems(min=1),
period=ftpSessionInterarrival(lambda=0.000001138, min=1000),
buffer=65536, duration=1800);
protocol = tcp (window=1048576);
own = galaga.atm.ittc.ukans.edu:51101;
peer = arl.atm.ittc.ukans.edu:51101;
}
test arl.atm.ittc.ukans.edu {
type = sink (blocksize=65536, duration=1800);
protocol = tcp (window=1048576);
own = arl.atm.ittc.ukans.edu:51101;
peer = galaga.atm.ittc.ukans.edu:51101;
}
}
cluster {
test galaga.atm.ittc.ukans.edu {
type = burstq (blocksize=ftpItemSize(min=8),
repeats=ftpNOfItems(min=1),
period=ftpSessionInterarrival(lambda=0.000000853, min=1000),
buffer=65536, duration=1800);
protocol = tcp (window=1048576);
own = galaga.atm.ittc.ukans.edu:51102;
peer = arl.atm.ittc.ukans.edu:51102;
}
test arl.atm.ittc.ukans.edu {
type = sink (blocksize=65536, duration=1800);
94

protocol = tcp (window=1048576);
own = arl.atm.ittc.ukans.edu:51102;
peer = galaga.atm.ittc.ukans.edu:51102;
}
}
cluster {
test galaga.atm.ittc.ukans.edu {
type = burstq (blocksize=ftpItemSize(min=8),
repeats=ftpNOfItems(min=1),
period=ftpSessionInterarrival(lambda=0.000000664, min=1000),
buffer=65536, duration=1800);
protocol = tcp (window=1048576);
own = galaga.atm.ittc.ukans.edu:51103;
peer = arl.atm.ittc.ukans.edu:51103;
}
test arl.atm.ittc.ukans.edu {
type = sink (blocksize=65536, duration=1800);
protocol = tcp (window=1048576);
own = arl.atm.ittc.ukans.edu:51103;
peer = galaga.atm.ittc.ukans.edu:51103;
}
}
cluster {
test galaga.atm.ittc.ukans.edu {
type = burstq (blocksize=ftpItemSize(min=8),
repeats=ftpNOfItems(min=1),
period=ftpSessionInterarrival(lambda=0.000000474, min=1000),
buffer=65536, duration=1800);
protocol = tcp (window=1048576);
own = galaga.atm.ittc.ukans.edu:51104;
peer = arl.atm.ittc.ukans.edu:51104;
}
test arl.atm.ittc.ukans.edu {
type = sink (blocksize=65536, duration=1800);
protocol = tcp (window=1048576);
own = arl.atm.ittc.ukans.edu:51104;
peer = galaga.atm.ittc.ukans.edu:51104;
}
}
cluster {
test galaga.atm.ittc.ukans.edu {
type = burstq (blocksize=ftpItemSize(min=8),
repeats=ftpNOfItems(min=1),
period=ftpSessionInterarrival(lambda=0.000000521, min=1000),
buffer=65536, duration=1800);
protocol = tcp (window=1048576);
own = galaga.atm.ittc.ukans.edu:51105;
peer = arl.atm.ittc.ukans.edu:51105;
}
test arl.atm.ittc.ukans.edu {
type = sink (blocksize=65536, duration=1800);
protocol = tcp (window=1048576);
own = arl.atm.ittc.ukans.edu:51105;
peer = galaga.atm.ittc.ukans.edu:51105;
}
}
cluster {
test galaga.atm.ittc.ukans.edu {
type = burstq (blocksize=ftpItemSize(min=8),
repeats=ftpNOfItems(min=1),
period=ftpSessionInterarrival(lambda=0.000000664, min=1000),
buffer=65536, duration=1800);
protocol = tcp (window=1048576);
own = galaga.atm.ittc.ukans.edu:51106;
peer = arl.atm.ittc.ukans.edu:51106;
95

}
test arl.atm.ittc.ukans.edu {
type = sink (blocksize=65536, duration=1800);
protocol = tcp (window=1048576);
own = arl.atm.ittc.ukans.edu:51106;
peer = galaga.atm.ittc.ukans.edu:51106;
}
}
cluster {
test galaga.atm.ittc.ukans.edu {
type = burstq (blocksize=ftpItemSize(min=8),
repeats=ftpNOfItems(min=1),
period=ftpSessionInterarrival(lambda=0.000000948, min=1000),
buffer=65536, duration=1800);
protocol = tcp (window=1048576);
own = galaga.atm.ittc.ukans.edu:51107;
peer = arl.atm.ittc.ukans.edu:51107;
}
test arl.atm.ittc.ukans.edu {
type = sink (blocksize=65536, duration=1800);
protocol = tcp (window=1048576);
own = arl.atm.ittc.ukans.edu:51107;
peer = galaga.atm.ittc.ukans.edu:51107;
}
}
cluster {
test galaga.atm.ittc.ukans.edu {
type = burstq (blocksize=ftpItemSize(min=8),
repeats=ftpNOfItems(min=1),
period=ftpSessionInterarrival(lambda=0.000001564, min=1000),
buffer=65536, duration=1800);
protocol = tcp (window=1048576);
own = galaga.atm.ittc.ukans.edu:51108;
peer = arl.atm.ittc.ukans.edu:51108;
}
test arl.atm.ittc.ukans.edu {
type = sink (blocksize=65536, duration=1800);
protocol = tcp (window=1048576);
own = arl.atm.ittc.ukans.edu:51108;
peer = galaga.atm.ittc.ukans.edu:51108;
}
}
cluster {
test galaga.atm.ittc.ukans.edu {
type = burstq (blocksize=ftpItemSize(min=8),
repeats=ftpNOfItems(min=1),
period=ftpSessionInterarrival(lambda=0.000002086, min=1000),
buffer=65536, duration=1800);
protocol = tcp (window=1048576);
own = galaga.atm.ittc.ukans.edu:51109;
peer = arl.atm.ittc.ukans.edu:51109;
}
test arl.atm.ittc.ukans.edu {
type = sink (blocksize=65536, duration=1800);
protocol = tcp (window=1048576);
own = arl.atm.ittc.ukans.edu:51109;
peer = galaga.atm.ittc.ukans.edu:51109;
}
}
cluster {
test galaga.atm.ittc.ukans.edu {
type = burstq (blocksize=ftpItemSize(min=8),
repeats=ftpNOfItems(min=1),
period=ftpSessionInterarrival(lambda=0.000002607, min=1000),
buffer=65536, duration=1800);
96

protocol = tcp (window=1048576);
own = galaga.atm.ittc.ukans.edu:51110;
peer = arl.atm.ittc.ukans.edu:51110;
}
test arl.atm.ittc.ukans.edu {
type = sink (blocksize=65536, duration=1800);
protocol = tcp (window=1048576);
own = arl.atm.ittc.ukans.edu:51110;
peer = galaga.atm.ittc.ukans.edu:51110;
}
}
cluster {
test galaga.atm.ittc.ukans.edu {
type = burstq (blocksize=ftpItemSize(min=8),
repeats=ftpNOfItems(min=1),
period=ftpSessionInterarrival(lambda=0.000003129, min=1000),
buffer=65536, duration=1800);
protocol = tcp (window=1048576);
own = galaga.atm.ittc.ukans.edu:51111;
peer = arl.atm.ittc.ukans.edu:51111;
}
test arl.atm.ittc.ukans.edu {
type = sink (blocksize=65536, duration=1800);
protocol = tcp (window=1048576);
own = arl.atm.ittc.ukans.edu:51111;
peer = galaga.atm.ittc.ukans.edu:51111;
}
}
cluster {
test galaga.atm.ittc.ukans.edu {
type = burstq (blocksize=ftpItemSize(min=8),
repeats=ftpNOfItems(min=1),
period=ftpSessionInterarrival(lambda=0.000003318, min=1000),
buffer=65536, duration=1800);
protocol = tcp (window=1048576);
own = galaga.atm.ittc.ukans.edu:51112;
peer = arl.atm.ittc.ukans.edu:51112;
}
test arl.atm.ittc.ukans.edu {
type = sink (blocksize=65536, duration=1800);
protocol = tcp (window=1048576);
own = arl.atm.ittc.ukans.edu:51112;
peer = galaga.atm.ittc.ukans.edu:51112;
}
}
cluster {
test galaga.atm.ittc.ukans.edu {
type = burstq (blocksize=ftpItemSize(min=8),
repeats=ftpNOfItems(min=1),
period=ftpSessionInterarrival(lambda=0.000002844, min=1000),
buffer=65536, duration=1800);
protocol = tcp (window=1048576);
own = galaga.atm.ittc.ukans.edu:51113;
peer = arl.atm.ittc.ukans.edu:51113;
}
test arl.atm.ittc.ukans.edu {
type = sink (blocksize=65536, duration=1800);
protocol = tcp (window=1048576);
own = arl.atm.ittc.ukans.edu:51113;
peer = galaga.atm.ittc.ukans.edu:51113;
}
}
cluster {
test galaga.atm.ittc.ukans.edu {
type = burstq (blocksize=ftpItemSize(min=8),
97

repeats=ftpNOfItems(min=1),
period=ftpSessionInterarrival(lambda=0.000002892, min=1000),
buffer=65536, duration=1800);
protocol = tcp (window=1048576);
own = galaga.atm.ittc.ukans.edu:51114;
peer = arl.atm.ittc.ukans.edu:51114;
}
test arl.atm.ittc.ukans.edu {
type = sink (blocksize=65536, duration=1800);
protocol = tcp (window=1048576);
own = arl.atm.ittc.ukans.edu:51114;
peer = galaga.atm.ittc.ukans.edu:51114;
}
}
cluster {
test galaga.atm.ittc.ukans.edu {
type = burstq (blocksize=ftpItemSize(min=8),
repeats=ftpNOfItems(min=1),
period=ftpSessionInterarrival(lambda=0.000003745, min=1000),
buffer=65536, duration=1800);
protocol = tcp (window=1048576);
own = galaga.atm.ittc.ukans.edu:51115;
peer = arl.atm.ittc.ukans.edu:51115;
}
test arl.atm.ittc.ukans.edu {
type = sink (blocksize=65536, duration=1800);
protocol = tcp (window=1048576);
own = arl.atm.ittc.ukans.edu:51115;
peer = galaga.atm.ittc.ukans.edu:51115;
}
}
cluster {
test galaga.atm.ittc.ukans.edu {
type = burstq (blocksize=ftpItemSize(min=8),
repeats=ftpNOfItems(min=1),
period=ftpSessionInterarrival(lambda=0.000003366, min=1000),
buffer=65536, duration=1800);
protocol = tcp (window=1048576);
own = galaga.atm.ittc.ukans.edu:51116;
peer = arl.atm.ittc.ukans.edu:51116;
}
test arl.atm.ittc.ukans.edu {
type = sink (blocksize=65536, duration=1800);
protocol = tcp (window=1048576);
own = arl.atm.ittc.ukans.edu:51116;
peer = galaga.atm.ittc.ukans.edu:51116;
}
}
cluster {
test galaga.atm.ittc.ukans.edu {
type = burstq (blocksize=ftpItemSize(min=8),
repeats=ftpNOfItems(min=1),
period=ftpSessionInterarrival(lambda=0.000003650, min=1000),
buffer=65536, duration=1800);
protocol = tcp (window=1048576);
own = galaga.atm.ittc.ukans.edu:51117;
peer = arl.atm.ittc.ukans.edu:51117;
}
test arl.atm.ittc.ukans.edu {
type = sink (blocksize=65536, duration=1800);
protocol = tcp (window=1048576);
own = arl.atm.ittc.ukans.edu:51117;
peer = galaga.atm.ittc.ukans.edu:51117;
}
}
98

cluster {
test galaga.atm.ittc.ukans.edu {
type = burstq (blocksize=ftpItemSize(min=8),
repeats=ftpNOfItems(min=1),
period=ftpSessionInterarrival(lambda=0.000002749, min=1000),
buffer=65536, duration=1800);
protocol = tcp (window=1048576);
own = galaga.atm.ittc.ukans.edu:51118;
peer = arl.atm.ittc.ukans.edu:51118;
}
test arl.atm.ittc.ukans.edu {
type = sink (blocksize=65536, duration=1800);
protocol = tcp (window=1048576);
own = arl.atm.ittc.ukans.edu:51118;
peer = galaga.atm.ittc.ukans.edu:51118;
}
}
cluster {
test galaga.atm.ittc.ukans.edu {
type = burstq (blocksize=ftpItemSize(min=8),
repeats=ftpNOfItems(min=1),
period=ftpSessionInterarrival(lambda=0.000001849, min=1000),
buffer=65536, duration=1800);
protocol = tcp (window=1048576);
own = galaga.atm.ittc.ukans.edu:51119;
peer = arl.atm.ittc.ukans.edu:51119;
}
test arl.atm.ittc.ukans.edu {
type = sink (blocksize=65536, duration=1800);
protocol = tcp (window=1048576);
own = arl.atm.ittc.ukans.edu:51119;
peer = galaga.atm.ittc.ukans.edu:51119;
}
}
cluster {
test galaga.atm.ittc.ukans.edu {
type = burstq (blocksize=ftpItemSize(min=8),
repeats=ftpNOfItems(min=1),
period=ftpSessionInterarrival(lambda=0.000001280, min=1000),
buffer=65536, duration=1800);
protocol = tcp (window=1048576);
own = galaga.atm.ittc.ukans.edu:51120;
peer = arl.atm.ittc.ukans.edu:51120;
}
test arl.atm.ittc.ukans.edu {
type = sink (blocksize=65536, duration=1800);
protocol = tcp (window=1048576);
own = arl.atm.ittc.ukans.edu:51120;
peer = galaga.atm.ittc.ukans.edu:51120;
}
}
cluster {
test galaga.atm.ittc.ukans.edu {
type = burstq (blocksize=ftpItemSize(min=8),
repeats=ftpNOfItems(min=1),
period=ftpSessionInterarrival(lambda=0.000001517, min=1000),
buffer=65536, duration=1800);
protocol = tcp (window=1048576);
own = galaga.atm.ittc.ukans.edu:51121;
peer = arl.atm.ittc.ukans.edu:51121;
}
test arl.atm.ittc.ukans.edu {
type = sink (blocksize=65536, duration=1800);
protocol = tcp (window=1048576);
own = arl.atm.ittc.ukans.edu:51121;
99

peer = galaga.atm.ittc.ukans.edu:51121;
}
}
cluster {
test galaga.atm.ittc.ukans.edu {
type = burstq (blocksize=ftpItemSize(min=8),
repeats=ftpNOfItems(min=1),
period=ftpSessionInterarrival(lambda=0.000001564, min=1000),
buffer=65536, duration=1800);
protocol = tcp (window=1048576);
own = galaga.atm.ittc.ukans.edu:51122;
peer = arl.atm.ittc.ukans.edu:51122;
}
test arl.atm.ittc.ukans.edu {
type = sink (blocksize=65536, duration=1800);
protocol = tcp (window=1048576);
own = arl.atm.ittc.ukans.edu:51122;
peer = galaga.atm.ittc.ukans.edu:51122;
}
}
cluster {
test galaga.atm.ittc.ukans.edu {
type = burstq (blocksize=ftpItemSize(min=8),
repeats=ftpNOfItems(min=1),
period=ftpSessionInterarrival(lambda=0.000001754, min=1000),
buffer=65536, duration=1800);
protocol = tcp (window=1048576);
own = galaga.atm.ittc.ukans.edu:51123;
peer = arl.atm.ittc.ukans.edu:51123;
}
test arl.atm.ittc.ukans.edu {
type = sink (blocksize=65536, duration=1800);
protocol = tcp (window=1048576);
own = arl.atm.ittc.ukans.edu:51123;
peer = galaga.atm.ittc.ukans.edu:51123;
}
}
cluster {
test galaga.atm.ittc.ukans.edu {
type = burstq (blocksize=ftpItemSize(min=8),
repeats=ftpNOfItems(min=1),
period=ftpSessionInterarrival(lambda=0.000001185, min=1000),
buffer=65536, duration=1800);
protocol = tcp (window=1048576);
own = galaga.atm.ittc.ukans.edu:51124;
peer = arl.atm.ittc.ukans.edu:51124;
}
test arl.atm.ittc.ukans.edu {
type = sink (blocksize=65536, duration=1800);
protocol = tcp (window=1048576);
own = arl.atm.ittc.ukans.edu:51124;
peer = galaga.atm.ittc.ukans.edu:51124;
}
}
}
100

A.2 WWW script for Validation Experiment
serial {
cluster {
test hopper.atm.ittc.ukans.edu {
type = burstq (blocksize=WWWItemSize(min=8, max=104857600, shape=0.40),
period=WWWRequestInterarrival(lambda=0.000002759, min=1000),
buffer=65536, duration=1800);
protocol = tcp (window=1048576);
own = hopper.atm.ittc.ukans.edu:51201;
peer = arl.atm.ittc.ukans.edu:51201;
}
test arl.atm.ittc.ukans.edu {
type = sink (blocksize=65536, duration=1800);
protocol = tcp (window=1048576);
own = arl.atm.ittc.ukans.edu:51201;
peer = hopper.atm.ittc.ukans.edu:51201;
}
}
cluster {
test hopper.atm.ittc.ukans.edu {
type = burstq (blocksize=WWWItemSize(min=8, max=104857600, shape=0.40),
period=WWWRequestInterarrival(lambda=0.000002989, min=1000),
buffer=65536, duration=1800);
protocol = tcp (window=1048576);
own = hopper.atm.ittc.ukans.edu:51202;
peer = arl.atm.ittc.ukans.edu:51202;
}
test arl.atm.ittc.ukans.edu {
type = sink (blocksize=65536, duration=1800);
protocol = tcp (window=1048576);
own = arl.atm.ittc.ukans.edu:51202;
peer = hopper.atm.ittc.ukans.edu:51202;
}
}
cluster {
test hopper.atm.ittc.ukans.edu {
type = burstq (blocksize=WWWItemSize(min=8, max=104857600, shape=0.40),
period=WWWRequestInterarrival(lambda=0.000003219, min=1000),
buffer=65536, duration=1800);
protocol = tcp (window=1048576);
own = hopper.atm.ittc.ukans.edu:51203;
peer = arl.atm.ittc.ukans.edu:51203;
}
test arl.atm.ittc.ukans.edu {
type = sink (blocksize=65536, duration=1800);
protocol = tcp (window=1048576);
own = arl.atm.ittc.ukans.edu:51203;
peer = hopper.atm.ittc.ukans.edu:51203;
}
}
cluster {
test hopper.atm.ittc.ukans.edu {
type = burstq (blocksize=WWWItemSize(min=8, max=104857600, shape=0.40),
period=WWWRequestInterarrival(lambda=0.000003449, min=1000),
buffer=65536, duration=1800);
protocol = tcp (window=1048576);
own = hopper.atm.ittc.ukans.edu:51204;
peer = arl.atm.ittc.ukans.edu:51204;
}
test arl.atm.ittc.ukans.edu {
type = sink (blocksize=65536, duration=1800);
protocol = tcp (window=1048576);
101

own = arl.atm.ittc.ukans.edu:51204;
peer = hopper.atm.ittc.ukans.edu:51204;
}
}
cluster {
test hopper.atm.ittc.ukans.edu {
type = burstq (blocksize=WWWItemSize(min=8, max=104857600, shape=0.40),
period=WWWRequestInterarrival(lambda=0.000003679, min=1000),
buffer=65536, duration=1800);
protocol = tcp (window=1048576);
own = hopper.atm.ittc.ukans.edu:51205;
peer = arl.atm.ittc.ukans.edu:51205;
}
test arl.atm.ittc.ukans.edu {
type = sink (blocksize=65536, duration=1800);
protocol = tcp (window=1048576);
own = arl.atm.ittc.ukans.edu:51205;
peer = hopper.atm.ittc.ukans.edu:51205;
}
}
cluster {
test hopper.atm.ittc.ukans.edu {
type = burstq (blocksize=WWWItemSize(min=8, max=104857600, shape=0.40),
period=WWWRequestInterarrival(lambda=0.000004139, min=1000),
buffer=65536, duration=1800);
protocol = tcp (window=1048576);
own = hopper.atm.ittc.ukans.edu:51206;
peer = arl.atm.ittc.ukans.edu:51206;
}
test arl.atm.ittc.ukans.edu {
type = sink (blocksize=65536, duration=1800);
protocol = tcp (window=1048576);
own = arl.atm.ittc.ukans.edu:51206;
peer = hopper.atm.ittc.ukans.edu:51206;
}
}
cluster {
test hopper.atm.ittc.ukans.edu {
type = burstq (blocksize=WWWItemSize(min=8, max=104857600, shape=0.40),
period=WWWRequestInterarrival(lambda=0.000004599, min=1000),
buffer=65536, duration=1800);
protocol = tcp (window=1048576);
own = hopper.atm.ittc.ukans.edu:51207;
peer = arl.atm.ittc.ukans.edu:51207;
}
test arl.atm.ittc.ukans.edu {
type = sink (blocksize=65536, duration=1800);
protocol = tcp (window=1048576);
own = arl.atm.ittc.ukans.edu:51207;
peer = hopper.atm.ittc.ukans.edu:51207;
}
}
cluster {
test hopper.atm.ittc.ukans.edu {
type = burstq (blocksize=WWWItemSize(min=8, max=104857600, shape=0.40),
period=WWWRequestInterarrival(lambda=0.000007588, min=1000),
buffer=65536, duration=1800);
protocol = tcp (window=1048576);
own = hopper.atm.ittc.ukans.edu:51208;
peer = arl.atm.ittc.ukans.edu:51208;
}
test arl.atm.ittc.ukans.edu {
type = sink (blocksize=65536, duration=1800);
protocol = tcp (window=1048576);
own = arl.atm.ittc.ukans.edu:51208;
102

peer = hopper.atm.ittc.ukans.edu:51208;
}
}
cluster {
test hopper.atm.ittc.ukans.edu {
type = burstq (blocksize=WWWItemSize(min=8, max=104857600, shape=0.40),
period=WWWRequestInterarrival(lambda=0.000010578, min=1000),
buffer=65536, duration=1800);
protocol = tcp (window=1048576);
own = hopper.atm.ittc.ukans.edu:51209;
peer = arl.atm.ittc.ukans.edu:51209;
}
test arl.atm.ittc.ukans.edu {
type = sink (blocksize=65536, duration=1800);
protocol = tcp (window=1048576);
own = arl.atm.ittc.ukans.edu:51209;
peer = hopper.atm.ittc.ukans.edu:51209;
}
}
cluster {
test hopper.atm.ittc.ukans.edu {
type = burstq (blocksize=WWWItemSize(min=8, max=104857600, shape=0.40),
period=WWWRequestInterarrival(lambda=0.000011498, min=1000),
buffer=65536, duration=1800);
protocol = tcp (window=1048576);
own = hopper.atm.ittc.ukans.edu:51210;
peer = arl.atm.ittc.ukans.edu:51210;
}
test arl.atm.ittc.ukans.edu {
type = sink (blocksize=65536, duration=1800);
protocol = tcp (window=1048576);
own = arl.atm.ittc.ukans.edu:51210;
peer = hopper.atm.ittc.ukans.edu:51210;
}
}
cluster {
test hopper.atm.ittc.ukans.edu {
type = burstq (blocksize=WWWItemSize(min=8, max=104857600, shape=0.40),
period=WWWRequestInterarrival(lambda=0.000011957, min=1000),
buffer=65536, duration=1800);
protocol = tcp (window=1048576);
own = hopper.atm.ittc.ukans.edu:51211;
peer = arl.atm.ittc.ukans.edu:51211;
}
test arl.atm.ittc.ukans.edu {
type = sink (blocksize=65536, duration=1800);
protocol = tcp (window=1048576);
own = arl.atm.ittc.ukans.edu:51211;
peer = hopper.atm.ittc.ukans.edu:51211;
}
}
cluster {
test hopper.atm.ittc.ukans.edu {
type = burstq (blocksize=WWWItemSize(min=8, max=104857600, shape=0.40),
period=WWWRequestInterarrival(lambda=0.000011498, min=1000),
buffer=65536, duration=1800);
protocol = tcp (window=1048576);
own = hopper.atm.ittc.ukans.edu:51212;
peer = arl.atm.ittc.ukans.edu:51212;
}
test arl.atm.ittc.ukans.edu {
type = sink (blocksize=65536, duration=1800);
protocol = tcp (window=1048576);
own = arl.atm.ittc.ukans.edu:51212;
peer = hopper.atm.ittc.ukans.edu:51212;
103

}
}
cluster {
test hopper.atm.ittc.ukans.edu {
type = burstq (blocksize=WWWItemSize(min=8, max=104857600, shape=0.40),
period=WWWRequestInterarrival(lambda=0.000012187, min=1000),
buffer=65536, duration=1800);
protocol = tcp (window=1048576);
own = hopper.atm.ittc.ukans.edu:51213;
peer = arl.atm.ittc.ukans.edu:51213;
}
test arl.atm.ittc.ukans.edu {
type = sink (blocksize=65536, duration=1800);
protocol = tcp (window=1048576);
own = arl.atm.ittc.ukans.edu:51213;
peer = hopper.atm.ittc.ukans.edu:51213;
}
}
cluster {
test hopper.atm.ittc.ukans.edu {
type = burstq (blocksize=WWWItemSize(min=8, max=104857600, shape=0.40),
period=WWWRequestInterarrival(lambda=0.000012647, min=1000),
buffer=65536, duration=1800);
protocol = tcp (window=1048576);
own = hopper.atm.ittc.ukans.edu:51214;
peer = arl.atm.ittc.ukans.edu:51214;
}
test arl.atm.ittc.ukans.edu {
type = sink (blocksize=65536, duration=1800);
protocol = tcp (window=1048576);
own = arl.atm.ittc.ukans.edu:51214;
peer = hopper.atm.ittc.ukans.edu:51214;
}
}
cluster {
test hopper.atm.ittc.ukans.edu {
type = burstq (blocksize=WWWItemSize(min=8, max=104857600, shape=0.40),
period=WWWRequestInterarrival(lambda=0.000012877, min=1000),
buffer=65536, duration=1800);
protocol = tcp (window=1048576);
own = hopper.atm.ittc.ukans.edu:51215;
peer = arl.atm.ittc.ukans.edu:51215;
}
test arl.atm.ittc.ukans.edu {
type = sink (blocksize=65536, duration=1800);
protocol = tcp (window=1048576);
own = arl.atm.ittc.ukans.edu:51215;
peer = hopper.atm.ittc.ukans.edu:51215;
}
}
cluster {
test hopper.atm.ittc.ukans.edu {
type = burstq (blocksize=WWWItemSize(min=8, max=104857600, shape=0.40),
period=WWWRequestInterarrival(lambda=0.000013797, min=1000),
buffer=65536, duration=1800);
protocol = tcp (window=1048576);
own = hopper.atm.ittc.ukans.edu:51216;
peer = arl.atm.ittc.ukans.edu:51216;
}
test arl.atm.ittc.ukans.edu {
type = sink (blocksize=65536, duration=1800);
protocol = tcp (window=1048576);
own = arl.atm.ittc.ukans.edu:51216;
peer = hopper.atm.ittc.ukans.edu:51216;
}
104

}
cluster {
test hopper.atm.ittc.ukans.edu {
type = burstq (blocksize=WWWItemSize(min=8, max=104857600, shape=0.40),
period=WWWRequestInterarrival(lambda=0.000011383, min=1000),
buffer=65536, duration=1800);
protocol = tcp (window=1048576);
own = hopper.atm.ittc.ukans.edu:51217;
peer = arl.atm.ittc.ukans.edu:51217;
}
test arl.atm.ittc.ukans.edu {
type = sink (blocksize=65536, duration=1800);
protocol = tcp (window=1048576);
own = arl.atm.ittc.ukans.edu:51217;
peer = hopper.atm.ittc.ukans.edu:51217;
}
}
cluster {
test hopper.atm.ittc.ukans.edu {
type = burstq (blocksize=WWWItemSize(min=8, max=104857600, shape=0.40),
period=WWWRequestInterarrival(lambda=0.000009198, min=1000),
buffer=65536, duration=1800);
protocol = tcp (window=1048576);
own = hopper.atm.ittc.ukans.edu:51218;
peer = arl.atm.ittc.ukans.edu:51218;
}
test arl.atm.ittc.ukans.edu {
type = sink (blocksize=65536, duration=1800);
protocol = tcp (window=1048576);
own = arl.atm.ittc.ukans.edu:51218;
peer = hopper.atm.ittc.ukans.edu:51218;
}
}
cluster {
test hopper.atm.ittc.ukans.edu {
type = burstq (blocksize=WWWItemSize(min=8, max=104857600, shape=0.40),
period=WWWRequestInterarrival(lambda=0.000007588, min=1000),
buffer=65536, duration=1800);
protocol = tcp (window=1048576);
own = hopper.atm.ittc.ukans.edu:51219;
peer = arl.atm.ittc.ukans.edu:51219;
}
test arl.atm.ittc.ukans.edu {
type = sink (blocksize=65536, duration=1800);
protocol = tcp (window=1048576);
own = arl.atm.ittc.ukans.edu:51219;
peer = hopper.atm.ittc.ukans.edu:51219;
}
}
cluster {
test hopper.atm.ittc.ukans.edu {
type = burstq (blocksize=WWWItemSize(min=8, max=104857600, shape=0.40),
period=WWWRequestInterarrival(lambda=0.000006209, min=1000),
buffer=65536, duration=1800);
protocol = tcp (window=1048576);
own = hopper.atm.ittc.ukans.edu:51220;
peer = arl.atm.ittc.ukans.edu:51220;
}
test arl.atm.ittc.ukans.edu {
type = sink (blocksize=65536, duration=1800);
protocol = tcp (window=1048576);
own = arl.atm.ittc.ukans.edu:51220;
peer = hopper.atm.ittc.ukans.edu:51220;
}
}
105

cluster {
test hopper.atm.ittc.ukans.edu {
type = burstq (blocksize=WWWItemSize(min=8, max=104857600, shape=0.40),
period=WWWRequestInterarrival(lambda=0.000005404, min=1000),
buffer=65536, duration=1800);
protocol = tcp (window=1048576);
own = hopper.atm.ittc.ukans.edu:51221;
peer = arl.atm.ittc.ukans.edu:51221;
}
test arl.atm.ittc.ukans.edu {
type = sink (blocksize=65536, duration=1800);
protocol = tcp (window=1048576);
own = arl.atm.ittc.ukans.edu:51221;
peer = hopper.atm.ittc.ukans.edu:51221;
}
}
cluster {
test hopper.atm.ittc.ukans.edu {
type = burstq (blocksize=WWWItemSize(min=8, max=104857600, shape=0.40),
period=WWWRequestInterarrival(lambda=0.000005174, min=1000),
buffer=65536, duration=1800);
protocol = tcp (window=1048576);
own = hopper.atm.ittc.ukans.edu:51222;
peer = arl.atm.ittc.ukans.edu:51222;
}
test arl.atm.ittc.ukans.edu {
type = sink (blocksize=65536, duration=1800);
protocol = tcp (window=1048576);
own = arl.atm.ittc.ukans.edu:51222;
peer = hopper.atm.ittc.ukans.edu:51222;
}
}
cluster {
test hopper.atm.ittc.ukans.edu {
type = burstq (blocksize=WWWItemSize(min=8, max=104857600, shape=0.40),
period=WWWRequestInterarrival(lambda=0.000003679, min=1000),
buffer=65536, duration=1800);
protocol = tcp (window=1048576);
own = hopper.atm.ittc.ukans.edu:51223;
peer = arl.atm.ittc.ukans.edu:51223;
}
test arl.atm.ittc.ukans.edu {
type = sink (blocksize=65536, duration=1800);
protocol = tcp (window=1048576);
own = arl.atm.ittc.ukans.edu:51223;
peer = hopper.atm.ittc.ukans.edu:51223;
}
}
cluster {
test hopper.atm.ittc.ukans.edu {
type = burstq (blocksize=WWWItemSize(min=8, max=104857600, shape=0.40),
period=WWWRequestInterarrival(lambda=0.000002759, min=1000),
buffer=65536, duration=1800);
protocol = tcp (window=1048576);
own = hopper.atm.ittc.ukans.edu:51224;
peer = arl.atm.ittc.ukans.edu:51224;
}
test arl.atm.ittc.ukans.edu {
type = sink (blocksize=65536, duration=1800);
protocol = tcp (window=1048576);
own = arl.atm.ittc.ukans.edu:51224;
peer = hopper.atm.ittc.ukans.edu:51224;
}
}
}
106

A.3 MPEG script for Validation Experiment
parallel{
cluster {
test hopper.atm.ittc.ukans.edu {
type = burstq (blocksize=videoMPEGFrameSize(min=8),
period=33000, buffer=65536, duration=1800);
protocol = tcp (window=1048576);
own = hopper.atm.ittc.ukans.edu:51301;
peer = arl.atm.ittc.ukans.edu:51301;
}
test arl.atm.ittc.ukans.edu {
type = sink (blocksize=65536, duration=1800);
protocol = tcp (window=1048576);
own = arl.atm.ittc.ukans.edu:51301;
peer = hopper.atm.ittc.ukans.edu:51301;
}
}
cluster {
test hopper.atm.ittc.ukans.edu {
type = burstq (blocksize=videoMPEGFrameSize(min=8),
period=33000, buffer=65536, duration=1800);
protocol = tcp (window=1048576);
own = hopper.atm.ittc.ukans.edu:51302;
peer = arl.atm.ittc.ukans.edu:51302;
}
test arl.atm.ittc.ukans.edu {
type = sink (blocksize=65536, duration=1800);
protocol = tcp (window=1048576);
own = arl.atm.ittc.ukans.edu:51302;
peer = hopper.atm.ittc.ukans.edu:51302;
}
}
cluster {
test hopper.atm.ittc.ukans.edu {
type = burstq (blocksize=videoMPEGFrameSize(min=8),
period=33000, buffer=65536, duration=1800);
protocol = tcp (window=1048576);
own = hopper.atm.ittc.ukans.edu:51303;
peer = arl.atm.ittc.ukans.edu:51303;
}
test arl.atm.ittc.ukans.edu {
type = sink (blocksize=65536, duration=1800);
protocol = tcp (window=1048576);
own = arl.atm.ittc.ukans.edu:51303;
peer = hopper.atm.ittc.ukans.edu:51303;
}
}
cluster {
test hopper.atm.ittc.ukans.edu {
type = burstq (blocksize=videoMPEGFrameSize(min=8),
period=33000, buffer=65536, duration=1800);
protocol = tcp (window=1048576);
own = hopper.atm.ittc.ukans.edu:51304;
peer = arl.atm.ittc.ukans.edu:51304;
}
test arl.atm.ittc.ukans.edu {
type = sink (blocksize=65536, duration=1800);
protocol = tcp (window=1048576);
own = arl.atm.ittc.ukans.edu:51304;
peer = hopper.atm.ittc.ukans.edu:51304;
}
}
107

cluster {
test hopper.atm.ittc.ukans.edu {
type = burstq (blocksize=videoMPEGFrameSize(min=8),
period=33000, buffer=65536, duration=1800);
protocol = tcp (window=1048576);
own = hopper.atm.ittc.ukans.edu:51305;
peer = arl.atm.ittc.ukans.edu:51305;
}
test arl.atm.ittc.ukans.edu {
type = sink (blocksize=65536, duration=1800);
protocol = tcp (window=1048576);
own = arl.atm.ittc.ukans.edu:51305;
peer = hopper.atm.ittc.ukans.edu:51305;
}
}
cluster {
test hopper.atm.ittc.ukans.edu {
type = burstq (blocksize=videoMPEGFrameSize(min=8),
period=33000, buffer=65536, duration=1800);
protocol = tcp (window=1048576);
own = hopper.atm.ittc.ukans.edu:51306;
peer = arl.atm.ittc.ukans.edu:51306;
}
test arl.atm.ittc.ukans.edu {
type = sink (blocksize=65536, duration=1800);
protocol = tcp (window=1048576);
own = arl.atm.ittc.ukans.edu:51306;
peer = hopper.atm.ittc.ukans.edu:51306;
}
}
cluster {
test hopper.atm.ittc.ukans.edu {
type = burstq (blocksize=videoMPEGFrameSize(min=8),
period=33000, buffer=65536, duration=1800);
protocol = tcp (window=1048576);
own = hopper.atm.ittc.ukans.edu:51307;
peer = arl.atm.ittc.ukans.edu:51307;
}
test arl.atm.ittc.ukans.edu {
type = sink (blocksize=65536, duration=1800);
protocol = tcp (window=1048576);
own = arl.atm.ittc.ukans.edu:51307;
peer = hopper.atm.ittc.ukans.edu:51307;
}
}
cluster {
test hopper.atm.ittc.ukans.edu {
type = burstq (blocksize=videoMPEGFrameSize(min=8),
period=33000, buffer=65536, duration=1800);
protocol = tcp (window=1048576);
own = hopper.atm.ittc.ukans.edu:51308;
peer = arl.atm.ittc.ukans.edu:51308;
}
test arl.atm.ittc.ukans.edu {
type = sink (blocksize=65536, duration=1800);
protocol = tcp (window=1048576);
own = arl.atm.ittc.ukans.edu:51308;
peer = hopper.atm.ittc.ukans.edu:51308;
}
}
cluster {
test hopper.atm.ittc.ukans.edu {
type = burstq (blocksize=videoMPEGFrameSize(min=8),
period=33000, buffer=65536, duration=1800);
protocol = tcp (window=1048576);
108

own = hopper.atm.ittc.ukans.edu:51309;
peer = arl.atm.ittc.ukans.edu:51309;
}
test arl.atm.ittc.ukans.edu {
type = sink (blocksize=65536, duration=1800);
protocol = tcp (window=1048576);
own = arl.atm.ittc.ukans.edu:51309;
peer = hopper.atm.ittc.ukans.edu:51309;
}
}
cluster {
test hopper.atm.ittc.ukans.edu {
type = burstq (blocksize=videoMPEGFrameSize(min=8),
period=33000, buffer=65536, duration=1800);
protocol = tcp (window=1048576);
own = hopper.atm.ittc.ukans.edu:51310;
peer = arl.atm.ittc.ukans.edu:51310;
}
test arl.atm.ittc.ukans.edu {
type = sink (blocksize=65536, duration=1800);
protocol = tcp (window=1048576);
own = arl.atm.ittc.ukans.edu:51310;
peer = hopper.atm.ittc.ukans.edu:51310;
}
}
cluster {
test hopper.atm.ittc.ukans.edu {
type = burstq (blocksize=videoMPEGFrameSize(min=8),
period=33000, buffer=65536, duration=1800);
protocol = tcp (window=1048576);
own = hopper.atm.ittc.ukans.edu:51311;
peer = arl.atm.ittc.ukans.edu:51311;
}
test arl.atm.ittc.ukans.edu {
type = sink (blocksize=65536, duration=1800);
protocol = tcp (window=1048576);
own = arl.atm.ittc.ukans.edu:51311;
peer = hopper.atm.ittc.ukans.edu:51311;
}
}
cluster {
test hopper.atm.ittc.ukans.edu {
type = burstq (blocksize=videoMPEGFrameSize(min=8),
period=33000, buffer=65536, duration=1800);
protocol = tcp (window=1048576);
own = hopper.atm.ittc.ukans.edu:51312;
peer = arl.atm.ittc.ukans.edu:51312;
}
test arl.atm.ittc.ukans.edu {
type = sink (blocksize=65536, duration=1800);
protocol = tcp (window=1048576);
own = arl.atm.ittc.ukans.edu:51312;
peer = hopper.atm.ittc.ukans.edu:51312;
}
}
}
109

A.4 VideoConference script for Validation Ex-
periment
parallel {
cluster {
test hopper.atm.ittc.ukans.edu {
type = burstq (blocksize=videoTeleConferenceFrameSize(min=8),
period=66000, buffer=65536, duration=1800);
protocol = tcp (window=1048576);
own = hopper.atm.ittc.ukans.edu:51401;
peer = arl.atm.ittc.ukans.edu:51401;
}
test arl.atm.ittc.ukans.edu {
type = sink (blocksize=65536, duration=1800);
protocol = tcp (window=1048576);
own = arl.atm.ittc.ukans.edu:51401;
peer = hopper.atm.ittc.ukans.edu:51401;
}
}
cluster {
test hopper.atm.ittc.ukans.edu {
type = burstq (blocksize=videoTeleConferenceFrameSize(min=8),
period=66000, buffer=65536, duration=1800);
protocol = tcp (window=1048576);
own = hopper.atm.ittc.ukans.edu:51402;
peer = arl.atm.ittc.ukans.edu:51402;
}
test arl.atm.ittc.ukans.edu {
type = sink (blocksize=65536, duration=1800);
protocol = tcp (window=1048576);
own = arl.atm.ittc.ukans.edu:51402;
peer = hopper.atm.ittc.ukans.edu:51402;
}
}
cluster {
test hopper.atm.ittc.ukans.edu {
type = burstq (blocksize=videoTeleConferenceFrameSize(min=8),
period=66000, buffer=65536, duration=1800);
protocol = tcp (window=1048576);
own = hopper.atm.ittc.ukans.edu:51403;
peer = arl.atm.ittc.ukans.edu:51403;
}
test arl.atm.ittc.ukans.edu {
type = sink (blocksize=65536, duration=1800);
protocol = tcp (window=1048576);
own = arl.atm.ittc.ukans.edu:51403;
peer = hopper.atm.ittc.ukans.edu:51403;
}
}
cluster {
test hopper.atm.ittc.ukans.edu {
type = burstq (blocksize=videoTeleConferenceFrameSize(min=8),
period=66000, buffer=65536, duration=1800);
protocol = tcp (window=1048576);
own = hopper.atm.ittc.ukans.edu:51404;
peer = arl.atm.ittc.ukans.edu:51404;
}
test arl.atm.ittc.ukans.edu {
type = sink (blocksize=65536, duration=1800);
protocol = tcp (window=1048576);
110

own = arl.atm.ittc.ukans.edu:51404;
peer = hopper.atm.ittc.ukans.edu:51404;
}
}
cluster {
test hopper.atm.ittc.ukans.edu {
type = burstq (blocksize=videoTeleConferenceFrameSize(min=8),
period=66000, buffer=65536, duration=1800);
protocol = tcp (window=1048576);
own = hopper.atm.ittc.ukans.edu:51405;
peer = arl.atm.ittc.ukans.edu:51405;
}
test arl.atm.ittc.ukans.edu {
type = sink (blocksize=65536, duration=1800);
protocol = tcp (window=1048576);
own = arl.atm.ittc.ukans.edu:51405;
peer = hopper.atm.ittc.ukans.edu:51405;
}
}
cluster {
test hopper.atm.ittc.ukans.edu {
type = burstq (blocksize=videoTeleConferenceFrameSize(min=8),
period=66000, buffer=65536, duration=1800);
protocol = tcp (window=1048576);
own = hopper.atm.ittc.ukans.edu:51406;
peer = arl.atm.ittc.ukans.edu:51406;
}
test arl.atm.ittc.ukans.edu {
type = sink (blocksize=65536, duration=1800);
protocol = tcp (window=1048576);
own = arl.atm.ittc.ukans.edu:51406;
peer = hopper.atm.ittc.ukans.edu:51406;
}
}
cluster {
test hopper.atm.ittc.ukans.edu {
type = burstq (blocksize=videoTeleConferenceFrameSize(min=8),
period=66000, buffer=65536, duration=1800);
protocol = tcp (window=1048576);
own = hopper.atm.ittc.ukans.edu:51407;
peer = arl.atm.ittc.ukans.edu:51407;
}
test arl.atm.ittc.ukans.edu {
type = sink (blocksize=65536, duration=1800);
protocol = tcp (window=1048576);
own = arl.atm.ittc.ukans.edu:51407;
peer = hopper.atm.ittc.ukans.edu:51407;
}
}
}
111

Appendix B
NetSpec Scripts for WAN
Experiments
B.1 TCP Target Flows scripts
cluster {
test nccosc.atm.tisl.ukans.edu {
type = burstq (blocksize=9140, stamps=10000,
period=14000, qlimit=5000, duration=120);
protocol = tcp (window=1310720);
own = nccosc.atm.tisl.ukans.edu:51701;
peer = elmer.atm.tisl.ukans.edu:51701;
}
test elmer.atm.tisl.ukans.edu {
type = sink (blocksize=9140, stamps=40000,
duration=120);
protocol = tcp (window=1310720);
own = elmer.atm.tisl.ukans.edu:51701;
peer = nccosc.atm.tisl.ukans.edu:51701;
}
}
cluster {
test nccosc.atm.tisl.ukans.edu {
type = burstq (blocksize=18280, stamps=10000,
period=14000, qlimit=5000, duration=120);
protocol = tcp (window=1310720);
own = nccosc.atm.tisl.ukans.edu:51702;
peer = elmer.atm.tisl.ukans.edu:51702;
}
test elmer.atm.tisl.ukans.edu {
type = sink (blocksize=18280, stamps=50000,
duration=120);
protocol = tcp (window=1310720);
own = elmer.atm.tisl.ukans.edu:51702;
peer = nccosc.atm.tisl.ukans.edu:51702;
112

}
}
cluster {
test nccosc.atm.tisl.ukans.edu {
type = burstq (blocksize=27420, stamps=10000,
period=14000, qlimit=5000, duration=120);
protocol = tcp (window=1310720);
own = nccosc.atm.tisl.ukans.edu:51703;
peer = elmer.atm.tisl.ukans.edu:51703;
}
test elmer.atm.tisl.ukans.edu {
type = sink (blocksize=27420, stamps=60000,
duration=120);
protocol = tcp (window=1310720);
own = elmer.atm.tisl.ukans.edu:51703;
peer = nccosc.atm.tisl.ukans.edu:51703;
}
}
cluster {
test nccosc.atm.tisl.ukans.edu {
type = burstq (blocksize=36560, stamps=10000,
period=14000, qlimit=5000, duration=120);
protocol = tcp (window=1310720);
own = nccosc.atm.tisl.ukans.edu:51704;
peer = elmer.atm.tisl.ukans.edu:51704;
}
test elmer.atm.tisl.ukans.edu {
type = sink (blocksize=36560, stamps=70000,
duration=120);
protocol = tcp (window=1310720);
own = elmer.atm.tisl.ukans.edu:51704;
peer = nccosc.atm.tisl.ukans.edu:51704;
}
}
cluster {
test nccosc.atm.tisl.ukans.edu {
type = burstq (blocksize=45700, stamps=10000,
period=14000, qlimit=5000, duration=120);
protocol = tcp (window=1310720);
own = nccosc.atm.tisl.ukans.edu:51705;
peer = elmer.atm.tisl.ukans.edu:51705;
}
test elmer.atm.tisl.ukans.edu {
type = sink (blocksize=45700, stamps=80000,
duration=120);
protocol = tcp (window=1310720);
own = elmer.atm.tisl.ukans.edu:51705;
peer = nccosc.atm.tisl.ukans.edu:51705;
}
}
cluster {
test nccosc.atm.tisl.ukans.edu {
type = burstq (blocksize=54840, stamps=10000,
period=14000, qlimit=5000, duration=120);
protocol = tcp (window=1310720);
own = nccosc.atm.tisl.ukans.edu:51706;
peer = elmer.atm.tisl.ukans.edu:51706;
}
test elmer.atm.tisl.ukans.edu {
type = sink (blocksize=54840, stamps=90000,
duration=120);
protocol = tcp (window=1310720);
own = elmer.atm.tisl.ukans.edu:51706;
peer = nccosc.atm.tisl.ukans.edu:51706;
}
113

}
114

B.2 UDP Target Flows scripts
cluster {
test nccosc.atm.tisl.ukans.edu {
type = burst (blocksize=9140, stamps=9000,
period=14000, duration=120);
protocol = udp (xmtbuf=65536);
own = nccosc.atm.tisl.ukans.edu:51701;
peer = elmer.atm.tisl.ukans.edu:51701;
}
test elmer.atm.tisl.ukans.edu {
type = sink (blocksize=9140, stamps=9000,
durationCorrection=60000, lingerCycles=2000,
duration=120);
protocol = udp (rcvbuf=65536);
own = elmer.atm.tisl.ukans.edu:51701;
peer = nccosc.atm.tisl.ukans.edu:51701;
}
}
cluster {
test nccosc.atm.tisl.ukans.edu {
type = burst (blocksize=18280, stamps=9000,
period=14000, duration=120);
protocol = udp (xmtbuf=65536);
own = nccosc.atm.tisl.ukans.edu:51702;
peer = elmer.atm.tisl.ukans.edu:51702;
}
test elmer.atm.tisl.ukans.edu {
type = sink (blocksize=18280, stamps=9000,
durationCorrection=60000, lingerCycles=2000,
duration=120);
protocol = udp (rcvbuf=65536);
own = elmer.atm.tisl.ukans.edu:51702;
peer = nccosc.atm.tisl.ukans.edu:51702;
}
}
cluster {
test nccosc.atm.tisl.ukans.edu {
type = burst (blocksize=27420, stamps=9000,
period=14000, duration=120);
protocol = udp (xmtbuf=65536);
own = nccosc.atm.tisl.ukans.edu:51703;
peer = elmer.atm.tisl.ukans.edu:51703;
}
test elmer.atm.tisl.ukans.edu {
type = sink (blocksize=27420, stamps=9000,
durationCorrection=60000, lingerCycles=2000,
duration=120);
protocol = udp (rcvbuf=65536);
own = elmer.atm.tisl.ukans.edu:51703;
peer = nccosc.atm.tisl.ukans.edu:51703;
}
}
cluster {
test nccosc.atm.tisl.ukans.edu {
type = burst (blocksize=36560, stamps=9000,
period=14000, duration=120);
protocol = udp (xmtbuf=65536);
own = nccosc.atm.tisl.ukans.edu:51704;
peer = elmer.atm.tisl.ukans.edu:51704;
}
test elmer.atm.tisl.ukans.edu {
type = sink (blocksize=36560, stamps=9000,
115

durationCorrection=60000, lingerCycles=2000,
duration=120);
protocol = udp (rcvbuf=65536);
own = elmer.atm.tisl.ukans.edu:51704;
peer = nccosc.atm.tisl.ukans.edu:51704;
}
}
cluster {
test nccosc.atm.tisl.ukans.edu {
type = burst (blocksize=45700, stamps=9000,
period=14000, duration=120);
protocol = udp (xmtbuf=65536);
own = nccosc.atm.tisl.ukans.edu:51705;
peer = elmer.atm.tisl.ukans.edu:51705;
}
test elmer.atm.tisl.ukans.edu {
type = sink (blocksize=45700, stamps=9000,
durationCorrection=60000, lingerCycles=2000,
duration=120);
protocol = udp (rcvbuf=65536);
own = elmer.atm.tisl.ukans.edu:51705;
peer = nccosc.atm.tisl.ukans.edu:51705;
}
}
cluster {
test nccosc.atm.tisl.ukans.edu {
type = burst (blocksize=54840, stamps=9000,
period=14000, duration=120);
protocol = udp (xmtbuf=65536);
own = nccosc.atm.tisl.ukans.edu:51706;
peer = elmer.atm.tisl.ukans.edu:51706;
}
test elmer.atm.tisl.ukans.edu {
type = sink (blocksize=54840, stamps=9000,
durationCorrection=60000, lingerCycles=2000,
duration=120);
protocol = udp (rcvbuf=65536);
own = elmer.atm.tisl.ukans.edu:51706;
peer = nccosc.atm.tisl.ukans.edu:51706;
}
}
116

B.3 25Mbps Background Tra�c script
parallel {
cluster {
test arl.atm.tisl.ukans.edu {
type = burstq (blocksize=WWWItemSize(min=8, max=104857600, shape=0.40),
period=WWWRequestInterarrival(lambda=0.000011916, min=1000),
buffer=65536, duration=1800);
protocol = tcp (window=1048576);
own = arl.atm.tisl.ukans.edu:51201;
peer = hopper.atm.tisl.ukans.edu:51201;
}
test hopper.atm.tisl.ukans.edu {
type = sink (blocksize=65536, duration=1800);
protocol = tcp (window=1048576, rcvlowat=8);
own = hopper.atm.tisl.ukans.edu:51201;
peer = arl.atm.tisl.ukans.edu:51201;
}
}
cluster {
test nrl.atm.tisl.ukans.edu {
type = burstq (blocksize=ftpItemSize(min=8),
repeats=ftpNOfItems(min=1),
period=ftpSessionInterarrival(lambda=0.000001873, min=1000),
buffer=65536, duration=1800);
protocol = tcp (window=1048576);
own = nrl.atm.tisl.ukans.edu:51101;
peer = galaga.atm.tisl.ukans.edu:51101;
}
test galaga.atm.tisl.ukans.edu {
type = sink (blocksize=65536, duration=1800);
protocol = tcp (window=1048576, rcvlowat=8);
own = galaga.atm.tisl.ukans.edu:51101;
peer = nrl.atm.tisl.ukans.edu:51101;
}
}
cluster {
test arl.atm.tisl.ukans.edu {
type = burstq (blocksize=videoTeleConferenceFrameSize(min=8),
period=66000, buffer=65536, duration=1800);
protocol = tcp (window=1048576);
own = arl.atm.tisl.ukans.edu:51401;
peer = hopper.atm.tisl.ukans.edu:51401;
}
test hopper.atm.tisl.ukans.edu {
type = sink (blocksize=65536, duration=1800);
protocol = tcp (window=1048576, rcvlowat=8);
own = hopper.atm.tisl.ukans.edu:51401;
peer = arl.atm.tisl.ukans.edu:51401;
}
}
cluster {
test arl.atm.tisl.ukans.edu {
type = burstq (blocksize=videoTeleConferenceFrameSize(min=8),
period=66000, buffer=65536, duration=1800);
protocol = tcp (window=1048576);
own = arl.atm.tisl.ukans.edu:51402;
peer = hopper.atm.tisl.ukans.edu:51402;
}
test hopper.atm.tisl.ukans.edu {
type = sink (blocksize=65536, duration=1800);
protocol = tcp (window=1048576, rcvlowat=8);
own = hopper.atm.tisl.ukans.edu:51402;
117

peer = arl.atm.tisl.ukans.edu:51402;
}
}
cluster {
test arl.atm.tisl.ukans.edu {
type = burstq (blocksize=videoTeleConferenceFrameSize(min=8),
period=66000, buffer=65536, duration=1800);
protocol = tcp (window=1048576);
own = arl.atm.tisl.ukans.edu:51403;
peer = hopper.atm.tisl.ukans.edu:51403;
}
test hopper.atm.tisl.ukans.edu {
type = sink (blocksize=65536, duration=1800);
protocol = tcp (window=1048576, rcvlowat=8);
own = hopper.atm.tisl.ukans.edu:51403;
peer = arl.atm.tisl.ukans.edu:51403;
}
}
cluster {
test arl.atm.tisl.ukans.edu {
type = burstq (blocksize=videoTeleConferenceFrameSize(min=8),
period=66000, buffer=65536, duration=1800);
protocol = tcp (window=1048576);
own = arl.atm.tisl.ukans.edu:51404;
peer = hopper.atm.tisl.ukans.edu:51404;
}
test hopper.atm.tisl.ukans.edu {
type = sink (blocksize=65536, duration=1800);
protocol = tcp (window=1048576, rcvlowat=8);
own = hopper.atm.tisl.ukans.edu:51404;
peer = arl.atm.tisl.ukans.edu:51404;
}
}
cluster {
test arl.atm.tisl.ukans.edu {
type = burstq (blocksize=videoTeleConferenceFrameSize(min=8),
period=66000, buffer=65536, duration=1800);
protocol = tcp (window=1048576);
own = arl.atm.tisl.ukans.edu:51405;
peer = hopper.atm.tisl.ukans.edu:51405;
}
test hopper.atm.tisl.ukans.edu {
type = sink (blocksize=65536, duration=1800);
protocol = tcp (window=1048576, rcvlowat=8);
own = hopper.atm.tisl.ukans.edu:51405;
peer = arl.atm.tisl.ukans.edu:51405;
}
}
cluster {
test arl.atm.tisl.ukans.edu {
type = burstq (blocksize=videoTeleConferenceFrameSize(min=8),
period=66000, buffer=65536, duration=1800);
protocol = tcp (window=1048576);
own = arl.atm.tisl.ukans.edu:51406;
peer = hopper.atm.tisl.ukans.edu:51406;
}
test hopper.atm.tisl.ukans.edu {
type = sink (blocksize=65536, duration=1800);
protocol = tcp (window=1048576, rcvlowat=8);
own = hopper.atm.tisl.ukans.edu:51406;
peer = arl.atm.tisl.ukans.edu:51406;
}
}
cluster {
test arl.atm.tisl.ukans.edu {
118

type = burstq (blocksize=videoTeleConferenceFrameSize(min=8),
period=66000, buffer=65536, duration=1800);
protocol = tcp (window=1048576);
own = arl.atm.tisl.ukans.edu:51407;
peer = hopper.atm.tisl.ukans.edu:51407;
}
test hopper.atm.tisl.ukans.edu {
type = sink (blocksize=65536, duration=1800);
protocol = tcp (window=1048576, rcvlowat=8);
own = hopper.atm.tisl.ukans.edu:51407;
peer = arl.atm.tisl.ukans.edu:51407;
}
}
cluster {
test nrl.atm.tisl.ukans.edu {
type = burstq (blocksize=videoMPEGFrameSize(min=8),
period=33000, buffer=65536, duration=1800);
protocol = tcp (window=1048576);
own = nrl.atm.tisl.ukans.edu:51301;
peer = galaga.atm.tisl.ukans.edu:51301;
}
test galaga.atm.tisl.ukans.edu {
type = sink (blocksize=65536, duration=1800);
protocol = tcp (window=1048576, rcvlowat=8);
own = galaga.atm.tisl.ukans.edu:51301;
peer = nrl.atm.tisl.ukans.edu:51301;
}
}
cluster {
test nrl.atm.tisl.ukans.edu {
type = burstq (blocksize=videoMPEGFrameSize(min=8),
period=33000, buffer=65536, duration=1800);
protocol = tcp (window=1048576);
own = nrl.atm.tisl.ukans.edu:51302;
peer = galaga.atm.tisl.ukans.edu:51302;
}
test galaga.atm.tisl.ukans.edu {
type = sink (blocksize=65536, duration=1800);
protocol = tcp (window=1048576, rcvlowat=8);
own = galaga.atm.tisl.ukans.edu:51302;
peer = nrl.atm.tisl.ukans.edu:51302;
}
}
cluster {
test nrl.atm.tisl.ukans.edu {
type = burstq (blocksize=videoMPEGFrameSize(min=8),
period=33000, buffer=65536, duration=1800);
protocol = tcp (window=1048576);
own = nrl.atm.tisl.ukans.edu:51303;
peer = galaga.atm.tisl.ukans.edu:51303;
}
test galaga.atm.tisl.ukans.edu {
type = sink (blocksize=65536, duration=1800);
protocol = tcp (window=1048576, rcvlowat=8);
own = galaga.atm.tisl.ukans.edu:51303;
peer = nrl.atm.tisl.ukans.edu:51303;
}
}
cluster {
test nrl.atm.tisl.ukans.edu {
type = burstq (blocksize=videoMPEGFrameSize(min=8),
period=33000, buffer=65536, duration=1800);
protocol = tcp (window=1048576);
own = nrl.atm.tisl.ukans.edu:51304;
peer = galaga.atm.tisl.ukans.edu:51304;
119

}
test galaga.atm.tisl.ukans.edu {
type = sink (blocksize=65536, duration=1800);
protocol = tcp (window=1048576, rcvlowat=8);
own = galaga.atm.tisl.ukans.edu:51304;
peer = nrl.atm.tisl.ukans.edu:51304;
}
}
cluster {
test nrl.atm.tisl.ukans.edu {
type = burstq (blocksize=videoMPEGFrameSize(min=8),
period=33000, buffer=65536, duration=1800);
protocol = tcp (window=1048576);
own = nrl.atm.tisl.ukans.edu:51305;
peer = galaga.atm.tisl.ukans.edu:51305;
}
test galaga.atm.tisl.ukans.edu {
type = sink (blocksize=65536, duration=1800);
protocol = tcp (window=1048576, rcvlowat=8);
own = galaga.atm.tisl.ukans.edu:51305;
peer = nrl.atm.tisl.ukans.edu:51305;
}
}
cluster {
test nrl.atm.tisl.ukans.edu {
type = burstq (blocksize=videoMPEGFrameSize(min=8),
period=33000, buffer=65536, duration=1800);
protocol = tcp (window=1048576);
own = nrl.atm.tisl.ukans.edu:51306;
peer = galaga.atm.tisl.ukans.edu:51306;
}
test galaga.atm.tisl.ukans.edu {
type = sink (blocksize=65536, duration=1800);
protocol = tcp (window=1048576, rcvlowat=8);
own = galaga.atm.tisl.ukans.edu:51306;
peer = nrl.atm.tisl.ukans.edu:51306;
}
}
cluster {
test nrl.atm.tisl.ukans.edu {
type = burstq (blocksize=videoMPEGFrameSize(min=8),
period=33000, buffer=65536, duration=1800);
protocol = tcp (window=1048576);
own = nrl.atm.tisl.ukans.edu:51307;
peer = galaga.atm.tisl.ukans.edu:51307;
}
test galaga.atm.tisl.ukans.edu {
type = sink (blocksize=65536, duration=1800);
protocol = tcp (window=1048576, rcvlowat=8);
own = galaga.atm.tisl.ukans.edu:51307;
peer = nrl.atm.tisl.ukans.edu:51307;
}
}
cluster {
test nrl.atm.tisl.ukans.edu {
type = burstq (blocksize=videoMPEGFrameSize(min=8),
period=33000, buffer=65536, duration=1800);
protocol = tcp (window=1048576);
own = nrl.atm.tisl.ukans.edu:51308;
peer = galaga.atm.tisl.ukans.edu:51308;
}
test galaga.atm.tisl.ukans.edu {
type = sink (blocksize=65536, duration=1800);
protocol = tcp (window=1048576, rcvlowat=8);
own = galaga.atm.tisl.ukans.edu:51308;
120

peer = nrl.atm.tisl.ukans.edu:51308;
}
}
cluster {
test nrl.atm.tisl.ukans.edu {
type = burstq (blocksize=videoMPEGFrameSize(min=8),
period=33000, buffer=65536, duration=1800);
protocol = tcp (window=1048576);
own = nrl.atm.tisl.ukans.edu:51309;
peer = galaga.atm.tisl.ukans.edu:51309;
}
test galaga.atm.tisl.ukans.edu {
type = sink (blocksize=65536, duration=1800);
protocol = tcp (window=1048576, rcvlowat=8);
own = galaga.atm.tisl.ukans.edu:51309;
peer = nrl.atm.tisl.ukans.edu:51309;
}
}
cluster {
test nrl.atm.tisl.ukans.edu {
type = burstq (blocksize=videoMPEGFrameSize(min=8),
period=33000, buffer=65536, duration=1800);
protocol = tcp (window=1048576);
own = nrl.atm.tisl.ukans.edu:51310;
peer = galaga.atm.tisl.ukans.edu:51310;
}
test galaga.atm.tisl.ukans.edu {
type = sink (blocksize=65536, duration=1800);
protocol = tcp (window=1048576, rcvlowat=8);
own = galaga.atm.tisl.ukans.edu:51310;
peer = nrl.atm.tisl.ukans.edu:51310;
}
}
cluster {
test nrl.atm.tisl.ukans.edu {
type = burstq (blocksize=videoMPEGFrameSize(min=8),
period=33000, buffer=65536, duration=1800);
protocol = tcp (window=1048576);
own = nrl.atm.tisl.ukans.edu:51311;
peer = galaga.atm.tisl.ukans.edu:51311;
}
test galaga.atm.tisl.ukans.edu {
type = sink (blocksize=65536, duration=1800);
protocol = tcp (window=1048576, rcvlowat=8);
own = galaga.atm.tisl.ukans.edu:51311;
peer = nrl.atm.tisl.ukans.edu:51311;
}
}
cluster {
test nrl.atm.tisl.ukans.edu {
type = burstq (blocksize=videoMPEGFrameSize(min=8),
period=33000, buffer=65536, duration=1800);
protocol = tcp (window=1048576);
own = nrl.atm.tisl.ukans.edu:51312;
peer = galaga.atm.tisl.ukans.edu:51312;
}
test galaga.atm.tisl.ukans.edu {
type = sink (blocksize=65536, duration=1800);
protocol = tcp (window=1048576, rcvlowat=8);
own = galaga.atm.tisl.ukans.edu:51312;
peer = nrl.atm.tisl.ukans.edu:51312;
}
}
}
121

B.4 60Mbps Background Tra�c script
parallel {
cluster {
test arl.atm.tisl.ukans.edu {
type = burstq (blocksize=WWWItemSize(min=8, max=104857600, shape=0.40),
period=WWWRequestInterarrival(lambda=0.000035747, min=1000),
buffer=65536, duration=1800);
protocol = tcp (window=1048576);
own = arl.atm.tisl.ukans.edu:51201;
peer = hopper.atm.tisl.ukans.edu:51201;
}
test hopper.atm.tisl.ukans.edu {
type = sink (blocksize=65536, duration=1800);
protocol = tcp (window=1048576, rcvlowat=8);
own = hopper.atm.tisl.ukans.edu:51201;
peer = arl.atm.tisl.ukans.edu:51201;
}
}
cluster {
test nrl.atm.tisl.ukans.edu {
type = burstq (blocksize=ftpItemSize(min=8),
repeats=ftpNOfItems(min=1),
period=ftpSessionInterarrival(lambda=0.000003745, min=1000),
buffer=65536, duration=1800);
protocol = tcp (window=1048576);
own = nrl.atm.tisl.ukans.edu:51101;
peer = galaga.atm.tisl.ukans.edu:51101;
}
test galaga.atm.tisl.ukans.edu {
type = sink (blocksize=65536, duration=1800);
protocol = tcp (window=1048576, rcvlowat=8);
own = galaga.atm.tisl.ukans.edu:51101;
peer = nrl.atm.tisl.ukans.edu:51101;
}
}
cluster {
test arl.atm.tisl.ukans.edu {
type = burstq (blocksize=videoTeleConferenceFrameSize(min=8),
period=66000, buffer=65536, duration=1800);
protocol = tcp (window=1048576);
own = arl.atm.tisl.ukans.edu:51401;
peer = hopper.atm.tisl.ukans.edu:51401;
}
test hopper.atm.tisl.ukans.edu {
type = sink (blocksize=65536, duration=1800);
protocol = tcp (window=1048576, rcvlowat=8);
own = hopper.atm.tisl.ukans.edu:51401;
peer = arl.atm.tisl.ukans.edu:51401;
}
}
cluster {
test arl.atm.tisl.ukans.edu {
type = burstq (blocksize=videoTeleConferenceFrameSize(min=8),
period=66000, buffer=65536, duration=1800);
protocol = tcp (window=1048576);
own = arl.atm.tisl.ukans.edu:51402;
peer = hopper.atm.tisl.ukans.edu:51402;
}
test hopper.atm.tisl.ukans.edu {
type = sink (blocksize=65536, duration=1800);
protocol = tcp (window=1048576, rcvlowat=8);
own = hopper.atm.tisl.ukans.edu:51402;
122

peer = arl.atm.tisl.ukans.edu:51402;
}
}
cluster {
test arl.atm.tisl.ukans.edu {
type = burstq (blocksize=videoTeleConferenceFrameSize(min=8),
period=66000, buffer=65536, duration=1800);
protocol = tcp (window=1048576);
own = arl.atm.tisl.ukans.edu:51403;
peer = hopper.atm.tisl.ukans.edu:51403;
}
test hopper.atm.tisl.ukans.edu {
type = sink (blocksize=65536, duration=1800);
protocol = tcp (window=1048576, rcvlowat=8);
own = hopper.atm.tisl.ukans.edu:51403;
peer = arl.atm.tisl.ukans.edu:51403;
}
}
cluster {
test arl.atm.tisl.ukans.edu {
type = burstq (blocksize=videoTeleConferenceFrameSize(min=8),
period=66000, buffer=65536, duration=1800);
protocol = tcp (window=1048576);
own = arl.atm.tisl.ukans.edu:51404;
peer = hopper.atm.tisl.ukans.edu:51404;
}
test hopper.atm.tisl.ukans.edu {
type = sink (blocksize=65536, duration=1800);
protocol = tcp (window=1048576, rcvlowat=8);
own = hopper.atm.tisl.ukans.edu:51404;
peer = arl.atm.tisl.ukans.edu:51404;
}
}
cluster {
test arl.atm.tisl.ukans.edu {
type = burstq (blocksize=videoTeleConferenceFrameSize(min=8),
period=66000, buffer=65536, duration=1800);
protocol = tcp (window=1048576);
own = arl.atm.tisl.ukans.edu:51405;
peer = hopper.atm.tisl.ukans.edu:51405;
}
test hopper.atm.tisl.ukans.edu {
type = sink (blocksize=65536, duration=1800);
protocol = tcp (window=1048576, rcvlowat=8);
own = hopper.atm.tisl.ukans.edu:51405;
peer = arl.atm.tisl.ukans.edu:51405;
}
}
cluster {
test arl.atm.tisl.ukans.edu {
type = burstq (blocksize=videoTeleConferenceFrameSize(min=8),
period=66000, buffer=65536, duration=1800);
protocol = tcp (window=1048576);
own = arl.atm.tisl.ukans.edu:51406;
peer = hopper.atm.tisl.ukans.edu:51406;
}
test hopper.atm.tisl.ukans.edu {
type = sink (blocksize=65536, duration=1800);
protocol = tcp (window=1048576, rcvlowat=8);
own = hopper.atm.tisl.ukans.edu:51406;
peer = arl.atm.tisl.ukans.edu:51406;
}
}
cluster {
test arl.atm.tisl.ukans.edu {
123

type = burstq (blocksize=videoTeleConferenceFrameSize(min=8),
period=66000, buffer=65536, duration=1800);
protocol = tcp (window=1048576);
own = arl.atm.tisl.ukans.edu:51407;
peer = hopper.atm.tisl.ukans.edu:51407;
}
test hopper.atm.tisl.ukans.edu {
type = sink (blocksize=65536, duration=1800);
protocol = tcp (window=1048576, rcvlowat=8);
own = hopper.atm.tisl.ukans.edu:51407;
peer = arl.atm.tisl.ukans.edu:51407;
}
}
cluster {
test arl.atm.tisl.ukans.edu {
type = burstq (blocksize=videoTeleConferenceFrameSize(min=8),
period=66000, buffer=65536, duration=1800);
protocol = tcp (window=1048576);
own = arl.atm.tisl.ukans.edu:51408;
peer = hopper.atm.tisl.ukans.edu:51408;
}
test hopper.atm.tisl.ukans.edu {
type = sink (blocksize=65536, duration=1800);
protocol = tcp (window=1048576, rcvlowat=8);
own = hopper.atm.tisl.ukans.edu:51408;
peer = arl.atm.tisl.ukans.edu:51408;
}
}
cluster {
test arl.atm.tisl.ukans.edu {
type = burstq (blocksize=videoTeleConferenceFrameSize(min=8),
period=66000, buffer=65536, duration=1800);
protocol = tcp (window=1048576);
own = arl.atm.tisl.ukans.edu:51409;
peer = hopper.atm.tisl.ukans.edu:51409;
}
test hopper.atm.tisl.ukans.edu {
type = sink (blocksize=65536, duration=1800);
protocol = tcp (window=1048576, rcvlowat=8);
own = hopper.atm.tisl.ukans.edu:51409;
peer = arl.atm.tisl.ukans.edu:51409;
}
}
cluster {
test arl.atm.tisl.ukans.edu {
type = burstq (blocksize=videoTeleConferenceFrameSize(min=8),
period=66000, buffer=65536, duration=1800);
protocol = tcp (window=1048576);
own = arl.atm.tisl.ukans.edu:51410;
peer = hopper.atm.tisl.ukans.edu:51410;
}
test hopper.atm.tisl.ukans.edu {
type = sink (blocksize=65536, duration=1800);
protocol = tcp (window=1048576, rcvlowat=8);
own = hopper.atm.tisl.ukans.edu:51410;
peer = arl.atm.tisl.ukans.edu:51410;
}
}
cluster {
test arl.atm.tisl.ukans.edu {
type = burstq (blocksize=videoTeleConferenceFrameSize(min=8),
period=66000, buffer=65536, duration=1800);
protocol = tcp (window=1048576);
own = arl.atm.tisl.ukans.edu:51411;
peer = hopper.atm.tisl.ukans.edu:51411;
124

}
test hopper.atm.tisl.ukans.edu {
type = sink (blocksize=65536, duration=1800);
protocol = tcp (window=1048576, rcvlowat=8);
own = hopper.atm.tisl.ukans.edu:51411;
peer = arl.atm.tisl.ukans.edu:51411;
}
}
cluster {
test arl.atm.tisl.ukans.edu {
type = burstq (blocksize=videoTeleConferenceFrameSize(min=8),
period=66000, buffer=65536, duration=1800);
protocol = tcp (window=1048576);
own = arl.atm.tisl.ukans.edu:51412;
peer = hopper.atm.tisl.ukans.edu:51412;
}
test hopper.atm.tisl.ukans.edu {
type = sink (blocksize=65536, duration=1800);
protocol = tcp (window=1048576, rcvlowat=8);
own = hopper.atm.tisl.ukans.edu:51412;
peer = arl.atm.tisl.ukans.edu:51412;
}
}
cluster {
test arl.atm.tisl.ukans.edu {
type = burstq (blocksize=videoTeleConferenceFrameSize(min=8),
period=66000, buffer=65536, duration=1800);
protocol = tcp (window=1048576);
own = arl.atm.tisl.ukans.edu:51413;
peer = hopper.atm.tisl.ukans.edu:51413;
}
test hopper.atm.tisl.ukans.edu {
type = sink (blocksize=65536, duration=1800);
protocol = tcp (window=1048576, rcvlowat=8);
own = hopper.atm.tisl.ukans.edu:51413;
peer = arl.atm.tisl.ukans.edu:51413;
}
}
cluster {
test arl.atm.tisl.ukans.edu {
type = burstq (blocksize=videoTeleConferenceFrameSize(min=8),
period=66000, buffer=65536, duration=1800);
protocol = tcp (window=1048576);
own = arl.atm.tisl.ukans.edu:51414;
peer = hopper.atm.tisl.ukans.edu:51414;
}
test hopper.atm.tisl.ukans.edu {
type = sink (blocksize=65536, duration=1800);
protocol = tcp (window=1048576, rcvlowat=8);
own = hopper.atm.tisl.ukans.edu:51414;
peer = arl.atm.tisl.ukans.edu:51414;
}
}
cluster {
test nrl.atm.tisl.ukans.edu {
type = burstq (blocksize=videoMPEGFrameSize(min=8),
period=33000, buffer=65536, duration=1800);
protocol = tcp (window=1048576);
own = nrl.atm.tisl.ukans.edu:51301;
peer = galaga.atm.tisl.ukans.edu:51301;
}
test galaga.atm.tisl.ukans.edu {
type = sink (blocksize=65536, duration=1800);
protocol = tcp (window=1048576, rcvlowat=8);
own = galaga.atm.tisl.ukans.edu:51301;
125

peer = nrl.atm.tisl.ukans.edu:51301;
}
}
cluster {
test nrl.atm.tisl.ukans.edu {
type = burstq (blocksize=videoMPEGFrameSize(min=8),
period=33000, buffer=65536, duration=1800);
protocol = tcp (window=1048576);
own = nrl.atm.tisl.ukans.edu:51302;
peer = galaga.atm.tisl.ukans.edu:51302;
}
test galaga.atm.tisl.ukans.edu {
type = sink (blocksize=65536, duration=1800);
protocol = tcp (window=1048576, rcvlowat=8);
own = galaga.atm.tisl.ukans.edu:51302;
peer = nrl.atm.tisl.ukans.edu:51302;
}
}
cluster {
test nrl.atm.tisl.ukans.edu {
type = burstq (blocksize=videoMPEGFrameSize(min=8),
period=33000, buffer=65536, duration=1800);
protocol = tcp (window=1048576);
own = nrl.atm.tisl.ukans.edu:51303;
peer = galaga.atm.tisl.ukans.edu:51303;
}
test galaga.atm.tisl.ukans.edu {
type = sink (blocksize=65536, duration=1800);
protocol = tcp (window=1048576, rcvlowat=8);
own = galaga.atm.tisl.ukans.edu:51303;
peer = nrl.atm.tisl.ukans.edu:51303;
}
}
cluster {
test nrl.atm.tisl.ukans.edu {
type = burstq (blocksize=videoMPEGFrameSize(min=8),
period=33000, buffer=65536, duration=1800);
protocol = tcp (window=1048576);
own = nrl.atm.tisl.ukans.edu:51304;
peer = galaga.atm.tisl.ukans.edu:51304;
}
test galaga.atm.tisl.ukans.edu {
type = sink (blocksize=65536, duration=1800);
protocol = tcp (window=1048576, rcvlowat=8);
own = galaga.atm.tisl.ukans.edu:51304;
peer = nrl.atm.tisl.ukans.edu:51304;
}
}
cluster {
test nrl.atm.tisl.ukans.edu {
type = burstq (blocksize=videoMPEGFrameSize(min=8),
period=33000, buffer=65536, duration=1800);
protocol = tcp (window=1048576);
own = nrl.atm.tisl.ukans.edu:51305;
peer = galaga.atm.tisl.ukans.edu:51305;
}
test galaga.atm.tisl.ukans.edu {
type = sink (blocksize=65536, duration=1800);
protocol = tcp (window=1048576, rcvlowat=8);
own = galaga.atm.tisl.ukans.edu:51305;
peer = nrl.atm.tisl.ukans.edu:51305;
}
}
cluster {
test nrl.atm.tisl.ukans.edu {
126

type = burstq (blocksize=videoMPEGFrameSize(min=8),
period=33000, buffer=65536, duration=1800);
protocol = tcp (window=1048576);
own = nrl.atm.tisl.ukans.edu:51306;
peer = galaga.atm.tisl.ukans.edu:51306;
}
test galaga.atm.tisl.ukans.edu {
type = sink (blocksize=65536, duration=1800);
protocol = tcp (window=1048576, rcvlowat=8);
own = galaga.atm.tisl.ukans.edu:51306;
peer = nrl.atm.tisl.ukans.edu:51306;
}
}
cluster {
test nrl.atm.tisl.ukans.edu {
type = burstq (blocksize=videoMPEGFrameSize(min=8),
period=33000, buffer=65536, duration=1800);
protocol = tcp (window=1048576);
own = nrl.atm.tisl.ukans.edu:51307;
peer = galaga.atm.tisl.ukans.edu:51307;
}
test galaga.atm.tisl.ukans.edu {
type = sink (blocksize=65536, duration=1800);
protocol = tcp (window=1048576, rcvlowat=8);
own = galaga.atm.tisl.ukans.edu:51307;
peer = nrl.atm.tisl.ukans.edu:51307;
}
}
cluster {
test nrl.atm.tisl.ukans.edu {
type = burstq (blocksize=videoMPEGFrameSize(min=8),
period=33000, buffer=65536, duration=1800);
protocol = tcp (window=1048576);
own = nrl.atm.tisl.ukans.edu:51308;
peer = galaga.atm.tisl.ukans.edu:51308;
}
test galaga.atm.tisl.ukans.edu {
type = sink (blocksize=65536, duration=1800);
protocol = tcp (window=1048576, rcvlowat=8);
own = galaga.atm.tisl.ukans.edu:51308;
peer = nrl.atm.tisl.ukans.edu:51308;
}
}
cluster {
test nrl.atm.tisl.ukans.edu {
type = burstq (blocksize=videoMPEGFrameSize(min=8),
period=33000, buffer=65536, duration=1800);
protocol = tcp (window=1048576);
own = nrl.atm.tisl.ukans.edu:51309;
peer = galaga.atm.tisl.ukans.edu:51309;
}
test galaga.atm.tisl.ukans.edu {
type = sink (blocksize=65536, duration=1800);
protocol = tcp (window=1048576, rcvlowat=8);
own = galaga.atm.tisl.ukans.edu:51309;
peer = nrl.atm.tisl.ukans.edu:51309;
}
}
cluster {
test nrl.atm.tisl.ukans.edu {
type = burstq (blocksize=videoMPEGFrameSize(min=8),
period=33000, buffer=65536, duration=1800);
protocol = tcp (window=1048576);
own = nrl.atm.tisl.ukans.edu:51310;
peer = galaga.atm.tisl.ukans.edu:51310;
127

}
test galaga.atm.tisl.ukans.edu {
type = sink (blocksize=65536, duration=1800);
protocol = tcp (window=1048576, rcvlowat=8);
own = galaga.atm.tisl.ukans.edu:51310;
peer = nrl.atm.tisl.ukans.edu:51310;
}
}
cluster {
test nrl.atm.tisl.ukans.edu {
type = burstq (blocksize=videoMPEGFrameSize(min=8),
period=33000, buffer=65536, duration=1800);
protocol = tcp (window=1048576);
own = nrl.atm.tisl.ukans.edu:51311;
peer = galaga.atm.tisl.ukans.edu:51311;
}
test galaga.atm.tisl.ukans.edu {
type = sink (blocksize=65536, duration=1800);
protocol = tcp (window=1048576, rcvlowat=8);
own = galaga.atm.tisl.ukans.edu:51311;
peer = nrl.atm.tisl.ukans.edu:51311;
}
}
cluster {
test nrl.atm.tisl.ukans.edu {
type = burstq (blocksize=videoMPEGFrameSize(min=8),
period=33000, buffer=65536, duration=1800);
protocol = tcp (window=1048576);
own = nrl.atm.tisl.ukans.edu:51312;
peer = galaga.atm.tisl.ukans.edu:51312;
}
test galaga.atm.tisl.ukans.edu {
type = sink (blocksize=65536, duration=1800);
protocol = tcp (window=1048576, rcvlowat=8);
own = galaga.atm.tisl.ukans.edu:51312;
peer = nrl.atm.tisl.ukans.edu:51312;
}
}
cluster {
test nrl.atm.tisl.ukans.edu {
type = burstq (blocksize=videoMPEGFrameSize(min=8),
period=33000, buffer=65536, duration=1800);
protocol = tcp (window=1048576);
own = nrl.atm.tisl.ukans.edu:51313;
peer = galaga.atm.tisl.ukans.edu:51313;
}
test galaga.atm.tisl.ukans.edu {
type = sink (blocksize=65536, duration=1800);
protocol = tcp (window=1048576, rcvlowat=8);
own = galaga.atm.tisl.ukans.edu:51313;
peer = nrl.atm.tisl.ukans.edu:51313;
}
}
cluster {
test nrl.atm.tisl.ukans.edu {
type = burstq (blocksize=videoMPEGFrameSize(min=8),
period=33000, buffer=65536, duration=1800);
protocol = tcp (window=1048576);
own = nrl.atm.tisl.ukans.edu:51314;
peer = galaga.atm.tisl.ukans.edu:51314;
}
test galaga.atm.tisl.ukans.edu {
type = sink (blocksize=65536, duration=1800);
protocol = tcp (window=1048576, rcvlowat=8);
own = galaga.atm.tisl.ukans.edu:51314;
128

peer = nrl.atm.tisl.ukans.edu:51314;
}
}
cluster {
test nrl.atm.tisl.ukans.edu {
type = burstq (blocksize=videoMPEGFrameSize(min=8),
period=33000, buffer=65536, duration=1800);
protocol = tcp (window=1048576);
own = nrl.atm.tisl.ukans.edu:51315;
peer = galaga.atm.tisl.ukans.edu:51315;
}
test galaga.atm.tisl.ukans.edu {
type = sink (blocksize=65536, duration=1800);
protocol = tcp (window=1048576, rcvlowat=8);
own = galaga.atm.tisl.ukans.edu:51315;
peer = nrl.atm.tisl.ukans.edu:51315;
}
}
cluster {
test nrl.atm.tisl.ukans.edu {
type = burstq (blocksize=videoMPEGFrameSize(min=8),
period=33000, buffer=65536, duration=1800);
protocol = tcp (window=1048576);
own = nrl.atm.tisl.ukans.edu:51316;
peer = galaga.atm.tisl.ukans.edu:51316;
}
test galaga.atm.tisl.ukans.edu {
type = sink (blocksize=65536, duration=1800);
protocol = tcp (window=1048576, rcvlowat=8);
own = galaga.atm.tisl.ukans.edu:51316;
peer = nrl.atm.tisl.ukans.edu:51316;
}
}
cluster {
test nrl.atm.tisl.ukans.edu {
type = burstq (blocksize=videoMPEGFrameSize(min=8),
period=33000, buffer=65536, duration=1800);
protocol = tcp (window=1048576);
own = nrl.atm.tisl.ukans.edu:51317;
peer = galaga.atm.tisl.ukans.edu:51317;
}
test galaga.atm.tisl.ukans.edu {
type = sink (blocksize=65536, duration=1800);
protocol = tcp (window=1048576, rcvlowat=8);
own = galaga.atm.tisl.ukans.edu:51317;
peer = nrl.atm.tisl.ukans.edu:51317;
}
}
cluster {
test nrl.atm.tisl.ukans.edu {
type = burstq (blocksize=videoMPEGFrameSize(min=8),
period=33000, buffer=65536, duration=1800);
protocol = tcp (window=1048576);
own = nrl.atm.tisl.ukans.edu:51318;
peer = galaga.atm.tisl.ukans.edu:51318;
}
test galaga.atm.tisl.ukans.edu {
type = sink (blocksize=65536, duration=1800);
protocol = tcp (window=1048576, rcvlowat=8);
own = galaga.atm.tisl.ukans.edu:51318;
peer = nrl.atm.tisl.ukans.edu:51318;
}
}
cluster {
test nrl.atm.tisl.ukans.edu {
129

type = burstq (blocksize=videoMPEGFrameSize(min=8),
period=33000, buffer=65536, duration=1800);
protocol = tcp (window=1048576);
own = nrl.atm.tisl.ukans.edu:51319;
peer = galaga.atm.tisl.ukans.edu:51319;
}
test galaga.atm.tisl.ukans.edu {
type = sink (blocksize=65536, duration=1800);
protocol = tcp (window=1048576, rcvlowat=8);
own = galaga.atm.tisl.ukans.edu:51319;
peer = nrl.atm.tisl.ukans.edu:51319;
}
}
cluster {
test nrl.atm.tisl.ukans.edu {
type = burstq (blocksize=videoMPEGFrameSize(min=8),
period=33000, buffer=65536, duration=1800);
protocol = tcp (window=1048576);
own = nrl.atm.tisl.ukans.edu:51320;
peer = galaga.atm.tisl.ukans.edu:51320;
}
test galaga.atm.tisl.ukans.edu {
type = sink (blocksize=65536, duration=1800);
protocol = tcp (window=1048576, rcvlowat=8);
own = galaga.atm.tisl.ukans.edu:51320;
peer = nrl.atm.tisl.ukans.edu:51320;
}
}
cluster {
test nrl.atm.tisl.ukans.edu {
type = burstq (blocksize=videoMPEGFrameSize(min=8),
period=33000, buffer=65536, duration=1800);
protocol = tcp (window=1048576);
own = nrl.atm.tisl.ukans.edu:51321;
peer = galaga.atm.tisl.ukans.edu:51321;
}
test galaga.atm.tisl.ukans.edu {
type = sink (blocksize=65536, duration=1800);
protocol = tcp (window=1048576, rcvlowat=8);
own = galaga.atm.tisl.ukans.edu:51321;
peer = nrl.atm.tisl.ukans.edu:51321;
}
}
cluster {
test nrl.atm.tisl.ukans.edu {
type = burstq (blocksize=videoMPEGFrameSize(min=8),
period=33000, buffer=65536, duration=1800);
protocol = tcp (window=1048576);
own = nrl.atm.tisl.ukans.edu:51322;
peer = galaga.atm.tisl.ukans.edu:51322;
}
test galaga.atm.tisl.ukans.edu {
type = sink (blocksize=65536, duration=1800);
protocol = tcp (window=1048576, rcvlowat=8);
own = galaga.atm.tisl.ukans.edu:51322;
peer = nrl.atm.tisl.ukans.edu:51322;
}
}
cluster {
test nrl.atm.tisl.ukans.edu {
type = burstq (blocksize=videoMPEGFrameSize(min=8),
period=33000, buffer=65536, duration=1800);
protocol = tcp (window=1048576);
own = nrl.atm.tisl.ukans.edu:51323;
peer = galaga.atm.tisl.ukans.edu:51323;
130

}
test galaga.atm.tisl.ukans.edu {
type = sink (blocksize=65536, duration=1800);
protocol = tcp (window=1048576, rcvlowat=8);
own = galaga.atm.tisl.ukans.edu:51323;
peer = nrl.atm.tisl.ukans.edu:51323;
}
}
}
131

Bibliography
[1] V. Paxson, "Empirically Derived Analytic Models of Wide-Area TCP Con-
nections," IEEE/ACM Transactions on Networking, VOL. 2, NO. 4, August
1994.
[2] V. Paxson, "Empirically-derived analytic models of wide-area TCP connec-
tions : Extended report," Lawrence Berkeley Lab., Rep. LBL-34086, May,
1993, Available as papers/ WAN-TCP-models.prelim.1.ps.Z and WAN-TCP-
models.prelim.2.ps.Z via anonymous FTP to ftp.ee.lbl.gov.
[3] V. Paxson, and S. Floyd, "Wide-Area Tra�c : The Failure of Poisson Mod-
eling," Lawrence Berkeley Lab., July 18, 1995.
[4] R. Caceres, P.B. Danzig, S. Jamin, and D.J. Mitzel, "Characteristics of Wide-
Area TCP/IP Conversations," Computer Science Department, University of
Southern California, Los Angeles, California.
[5] P.B. Danzig, and S. Jamin, "tcplib : A Library of TCP Internetwork Traf-
�c Characteristics, " Computer Science Department, University of Southern
California, Los Angeles, California. USC-CS-91-495.
[6] P.B. Danzig, S. Jamin, R. Caceres, D.J. Mitzel, and D. Estrin, "An Empir-
ical Workload Model for Driving Wide-Area TCP/IP Network Simulations,
132

"Computer Science Department, University of Southern California, Los An-
geles, California.
[7] D.P. Heyman, A. Tabatabai, and T.V. Lakshman, "Statistical Analysis and
Simulation Study of Video Teleconference Tra�c in ATM Networks, " IEEE
Transactions on Circuits and System for Video Technology, VOL. 2, NO. 1,
March 1992.
[8] B. Maglaris, D. Anastassiou, P. Sen, G. Karlsson, and J.D. Robbins, "Perfor-
mance Models of Statistical Multiplexing in Packet Video Communications,
" IEEE Transactions on Communications, VOL. 36, NO. 7, July 1988.
[9] N.M. Mara�h, Y. Zhang, and R.L. Pickholtz, "Modeling and Queueing Anal-
ysis of Variable-Bit-Rate Coded Video Sources in ATM Networks, " IEEE
Transactions on Circuits and Systems for Video Technology, VOL. 4, NO. 2,
April 1994.
[10] D. P. Heyman and T. V. Lakshman, "Source Models for VBR Broadcast-
Video Tra�c," IEEE/ACM Transactions on Networking, VOL. 4, NO. 1,
February 1996.
[11] M. Krunz, and J. Hughes, "A Tra�c Mopdel For MPEG-Coded VBR
Streams," Department of Electrical Engineering, Department of Computer
Science, Michigan State University.
[12] J. Murphy, "Resource Allocation in ATM networks, " Dublin City University,
March 1996.
[13] R.O. Pnvural, "ASYNCHRONOUS TRANSFER MODE NETWORKS :
Performance Issues, " 2nd Edition, Artech House Boston London, ISBN 0-
89006-804-6.
133

[14] S.F. Smith, "Telephony and Telegraphy," Oxford University Press, 3rd Edi-
tion, 1978.
[15] R.L. Freeman, "Telecommunication System Engineering," 2nd Edition, John
Wiley & Sons, 1989.
[16] C. R. Cunha, A. Bestavros, and M. E. Crovella, "Characteristics of WWW
Client-based Traces," Computer Science Department, Boston University.
Technical Report BU-CS-95-010, July 18, 1995.
[17] M. E. Crovella and A. Bestavros, "Explaining World Wide Web Tra�c Self-
Similarity," Computer Science Department, Boston University, Revised Tech-
nical Report TR-95-015, October 12, 1995.
[18] T.T. Kwan, R.E. McGrath, and D.A. Reed, "User Access Patterns to
NCSA's World Wide Web Server," National Center for Supercomputing Ap-
plications, University of Illinois.
[19] M. F. Arlitt and C. L. Williamson, "Web Server Workload Characterization
: The Search for Invariants," Department of Computer Science, University of
Saskatchewan, 1996.
[20] J. A. Martin, "Internet Overload : Disaster in the Making?", PC World
Magazine, October 1996, P. 145.
[21] Roelof Jonkman, "NetSpec
3.0", http://www.ittc.ukans.edu/projects/aai/products/netspec/, November
1997.
134

[22] V.S. Frost, D.S. Petr, J.B. Evans, D. Niehaus "AAI Performance and Con-
gestion Management Studies : Year 1 Technical Report", Telecommunications
and Information Sciences Laboratory, January 1996.
[23] M. D. Linhart, V.S. Frost, "ATM Background Tra�c Impact on UDP Pack-
ets, " Information and Telecommunications Technology Center, December
1997.
[24] R.Atkinson, "RFC Default IP MTU for use over ATM AAL5," RFC 1626,
Naval Research Laboratory, May 1994
135