why transmissivity values from specific capacity tests ... · pdf filewhy transmissivity...
TRANSCRIPT

Why Transmissivity Values from Specific Capacity Tests Appear
Unreliable
Rich SouleJustin Blum
Steve Robertson

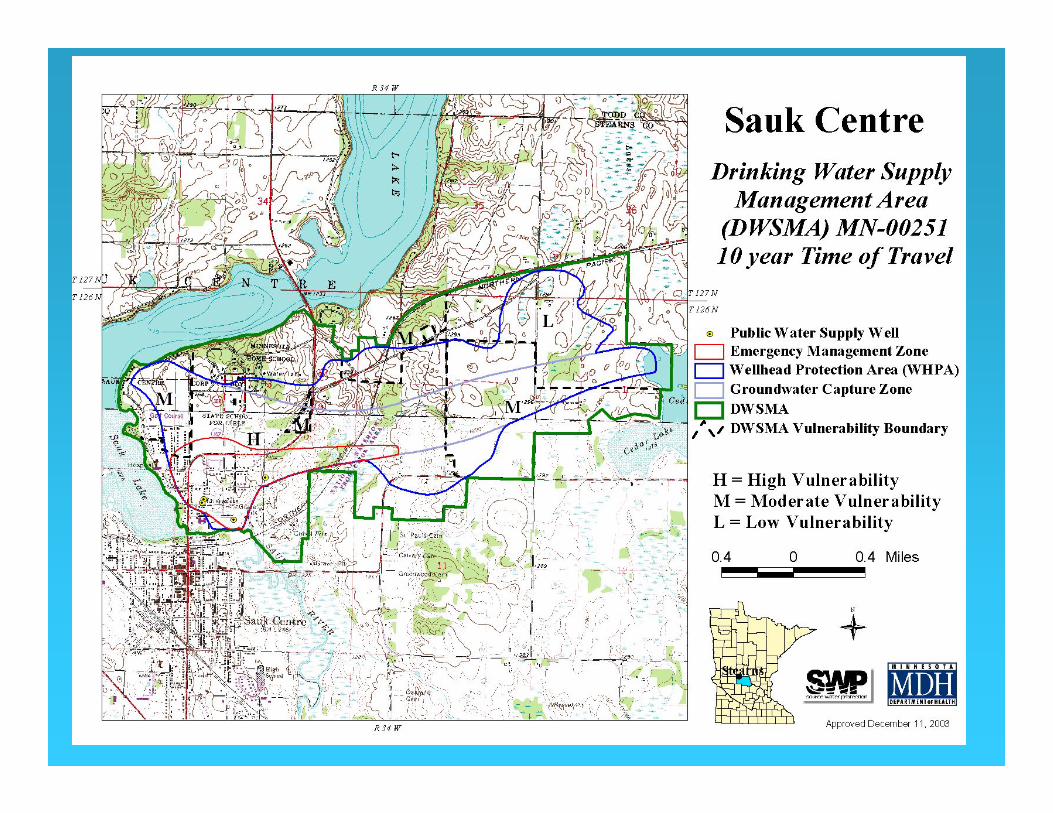
Wellhead Protection in Minnesota
•State Wellhead Protection Rule specifies the use of groundwater flow models to determine wellhead protection areas.
•Transmissivity is typically the most sensitive and uncertain parameter in these models.
•There are over 900 community water supply systems covered by the Rule.
•There are six of us to do the work.
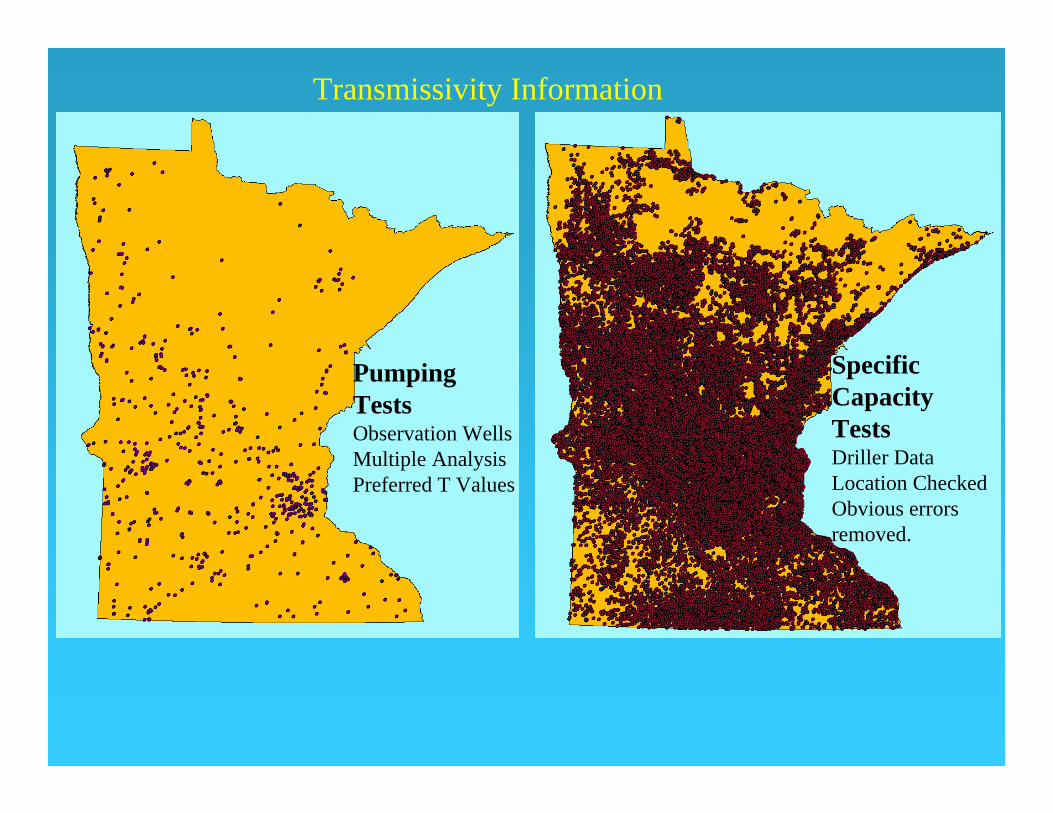
Transmissivity Information
Pumping TestsObservation WellsMultiple AnalysisPreferred T Values
Specific Capacity TestsDriller DataLocation CheckedObvious errors removed.

⎥⎦
⎤⎢⎣
⎡=
SrtT
sQT
w 25.2ln
4 2π
⎥⎦
⎤⎢⎣
⎡=
SrtT
TQs
w 25.2ln
4 2πCooper and Jacob, 1946 Assume
S = Specific StorageCalculateT = Transmissivity
Iterate
Estimating T from a Specific Capacity Test
MeasuredQ= discharges = drawdownt = time since startrw = radius of well
t2
Q
st1

Test Differences
Discharge
High
Low
Duration
Days
Hours
WaterLevelsVery Many
Two
ObservedWells
Several
One
AnalysisMethods
TooMany
Few
TestType
Pumping
Specific Capacity

T S Bounds Leakage Number
489
127,834
TestType
Pumping
Specific Capacity
Information Available from Test
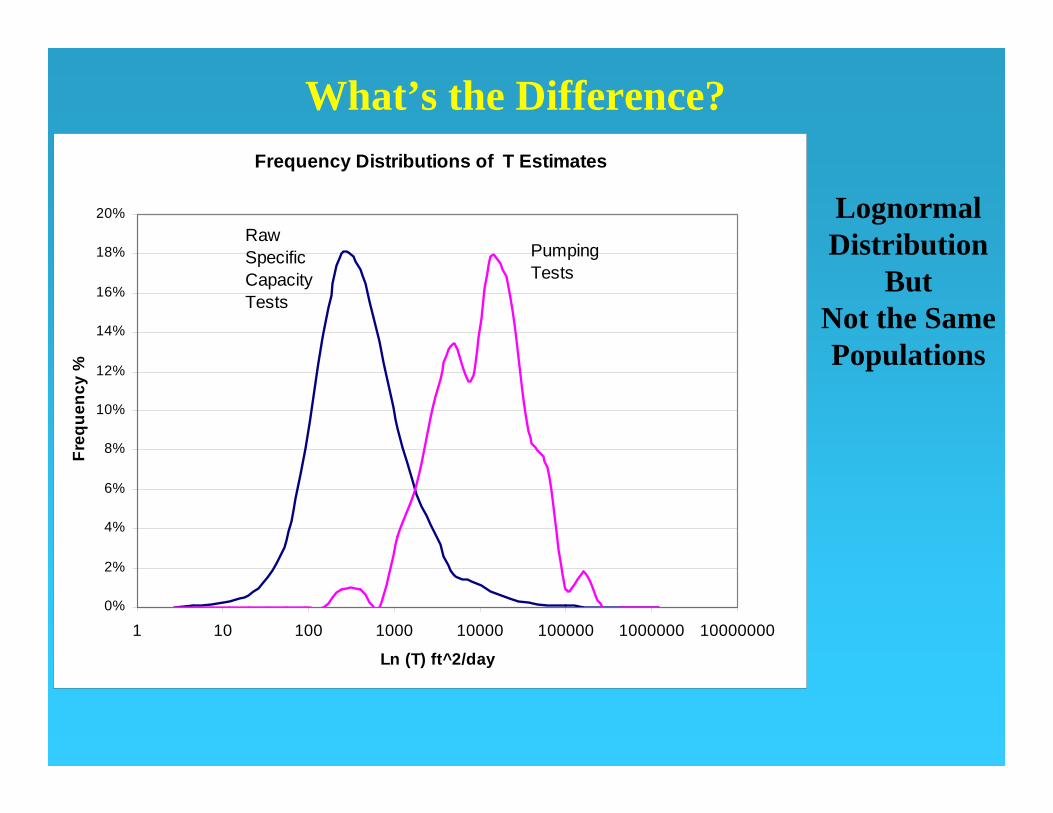
What’s the Difference?Frequency Distributions of T Estimates
0%
2%
4%
6%
8%
10%
12%
14%
16%
18%
20%
1 10 100 1000 10000 100000 1000000 10000000
Ln (T) ft^2/day
Fre
quen
cy %
RawSpecificCapacityTests
PumpingTests
LognormalDistribution
ButNot the SamePopulations

Pumping Tests v. Specific Capacity (Ft̂ 2/day)
10
100
1000
10000
100000
10 100 1000 10000 100000
Pumping Test Preferred T
Spec
ific
Cap
acity
ScatteredR2=.25
ButUnbiased
Direct Comparison of Methods-Same WellsSp
ecifi
c C
apac
ity T
T (ft2/day)

ScatteredR2=.20
Butalso
Unbiased
Pumping Tests Preferred v. Other Analysis Methods
10
100
1000
10000
100000
10 100 1000 10000 100000
Pumping Test Preferred Method
Pum
ping
Tes
t Oth
er M
etPumping Tests – Different Analysis Methods

Conventional WisdomFrequency Distributions of T Estimates
0%
2%
4%
6%
8%
10%
12%
14%
16%
18%
20%
1 10 100 1000 10000 100000 1000000 10000000T ft 2̂/day
%
SpecificCapacityTests
PumpingTests
Specific Capacity
Pumping Test
•Measurement Bias.•Limited Data•Limited Analysis•Just wrong.
•No Measurement Bias.•Lots of Data•Unlimited Analysis•Always right.
LOCATION LOCATION LOCATION

•Pumping tests are done in wells located and designed for high production.
•Specific capacity tests are done in domestic wells located randomly and designed to meet a minimum demand.
Population Bias

Population Bias: Spatial Variation
(meters)
Within 6 km variability is due to small scale effects or measurement error.
Beyond 6 km morethan half of the variability is due to location.

•Find all specific capacity tests within 2 km of the pumping tests.
•Determine the average values for these tests.
•Check for bias.
•Correlation should improve with the number of specific capacity tests.
Pumping Tests
Confirming the Location Bias

Meak K of Specific Capacity within 2 km v. Pumping Test K
1
10
100
1000
10000
1 10 100 1000 10000
K (ft/day) Pumping Test
Mea
n K
(ft/d
ay) S
peci
fic C
apac
ity
Scattered But UnbiasedCheck for Bias
Meak K of Specific Capacity within 2 Km v. Pumping Test KN>20
1
10
100
1000
10000
1 10 100 1000 10000
K (ft/day) Pumping Test
Mea
n K
(ft/d
ay) S
peci
fic C
apac
ity
Correlation improves with N

Sources of Specific Capacity Bias:
•Measurement Error•Partial Penetration•Aquifer Heterogeneity•Casing Storage •Well Efficiency
Would be unbiased
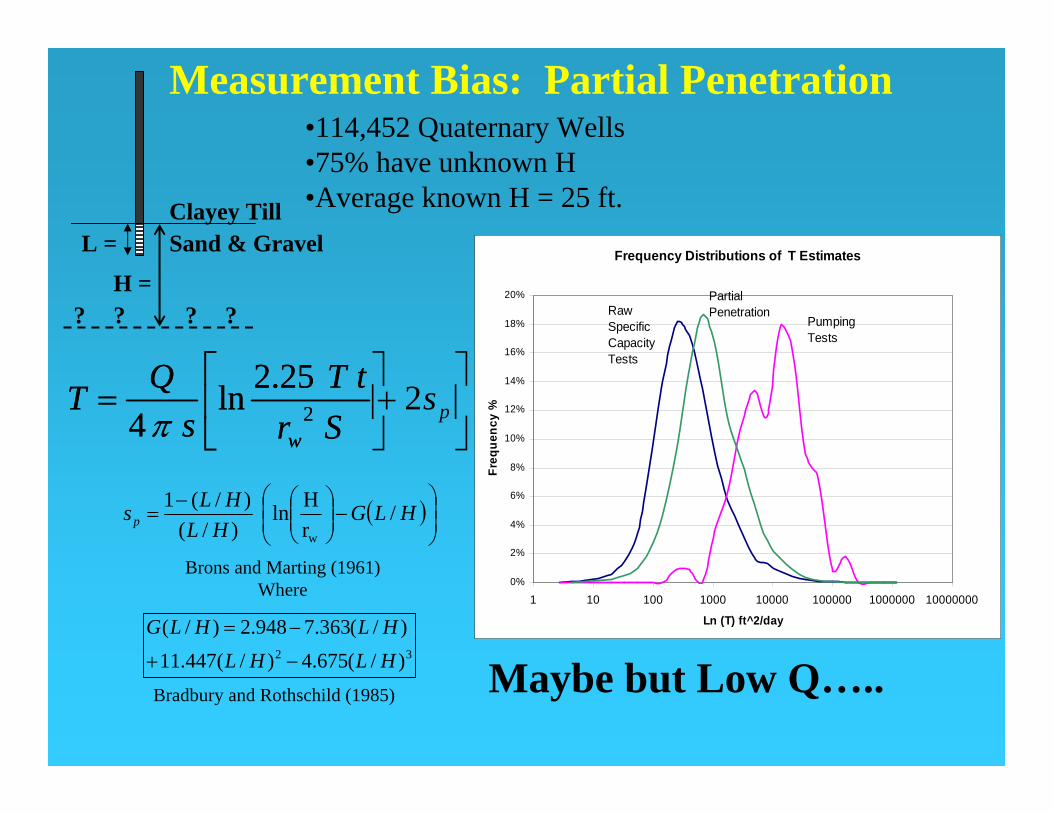
Measurement Bias: Partial Penetration•114,452 Quaternary Wells•75% have unknown H•Average known H = 25 ft.
⎥⎦
⎤⎢⎣
⎡=
SrtT
sQT
w 25.2ln
4 2π
Clayey TillSand & Gravel
H =
L =
? ? ? ?
⎥⎦
⎤⎢⎣
⎡+= p
w
sSr
tTs
QT 2
25.2ln 4 2π
( )⎟⎟⎠
⎞⎜⎜⎝
⎛−⎟⎟
⎠
⎞⎜⎜⎝
⎛−= HLG
HLHLsp /
rHln
)/()/(1
w
Brons and Marting (1961)Where
32 )/(675.4)/(447.11)/(363.7948.2)/(
HLHLHLHLG
−+
−=
Bradbury and Rothschild (1985)
Frequency Distributions of T Estimates
0%
2%
4%
6%
8%
10%
12%
14%
16%
18%
20%
1 10 100 1000 10000 100000 1000000 10000000
Ln (T) ft^2/day
Fre
quen
cy %
RawSpecificCapacityTests
PumpingTests
Frequency Distributions of T Estimates
0%
2%
4%
6%
8%
10%
12%
14%
16%
18%
20%
1 10 100 1000 10000 100000 1000000 10000000
Ln (T) ft^2/day
Fre
quen
cy %
RawSpecificCapacityTests
PumpingTests
PartialPenetration
Maybe but Low Q…..

Mean K v. Screen Length
0
200
400
600
800
1000
1200
1400
0 5 10 15 20 25 30
Screen Length (ft)
K (F
t/day
)
95% Confideinceof the Mean
Measurement Bias: Isotropic Aquifer
Lucky StrikeZone
AverageJoe Zone
InterestingZone
If the Aquifer is Isotropic K is constant for different screen lengths

Average Joes' Percentiles 5 ft.Screens
1
10
100
1000
10000
100000
0% 10% 20% 30% 40% 50% 60% 70% 80% 90% 100%
Percentile
T (f
t^2/
day)
Interesting Like the Chinese Curse
15 ft. 4406606
20 ft. 9600 480
10 ft. 13713701370
4807420 1379
348 947 2134 6171
ScreenLength
Tft2/day
Kft/day
A Statistical Model

Heterogeneous Aquifer: Interesting ZoneMean K v. Screen Length
0
100
200
300
400
500
600
700
800
900
1000
10 15 20 25 30
Scren Length (ft)
K (F
t/day
)
95% Confideinceof the Mean
Modeled K
May be an Important Measurement Bias

Casing Storage Effects?
Log Time
1 10 100 1000 10000
Dra
wdo
wn
(s)
10
0
20
30
40
T1
T2
tc
sQdd
t pcc /
)( 6.0 22 −=
dc = casing diameter (in)dp = riser diameter (in)Q in gpm, s in feet
Schafer (1978) from Popadoplus-Cooper Equation
Transmissivity v. Test Duration
0
100
200
300
400
500
600
0 10 20 30 40
Duration (Hrs)
Geo
Mea
n T
(Ft^
2/da
y)
Probably not. Wells might be fairly efficient too……
1
2
4TTE = Schafer (1978)
Conclusions
•Pumping tests are essential to evaluate aquifer hydraulics in the vicinity of the well. However, the selection of the well locationoften ensures that it is not representative of the aquifer.
•Specific capacity tests generally provide unbiased estimates oftransmissivity. However, they often are highly variable and may Require many tests to provide a good estimate of transmissivity.
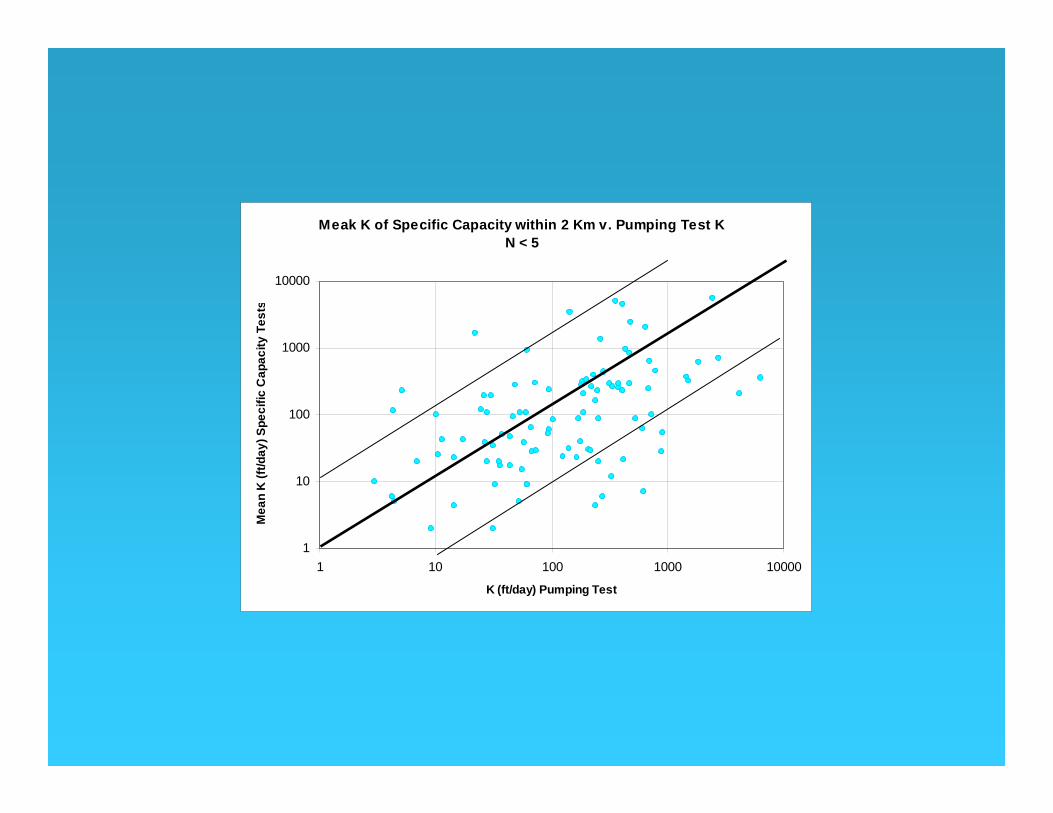
Meak K of Specific Capacity within 2 Km v. Pumping Test KN < 5
1
10
100
1000
10000
1 10 100 1000 10000
K (ft/day) Pumping Test
Mea
n K
(ft/d
ay) S
peci
fic C
apac
ity T
ests

Meak K of Specific Capacity within 2 Km v. Pumping Test K10>N>5
1
10
100
1000
10000
1 10 100 1000 10000
K (ft/day) Pumping Test
Mea
n K
(ft/d
ay) S
peci
fic C
apac
ity T
ests
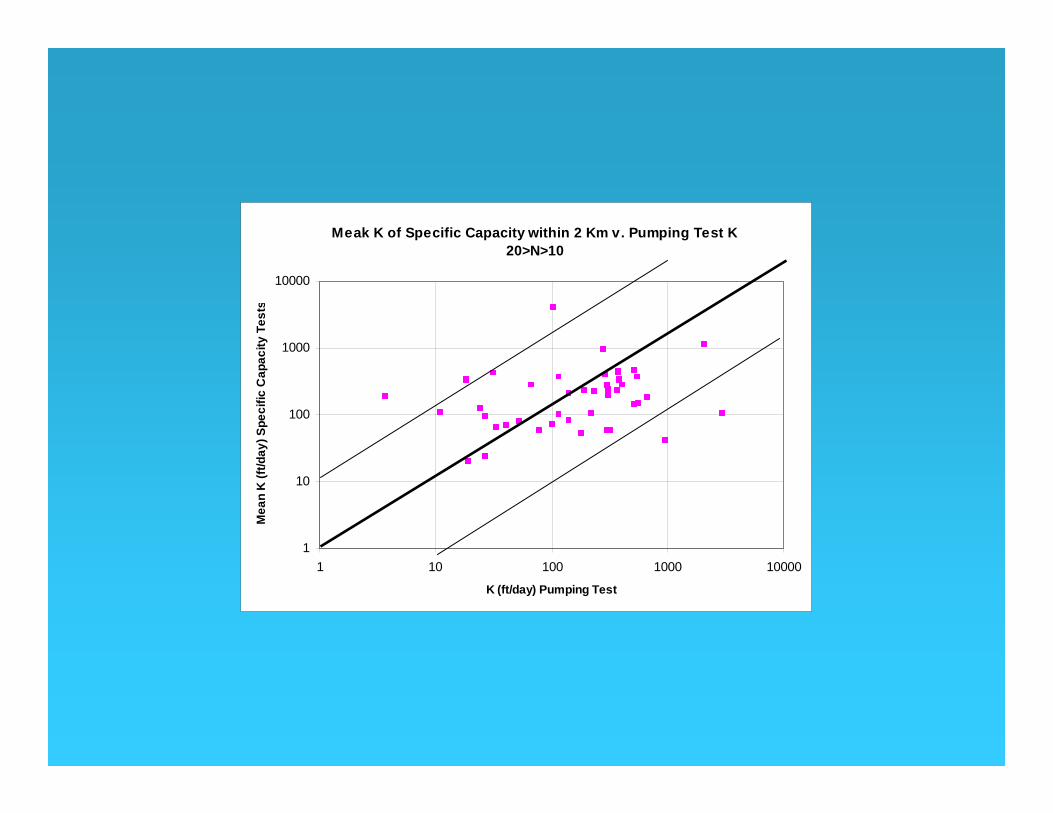
Meak K of Specific Capacity within 2 Km v. Pumping Test K20>N>10
1
10
100
1000
10000
1 10 100 1000 10000
K (ft/day) Pumping Test
Mea
n K
(ft/d
ay) S
peci
fic C
apac
ity T
ests
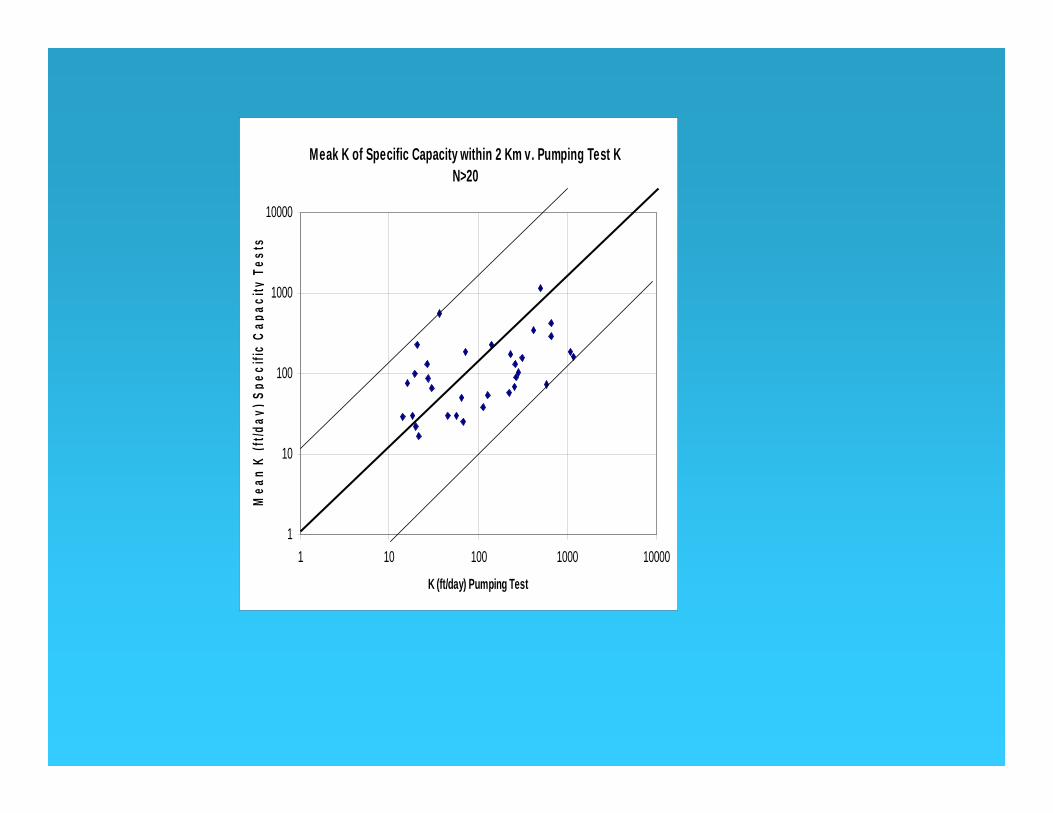
Meak K of Specific Capacity within 2 Km v. Pumping Test KN>20
1
10
100
1000
10000
1 10 100 1000 10000
K (ft/day) Pumping Test
Mea
n K
(ft/d
ay) S
peci
fic C
apac
ity T
ests