why some nations are wealthy. preview on a sheet of paper, write down why some nations are wealthy...
TRANSCRIPT

Why Some Nations are Wealthy

2
Preview
• On a sheet of paper, write down why some nations are wealthy and why some are poor, including the economic terms we have discussed in class.

3
Now, pair up…
• Bradford & English• Chen & Hunter• Padgett, O’Kelley, & Singco• Bennett & Phillips• Clark & Sanderson

4
In your group…
• Share what you wrote earlier about why some nations are wealthy while others are poor.
• Combine and refine your lists

5
Directions for Activity
• Now, look at the sheet I gave you and discuss the status of each nation just based on the information you have
• On your paper, write the following:1. What nation do you think this is?
2. Is its GDP per capita below average, average, or above average?
3. Explain your reasoning.

World Stats
• Average World (nominal) GDP per capita– $11,200 (2010 est.)
• Median World (nominal) GDP per capita– $4,600 (2010 est.)

United States
• GDP per capita: $47,200

8
Mystery Nations Revealed

Mystery Nation A
• Argentina– GDP Per Capita: $14,300 (2010 est.)– Rating: Above average

Mystery Nation B
• Afghanistan– GDP Per Capita: $900 (2010 est.)– Rating: Below average

Mystery Nation C
• China– GDP Per Capita: $7,600 (2010 est.)– Rating: Below average

Mystery Nation D
• Cuba– GDP Per Capita: $9,900 (2010 est.)– Rating: Below average
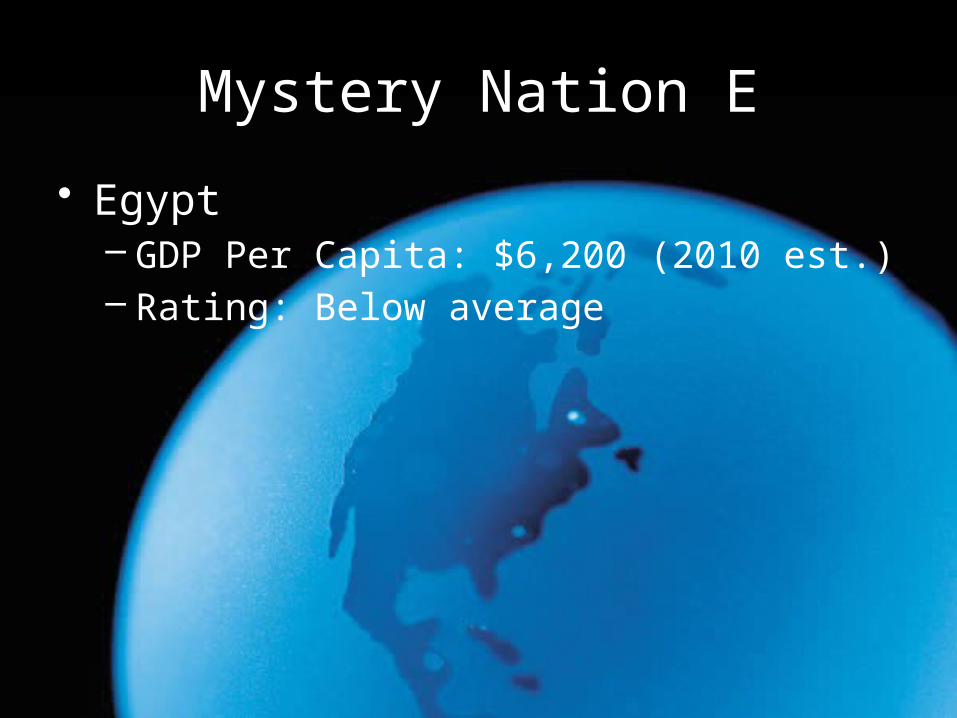
Mystery Nation E
• Egypt– GDP Per Capita: $6,200 (2010 est.)– Rating: Below average

Mystery Nation F
• Ghana– GDP Per Capita: $2,500 (2010 est.)– Rating: Below average

Mystery Nation G
• Hong Kong– GDP Per Capita: $45,900 (2010 est.)– Rating: Above average

Mystery Nation H
• India– GDP Per Capita: $3,500 (2010 est.)– Rating: Below average

Mystery Nation I
• Japan– GDP Per Capita: $34,000 (2010 est.)– Rating: Above average

Mystery Nation J
• Nigeria– GDP Per Capita: $2,500 (2010 est.)– Rating: Below average

Mystery Nation K
• Peru– GDP Per Capita: $9,200 (2010 est.)– Rating: Below average

Mystery Nation L
• Russia– GDP Per Capita: $15,900 (2010 est.)– Rating: Above average

Mystery Nation M
• Singapore– GDP Per Capita: $62,100 (2010 est.)– Rating: Above average

22
Write-up
• Finally, each of you need to reflect on this activity. – On your paper, write what determines a
nations wealth. Were you surprised by some of the nations? Explain.
– Imagine you were a policy analyst advising underdeveloped nations. What advise would you have for them to become more prosperous as a nation. Be specific.

23
Practice
• Economic Growth and Prosperity Worksheets

© 2012 Cengage Learning. All Rights Reserved. May not be copied, scanned, or duplicated, in whole or in part, except for use as permitted in a license distributed with a certain product or service or otherwise on a password-protected website for classroom use.
2424
Video—The Road to Prosperity
150 years ago the U.S. was what we would consider a Third World country today How did we get from there to where we are
today?
This video will take us around the world and through time to discover how the law comes from the customs of ordinary people, and how the right to property, defended by the rule of law, is essential to economic growth