why protein r-factors are so large: a self-consistent...
TRANSCRIPT

Why Protein R-factors Are So Large: A Self-ConsistentAnalysisDennis Vitkup,1,2,3 Dagmar Ringe,1,4 Martin Karplus,3,5* and Gregory A. Petsko1,4*1Rosenstiel Basic Medical Sciences Research Center, Brandeis University, Waltham, Massachusetts2Department of Biology, Program in Biophysics and Structural Biology, Brandeis University, Waltham, Massachusetts3Department of Chemistry and Chemical Biology, Harvard University, Cambridge, Massachusetts4Department of Chemistry and Department of Biochemistry, Brandeis University, Waltham, Massachusetts5Laboratoire de Chimie Biophysique, Institut le Bel, Universite Louis Pasteur, Strasbourg, France
ABSTRACT The R-factor and R-free are com-monly used to measure the quality of protein modelsobtained in X-ray crystallography. Well-refined pro-tein structures usually have R-factors in the rangeof 20–25%, whereas intrinsic errors in the experimen-tal data are usually around 5%. We use moleculardynamics simulations to perform a self-consistentanalysis by which we determine the major factorscontributing to large values of protein R-factors.The analysis shows that significant R-factor valuescan arise from the use of isotropic B-factors tomodel anisotropic protein motions and from coordi-nate errors. Even in the absence of coordinate er-rors, the use of isotropic B-factors can cause theR-factors to be around 10%; for coordinate errorssmaller than 0.2 Å, the two errors types make similarcontributions. The inaccuracy of the energy func-tion used and multistate protein dynamics are un-likely to make significant contributions to the largeR-factors. Proteins 2002;46:345–354.© 2002 Wiley-Liss, Inc.
INTRODUCTION
The information that can be obtained from a proteincrystal structure depends on the accuracy of the structuralmodel. In many cases, an accurate high-resolution struc-ture, when combined with complementary biochemicaldata, allows one to understand protein function in atomicdetail. Moreover, the structure can serve as a startingpoint for molecular mechanics or quantum calculations,which provide further insight into structure-function rela-tionships. The fundamental importance of structural meth-ods in biology makes it essential to have a clear understand-ing of the criteria used to gauge the accuracy of theresulting models.
Local geometric errors in a protein X-ray structure canbe estimated by use of knowledge-based programs such asPROCHECK.1 PROCHECK compares the geometry of aprotein model with a database of canonical geometriesderived from a set of high-resolution protein structures.The overall accuracy of a protein model is usually evalu-ated by the ability of the model to reproduce experimentalX-ray data. In protein crystallography, the experimentaldata are the Bragg reflection intensities. The crystallo-graphic R-factor2 is the most widely used parameter tomeasure the disagreement between the amplitudes of the
experimentally measured reflections and the protein model.The crystallographic R-factor is defined as:
R ��h,k,l�Fobs�h, k, l�� � �Fcalc�h, k, l��
�h,k,l�Fobs�h, k, l�� (1)
where h, k, and l are integers that denote points of thecrystal reciprocal lattice and �Fobs(h, k, l)� and �Fcalc(h, k, l)�are amplitudes of measured (observed) and calculatedreflections, respectively. The plot of the crystallographicR-factor versus resolution (the Luzzati plot) can be used toestimate the average coordinate error in a protein crystalstructure under assumption of a Gaussian error distribu-tion.3 For protein structures solved and refined at betterthan 2 Å resolution, the Luzzati plot usually gives esti-mates of the average coordinate error in the range 0.2-0.3Å.4 Multiple independent refinements of proteins also giveerror estimates in this range. For example, the root-mean-square deviation (RMSD) between two independently de-termined structures of subtilisin5 is 0.32 Å; the averageRMSD between three independently determined interleu-kin-1-� structures6–8 is 0.53 Å (see ref. 15).
Typically, for an initial protein model (obtained bymethods of either molecular or isomorphous replacement4)the R-factor is as high as 50%. For comparison, an R-factorof a completely random acentric protein model is 59%.9 Toimprove the initial model, crystallographic refinementmethods are used. Well-refined protein structures usuallyhave R-factors in the range of 15–25%, depending on theresolution and data quality. In contrast, for small organiccompounds R-factor values as low as 2–5% are standard.10
The purpose of the present article is to determine why theR-factors of well-refined proteins are so large.
The refinement process involves optimization of a costfunction of the type:
Ecost � w � �h,k,l��Fobs�h, k, l�� � �Fcalc�h, k, l���2
� �atomsEgeom�x, y, z� (2)
*Correspondence to: Martin Karplus, Department of Chemistry andChemical Biology, Harvard University, Cambridge, MA 02138.E-mail: [email protected] or Gregory A. Petsko, RosenstielBasic Medical Sciences Research Center, Brandeis University,Waltham, MA 02454-9110. E-mail: [email protected]
Received 16 February 2001; Accepted 28 August 2001
Published online 00 Month 2001
PROTEINS: Structure, Function, and Genetics 46:345–354 (2002)DOI 10.1002/prot.10035
© 2002 WILEY-LISS, INC.
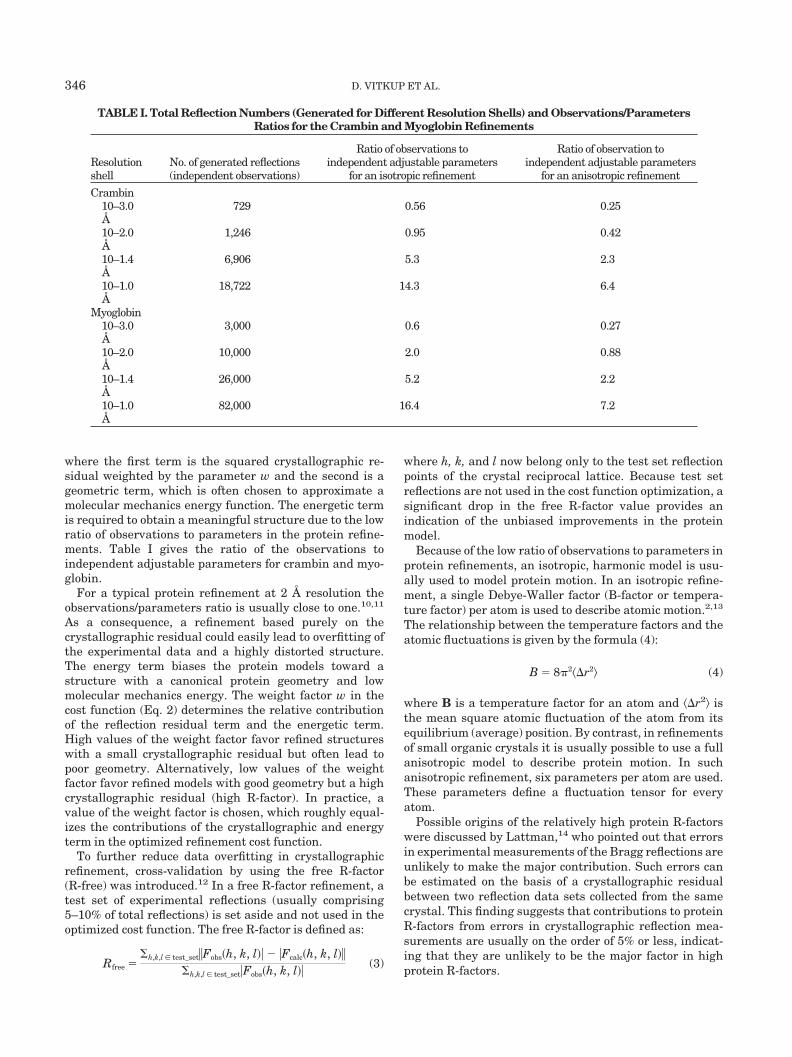
where the first term is the squared crystallographic re-sidual weighted by the parameter w and the second is ageometric term, which is often chosen to approximate amolecular mechanics energy function. The energetic termis required to obtain a meaningful structure due to the lowratio of observations to parameters in the protein refine-ments. Table I gives the ratio of the observations toindependent adjustable parameters for crambin and myo-globin.
For a typical protein refinement at 2 Å resolution theobservations/parameters ratio is usually close to one.10,11
As a consequence, a refinement based purely on thecrystallographic residual could easily lead to overfitting ofthe experimental data and a highly distorted structure.The energy term biases the protein models toward astructure with a canonical protein geometry and lowmolecular mechanics energy. The weight factor w in thecost function (Eq. 2) determines the relative contributionof the reflection residual term and the energetic term.High values of the weight factor favor refined structureswith a small crystallographic residual but often lead topoor geometry. Alternatively, low values of the weightfactor favor refined models with good geometry but a highcrystallographic residual (high R-factor). In practice, avalue of the weight factor is chosen, which roughly equal-izes the contributions of the crystallographic and energyterm in the optimized refinement cost function.
To further reduce data overfitting in crystallographicrefinement, cross-validation by using the free R-factor(R-free) was introduced.12 In a free R-factor refinement, atest set of experimental reflections (usually comprising5–10% of total reflections) is set aside and not used in theoptimized cost function. The free R-factor is defined as:
Rfree ��h,k,l � test_set�Fobs�h, k, l�� � �Fcalc�h, k, l��
�h,k,l � test_set�Fobs�h, k, l�� (3)
where h, k, and l now belong only to the test set reflectionpoints of the crystal reciprocal lattice. Because test setreflections are not used in the cost function optimization, asignificant drop in the free R-factor value provides anindication of the unbiased improvements in the proteinmodel.
Because of the low ratio of observations to parameters inprotein refinements, an isotropic, harmonic model is usu-ally used to model protein motion. In an isotropic refine-ment, a single Debye-Waller factor (B-factor or tempera-ture factor) per atom is used to describe atomic motion.2,13
The relationship between the temperature factors and theatomic fluctuations is given by the formula (4):
B � 8�2��r2� (4)
where B is a temperature factor for an atom and ��r2� isthe mean square atomic fluctuation of the atom from itsequilibrium (average) position. By contrast, in refinementsof small organic crystals it is usually possible to use a fullanisotropic model to describe protein motion. In suchanisotropic refinement, six parameters per atom are used.These parameters define a fluctuation tensor for everyatom.
Possible origins of the relatively high protein R-factorswere discussed by Lattman,14 who pointed out that errorsin experimental measurements of the Bragg reflections areunlikely to make the major contribution. Such errors canbe estimated on the basis of a crystallographic residualbetween two reflection data sets collected from the samecrystal. This finding suggests that contributions to proteinR-factors from errors in crystallographic reflection mea-surements are usually on the order of 5% or less, indicat-ing that they are unlikely to be the major factor in highprotein R-factors.
TABLE I. Total Reflection Numbers (Generated for Different Resolution Shells) and Observations/ParametersRatios for the Crambin and Myoglobin Refinements
Resolutionshell
No. of generated reflections(independent observations)
Ratio of observations toindependent adjustable parameters
for an isotropic refinement
Ratio of observation toindependent adjustable parameters
for an anisotropic refinement
Crambin10–3.0Å
729 0.56 0.25
10–2.0Å
1,246 0.95 0.42
10–1.4Å
6,906 5.3 2.3
10–1.0Å
18,722 14.3 6.4
Myoglobin10–3.0Å
3,000 0.6 0.27
10–2.0Å
10,000 2.0 0.88
10–1.4Å
26,000 5.2 2.2
10–1.0Å
82,000 16.4 7.2
346 D. VITKUP ET AL.

In the current work, the method of X-ray data genera-tion from molecular dynamics simulations is used toinvestigate the factors contributing to the relatively largevalues of refined protein R-factors. An analogous approachwas used previously to investigate errors in X-ray proteinrefinements11 and of the structures of dissociated COmyoglobin intermediates.15 X-ray data, generated frommolecular dynamic trajectories, are used as an input tocommonly used X-ray refinement protocols. Refined re-sults can then be compared directly with known data fromthe molecular dynamics used to calculate crystallographicreflections. Such an approach is self-consistent and is freefrom experimental errors and from errors in the molecular
dynamics simulations, which allows one to determine thefundamental limitations of the models used to deduce theprotein coordinates and motional parameters from experi-mental data.
RESULTSRole of Errors in the Energy
To determine whether inaccuracies in the energy termEgeom of the crystallographic refinement cost function (Eq.2) have a significant effect on protein refinements, aself-consistent approach was used. Molecular dynamicstrajectories of the small protein crambin (Hendrickson andTeeter, 1981, PDB entry 1crn) were obtained by usingCHARMM.16 Crystallographic reflections in the 10.0–1.0Å resolution range were generated from the dynamicstrajectories as described in Materials and Methods. Byusing the generated reflections and a refinement costfunction with the same potential energy term as used inthe molecular dynamics simulations, simulated annealingrefinements against the generated reflections were per-formed with the program XPLOR.17 Thus, differences inthe results arise from the refinement procedure and themodel on which it is based, rather than from errors in theenergy function.
The dependence of the refined protein model on thestarting structure, initial velocity assignment in simu-lated annealing, and general simulated annealing protocolwas investigated. Several XPLOR refinement runs, usingdifferent starting structures and refinement protocols, allconverged to the same structures with backbone RMSDwithin 0.02 Å from each other. Apparently, the presence ofthe high-resolution reflection data (up to 1.0 Å resolution)directs refinements to the best possible model independentof the refinement protocols and initial structures.
Fig. 1. Projection of the crambin trajectories onto planes defined bytwo largest principal components. The axes are scaled to represent theroot mean square deviations of the structures. The red dot indicates theposition of the average trajectory structure, the green dot—the refinedstructure. The size of the green dot roughly represents the distribution ofthe structures obtained using slightly different simulated annealing proto-cols. A. Projection of the crambin trajectory at 240 K; B.) Projection of thecrambin trajectory at 300 K.
Fig. 2. The R-factor obtained in the isotropic refinements of theharmonic crambin trajectories as a function of the trajectory anisotropy.(for 10-2.0 Å, 10-1.4 Å, 10-1.0 Å resolution shells). The graphs of therefined R-factor and the R-free versus anisotropy were identical for therefinements as the ratio of refined parameters to observations is low.
WHY ROTEIN R-FACTORS ARE SO LARGE 347

The final crystallographic R-factors obtained in refine-ments of the crambin structure against the reflection datagenerated from the two typical crambin trajectories (at 240K and 300 K) are shown in Table II.
Similar protein R-factors and R-frees were obtained inrefinements of crystallographic data generated from othercrambin trajectories, interleukin-2- trajectories (D. Vit-kup et al., in preparation), and myoglobin trajectories.15 Itis clear from Table II that the R-factor values obtained inthe refinements of the crystallographic data generatedfrom the molecular dynamics trajectories are similar to therelatively high R-factors usually obtained in experimentalprotein refinements,18 despite the fact that identical en-ergy functions were used in generation of the trajectoriesand in the refinements.
Role of Anharmonic Multistate Behavior
The crambin trajectories at 240 K and 300 K exemplifytrajectories with pronounced multistate and single-statebehavior. This is made apparent by a principal componentanalysis (PCA) of the trajectories.19,20 Coordinates of C-�backbone atoms of crambin were used to define conforma-tions of the protein in the PCA. Figure 1(a) shows a 300-psmolecular dynamics trajectory of crambin at 240 K inprojection onto the two largest principal components. Theprojection shows that the 240 K crambin trajectory exhib-its pronounced multistate behavior. In the trajectory, theprotein visits two basins, which are approximately delin-eated by dashed lines in Figure 1(a). The average struc-ture, calculated from the simulation by averaging theatomic coordinates along the trajectory, is marked by thered dot in Figure 1(a).
The structure obtained in the simulated annealingrefinements with the isotropic B factors is marked by thegreen dot. The refined structure is close to, but somewhatdifferent from, the average structure. The RMSD betweenthe average and the refined structure is 0.17 Å for back-bone atoms and 0.34 Å for all non-hydrogen atoms. Figure1(a) shows that the refined structure lies within one of thebasins visited during the dynamics. Analogous resultswere observed in other crambin trajectories (D. Vitkup,
unpublished data): the refined structures are close to theaverage structures but usually lie within the basin (sub-state) in which protein spends most of the time during thesimulation. The PCA projection of a 300-ps crambin trajec-tory at 300 K on its two largest principal components isshown in Figure 1(b). Only a single basin is explored in the300 K trajectory. As a result of the single basin (state)behavior, the refined structure [green dot in Figure 1(b)] iscloser to the average structure for the 300 K trajectory [reddot in Figure 1(b)] than for the 240 K trajectory. TheRMSD between the average and the refined structure forthe 300 K trajectory is 0.09 Å for backbone atoms and 0.27Å for all non-hydrogen atoms. Despite the multistatedynamics in the 240 K trajectory and single state in the300 K trajectory, the refined R-factor and R-free values aresimilar in the two cases (see Table I). Both are within thenormal range observed for proteins.
To further analyze the contributions of multistate behav-ior to the crystallographic protein R-factor, crambin trajec-tories were generated in which the atomic motion wasanisotropic but harmonic within a single state. In theharmonic trajectories, the displacement distribution foreach crambin atom around its average position was Gauss-ian. Details of the generation of the harmonic trajectoriesare given in Materials and Methods.
Because the intensities of crystallographic reflectionsdepend only on the average electron density in the crystalunit cell (and thus only on the average atomic distribu-tions), the reflections generated from an artificial har-monic trajectory are equivalent to the ones produced by an“imaginary” dynamic trajectory in which the atomic mo-tions are anisotropic but harmonic within a single state. Aharmonic “trajectory” (referred to as the harm_240 Ktrajectory below) was generated in which principal compo-nents of motion and amplitudes of fluctuations for eachcrambin non-hydrogen atom were the same as in themolecular dynamics trajectory at 240 K. The crystallo-graphic reflections were generated from the harm_240 Ktrajectory in the same way as from the molecular dynamicscrambin trajectories. The crambin structure was refinedagainst crystallographic reflections generated from the
TABLE II. Characteristics of Crambin Trajectories and the Final R-Factors Obtained in the Refinements of the X-RayData Generated From the Trajectories
Crambin trajectoryat 240 K
Crambin trajectoryat 300 K
Harmonic crambintrajectory (harm_240 K)
Average non-hydrogen atoms RMS fluctuation, Å 0.64 0.65 0.64Backbone RMSD from the average trajectory structure
to the refined structure, Å0.17 0.09 0.024
Non-hydrogen RMSD from the average trajectorystructure to the refined structure, Å
0.34 0.27 0.029
Average non-hydrogen atoms anisotropy parameter A1 0.88 0.71 0.87Average non-hydrogen atoms anisotropy parameter A2 0.15 0.15 0.14
Resolution range for R-factor calculationsIsotropicR-factor
IsotropicR-free
IsotropicR-factor
IsotropicR-free
IsotropicR-factor
IsotropicR-free
10–2 Å (%) 11.9 13.6 12.2 12.8 11.6 11.910–1.4 Å (%) 15.7 17.4 16.3 17.5 16.2 16.810–1 Å (%) 20.3 21.6 20.8 21.7 21.2 22.9
348 D. VITKUP ET AL.

harm_240 K trajectory by using the simulated annealingrefinement method. The refined structure for the harmonictrajectory was almost identical to the average structure forthe trajectory. The backbone RMSD between the refinedand average structures was 0.024 Å; the non-hydrogenRMS deviation was 0.029 Å. The refined R-factor andR-free for the harm_240 K trajectory are given in Table II.Despite the fact that the harm_240K trajectory was abso-lutely harmonic, the refined R-factor is about the same asfrom the 240 K and 300 K trajectories.
Role of Isotropic Approximation to AnisotropicAtomic Motion
After the isotropic refinements of the crambin trajecto-ries using X-PLOR, the crystallographic data generatedfrom the crambin trajectory at 300 K and harmoniccrambin trajectory (the harm_240 K trajectory) were re-fined anisotropically. The anisotropic full-matrix least-square refinements were performed by using programSHELX-9321 (see Materials and Methods). The final struc-tures obtained in the isotropic refinements with XPLORwere used as a starting model for the SHELX anisotropicrefinements. Introduction of anisotropic temperature fac-tors substantially lowered both the R-factors and theR-free factors; the latter confirms the improved quality ofthe refined protein models. In the anisotropic refinementof the reflection data from the crambin trajectory at 300 K,the R-factor converged at 9.2% and the R-free at 10.0% forall data in the resolution shell 10.0–1.0 Å; the R-factor was7.1% and the R-free was 8.5% for data in the resolutionshell 10.0–2.0 Å. In the refinement of the harmoniccrambin trajectory data, the R-factor converged at 4.1%and the R-free at 5.4% for the 10.0–1.0 Å shell; the R-factorwas 3.6% and the R-free was 4.5% for the 10.0–2.0 Å shell.Although in the anisotropic refinement of the harmonictrajectory reflections the refined R-factor has not reachedzero (which would indicate a perfect model), its value iswithin that expected from the intrinsic errors in thesimulated crystallographic data (see Materials and Meth-ods).
Only small coordinate shifts occurred in the anisotropicrefinements relative to the starting structures obtainedwith isotropic refinement. The non-hydrogen atom RMSDsbetween the starting and the final refined structures were0.067 Å for the data generated from the 300 K crambintrajectory and 0.045 Å for the data from the harmonictrajectory. The small RMS coordinate shifts observed inthe anisotropic refinements indicate that the major im-provement in the R-factors came from the introduction ofthe anisotropic temperature parameters.
To determine how the lowest R-factors achievable inisotropic refinements are affected by the degree of anisotro-pic atomic motion, harmonic crambin trajectories withvarious degrees of anisotropy were generated. The degreeof anisotropy in these harmonic trajectories was altered bychanging the ratio of atomic fluctuations along the firstprincipal component of the individual atomic motionsrelative to fluctuations along the other two components.This procedure effectively changes the anisotropic param-
eter A1 (see Materials and Methods). The directions of theprincipal components for the motion of the crambin atomswere the same in all harmonic trajectories and were takenfrom the molecular dynamics trajectory of crambin at 240K (see above). The anisotropic parameter A2 (see Materialsand Methods) for all crambin atoms was kept at zero(fluctuations along the second and the third principalcomponents were the same for all atoms), as observedvalues of the A2 parameter are small in both moleculardynamic simulations22 and experiment.23 The degree ofanisotropic motion was varied in the different harmonictrajectories but was identical for all atoms within eachtrajectory. In the harmonic trajectories, the RMS fluctua-tions for all non-hydrogen crambin atoms were set equal to0.75 Å. This is a typical value of atomic RMS fluctuationsin proteins at room temperature.24 Crystallographic reflec-tions were generated from the harmonic trajectories in theusual way (see Materials and Methods). The isotropicrefinements of the crystallographic data generated fromthe harmonic trajectories were performed with XPLOR.Only B factors were refined, and the average structureswere used as the coordinate models. For a harmonictrajectory, the average structure (identical to the minimalenergy structure) constitutes the best possible refinementmodel. Consequently, there were no coordinate errors inthe refinement of harmonic trajectories. Thus, the onlyerrors came from isotropic refinement of harmonic butanisotropic protein atom motions.
The converged R-factors obtained in the refinements ofcrystallographic data generated from the harmonic trajec-tories are plotted as a function of the motional anisotropy(the parameter A1) of the trajectories in Figure 2. Thegraphs of the refined R-factor and the R-free versusanisotropy were almost identical for the refinements be-cause the ratio of refined parameters to observations is low(because only B-factors are refined, the parameters/observations ratios are 0.26 for 10–2.0 Å data, 0.047 for10–1.4 Å data, and 0.017 for 10–1.0 Å data) so that“overfitting” is not possible. The R-factor data for threeresolution shells (10–2.0 Å, 10–1.4 Å, 10–1.0 Å aredisplayed in Figure 2. It is evident from Figure 2 that, evenin the absence of coordinate errors, relatively large R-factors (and R-frees) occur because of the inconsistencybetween the isotropic refinements and the anisotropy ofthe atomic motion. The graphs of the R-factors versus themotion anisotropy in Figure 2 show that the higher theresolution of the reflection data the larger are the values ofthe R-factors because of the use of the isotropic approxima-tion. Qualitatively, this is a consequence of the fact that ata higher resolution differences between isotropic and ananisotropic electron distributions are more significant.
Although the data presented in Figure 2 were calculatedby using the harmonic trajectories with the principalcomponents of individual atomic motion obtained from the240 K trajectory, the form of the R-factors versus anisot-ropy graphs appears to be general. Refinements of trajecto-ries with randomly generated principal components ofmotion, but the same degree of anisotropy (values of A1),produced very similar R-factors (D. Vitkup, unpublished).
WHY ROTEIN R-FACTORS ARE SO LARGE 349

Role of the Random Coordinate Errors
To complement the study of contributions to the proteinR-factors from the use of the isotropic approximation to theatomic motion, it is of interest to consider a system inwhich atomic motion is isotropic and the contributions arecoming exclusively from coordinate errors. To simulatesuch a system, X-ray reflections were generated from astatic crambin structure with preset isotropic B-factors.This approximates reflection data generated from a per-fectly harmonic and isotropic simulation. The crambinstructure, used to simulate the isotropic reflection data,was then displaced by minimization or brief moleculardynamics, and new reflection data were generated fromthe displaced structure. The same B-factors were used forall crambin atoms in the original and displaced structures.The protein R-factor between the reflection data generatedfrom the original and displaced structures provides anestimate of R-factor values for a system in which the onlysource of error is due to the deviation of a structure fromthe best possible refinement solution.
Figures 3 show three-dimensional graphs of the R-factorbetween two structures as the function of the RMSD andatomic B-factors. Identical B-factors were used for allcrambin atoms in the two structures. The R-factor for eachRMS value in Figures 3 was averaged over three indepen-dent displacements obtained from short molecular dynam-ics runs or minimization. Figure 3(a) shows data for 10–1Å resolution shell, Figure 3(b) for 10–1.4 Å resolutionshell, and Figure 3(c) for 10–2 Å resolution shell. As isclear from Figures 3, the surface of R-factor versus coordi-nate errors is rather steep, and random RMS errors in therange of 0.2–0.3 Å increase R-factors to 20–30%. Bycontrast, the magnitude of the B-factors has only smalleffect, with R-factors as a function of coordinate errorbeing slightly larger for smaller B-factor values.
R-Factors Resulting From Combination of Usingthe Isotropic Approximation and CoordinateErrors
In the refinement of the experimental data for proteins,both coordinate errors and errors due to the isotropicapproximation of the atomic motion are usually present.The individual contributions of these errors to the value ofthe R-factor were investigated in the previous two sec-tions. Here we examine the effect of the presence of bothtypes of errors. The combined contributions of the twoerror types were estimated by using the following proce-dure. The final structures obtained in the isotropic refine-ment of the harmonic and anisotropic crambin trajectories(see above) were displaced by brief molecular dynamicssimulations or minimizations. The R-factors were calcu-lated between the reflections generated in the anisotropictrajectories and the displaced structures with isotropicB-factors (Fig. 4). For each anisotropy and value of thecoordinate shift, the R-factors shown are the average over10 independent displacements. Data for 10–1.0 Å resolu-tion shell is shown in Figure 4(a), data for 10–1.4 Åresolution shell in Figure 4(b), and data for 10–2.0 Åresolution shell in Figure 4(c).
Compared with the R-factors in Figure 3 (in which onlycoordinate errors were considered), the R-factors for trajec-tories with large anisotropy have significant values evenwhen coordinate errors are near zero. This is a conse-quence of the fact that the isotropic approximation alonecan result in large R-factors (see Role of Isotropic Approxi-mation to Anisotropic Atomic Motion). For coordinateerrors smaller than 0.2 Å, the use of the isotropic approxi-mation becomes an important factor keeping values of theR-factors high.
To establish the generality of the results in Figure 4, theR-factors for myoglobin were calculated as a function ofanisotropy and RMS displacements. Harmonic myoglobintrajectories were generated in the same way as harmoniccrambin trajectories (see above). The principal axes ofatomic motion used in generation of harmonic myoglobintrajectories were taken from a 200-ps molecular dynamicstrajectory of myoglobin at 300 K generated by CHARMM.The same fluctuation amplitudes were used in generationof the myoglobin harmonic trajectories as in the crambinharmonic trajectories. The R-factor surface plots for myo-globin are compared in Figure 5.
The R-factor plot for resolution shell 10–1.4 Å is shownin red for crambin and in blue for myoglobin. The surfaceplots of R-factor versus anisotropy and RMS displace-ments are similar for the two proteins. Moreover, thesurfaces are almost identical in the area of usual proteinmotion anisotropy (anisotropy around 0.7), and typicalcoordinate errors present in experimental X-ray struc-tures (coordinate errors of 0.2–0.3 Å). The similarity of theR-factor dependence on the degree of motional anisotropyand coordinate errors for proteins as different as crambinand myoglobin suggests that the shape of the plots is ageneral feature of protein refinement.
DISCUSSION
We have explored the contribution of various aspects ofprotein motion and refinement models to the observedvalues of R-factors. This was done by the use of moleculardynamics simulations and their self-consistent analysisthat permitted a dissection of the contributions to theR-factor that could not be made by experiments alone. Asstated in the introduction, the errors in the measurementof crystallographic reflections, although present, usuallydo not play the dominant role in keeping protein R-factorvalues high. With modern high-intensity sources and areadetectors, individual reflection intensities are measuredquite accurately. The errors of this type were estimated tocontribute 5% to the observed R-factors.14
The effects connected with solvent modeling and disor-der in protein crystals clearly contribute to protein R-factors. It would be possible to extend our self-consistentanalysis to investigate these effects by performing sol-vated simulations in a crystal environment. We note thatthe R-factors obtained in our study are similar to experi-mental values, suggesting that solvent modeling andcrystal disorder are not the principal contributors toexperimental R-factor values.
350 D. VITKUP ET AL.

Fig
.3.
The
R-f
acto
rbe
twee
ncr
ysta
llogr
aphi
cre
flect
ions
setg
ener
ated
from
two
cram
bin
stru
ctur
es,w
ithth
esa
me
B-f
acto
rsas
sign
edto
alln
on-h
ydro
gen
atom
s,as
afu
nctio
nof
all-a
tom
RM
Sde
viat
ion
betw
een
the
stru
ctur
es(c
oord
inat
eer
rors
)an
dth
eva
lue
ofth
eB
-fac
tors
.T
hedi
spla
yed
valu
eof
the
R-f
acto
ris
anav
erag
eob
tain
edfr
omth
ree
inde
pend
ent
coor
dina
tedi
spla
cem
ents
.C
oord
inat
edi
spla
cem
ents
wer
eob
tain
edby
shor
tm
olec
ular
dyna
mic
sru
nsor
prot
ein
min
imiz
atio
n.a)
R-f
acto
rsfo
rre
flect
ions
in10
-1.0
Åre
solu
tion
shel
l,b)
R-f
acto
rsfo
rre
flect
ions
in10
-1.4
Åre
solu
tion
shel
l,c)
R-f
acto
rsfo
rrefl
ectio
nsin
10-1
.0Å
reso
lutio
nsh
ell.
Fig
.4.
The
R-f
acto
rbe
twee
ncr
ysta
llogr
aphi
cre
flect
ion
sets
gene
rate
dfr
omth
ean
isot
ropi
cha
rmon
ictr
ajec
torie
sof
cram
bin
and
disp
lace
dst
ruct
ures
(by
shor
tm
olec
ular
dyna
mic
sru
nsor
min
imiz
atio
ns)o
btai
ned
inth
eis
otro
pic
refin
emen
tsof
thes
etr
ajec
torie
s.T
heR
-fac
tors
are
show
nas
afu
nctio
nof
all-a
tom
RM
Sdi
spla
cem
enta
ndan
isot
ropy
ofth
etr
ajec
torie
s(s
eete
xt).
a)R
-fac
tors
forr
eflec
tions
in10
-1.0
Åre
solu
tion
shel
l.b)
R-f
acto
rsfo
rrefl
ectio
nsin
10-1
.4Å
reso
lutio
nsh
ell.
c)R
-fac
tors
forr
eflec
tions
in10
-1.0
Åre
solu
tion
shel
l.
WHY ROTEIN R-FACTORS ARE SO LARGE 351

Inconsistencies between the “real” protein energy func-tion and the functions used as an energetic term inrefinement protocols can also be ruled out as the majorsource of the large protein R-factors. Our results show thateven when using the exact energy function in the refine-ment, the R-factors are not lowered substantially. In aprotein refinement, one usually tries to approximate anensemble of conformations with a single structure. Thestructure with the lowest potential energy is the bestrepresentative of an ensemble only if the energy surface ofthe protein is harmonic. In reality, protein energy surfaceshave multiple minima in the neighborhood of the nativestate.25 For such a complex surface, the single best repre-sentative of the ensemble in terms of electron density maynot be the structure with the lowest potential energy. Theresults also show that multistate effects in protein dynam-ics25 are not a major contributor to the large proteinR-factors. The refinements of the crystallographic reflec-tions generated from crambin trajectories with multistateand single-state behavior did not yield significantly differ-ent R-factors. Furthermore, refinements of the X-ray datagenerated from absolutely harmonic but anisotropiccrambin trajectories (perfect single-state dynamics) led toR-factors similar to those obtained from refinement ofmultistate dynamics.
Investigation of the contribution of coordinate errorsand the use of isotropic approximation to anisotropicprotein motion showed that both can be important inkeeping protein R-factors large. The results of anisotropicSHELX refinements, using the reflection data generatedfrom the crambin trajectories, showed that protein R-factors can be substantially reduced if it is possible torefine anisotropic temperature factors without data overfit-ting. In the anisotropic refinement of the X-ray datagenerated from the 300 K crambin trajectory small R-factors were achieved (R-factor � 9.2%, and R-free �10.0% for reflections in the 10.0–1.0 Å resolution shell;R-factor � 7.1%, and R-free � 8.5% for reflections in the10.0–2.0 Å resolution shell). The R-factors obtained in this
way are about half as large as those resulting from theisotropic refinements of the same data. The correspondingreduction of the R-free in the anisotropic refinementsindicates significant improvements in the quality of therefined models. These improvements were almost exclu-sively due to better modeling of anisotropic protein motion,because there were only small coordinate shifts in thecourse of the SHELX refinements.
Even if the atomic protein motions were completelyisotropic (i.e., the use of isotropic approximation wereexact), coordinate errors can still cause large proteinR-factors. By “coordinate errors” we mean the differencebetween a given structural model and the best possiblerefinement solution. Coordinate errors can occur in X-raystructures because, for example, reflection data are not of ahigh enough resolution to guide refinements to the bestpossible structural model. Typical RMS coordinate errorsin protein structures are estimated at 0.2–0.3 Å.4 Ourcalculations show that, even if the protein motion iscompletely isotropic, coordinate errors in the range of0.2–0.3 Å result in R-factors of 20–25%.
To understand the interplay between contribution fromcoordinate errors and the use of the isotropic approxima-tion, combinations of these errors were considered inFigure 4. Graphs of the protein R-factors versus coordinateRMS errors and degree of the motion anisotropy werecalculated. The analysis of the resulting surfaces led to theconclusion that for coordinate errors below 0.2 Å andtypical protein anisotropy (parameter A1 around 0.7–0.8),about equal contribution to the experimental R-factors aremade by these two factors.
Our conclusions are in accord with recent experimentalevidence, for example, results obtained by Harata et al.23
In this study, the SHELX program was used to refinestructures of turkey egg white and human lysozymeanisotropically. In the lysozyme refinements, the introduc-tion of anisotropic temperature factors markedly reducedthe protein R-factors. The final R-factors achieved byHarata et al. were 10.4% for turkey egg lysozyme and11.5% for human lysozyme. These values are to be com-pared with the isotropic refinement that yielded R-factor of18% and R-free of 23.5%.
In the future, improvements in experimental data collec-tion and refinement techniques should generally decreasethe observed protein R-factors. Methods of cryocrystallog-raphy, better crystal growth, and use of high-power syn-chrotron sources will allow measurements of X-ray data tohigher resolution. This would decrease coordinate errorsin refined structures. Higher resolution data also shouldallow for wider use of the anisotropic B-factor approximation,especially when combined with normal mode refinement26,27
and time-averaged refinement.28 It is likely that refinementR-factors will be reduced to around 10% by such improve-ments in the near future, at least for some proteins.
MATERIALS AND METHODSMolecular Dynamics Simulations
The molecular dynamics simulations of crambin, usedfor generation of X-ray reflections, were performed with
Fig. 5. The graph analogous to Figures 4a–4c, comparing theR-factor surfaces for crambiin and myoglobin.
352 D. VITKUP ET AL.

the CHARMM program (version 24a).16 Two moleculardynamic simulations were performed at 240 K and at 300K. The simulations were started from an energy mini-mized crambin crystal structure (Hendrickson and Teeter,1981, PDB entry 1crn). The crystal structure was firstminimized for 500 steps by using the ABNR algorithm.The molecular dynamics simulations included a 10-psheating stage and a 100-ps equilibration stage, followed by300 ps of production dynamics. An integration step of0.001 ps was used. No explicit water molecules wereincluded in the simulations. Coordinate frames were savedevery 0.1 ps. The production dynamics portions of thetrajectories were used in the simulation of X-ray data.
Potential Energy Function Used in CHARMM andXPLOR
The same energy functions were used to perform thecrambin simulations (using CHARMM) and as the energycost function term in the refinements of X-ray data gener-ated from the simulations (using XPLOR). The polar-hydrogen representation was used, defined by CHARMM19 parameter and topology files.29 A switching functionwas used to truncate the van der Waals and electrostaticinteractions over the 6.5–7.5 Å interval. A distance-dependent dielectric was used to screen electrostatic inter-actions.
PCA of the Molecular Dynamics Trajectories
PCA of the crambin trajectories at 240 K and 300 K wasperformed by diagonalizing the coordinate covariance ma-trix.19,20 The Cartesian coordinates of C-� backbone atomswere used to define a 132 dimensional coordinate space(3N-6 dimensions, where N � 46 for crambin). Before PCAanalysis, net rotation and translation of the protein wereremoved from the trajectory frames by coordinate superpo-sition with the average structure. Projections of the crambintrajectories onto planes defined by the two largest princi-pal components were constructed from 3000 coordinateframes (saved every 0.1 ps from the 300-ps trajectories).
Parameters Characterizing the Atomic MotionAnisotropy
To characterize the anisotropic motion in the presentarticle we use two parameters: A1 and A2, introducedpreviously.22 Parameter A1 is formally defined for an atomas:
A1 � � �Ux2�
1/2*��Uy2� � �Uz
2���1/2
� 1 (5)
where Ux2�, Uy
2�, and Uz2� are the mean-square
fluctuations along the principal components of motion forthe atom. Specifically, Ux
2� is the mean-square fluctua-tions along the direction of the first (largest) principalcomponent, Uy
2� is the mean-square fluctuations alongthe second principal component, and Uz
2� is the mean-square fluctuation along the third principal component.The parameter A1 approximately indicates how large thefluctuations are along the largest principal component ofmotion in comparison with fluctuations along the other
two components. For absolutely isotropic motion, theparameter A1 is equal to 0. The larger the value of A1, themore anisotropic is the motion. Typical average values ofthe parameter A1 for proteins are 0.6–0.8.22 The otherparameter that is used to characterize the anisotropy ofthe atomic motion is A2; it is formally defined as:
A2 � � �Uy2�
1/2*��Uy2� � �Uz
2���1/2
� 1 (6)
where Uy2� and Uz
2� are the mean-square fluctua-tions along the second and the third principal componentsof atomic motion. The parameter A2 indicates how largethe atomic motion is along the second largest principalcomponent compared to the motion along the third largestprincipal component. Typical average values of the param-eter A2 for proteins are 0.1–0.2.22
Simulation of Harmonic Crambin Trajectories
The frames of the harmonic crambin “trajectories” weregenerated by independently displacing each crambin heavyatom along three perpendicular axes. The atomic displace-ments were done in such a way that in the resultingtrajectories a three-dimensional Gaussian distributionwas generated for each crambin atom with the displace-ment axes as the principal components of the distribution.Each harmonic crambin trajectory consisted of 300 frames.In every frame of the harmonic trajectories atoms weredisplaced relative to the same initial positions constitutingthe centers for the atomic distributions. Atomic positionsin a crambin crystal structure (Hendrickson and Teeter,1981) were used as the centers for the distributions.
Principal component vectors and fluctuations along thesevectors for all heavy atoms were calculated for the crambintrajectory at 240 K by using CHARMM. These principalcomponent vectors and fluctuations were used to generatethe harm_240 K trajectory. The same principal componentvectors (as in the harm_240 K trajectory) were used ingeneration of the crambin harmonic trajectories withdifferent motional anisotropies. In these trajectories, theRMS fluctuations were kept the same for all atoms at avalue of 0.75 Å. The degree of motion anisotropy, definedby the parameter A1, was varied simultaneously for allcrambin heavy atoms by changing the ratio of fluctuationsalong the main principal component relative to the othertwo components.
Simulation of X-ray Data
The program XPLOR was used to generate X-ray datafrom the molecular dynamics and harmonic trajectories.The X-ray data were simulated by generating X-ray crystal-lographic reflections from the coordinate frames of thetrajectories. Three hundred coordinate frames saved fromthe molecular dynamics trajectories (every 1 ps) or simu-lated in the harmonic trajectories were used in the X-raydata generation. No explicit “experimental” noise wasadded to the generated reflection data. In generation ofcrystallographic reflections, crambin was assumed to be ina P21 space group with the following unit cell parameters:a � 40.96, b � 18.65, c � 22.52, � � 90.0, � 90.77, �
WHY ROTEIN R-FACTORS ARE SO LARGE 353

90.0 (1crn PDB structure); myoglobin was assumed to bein a P21 space group, with unit cell parameters: a � 64.10Å, b � 30.84 Å, c � 34.69 Å, � � 90.0, � 105.84, � 90.0(1mbc PDB structure). The direct summation method inXPLOR was used for the generation of the crystallographicreflections. No explicit temperature factors were used ingeneration of the reflections. The reflections generatedfrom the coordinate frames were vector averaged. Thevector averaging of crystallographic reflections (averagingof structure factor vectors) corresponds to the assumptionthat the motion of proteins molecules in different unit cellsof a crystal are not correlated.11 The averaged reflectionswere used as input data to the refinement protocols.
The convergence errors in the simulated X-ray datawere estimated by calculating the R-factors between sev-eral harmonic trajectories of the same length (300 frameswere generated for each trajectory), atomic fluctuationamplitudes, and principal components of motion for allcrambin atoms; the only difference between the trajecto-ries were initial seeds for a random number generator. TheR-factors between the reflection data generated from thesetrajectories were around 5% (for all data in resolution shell10.0–1.0 Å).
Refinement of the Simulated Data
The isotropic refinements of crambin against generatedX-ray reflections were performed by using XPLOR. Allreflections generated in the 10–1.0 Å resolution shell wereused in the XPLOR refinements. Cartesian simulatedannealing from a temperature of 1500 K, followed bysuccessive rounds of minor manual rebuilding, positionaland individual B-factor refinements were performed. Toensure convergence of the coordinate simulated annealingrefinements to the best possible structural models, isotro-pic temperature factors (B-factors) of crambin heavy at-oms were preset to the values corresponding to theirfluctuations in the molecular dynamics simulations (fromwhich the crystallographic data were generated). Through-out the refinements, the value of R-free factor12 wasfollowed to prevent data overfitting. The refinements of theharmonic trajectories were started from the structuresthat were centers of atomic distributions (known bestpossible models), and only B-factor refinements wereperformed.
The anisotropic refinements were performed by usingthe program SHELX.21 The final coordinate models ob-tained in the isotropic refinements by XPLOR were used asstarting models for in the SHELX refinements. Successiverounds of least-squares refinements were performed bySHELX using all reflections in resolution shell 10–1 Å. Inthe early rounds of the refinements, isotropic temperaturefactors were used. At the final stage, the full-matrixleast-square refinements with anisotropic temperaturefactors were performed.
REFERENCES
1. Laskowski RA, MacArthur MW, Moss DS, Thornton JM. PRO-CHECK: a program to check the stereochemical quality of protein
structure. J Appl Crystallogr 1993;26:283–291.2. Stout GH, Jensen LH. X-ray structure determination, a practical
guide. New York: John Wiley & Sons; 1989.3. Luzzati V. Traitment statisque des erreurs dans la determination
des structures cristallines. Acta Crystallogr 1952;5:802–810.4. Janin J. Errors in three dimensions. Biochimie 1990;72:705–709.5. Fitzpatrick PA, Steinmetz ACU, Ringe D, Klibanov AM. Enzyme
crystal structure in an neat organic solvent. Proc Natl Acad SciUSA 1993;90:8653–8657.
6. Veerapandian B, et al. Functional implications of interleukin-1bbased on the three dimensional structure. Proteins 1992;12:10–23.
7. Priestle JP, Schar HP, Grutter MG. Crystallographic refinementof interleukin 1 beta at 2.0 A resolution. Proc Natl Acad Sci USA1989;86:9667–9669.
8. Finzel BC, Clancy LL, Holland DR, Muchmore SW, WatenpaughKD, Einspahr HM. Crystal structure of recombinant humaninterleukin-1 beta at 2.0 A resolution. J Mol Biol 1989;209:779–791.
9. Wilson AJC. Largest likely values for the reliability index. ActaCrystallogr 1950;3:397–398.
10. Drenth J. Principles of protein X-ray crystallography. New-York:Springer-Verlag; 1994.
11. Kuriyan J, Petsko GA, Levy RM, Karplus M. Effect of anisotropyand anharmonicity on protein crystallographic refinement. J MolBiol 1986;190:227–254.
12. Brunger AT. Free R value: a novel statistical quantity for assess-ing the accuracy of crystal structures. Nature 1992;355:472–475.
13. Petsko GA, Ringe D. Fluctuations in protein structure from X-raydiffraction. Annu Rev Biophys Bioeng 1984;13:331–371.
14. Lattman EE. Why are protein crystallographic R-value so high?Proteins 1996;25:9–11.
15. Vitkup D, Petsko GA, Karplus MA. Comparison between molecu-lar dynamics and X-ray results for dissociated CO in myoglobin.Nat Struct Biol 1997;4:202–208.
16. Brooks BR, Bruccoleri RE, Olafson BD, States DJ, SwaminathanS, Karplus M. CHARMM: a program for macromolecular energy,minimization, and dynamics calculations. J Comput Chem 1983;4:187–217.
17. Brunger AT. XPLOR manual Version 3.1. New Haven: YaleUniversity Press; 1992.
18. Kleywegt GJ, Jones TA. Model-building and refinement practice.Methods Enzymol 1997;277:208–230.
19. Jackson EJ. A user’s guide to principle components. London: JohnWiley & Sons; 1991.
20. Caves LSD, Evanseck JD, Karplus M. Locally accessible conforma-tions of proteins—multiple molecular dynamics simulations ofcrambin. Protein Sci 1998;7:649–666.
21. Sheldrick GM. SHELX-93. Program for crystal structure refine-ment. Gottingen: University of Gottingen; 1993.
22. Ichiye T, Karplus M. Anisotropy and anharmonicity of atomicfluctuations in proteins: analysis of a molecular dynamics simula-tion. Proteins 1987;2:236–259.
23. Harata K, Abe Y, Muraki M. Full-matrix least-squares refinementof lysozymes and analysis of anisotropic thermal motion. Proteins1998;30:232–243.
24. Brooks CL III, Karplus M, Pettitt BM. Proteins: a theoreticalperspective of dynamics, structure, and thermodynamics. NewYork: John Wiley & Sons; 1988.
25. Elber R, Karplus M. Multiple conformational states of proteins: amolecular dynamics analysis of myoglobin. Science 1987;235:318–321.
26. Kidera A, Go N. Normal mode refinement: crystallographic refine-ment of protein dynamic structure. J Mol Biol 1992;225:457–475.
27. Kidera A, Inaka K, Matsushima M, Go N. Normal mode refine-ment: crystallographic refinement of protein dynamic structure.II. Application to human lysozyme. J Mol Biol 1992;225:447–486.
28. Gros P, van Gunsteren WF, Hol WGJ. Inclusion of thermal motionin crystallographic structures by restrained molecular dynamics.Science 1990;249:1149–1152.
29. Neria E, Fisher S, Karplus M. Simulation of activation freeenergies in molecular systems. J Chem Phys 1996;105:1902–1921.
354 D. VITKUP ET AL.