why is there an obesity epidemic? - infomed is there an obesity epidemic? richard kahn, phd. outline...
TRANSCRIPT

Why is There an Obesity Epidemic?
Why is There an Obesity Epidemic?
Richard Kahn, PhDRichard Kahn, PhD
OutlineOutline
• Defining the problem
• How did it happen?
• What can we do about it?

OutlineOutline
• Defining the problem
• How did it happen?
• What can we do about it?

Prevalence of Obesity in US Adults1960-2000
Prevalence of Obesity in US Adults1960-2000
0
5
10
15
20
25
30
35
1960 1970 1980
Perc
ent
Men
Women
20001990
Diabetes 56:2673-2676, 2007

Trends In Overweight ChildrenTrends In Overweight Children
0
2
4
6
8
10
12
14
16
18
66-70’ 71-74’ 76-80’ 88-94’ 99-00’
Year
%O
verw
eigh
t
6-23 mo.2-5 Years6-11 Years12-19 Years
Ogden et al. JAMA 288:1728-1732, 2002
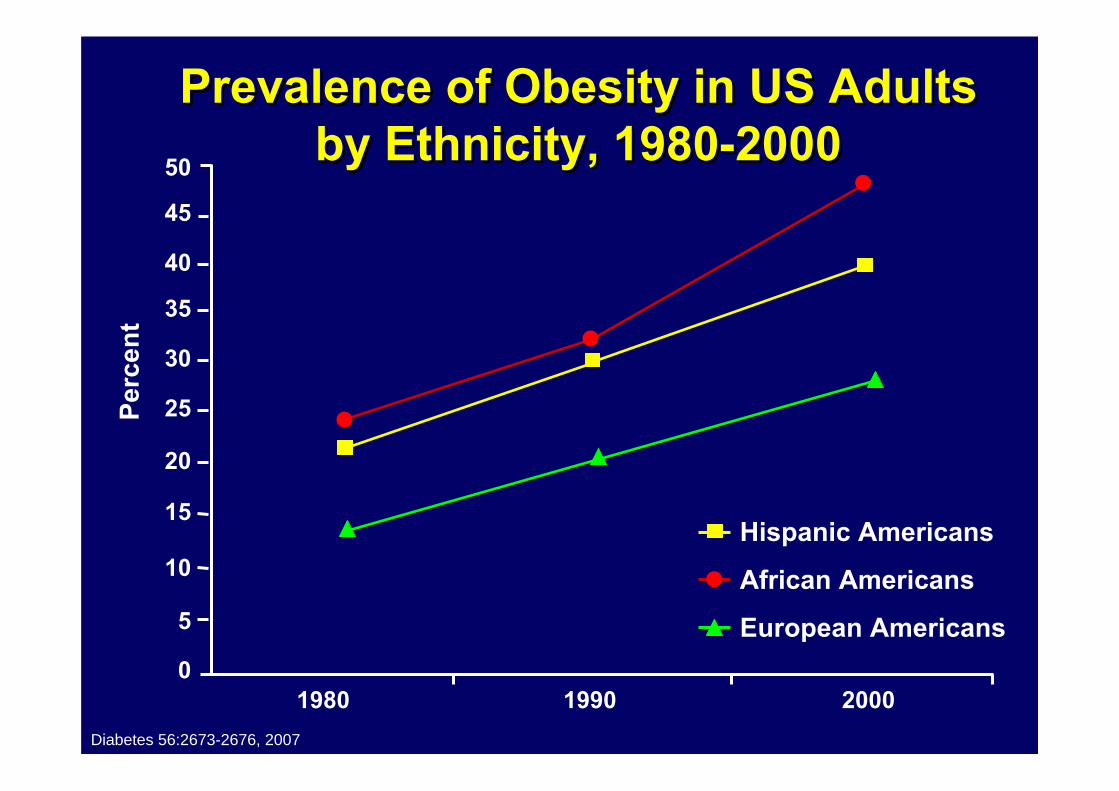
Prevalence of Obesity in US Adults by Ethnicity, 1980-2000
Prevalence of Obesity in US Adults by Ethnicity, 1980-2000
0
5
10
15
20
25
30
35
40
45
1980 1990 2000
Perc
ent
50
Hispanic Americans
African Americans
European Americans
Diabetes 56:2673-2676, 2007
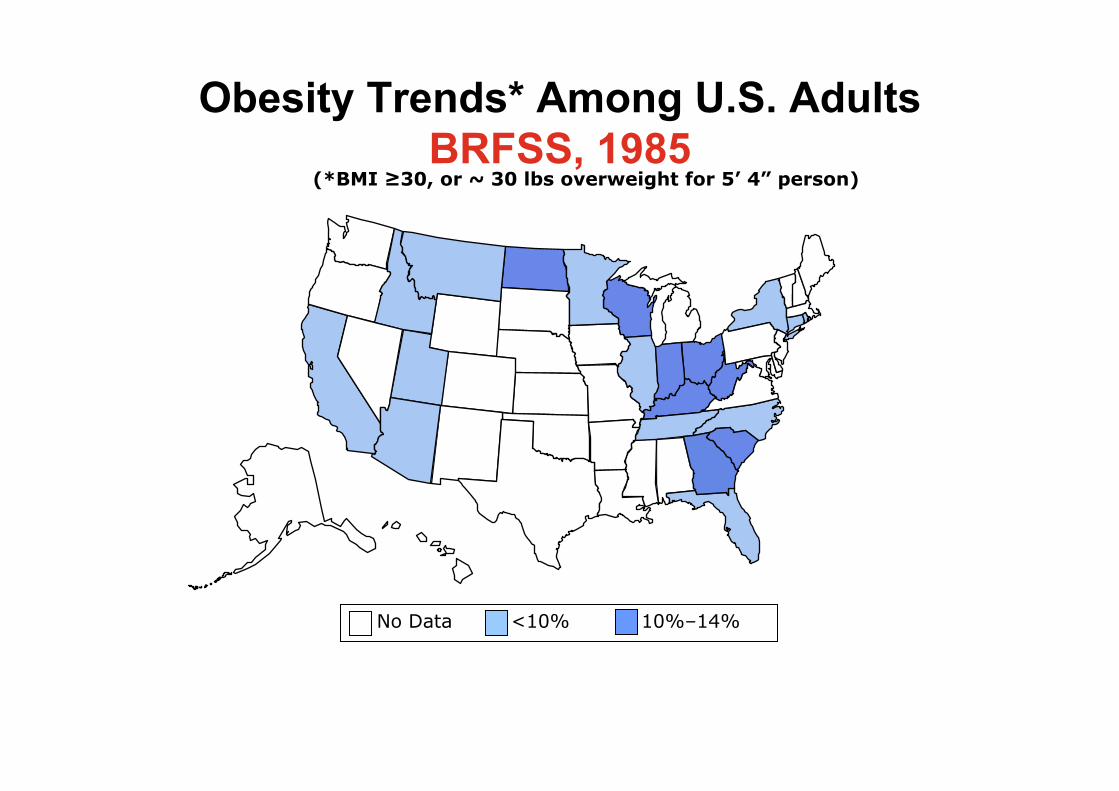
Obesity Trends* Among U.S. AdultsBRFSS, 1985
No Data <10% 10%–14%
(*BMI ≥30, or ~ 30 lbs overweight for 5’ 4” person)
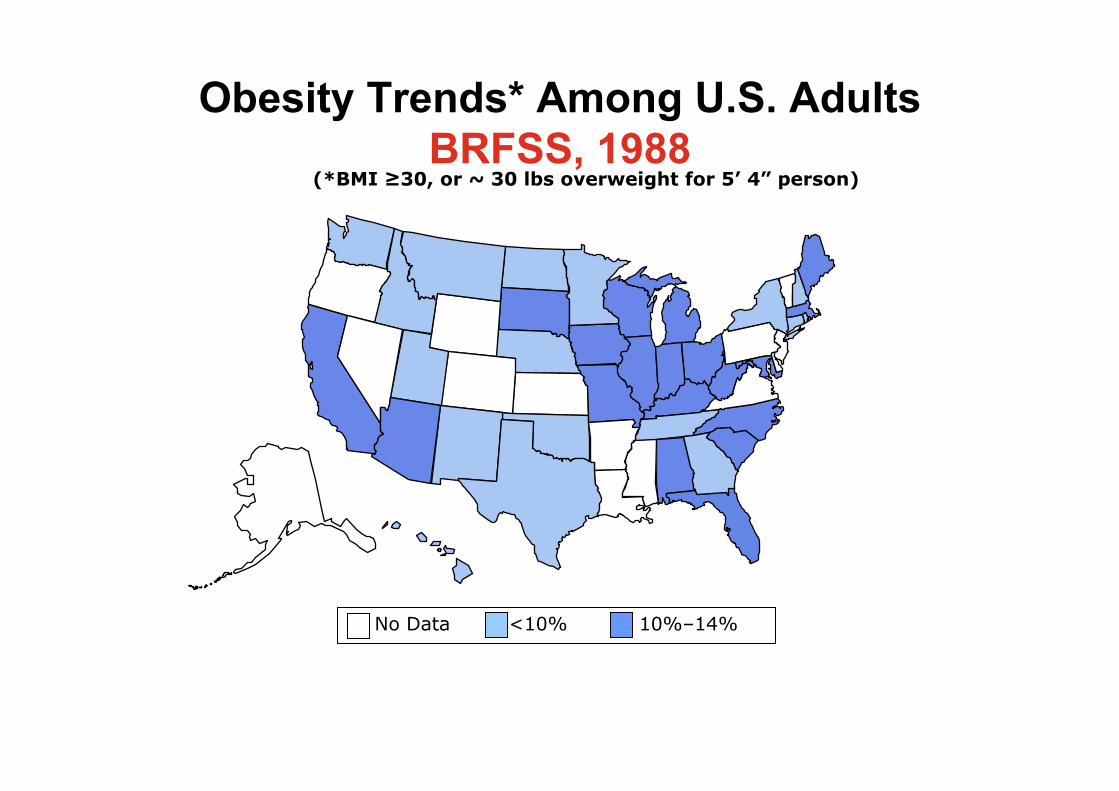
Obesity Trends* Among U.S. AdultsBRFSS, 1988
No Data <10% 10%–14%
(*BMI ≥30, or ~ 30 lbs overweight for 5’ 4” person)

Obesity Trends* Among U.S. AdultsBRFSS, 1991
No Data <10% 10%–14% 15%–19%
(*BMI ≥30, or ~ 30 lbs overweight for 5’ 4” person)
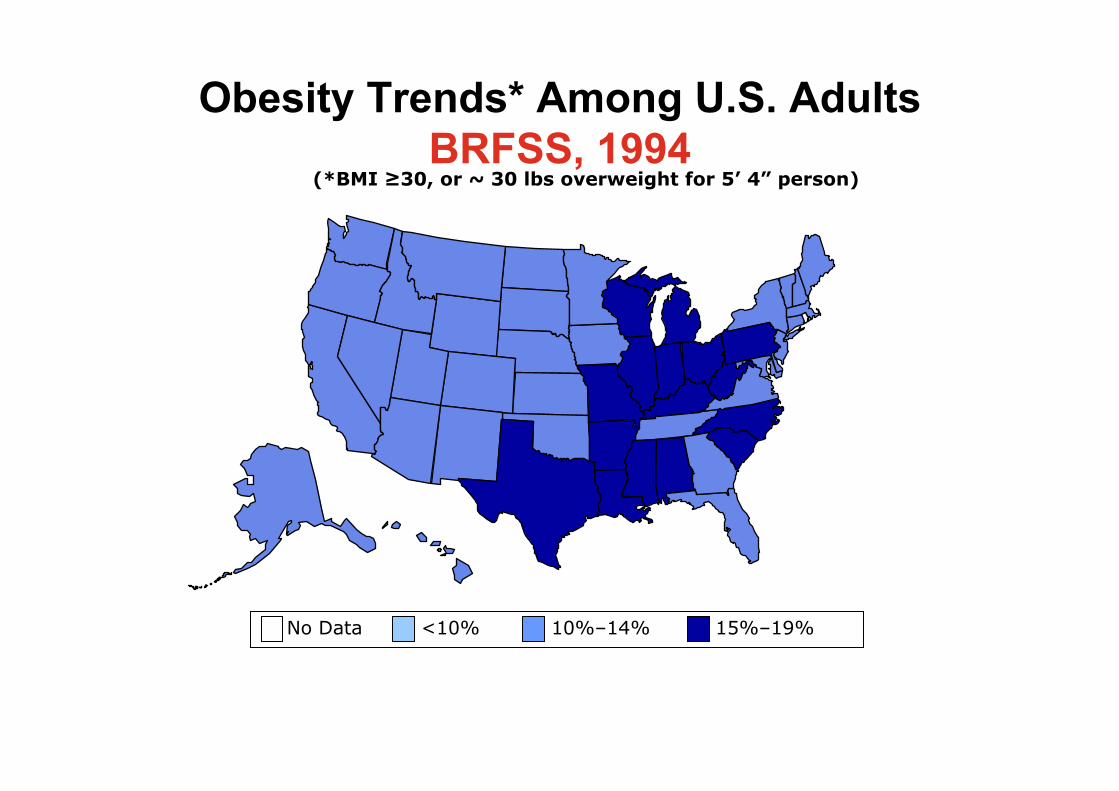
Obesity Trends* Among U.S. AdultsBRFSS, 1994
No Data <10% 10%–14% 15%–19%
(*BMI ≥30, or ~ 30 lbs overweight for 5’ 4” person)

Obesity Trends* Among U.S. AdultsBRFSS, 1997
No Data <10% 10%–14% 15%–19% ≥20
(*BMI ≥30, or ~ 30 lbs overweight for 5’ 4” person)

Obesity Trends* Among U.S. AdultsBRFSS, 2000
No Data <10% 10%–14% 15%–19% ≥20%
(*BMI ≥30, or ~ 30 lbs overweight for 5’ 4” person)

Obesity* Trends Among U.S. AdultsBRFSS, 2003
(*BMI ≥30, or ~ 30 lbs overweight for 5’ 4” person)
No Data <10% 10%–14% 15%–19% 20%–24% ≥25%
Source: Behavioral Risk Factor Surveillance System, CDC.
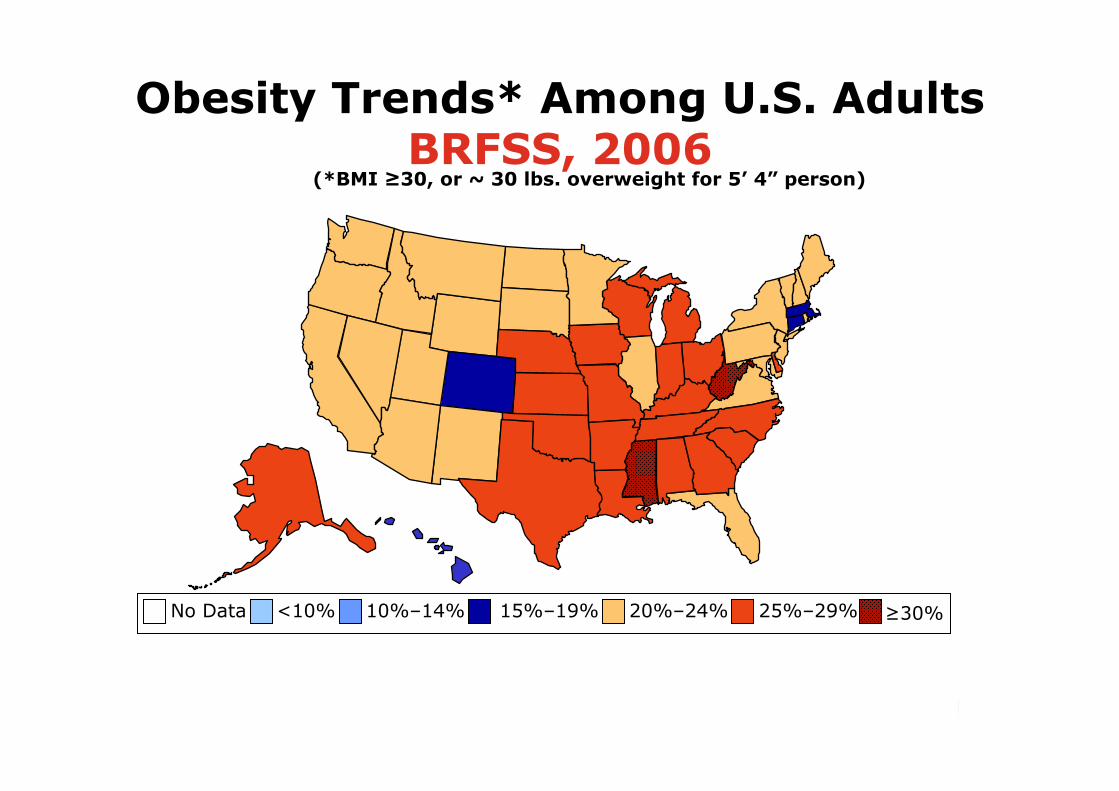
Obesity Trends* Among U.S. AdultsBRFSS, 2006
(*BMI ≥30, or ~ 30 lbs. overweight for 5’ 4” person)
No Data <10% 10%–14% 15%–19% 20%–24% 25%–29% ≥30%
OutlineOutline
• Defining the problem
• How did it happen?
• What can we do about it?

ObesityEnergy Intake
Exceeds
Energy Expenditure
Socio-cultural Factors
Genetic Factors Physiological Factors
Environmental Factors
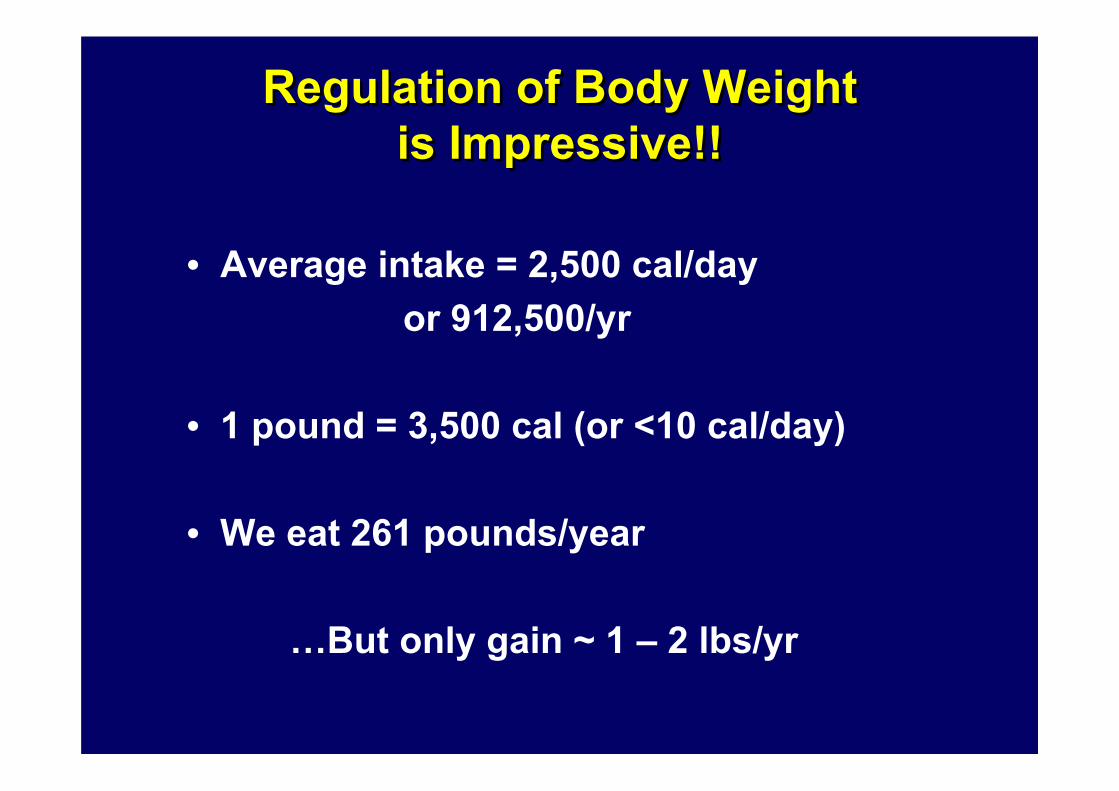
Regulation of Body Weight is Impressive!!
Regulation of Body Weight is Impressive!!
• Average intake = 2,500 cal/dayor 912,500/yr
• 1 pound = 3,500 cal (or <10 cal/day)
• We eat 261 pounds/year
…But only gain ~ 1 – 2 lbs/yr

Signals Controlling Energy HomeostasisSignals Controlling Energy Homeostasis
Brain
Catabolic: (e.g., PVN)Reduce food intakeReduce body fat
Anabolic: (e.g., LHA)Increase food intakeIncrease body fat
+ -
αMSH
NPY/AgRP
ARC
CRHOxytocin
MCHOrexin
HYPOTHALAMUS
Brain CapillaryPancreas
Stomach
Liver
Fat
Learning habits, stress,reward/hedonics, circadianrhythms, social situation
Energy Intakeand Expenditure
CCK, GLP-1, APOA-IV,Glucagon, EnterostatinGhrelin,PYY
GhrelinIncretins
Leptin FFAs
Glucose FFAs
Insulin

Cause Of ObesityCause Of Obesity
• Physical activity• Cost per calorie• Consumption pattern• Calories consumed• Source of calories
ONLY BECAUSE OF NET EXCESS CALORIES(intake exceeds output)

Adults Reporting No Physical ActivityAdults Reporting No Physical ActivityPe
rcen
t
Age
0
10
20
30
40
50
60
70
18-24 25-44 45-64 65-74 > 75
Healthy People 2010. US Government
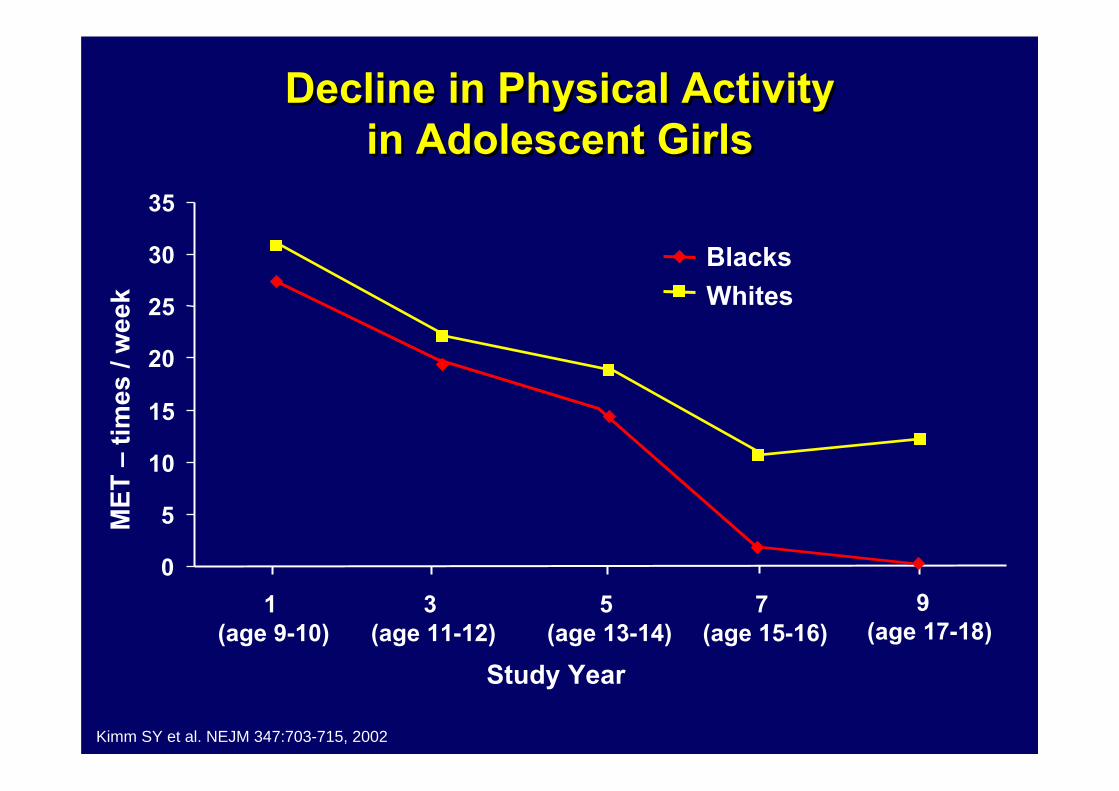
Decline in Physical Activity in Adolescent Girls
Decline in Physical Activity in Adolescent Girls
0
5
10
15
20
25
30
35
1(age 9-10)
3 (age 11-12)
5 (age 13-14)
7 (age 15-16)
WhitesBlacks
MET
–tim
es /
wee
k
9(age 17-18)
Study Year
Kimm SY et al. NEJM 347:703-715, 2002

100
75
50
25
0
% o
f dai
ly e
nerg
y ex
pend
iture
Exercise
NEATThermogenesis
RMR
Standing and
ambulating
526 minutes
Standing and
ambulating
373 minutes
Sitting 407 minutes
Sitting 571 minutes
352 + 65Kcal/day
LeanLean
ObeseObese
Ravussin, Science 307:530-331, 2005
Posture allocation (min)

Effect of Exercise on Energy Expenditure
Effect of Exercise on Energy Expenditure
0
5
10
15
20
25
LowNEAT
HighNEAT
ExerciseNEAT
Wee
kly
Act
ivity
EE
(kca
l x 1
03 )
Intermediate NEAT
+30 min/dBrisk Walk
5d/wk
+60 min/dBrisk Walk
5d/wk
+35 miRun/wk
Diabetes 56:2655-2667, 2007
Cause Of ObesityCause Of Obesity
• Physical activity
• Cost per calorie
• Consumption pattern
• Calories consumed
• Source of calories
ONLY BECAUSE OF NET EXCESS CALORIES(intake exceeds output)

Price of FoodPrice of Food
Food away from home 56
All food 59
Soft Drinks 20
Eggs 45
Poultry 50
Dairy 56
Fish 77
Fresh Fruit/Veg 118
Food at home 61
All items 57
Fats & Oils 35
Sugar/sweets 46
Red Meats 52
Cereal/bakery 75
Total Fruit/Veg 89
Retail prices - % change 1985 - 2000
Putnam et al, Food Review 25:2-15, 2002
Cause Of ObesityCause Of Obesity
• Physical activity
• Cost per calorie
• Consumption pattern
• Calories consumed
• Source of calories
ONLY BECAUSE OF NET EXCESS CALORIES(intake exceeds output)

Per Capita Consumption of Carbonated Soft DrinksPer Capita Consumption
of Carbonated Soft Drinks
05
101520253035404550
US Mexico UK China India
Gal
lons
2004 Pepsico Annual Report

Annual Per Capita Consumption of Snack Chips
Annual Per Capita Consumption of Snack Chips
0
5
10
15
20
US UK Mexico China India
Poun
ds p
er c
apita
2004 Pepsico Annual Report

Patterns of Food ConsumptionPatterns of Food Consumption
• 1970 - $6 billion on fast food• 2001 - $110 billion
• 1980 - Teenagers consumed 2 x more milk than soda• 2000 - Teenagers consumed 2 x more soda than milk
• 1975 – 33% of moms w/young children were employed• 2002 – 67% were employed
Source: “Fast Food Nation”

• We spend more on fast food then on movies, books, magazines, newspapers and recorded music –COMBINED!!
• Every month ~ 90% of children 3-9 years of age visit a fast food restaurant
• On any given day, 25% of adults visit a fast food restaurant
Patterns of Food ConsumptionPatterns of Food Consumption

Cause Of ObesityCause Of Obesity
• Physical activity
• Cost per calorie
• Consumption pattern
• Calories consumed
• Source of calories
ONLY BECAUSE OF NET EXCESS CALORIES(intake exceeds output)
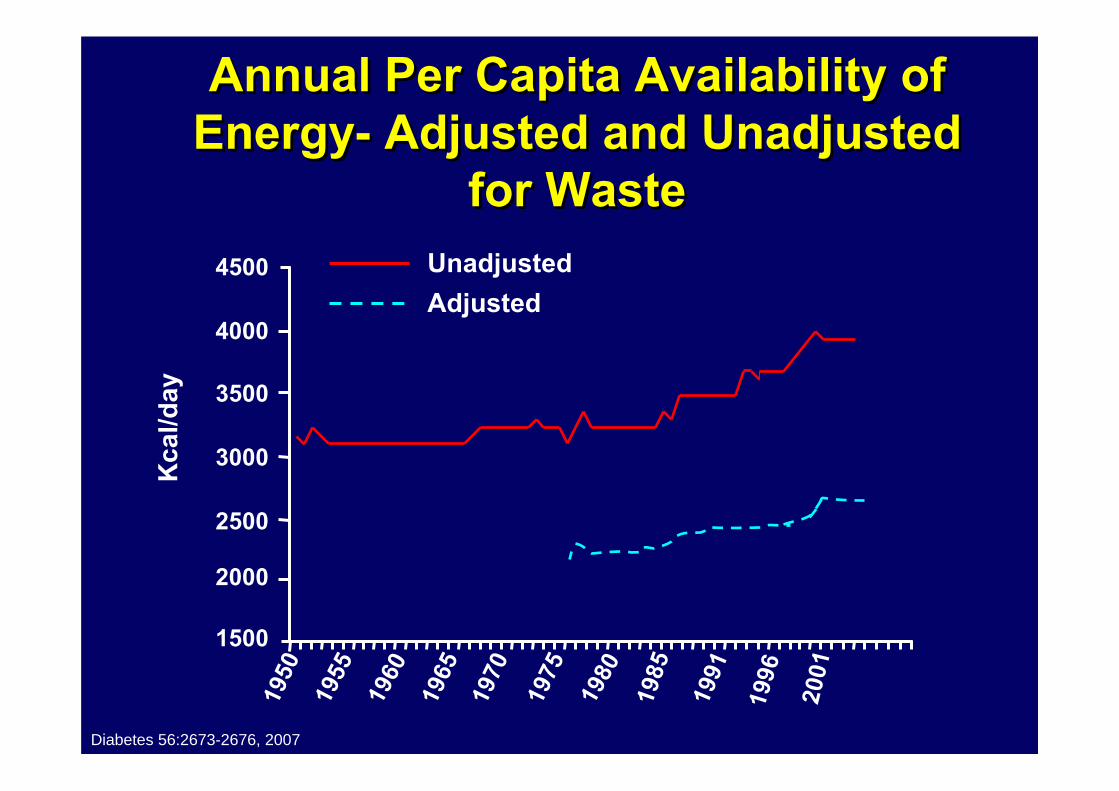
Annual Per Capita Availability of Energy- Adjusted and Unadjusted
for Waste
Annual Per Capita Availability of Energy- Adjusted and Unadjusted
for Waste
1500
2000
2500
3000
3500
4000
450019
50
1960
1975
Kca
l/day
1955
1980
1985
1991
1965
1970
1996
2001
UnadjustedAdjusted
Diabetes 56:2673-2676, 2007

Age-Adjusted Mean Energy Intake (kcal/day) Among White and Black
Men and Women
Age-Adjusted Mean Energy Intake (kcal/day) Among White and Black
Men and Women
0
500
1000
1500
2000
2500
3000
1971-74 1976-80 1988-94
Kca
l/day
1999-02
White MenBlack MenBlack WomenWhite Women
Diabetes 56:2673-2676, 2007

Trends in Energy Intake atFast Food Restaurants
Trends in Energy Intake atFast Food Restaurants
Calories Portion SizeFood 77-78’ 94-96’ % Increase 77-78’ 94-96 % Increase
French Fries 171 284 +66 60 94 +57
Hamburgers 419 497 +19 170 206 +18
Cheeseburgers 406 537 +32 169 209 +24
Nielsen SJ, Popkin BM, JAMA 289:450-453, 2003
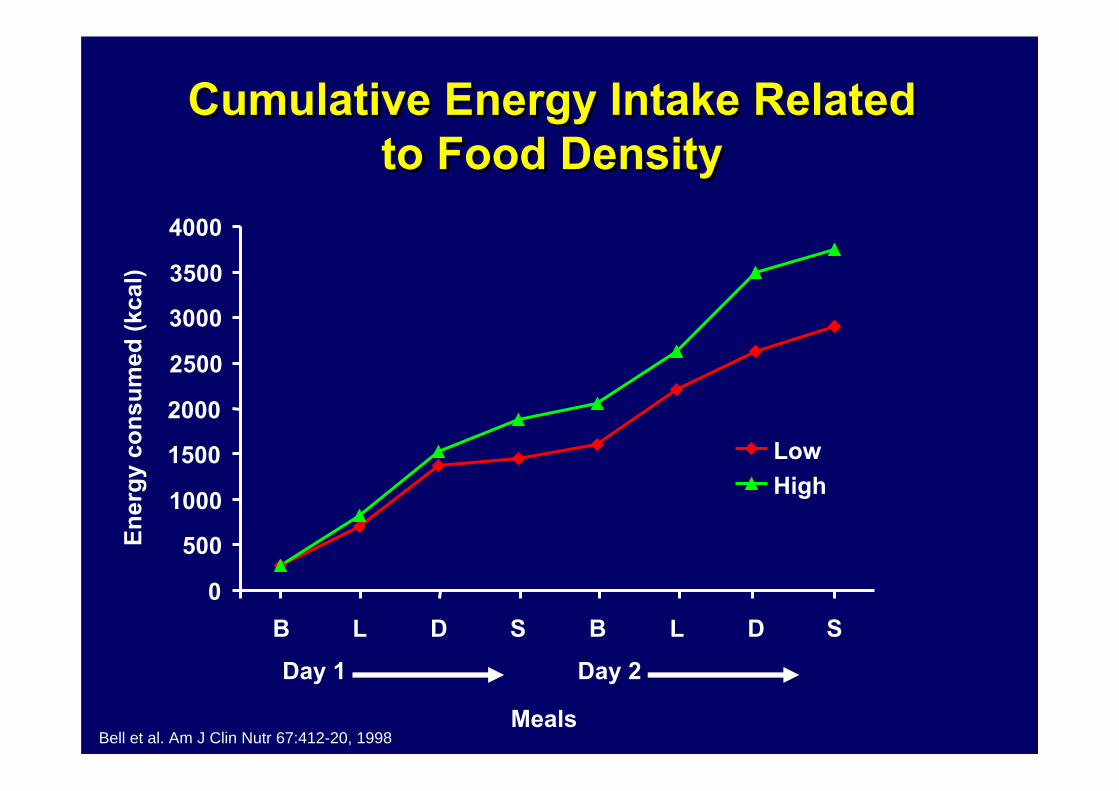
Cumulative Energy Intake Related to Food Density
Cumulative Energy Intake Related to Food Density
0
500
1000
1500
2000
2500
3000
3500
4000
B L D S B L D S
LowHigh
Ener
gy c
onsu
med
(kca
l)
Day 1 Day 2
MealsBell et al. Am J Clin Nutr 67:412-20, 1998
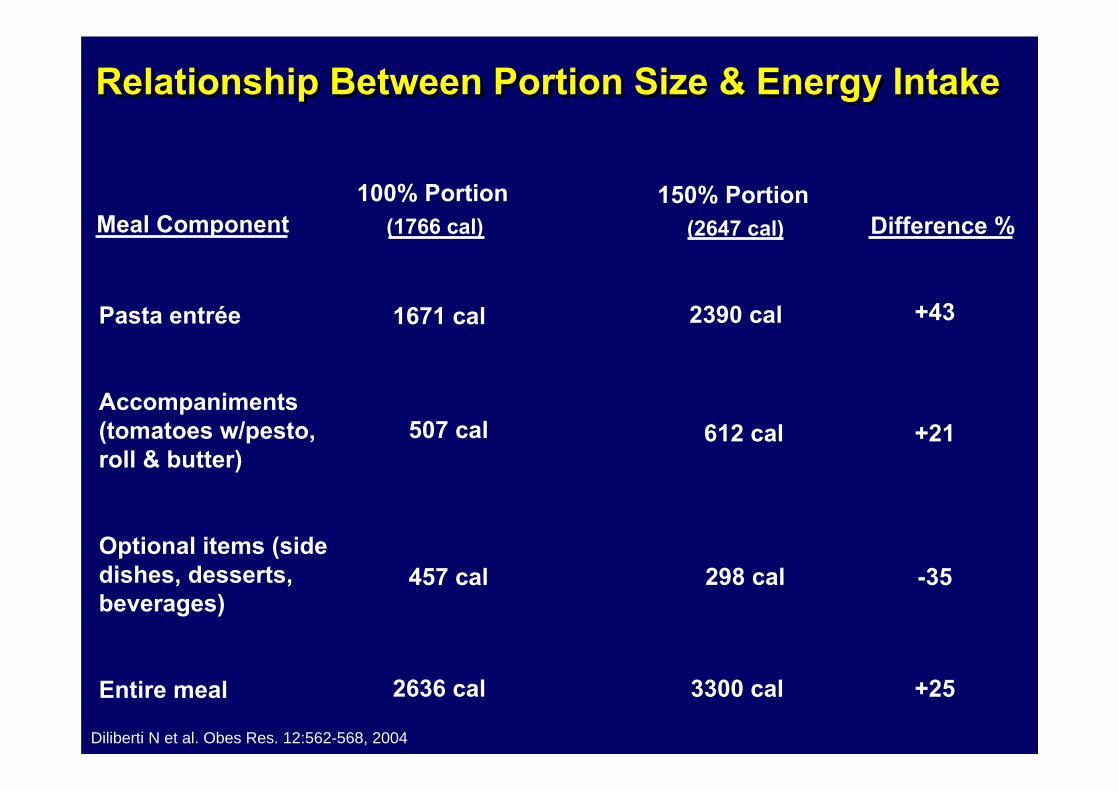
Relationship Between Portion Size & Energy IntakeRelationship Between Portion Size & Energy Intake
Pasta entrée
Accompaniments (tomatoes w/pesto, roll & butter)
Optional items (side dishes, desserts, beverages)
Entire meal
507 cal
457 cal
2636 cal
612 cal
298 cal
3300 cal
100% Portion(1766 cal)
150% Portion(2647 cal) Difference %
1671 cal 2390 cal +43
+21
-35
+25
Diliberti N et al. Obes Res. 12:562-568, 2004
Meal Component

Relationship between Portion Size & Energy Intake
Relationship between Portion Size & Energy Intake
Survey Question 100% Portion 150% Portion
Was the entrée portion appropriate for you?(1 = way too small, 7 = way to large)
Compare what you ate today vs. normally(1 = less than normal, 7 = more than normal)
Did the entrée give you value for your money(1 = poor value, 7 = great value)
How would you rate this entrée?(1 = off-putting, 7 = delicious)
4.4
4.7
5.1
6.1
4.6
5.0
5.6
6.1
*
Diliberti N et al. Obesity Res 12:562-568, 2004

Cause Of ObesityCause Of Obesity
• Physical activity
• Cost per calorie
• Consumption pattern
• Calories consumed
• Source of calories
ONLY BECAUSE OF NET EXCESS CALORIES(intake exceeds output)
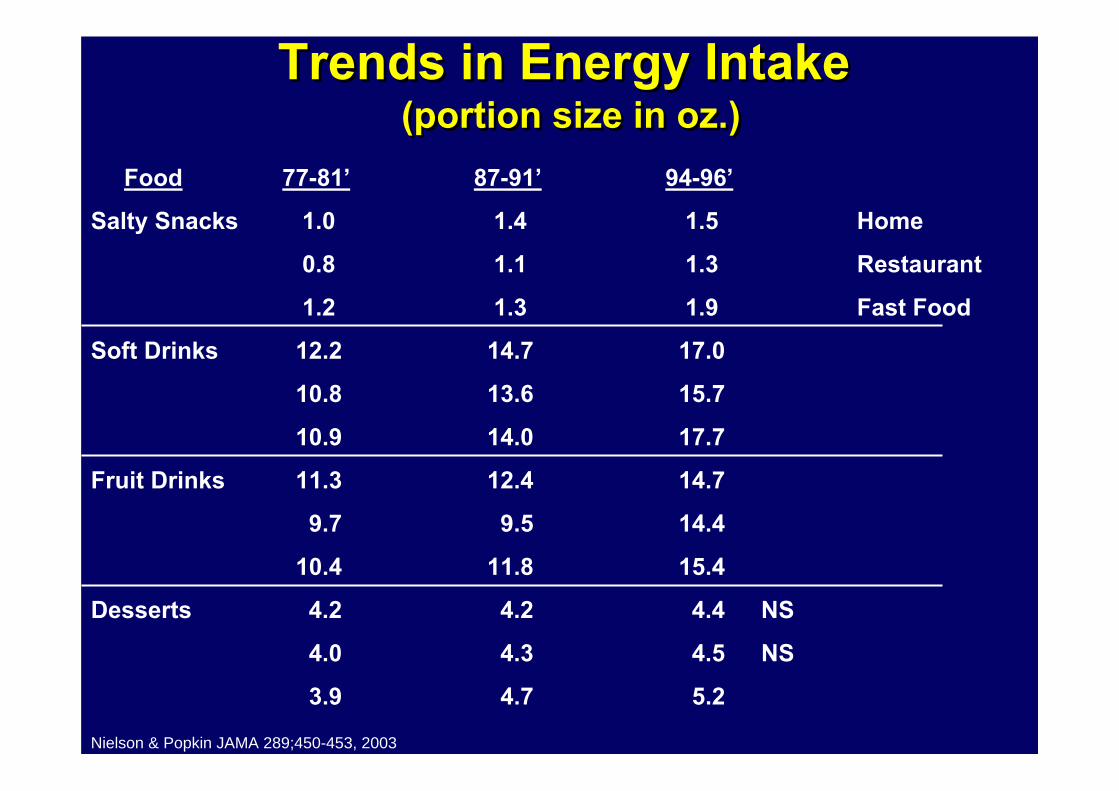
Trends in Energy Intake(portion size in oz.)
Trends in Energy Intake(portion size in oz.)
Food 77-81’ 87-91’ 94-96’
Salty Snacks 1.0 1.4 1.5 Home
0.8 1.1 1.3 Restaurant
1.2 1.3 1.9 Fast Food
Soft Drinks 12.2 14.7 17.0
10.8 13.6 15.7
10.9 14.0 17.7
Fruit Drinks 11.3 12.4 14.7
9.7 9.5 14.4
10.4 11.8 15.4
Desserts 4.2 4.2 4.4 NS
4.0 4.3 4.5 NS
3.9 4.7 5.2
Nielson & Popkin JAMA 289;450-453, 2003
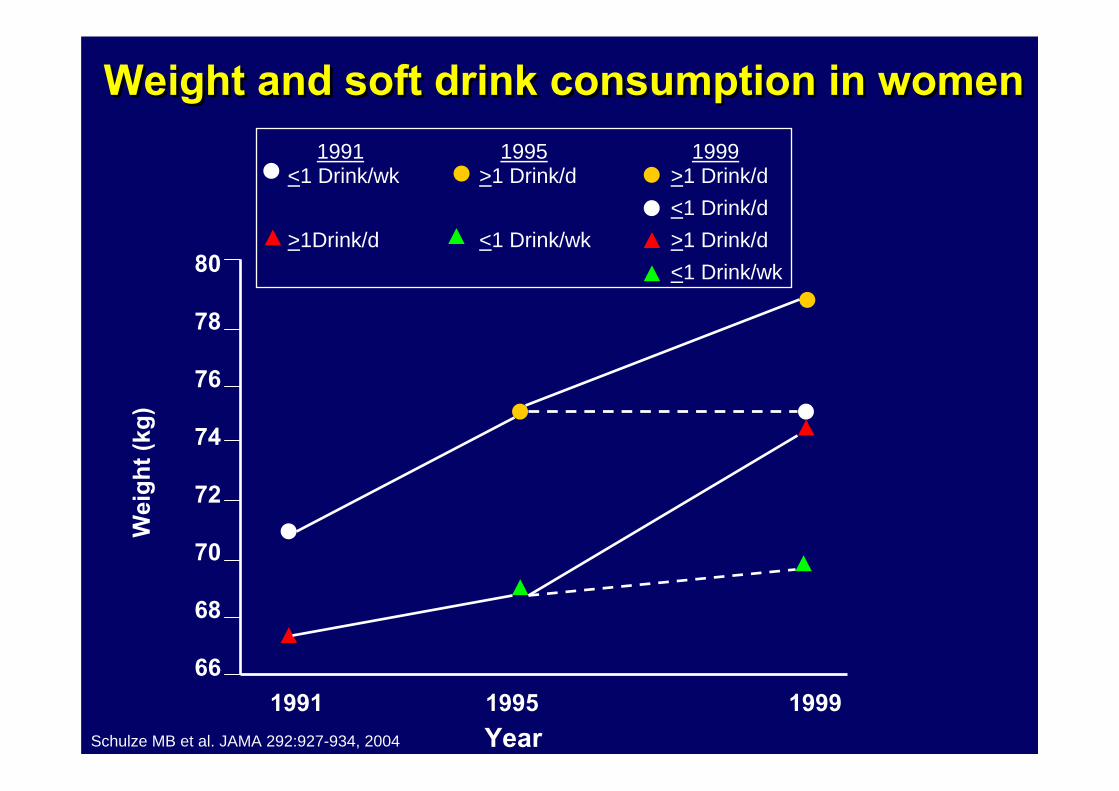
Weight and soft drink consumption in womenWeight and soft drink consumption in women
80
78
76
74
72
70
68
661991 1995 1999
Year
Wei
ght (
kg)
<1 Drink/wk >1 Drink/d >1 Drink/d<1 Drink/d
>1Drink/d <1 Drink/wk >1 Drink/d<1 Drink/wk
1991 1995 1999
Schulze MB et al. JAMA 292:927-934, 2004
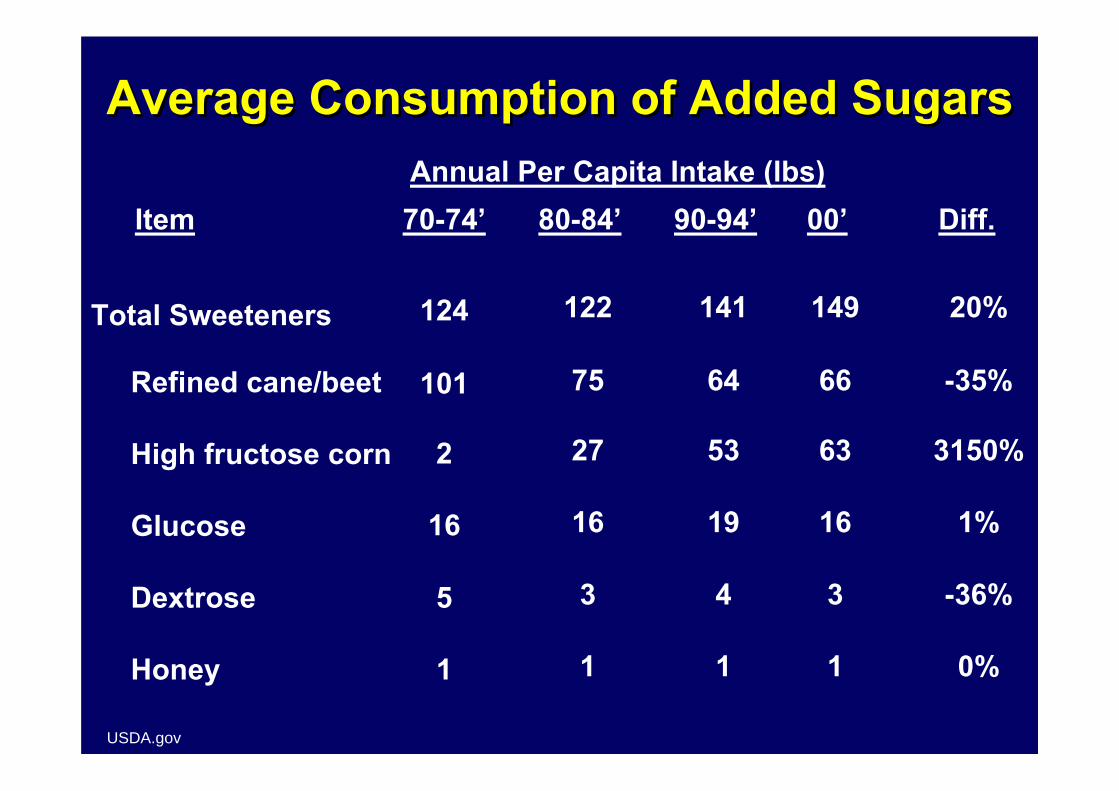
Average Consumption of Added SugarsAverage Consumption of Added Sugars
Item 70-74’ 80-84’ 90-94’ 00’ Diff.Annual Per Capita Intake (lbs)
Total Sweeteners
Refined cane/beet
High fructose corn
Glucose
Dextrose
Honey
124
101
2
16
5
1
122
75
27
16
3
1
141
64
53
19
4
1
149
66
63
16
3
1
20%
-35%
3150%
1%
-36%
0%
USDA.gov

Prevalence of Obesity in US Adults1960-2000
Prevalence of Obesity in US Adults1960-2000
0
5
10
15
20
25
30
35
1960 1970 1980
Perc
ent
Men
Women
20001990
Diabetes 56:2673-2676, 2007

Trends In Overweight ChildrenTrends In Overweight Children
0
2
4
6
8
10
12
14
16
18
66-70’ 71-74’ 76-80’ 88-94’ 99-00’
Year
%O
verw
eigh
t
6-23 mo.2-5 Years6-11 Years12-19 Years
Ogden et al. JAMA 288:1728-1732, 2002
OutlineOutline
• Defining the problem
• How did it happen?
• What can we do about it?

Mor
talit
y R
R in
70-8
2 Yr
Old
Adu
lts0.5
1.0
1.5
2.0
2.5
MEAN +SD
Rel
ativ
e M
orta
lity
from
CA
D in
Mid
dle
Age
d M
en
0.5
1.0
1.5
2.0
2.5
“Little” “Intermediate “RelativelyMuch”
Drivers(high sit time)
Conductors(low sit time)
Rel
ativ
e In
cide
nce
of M
I
0.5
1.01.52.02.5
Rel
ativ
e R
isk
in
Adu
lt W
omen
0.5
1.5
2.5
3.5 CVDMortality Fatal MI
Low Mid High Low Mid High
1st 2nd 3rd1.48+0.01 1.68+0.01 1.94+0.02
NON-EXERCISE PHYSICAL ACTIVITY PHYSICAL ACTIVITY LEVEL TERTILES
DAILY SITTING TIME
Effect of Exercise on CVD
Diabetes 56:2655-2666, 2007

Can we make these changes??Can we make these changes??
• Tax “bad” food ; subsidize “good” food
• Tax high BMI
• Offer incentives for exercise
• Make public awareness a priority

Thanks!Thanks!