why fixed slip devices can not measure the … · the pavement as determined by the macro-textural...
TRANSCRIPT

WHY FIXED SLIP DEVICES CAN NOT MEASURE THE SPEED GRADIANT DUE TO THE PAVEMENT
Z. Rado, PhD Research Associate, The Larson Institute, The Pennsylvania State University, USA
J. C. Wambold, PhD, Emeritus, Penn State, CDRM Inc.,USA [email protected]
ABSTRACT This paper covers why measurements at various speeds with continuous friction measurement equipment (CFME) are not able to measure the speed - friction gradient of the pavement as determined by the macro-textural features of the surface. Most CFMEs measure friction in the slip ratio range of 10% to 18%. In this range it is shown that the friction versus slip speed of these devices are mainly determined by the coupled properties of the surface micro-texture and relevant tire properties and to a minimal extent only by pavement macro-texture properties. The determinacy of low slip ratio friction measurements on the macro-textural features of the pavement surface are shown to be so low that they are inadequate to capture macro-texture caused speed degradation of friction. It is also shown in the paper that close to 100% slip ratio measurements at a relatively wide speed scale or direct macro texture measurements are needed to adequately determine the speed gradient if friction caused by the pavement macro-texture. The data and analysis in this paper provides strong and compelling evidence that the European Friction Index or EFI developed by the HERMES project sponsored by FEHRL is strongly affected by the lack of consideration of this phenomenon. It is recommended that the results of the HERMES project are reviewed taking into account the findings of the present paper. Based on the results of the presented paper it is suggested that CFME’s only measure friction at a fixed speed with a standard tire and use a macro-texture measuring device to obtain the pavement speed gradient. KEYWORDS: Friction, Speed Gradient, CFME

SURF0007RADO 2
1. INTRODUCTION It is generally not recognized that all the energy needed to enable a vehicle to move along a road must be transmitted through a very small area of contact between the tires and the road. A number of factors can reduce the forces acting within this surface area and lead to extreme or potentially dangerous situations. A number of studies [1, 2, 3, 4, 5, 6] that performed numerous tests made on different road surfaces have provided a greater understanding of how different factors affecting the road-tire interface influence the road surface friction. On a dry road under normal driving conditions, the forces developed by the contact area are sufficient to cope with all the forces needed to accelerate, brake, and steer. However, water on the road and poor macro-texture will reduce the effectiveness of the contact surface. The effects that this has on friction depend on several factors, including the road surface; the type, size, and state of wear of the tires; the depth of any water film; the speed of the vehicle; the tire-road slip ratio (which is affected by braking and cornering); and the wheel load. However, many other factors can influence the vehicle’s ability to maneuver, such as road surface contamination, the condition of the vehicle’s suspension, the condition of the vehicle’s braking system, the tire inflation pressure, the type of rubber in the tire, and the volume of traffic on the road.
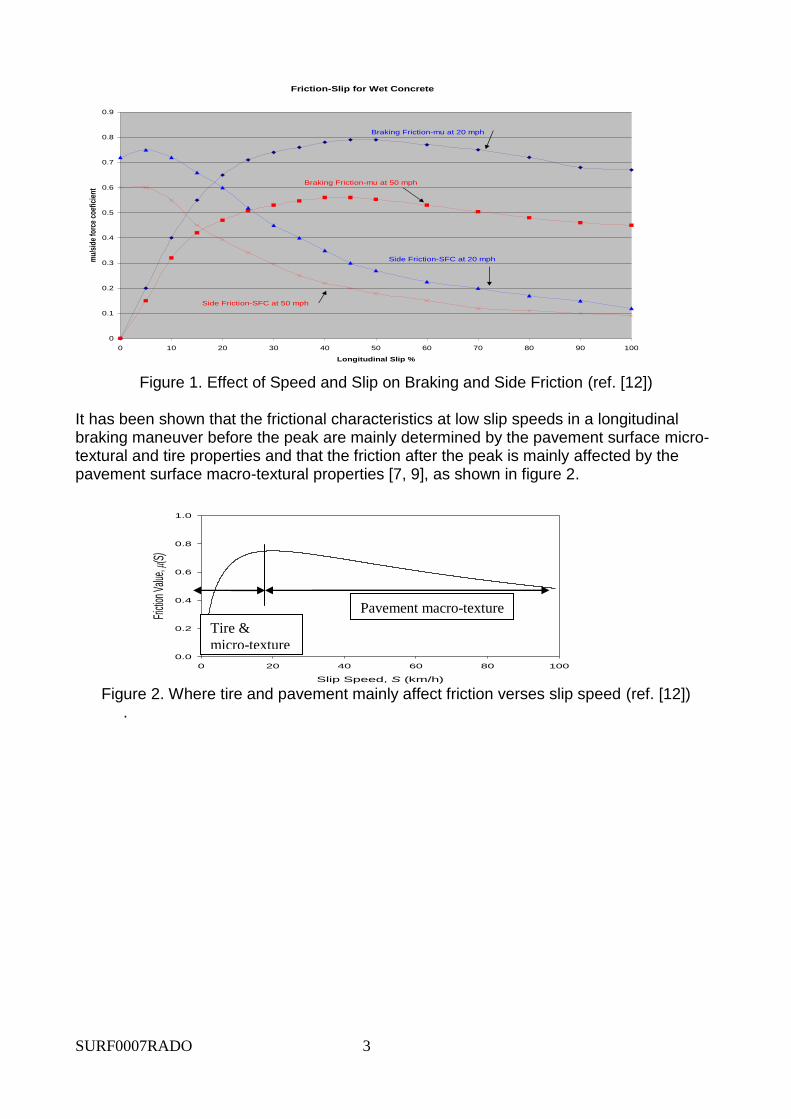
1.1 Vehicle Control Handling characteristics of vehicles include their response to braking, acceleration, and steering commands; and to disturbances such as wind gusts and roadway slope, cross-slope and turns that effect direction of vehicle motion [7, 8, and 9]. Thus there are four major issues in vehicle control: ability to accelerate, directional control, ability to stabilize against external disturbances, and ability to stop. In all cases, the acting control forces are generated at the tire-road interface. These forces are generated by friction between the tire and roadway. The ability to stabilize against external disturbances is very much dependent on the vehicle and tire and thus is not discussed here. While directional control is also dependent on the vehicle and tire, it is also very much dependent on surface friction. The side force that can be generated to control direction is in fact dependent on the friction available, the side slip and/or longitudinal slip, and the vehicle speed. The Figure 1 below shows how the side friction or the side force coefficient (SFC) is related to these parameters. While the longitudinal friction only drops off slightly at higher slips, the SFC decreases with higher slip significantly. This is the reason for automatic brake systems (ABS) on cars for controlling the slip percentage during a braking maneuver on the front side (before the peak) of the longitudinal (braking) friction curve and thus to maintain a reasonable amount of SFC for steering to assure adequate directional control. The effect of speed is deferential to both braking and SFC, as shown in the Figure 1.
SURF0007RADO 3
Friction-Slip for Wet Concrete
0
0.1
0.2
0.3
0.4
0.5
0.6
0.7
0.8
0.9
0 10 20 30 40 50 60 70 80 90 100
Longitudinal Slip %
mu
/sid
e fo
rce
coef
icie
nt
Braking Friction-mu at 20 mph
Braking Friction-mu at 50 mph
Side Friction-SFC at 20 mph
Side Friction-SFC at 50 mph
Figure 1. Effect of Speed and Slip on Braking and Side Friction (ref. [12])
It has been shown that the frictional characteristics at low slip speeds in a longitudinal braking maneuver before the peak are mainly determined by the pavement surface micro-textural and tire properties and that the friction after the peak is mainly affected by the pavement surface macro-textural properties [7, 9], as shown in figure 2.
Slip Speed, S (km/h)
0 20 40 60 80 100
Frict
ion V
alue, (
S)
0.0
0.2
0.4
0.6
0.8
1.0
Figure 2. Where tire and pavement mainly affect friction verses slip speed (ref. [12])
.
Pavement macro-texture
Tire &
micro-texture

SURF0007RADO 4
If one thinks about the mechanics of fixed slip friction at low slip percentage below the peak compared to high slip friction at 100% slip or locked wheel, it can be visualized why the sharp difference independencies illustrated in Figure 2 are true. In the case of low fixed slip below the peak, the tire elements come in contact with the pavement and start to be stretched due to the longitudinal braking forces, but due to the low slip and thus the little speed difference between the tire and pavement surface do not have time to be fully stretched before the elements are no longer in contact and a new element comes in the contact area. In the case of the locked wheel, the same elements of the footprint remain in contact and are stretched fully and come to a steady state sliding with 100% slip. Thus, the tire exposed to low fixed slip is never fully stretched, the amount of friction force is determined by the tire’s viscoelastic properties and the adhesion properties of the tire-surface contact area determined mostly by micro-texture, whereas the locked wheel fully stretches the tire and the pavement then takes control.
1.2 Three-Dimensional Modeling of Tire-Surface Friction
Since travel speed and slip speed have been treated separately by different friction models as two independent variables, it would be desirable to have a combined three-dimensional friction model including travel and slip speed as variables.
Bachmann [10] has found that repeated runs with variable-slip devices can provide data for deriving three-dimensional friction models with travel and slip speed as variables. As can be seen from Ffigure 3, the series of measurements almost constitutes a surface plot of friction. The curves are measured with a treaded automotive tire on dry concrete pavement.
Bachmann uses slip ratio rather than slip speed as an independent variable to view the surface plot as a full area cover. Since the upper limit slip speed at any travel speed equals the travel speed of the device, plotting with slip speed on one axis would generate a triangular-shaped plot projected in the speed plane.
A unified friction model also had been developed that closely describes the slip and speed dependency of longitudinal friction [13]. The model depicted in Figure 3b combines the tire, surface micro- and macro-textural properties into physical model to describe the tire’s frictional behavior at different slip ratios and under different vehicle speeds. The results of the unified tire model fit quite well on the measured values. Another physical friction model developed is the LuGre tire model that in its distributed two dimensional form as proposed by Canudas-de-Wit and extended to full dynamic tire friction model capable to adequately describe a combined longitudinal braking and lateral vehicle motion or cornering friction case by Velenis [14]. These models adequately describe the frictional behaviors of pavement – tire interaction the former model describes the characteristics using pavement surface parameters and assuming standard tire, thus describing the friction as function of pavement macro- and micro-texture while the latter focuses on the tire parameters assuming only simple and trivial pavement surface variations, thus describing friction as function of different tire properties.

SURF0007RADO 5
Travel Speed,
V (k m/h)
Slip Ratio,
λ (%)
Fri
cti
on
Va
lue
,
μ(V
,λ)
Figure 3a. Series of variable-slip measurements with an automotive tire at different
measuring speeds on dry concrete pavement [10].
00.10.20.30.40.50.60.70.80.91
0
10
20
30
40
50
60
70
0.2
0.3
0.4
0.5
0.6
0.7
0.8
Vehicle Speed [km/h]
Comprehensive Friction Curve
% Slip [s]
Co
eff
icie
nt
of
Fri
cti
on
Figure 3b – A Comprehensive Friction Model

SURF0007RADO 6
2. BACKGROUND The Permanent International Association of Road Congresses (PIARC) and Forum of European National Highway Research Laboratories (FEHRL) experiments [4, 6] showed that there is a significant difference in the speed gradient obtained with CFME and locked wheel tests, see figure 4a. This can be attributed to the fact that there are very small differences in the actual slip speed of a CFME at vehicle speeds of 40 to 95 km/h (typically slip speeds of 6 to 14 km/h). These occur on the steepest part of the speed gradient (both studies showed that the speed gradient is a function of macro-texture) and thus were considered inaccurate to extrapolate all the way to slip speeds of 95 km/h and above. This has continued to be the case in the European HERMES study and the NASA Runway Friction Workshops. At the 2009 Friction Workshop held at Penn State, Florida Southern University once again brought this matter up, showing similar results as shown in figure 4b.
Figure 4a Typical Speed Data for CFMEs and Locked Wheel Testers
Figure 4b Typical Speed Data for one CFME and one Locked Wheel Tester
3. CFME MEASUREMENTS AND SPEED GRADIENTS As a result, the authors conducted a study using the work of Bachmann and Rado [11], tire data given by Walter Horne, and text books such as by Wong, Limpert, and Ellis [7, 8, 9]. To do this study, plots from data were made of friction (Mu) versus slip speed for different vehicle speeds and then the curves for different percent slips were plotted to locate their position relative to the peak and their shape. Four cases were looked at: a lower-texture

SURF0007RADO 7
road with speed gradient (Sp) of 100 km/h for a semi-stiff tire and a stiffer tire, and at a higher-texture road with Sp of 200 with the same two tires. Figure 5 and 6 are for an Sp of 100 km/h, Figure 5 for the semi-stiff tire and Figure 6 for the stiffer tire. Note that the semi-stiff tire, Figure 5, shows the results typically found where the CFMEs are measured before the peak. The stiffer tire, Figure 6, puts the CFMEs above the peak. Figures 7 and 8 are also for the semi-stiff tire and the stiffer tire, but for an Sp of 200 km/h. For all cases one gets the type of speed gradients show in Figure 4. Figure 9 is based on the Rado model and gives the same type of results.
Figure 5. Mu versus Slip Speed for different Vehicle Speeds for a Semi-Stiff Tire and a
Sp of 100 km/h.
Figure 6. Mu versus slip speed for different Vehicle Speeds for a Stiffer Tire and a Sp of
100 km/h.

SURF0007RADO 8
Figure 7. Mu versus slip speed for different Vehicle Speed for a Semi-Stiff Tire and a
Sp of 200 km/h
Figure 8. Mu versus slip speed for different Vehicle Speed for a Stiffer Tire and an Sp of
200 km/h

SURF0007RADO 9
Figure 9. Mu versus slip speed for different Vehicle Speed using the Rado ModelStiffer
Tire and Sp of 200) In Figure 10 it is shown that 20% slip reads a slightly higher friction level than 10% and an Sp of 200 km/h does give a higher friction reading than an Sp of 100 km/h, all for the same tire. However, the figure also shows that the slope is much steeper than for the locked wheel since it is determined by the tire properties rather than the pavement slope shown by the locked wheel.
Figure 10 Effects of Sp (Macrotexture) on various percent slips from 10% to 100%
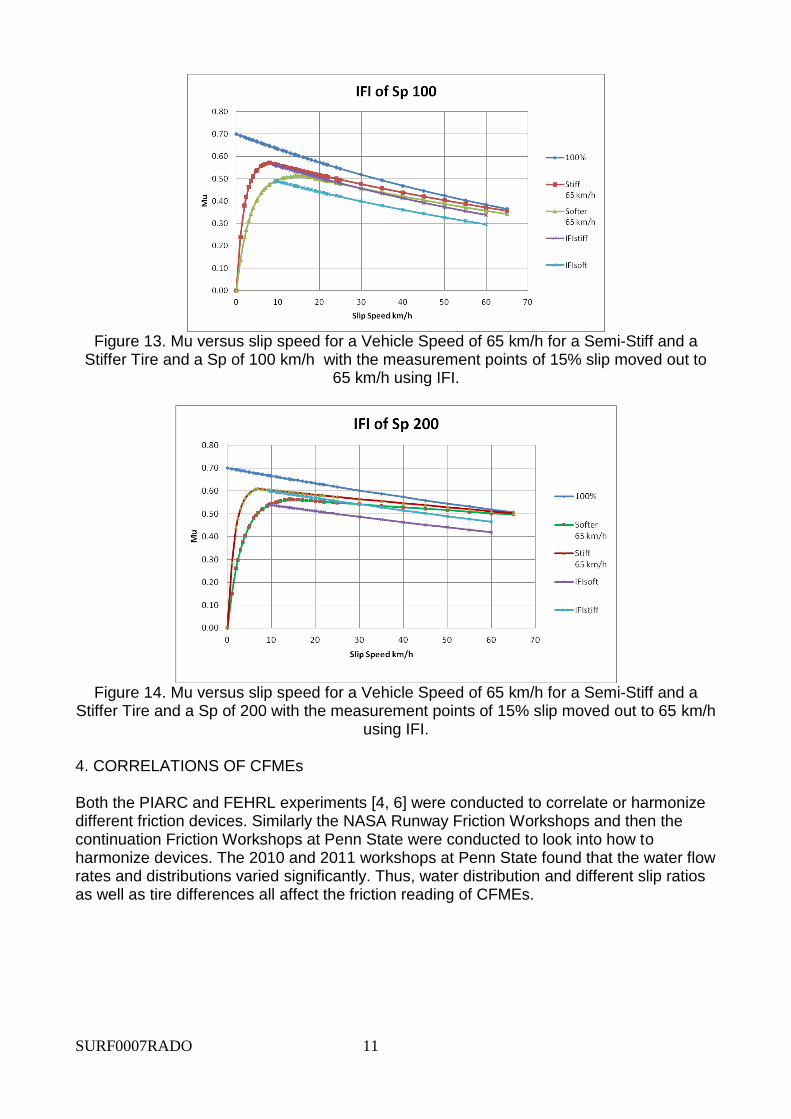
Figures 11 and 12 show data at a single vehicle speed of 65 km/h for both the semi-stiff and stiffer tire and an Sp of 100 km/h and 200 km/h, respectively.

SURF0007RADO 10
Figure 11 Mu versus slip speed for a Vehicle Speed of 65 km/h for a Semi-Stiff and a
Stiffer Tire and an Sp of 100 km/h with the measurement points of 15% slip (slip speed of 9.75 km/h).
Figure 12. Mu verses slip speed for a Vehicle Speed of 65 km/h for a Semi-Stiff and a
Stiffer Tire and an Sp of 200 km/h with the measurement points of 15% slip.
Figures 13 and 14 are repeats of Figures 11 and 12 with the measurement point extrapolated out to a slip speed of 65 km/h using the International Friction Index (IFI) Sp[3]. For both the Sp of 100 km/h and 200 km/h the difference of the semi-stiff tire and the stiffer tire from the 100% slip line are the same across the slip speed range, showing that the IFI would work with either tire. Similarly, the European Friction Index (EFI) [6] should work if the Sp is based on high slip speeds near or at 100% slip and determined by macro-texture.
SURF0007RADO 11
Figure 13. Mu versus slip speed for a Vehicle Speed of 65 km/h for a Semi-Stiff and a
Stiffer Tire and a Sp of 100 km/h with the measurement points of 15% slip moved out to 65 km/h using IFI.
Figure 14. Mu versus slip speed for a Vehicle Speed of 65 km/h for a Semi-Stiff and a
Stiffer Tire and a Sp of 200 with the measurement points of 15% slip moved out to 65 km/h using IFI.
4. CORRELATIONS OF CFMEs Both the PIARC and FEHRL experiments [4, 6] were conducted to correlate or harmonize different friction devices. Similarly the NASA Runway Friction Workshops and then the continuation Friction Workshops at Penn State were conducted to look into how to harmonize devices. The 2010 and 2011 workshops at Penn State found that the water flow rates and distributions varied significantly. Thus, water distribution and different slip ratios as well as tire differences all affect the friction reading of CFMEs.

SURF0007RADO 12
5. CONCLUSIONS AND RECOMMENDATIONS
This paper documented that the speed gradients obtained with CFMEs are actually tire properties and not the speed gradient of the pavement, and therefore should not be used in that way. However, CFMEs are still a valid measurement and do correspond to the friction level when measured at a single constant speed and always with the same standard tire. Also, the IFI or EFI can be used to bring them to the same level even though they measure differently depending on their slip ratio. If the speed gradient, Sp, is to be determined, it should be done with a high slip ratio tester, locked wheel being recommended. It is recommended that: 1. At a future workshop a CFME with adjustable slip ratio be run with the ASTM E1551
tire at five slip speeds and three vehicle speeds to map out the curves for the E1551 on at least two different surfaces, more if time allows. This will provide the tire data and allow for further evaluation for that tire. Similarly it would be useful for FEHRL to do similar tests for tires used in Europe. With these data in hand, tire effects should be eliminated in calibration.
2. The workshop test sites be maintained and used for further correlations. 3. The tire properties established in recommendation 1 be used to help correlate
CFMEs of different slip ratios and possibly to recommend the best slip ratio to use for each tire. Recent papers at session 308 of the 2011 TRB showed peaks for car tires up at 30% and higher; CFME slip ratio may need to be different when used on highways than when used on runways.
4. CFMEs should not be run at several speeds to determine speed gradient, but should be run at a single speed and use macro-texture measurements to obtain the pavement speed gradient. The data from the HERMES project should be revisited with this in mind to revise the EFI. To a lesser extent the PIARC data could be revised; however, the locked wheel data did dominate the golden values and thus is not as critical.
5. The IFI and or EFI calibration continue to be used to put measurements by different devices on the same scale.
6. Based on the water distributions found at the 2010 and 2011 Penn State workshops, water nozzles need to be redesigned to give a uniform water distribution under the tire at the correct water thickness. A standard nozzle for each size tire would be recommended. Correcting water distribution and correctly measuring speed gradient should go a long way toward harmonizing CFME measurements.

SURF0007RADO 13
6. REFERENCES
1. VERT Project: Vehicle-Road-Tyre interaction: Full integrated and physical model for handling behavior
prediction in potential dangerous situations. 2nd
International Colloquium on Vehicle Tyre Road Interaction; “Friction potential and safety; prediction of handling behavior”: The relative influence of the parameters affecting road surface friction: Authors: Michel Gothié (CETE Lyon in France), Tony Parry and Peter Roe (TRL in GB). 2007
2. HORNE, W. B., BUHLMANN, F. (1983), A method for rating the skid resistance and micro/macro texture characteristics of wet pavement, Frictional Interaction of Tire and Pavement, ASTM STP 793, W. E. Meyer and J.-D. Walter, Editors, American Society for Testing and Materials, 183, pp. 191-218.
3. WAMBOLD, J. C., ANTLE, C. E., HENRY, J. J., and RADO, Z. (1995), International PIARC Experiment
to Compare and Harmonize Texture and Skid Resistance Measurements, Final Report, PIARC Paris, France.
4. WAMBOLD, J. C., and HENRY, J. J., NASA WALLOPS TIRE/RUNWAY FRICTION WORKSHOPS
1993-2002, TP 14190E, Transportation Development Centre (TDC) of Transport Canada (TC), Set. 2002.
5. DESCORNET, G., Proposal for a European standard in relation with the skid resistance of road surfacings, Final Report, Research contract SSTC NO/C3/004, Belgian Road Research
Centre, Brussels, 1998.
6. HERMES – Harmonization of European Routine and research Measuring Equipment for Skid Resistance, FEHRL Report 2006/01.
7. WONG, J. Y., Theory of Ground Vehicles, Second Edition, John Wiley & Sons, Inc. New York. 3rd
Edition, March 20, 2001
8. LIMPERT, R., Motor Vehicle Accident Reconstruction and Cause Analysis, Third Edition, The Michie
Company, Charlottesville, Virginia. June 1994 9. ELLIS, J. R., Vehicle Dynamics, London Business Books Limited. Nov 1969
10. BACHMANN, T., “Wechselwirkungen im Prozess der Reibung zwischen Reifen und Fahrbahn”, PhD
Dissertation, Technical University of Darmstadt, Darmstadt, Germany. 1998.
11. RADO, Z., Analysis of Texture Models, PTI Report No. 9510, Pennsylvania Transportation Institute, Penn State University, State College, Pennsylvania, 1994.
12. Guide for Pavement Friction, AASHTO, 2008, ISBN Number: 1-56051-428-2
13. A Primer on Modern Runway Surface Friction Measurement, Norsemetres AS, Asker, Norway 1996
14. Velenis, E, et al., Dynamic tyre frictionmodels for combined longitudinal and lateral vehicle motion. Vehicle Systems Dynamics: International Journal of Vehicle Mechanics and Mobility, 2005. 43(1): p. 3-
29.