why do u.s. firms hold so much more cash than they used … · 2010-12-07 · why do u.s. firms...
TRANSCRIPT

THE JOURNAL OF FINANCE • VOL. LXIV, NO. 5 • OCTOBER 2009
Why Do U.S. Firms Hold So Much More Cashthan They Used To?
THOMAS W. BATES, KATHLEEN M. KAHLE, and RENE M. STULZ∗
ABSTRACT
The average cash-to-assets ratio for U.S. industrial firms more than doubles from1980 to 2006. A measure of the economic importance of this increase is that at theend of the sample period, the average firm can retire all debt obligations with its cashholdings. Cash ratios increase because firms’ cash flows become riskier. In addition,firms change: They hold fewer inventories and receivables and are increasingly R&Dintensive. While the precautionary motive for cash holdings plays an important rolein explaining the increase in cash ratios, we find no consistent evidence that agencyconflicts contribute to the increase.
CONSIDERABLE MEDIA ATTENTION has been devoted to the increase in cash holdingsof U.S. firms. For instance, a recent article in The Wall Street Journal states that“The piles of cash and stockpile of repurchased shares at [big U.S. companies]have hit record levels.”1 In this paper, we investigate how the cash holdings ofU.S. firms have evolved since 1980 and whether this evolution can be explainedby changes in known determinants of cash holdings. We document a secularincrease in the cash holdings of the typical firm from 1980 to 2006. In a re-gression of the average cash-to-assets ratio on a constant and time, time has asignificantly positive coefficient, implying that the average cash-to-assets ratio(the cash ratio) has increased by 0.46% per year. Another way to see this evolu-tion is that the average cash ratio more than doubles over our sample period,from 10.5% in 1980 to 23.2% in 2006.
Everything else equal, following Jensen (1986), we would expect firms withagency problems to accumulate cash if they do not have good investment oppor-tunities and their management does not want to return cash to shareholders.In the absence of agency problems, improvements in information and financial
∗Thomas Bates is from the W.P. Carey School of Business, Arizona State University. KathleenKahle is from the Terry College of Business, University of Georgia. Rene Stulz is the Everett D.Reese Chair of Banking and Monetary Economics, Fisher College of Business, Ohio State Univer-sity and is affiliated with NBER and ECGI. We are grateful to Viral Acharya, Heitor Almeida,Murillo Campello, John Cochrane, Harry DeAngelo, Gene Fama, John Graham, Campbell Harvey,Mike Lemmon, Bill Maxwell, Ronald Oaxaca, Amir Sufi, Jerome Taillard, Luigi Zingales, seminarparticipants at the Hong Kong University of Science and Technology, National University of Singa-pore, University of Alberta, University of Arkansas, and the University of Chicago, an anonymousreferee, and an anonymous associate editor for helpful comments. Bates and Kahle completed muchof this work while on the faculty at the Eller College of Management, University of Arizona.
1 Ian McDonald, “Capital Pains: Big Cash Hoards,” The Wall Street Journal, July 21, 2006, p.C1.
1985

1986 The Journal of Finance R©
technology since the early 1980s should have led to a reduction in corporatecash holdings. For example, firms can hedge more effectively as more types ofderivatives have become available, so the precautionary demand for cash shouldbe lower than 20 years ago. It is therefore important to investigate whether thedramatic increase in cash holdings results from agency problems, representsan anomaly that challenges existing theories of the determinants of corporatecash holdings, or results from changes in firm characteristics and their businessenvironment.
The increase in cash holdings that we document has important implicationsfor our understanding of the leverage of U.S. firms. Much of the finance liter-ature measures leverage as the ratio of debt to assets or debt to equity. Usingthese definitions, there is little evidence of a decrease in average leverage forthe firms in our sample. However, the net debt ratio (defined as debt minuscash, divided by book assets), a common measure of leverage for practitioners,exhibits a sharp secular decrease. Most of this decrease in net debt is explainedby the increase in cash holdings. The fall in net debt is so dramatic that the av-erage net debt for U.S. firms is negative in 2004, 2005, and 2006. Consequently,using net debt leads us to dramatically different conclusions about both thecurrent level of leverage in U.S. firms and the evolution of leverage over thelast 25 years.
After documenting the increase in cash holdings and decrease in net debt, weinvestigate why the increase in cash holdings has occurred. We first examinethe evolution of cash holdings for different subsamples of firms. Much attentionhas been paid to the cash hoards of large firms such as Microsoft and Exxon,both of which held in excess of $30 billion in mid-2006.2 However, we find thatthe increase in the average cash ratio is not explained by the evolution of cashholdings in large firms or in recent years. While large firms have experienceda substantial recent cash buildup, the average cash ratio has a significantlypositive time trend for all size quintiles. Foley, Hartzell, Titman, and Twite(2007) show that one reason for the cash buildup is that U.S. firms had foreignprofits that would have been taxed had they been repatriated. In our sample,we find that firms with no foreign income also experience a secular increase inthe cash ratio.
The increase in cash holdings is closely related to the disappearing dividendsand new listings phenomena documented by Fama and French (2001, 2004). Atthe beginning of our sample period, firms that do not pay common dividendshave essentially the same average cash ratio as firms that pay dividends. Whilethere is a clear time trend in cash holdings and in net debt for firms that do notpay dividends, there is no time trend in these variables for dividend payers. Bythe end of the sample period, the mean cash ratio of the firms that do not paydividends has more than doubled and the median has more than tripled. Overthe sample period, the average net debt ratio for nondividend payers falls from19.3% to −5.0%, and the median ratio falls from 21.4% to −5.7%.
2 See Ian McDonald, “Cash Dilemma: How to Spend It,” The Wall Street Journal, May 24, 2006,p. C3; Jesse Eisenger, “Long & Short: The Tech Sector Is Hogging the Green Blanket,” The WallStreet Journal, April 5, 2006, p. C1; and Simon London, “A Surplus of Cash Invariably Leads to aShortage of Sense,” Financial Times, November 30, 2005, “Business Life,” p. 13.
Why Do U.S. Firms Hold So Much More Cash than They Used To? 1987
A plausible explanation for the secular increase in cash holdings for nondiv-idend payers is provided by the precautionary demand for cash theory. Underthis theory, firms hold cash as a buffer to protect themselves against adversecash flow shocks. It is well known that idiosyncratic risk increased over muchof our sample period (see Campbell, Lettau, Malkiel, and Xu (2001)). When wedivide the industries in our sample into quintiles sorted by idiosyncratic cashflow volatility, we find that the average cash ratio increases by less than 50%for firms in the industries that experience the smallest increase in risk but byalmost 300% for firms in the industries that experience the greatest increasein risk. Brown and Kapadia (2007) provide evidence that idiosyncratic stockreturn risk is higher for firms in more recent IPO listing cohorts. We show thatfirms in more recent listing cohorts hold more cash. Brandt, Brav, Graham, andKumar (2009) find that the increase in idiosyncratic risk has partially reversedin recent years. We find that cash ratios have also fallen slightly in recentyears.
We next investigate whether the increase in cash holdings results fromchanges in firm characteristics, changes in the correlations between cash hold-ings and firm characteristics, or shifts in the demand for cash that are unre-lated to firm characteristics. In other words, we identify whether cash holdingschanged because firms moved along the demand curve for cash or because thedemand curve shifted. For this exercise, we use regression models similar tothose in Opler, Pinkowitz, Stulz, and Williamson (1999) (henceforth OPSW),which were derived before the recent run-up in cash holdings. We investigatewhether allowing the intercepts and slopes of the estimated regressions tochange in the 1990s and 2000s helps explain the cross section of cash holdings.Notably, the intercept falls over time, suggesting that the increase in the cashratio cannot be explained by a shift in the demand for cash that is unrelated tocharacteristics known to be correlated with the cash ratio. Furthermore, whilethere is evidence of changes in slopes and intercepts, the importance of thesechanges is limited in that a regression that does not allow for these changesexplains roughly as much of the variation in cash holdings as a regression thatallows for such changes.
We estimate a model of cash holdings using data from the 1980s and use it topredict the determinants of cash holdings in the 1990s and the 2000s. The pa-rameters of this model help explain why cash holdings have increased in recentyears. We use the model to assess how changes in firm characteristics explainthe increase in cash holdings. Four variables are particularly important. First,firms hold less working capital (net of cash), and in particular fewer inventoriesand accounts receivable. The noncash components of working capital and cashare substitutes in that these components can be converted into cash relativelyquickly. Second, cash flow volatility increases substantially. Since cash hold-ings are positively related to risk, the increase in risk has a substantial impacton cash holdings. Third, capital expenditures decline, and cash is negativelycorrelated with capital expenditures. Fourth, R&D expenditures increase, andfirms with higher R&D expenditures hold more cash.
Cash holdings do not increase for older, established firms that pay dividends,but firms that do not pay dividends increase their cash holdings dramatically.

1988 The Journal of Finance R©
Jensen (1986) argues that entrenched managers in firms with high free cashflow are reluctant to pay out cash to shareholders; thus, agency conflicts pro-vide a plausible explanation for this difference. However, we also find thatthe firms whose cash holdings increase the most have low cash flow and highTobin’s q, characteristics not typically associated with serious free cash flowproblems. We conduct three more formal analyses to assess whether agencyproblems can systematically explain the increase in cash holdings. First, weinvestigate whether the increase in the cash ratio is correlated with the GIMindex of Gompers, Ishii, and Metrick (2003), an often-used proxy for managerialentrenchment. We find that the firms in the highest quintile of the GIM index,the firms in which managers are presumably most entrenched, experience thesmallest increase in cash holdings from 1990 through 2006. Second, we con-sider whether cash has become less valuable as cash holdings have increased.If so, it is plausible that agency problems explain the increase in cash holdings.We find no evidence of a decrease in the value of cash. Finally, given an estab-lished line of research on the agency costs of “excess” cash, we examine whethermodeled residuals can explain the future growth in cash balances. Our resultsindicate that there is a negative relation between excess cash and the futuregrowth in cash holdings. Overall, the evidence is inconsistent with the notionthat the increase in cash holdings over time can be systematically ascribed toagency problems in firms.
The paper proceeds as follows. In Section I, we briefly review the theoreticaldeterminants of cash holdings and the existing evidence. We describe our sam-ple construction and document secular trends in cash holdings and net debtfor our sample in Section II. We examine subsamples to understand whetherthese trends are driven by certain types of firms in Section III. In Section IV,we estimate regression models of the cash ratio and investigate whether theintercepts and slopes of these models change in the 1990s and 2000s. In Sec-tion V, we estimate a model of cash holdings for the 1980s and use it to identifythe changes in firm characteristics that explain the increase in cash. We ex-plore the agency explanation for the increase in cash holdings in Section VI.Section VII concludes.
I. Why Firms Hold Cash
The economics and finance literature have identified four motives for firmsto hold cash. We review the theory and evidence on these motives briefly.
1. The transaction motive. Classic models in finance (e.g., Baumol (1952),Miller and Orr (1966)) derive the optimal demand for cash when a firmincurs transaction costs associated with converting a noncash financialasset into cash and uses cash for payments. Since there are economiesof scale with the transaction motive, large firms hold less cash. There ismuch evidence supporting the existence of these economies of scale (see,for instance, Mulligan (1997)).
2. The precautionary motive. Firms hold cash to better cope with adverseshocks when access to capital markets is costly. Consistent with this

Why Do U.S. Firms Hold So Much More Cash than They Used To? 1989
perspective, OPSW find that firms with riskier cash flows and poor accessto external capital hold more cash. The precautionary motive also suggeststhat firms with better investment opportunities hold more cash becauseadverse shocks and financial distress are more costly for them. OPSWalso find support for this prediction using market-to-book ratios and R&Dspending as proxies for investment opportunities. Almeida, Campello, andWeisbach (2004) model the precautionary demand for cash and find thatfinancially constrained firms invest in cash out of cash flow, while uncon-strained firms do not. Han and Qiu (2007) extend this model to allow fora continuous distribution of cash flow. They show theoretically that an in-crease in the volatility of cash flow increases cash holdings for firms thatare financially constrained, but has no determinate effect on other firms.Empirical evidence in Han and Qiu suggests that from 1998 to 2002, thecash holdings of constrained firms increase with cash flow volatility. Rid-dick and Whited (2009) question existing results on firms’ propensities toinvest in cash out of cash flow because the literature does not adjust formeasurement error in q; nonetheless, their model shows a positive rela-tion between a firm’s risk and its level of cash. Finally, Acharya, Almeida,and Campello (2007) develop a model showing that firms accumulate cashinstead of reducing debt when the correlation between operating incomeand investment opportunities is low. In their model, firms that issue debtand hoard cash transfer income from high cash flow states of the world inorder to fund investment in all states, including those with low cash flow.
3. The tax motive. Foley, Hartzell, Titman, and Twite (2007) find that U.S.corporations that would incur tax consequences associated with repatriat-ing foreign earnings hold higher levels of cash. This is particularly true foraffiliates for which the implied tax consequences of repatriation are thehighest. Consequently, multinational firms are more likely to accumulatecash.
4. The agency motive. As argued by Jensen (1986), entrenched managerswould rather retain cash than increase payouts to shareholders when thefirm has poor investment opportunities. These discretionary cash holdingsare typically estimated as the excess cash holdings derived from mod-els controlling for the transaction and precautionary motives for holdingcash. Dittmar, Mahrt-Smith, and Servaes (2003) find cross-country ev-idence suggesting that firms hold more cash in countries with greateragency problems. Dittmar and Mahrt-Smith (2007) and Pinkowitz, Stulz,and Williamson (2006) show that cash is worth less when agency prob-lems between insiders and outside shareholders are greater. Dittmar andMahrt-Smith (2007) and Harford, Mansi, and Maxwell (2008) provide evi-dence suggesting that entrenched managers are more likely to build excesscash balances, but spend excess cash quickly.
These four motives for holding cash have different implications for the causesand consequences of the secular increase in cash for U.S. firms. We expectthat firms and financial intermediaries have become more efficient in handlingtransactions, thus reducing transactions-based requirements for cash holdings.

1990 The Journal of Finance R©
The growth in derivative markets and improvements in forecasting and controlsuggest, all else equal, a lower precautionary demand for cash holdings. How-ever, there has been a secular increase in idiosyncratic risk (Campbell, Lettau,Malkiel, and Xu (2001)). Irvine and Pontiff (2008) show that the increase inidiosyncratic risk mirrors an increase in cash flow volatility. These changessuggest a higher volatility in unhedgeable risks and hence a greater precau-tionary demand for cash holdings. As shown in Fama and French (2004), thecomposition of firms has changed because of an influx of newly listed firms withweak track records. Brown and Kapadia (2007) demonstrate that newly listedfirms have permanently higher idiosyncratic risk, so the market-wide increasein idiosyncratic risk is due to a change in the composition of listed firms overtime. We therefore expect cash holdings to be higher for newly listed firms ingeneral, and for firms that go public later in the sample.
As discussed in Foley et al. (2007), during our sample period, U.S. multina-tionals elected to defer the taxes associated with repatriated foreign earnings,suggesting that firms with foreign operating subsidiaries are more likely tohold higher cash balances. The 2004 Jobs Creation Act allowed firms to repa-triate these foreign cash balances in 2004 and 2005 at a substantially lowermarginal rate. We use firms with nonmissing foreign pretax income to identifyfirms for which avoidance of taxation on foreign income might lead to highercash holdings.
If the increase in the average cash ratio is explained by Jensen’s (1986) freecash flow theory, then the bulk of the increase in cash holdings would occurin firms that generate free cash flow and have entrenched management thatfaces little pressure to pay out accumulated cash holdings. Firms generatingstrong free cash flow are firms with weak growth opportunities and hence lowTobin’s q. Using the Gompers, Ishii, and Metric (2003) entrenchment index, weexpect that firms with more entrenched management will experience a greaterincrease in the cash ratio.
A number of papers (Pinkowitz and Williamson (2004), Faulkender and Wang(2006), Pinkowitz, Stulz, and Williamson (2006), and Dittmar and Mahrt-Smith(2007)) estimate the value of cash holdings. For example, Dittmar and Mahrt-Smith (2007) find that the value of cash is lower for U.S. firms with poor gover-nance. Pinkowitz, Stulz, and Williamson (2006) find a similar result interna-tionally. If there is an agency explanation for the increase in cash holdings, thevalue of cash should fall over our sample period.
II. The Increase in Cash Holdings and the Decrease in Net Debt
We construct our sample from the WRDS merged CRSP/Compustat files forthe period 1980 to 2006. These data include surviving and nonsurviving firmsthat appear on Compustat at any time in the sample period. We require thatfirms have positive assets (Compustat data item #6) and positive sales (dataitem #12) to be included in a given year. We exclude financial firms (SIC codes6000-6999) because they may carry cash to meet capital requirements ratherthan for the economic reasons studied here. We also exclude utilities (SIC codes4900-4999) because their cash holdings can be subject to regulatory supervision.

Why Do U.S. Firms Hold So Much More Cash than They Used To? 1991
Table IAverage and Median Cash and Leverage Ratios from 1980 to 2006
The sample includes all Compustat firm-year observations from 1980 to 2006 with positive valuesfor the book value of total assets and sales revenue for firms incorporated in the United States.Financial firms (SIC code 6000-6999) and utilities (SIC codes 4900-4999) are excluded from thesample, yielding a panel of 117,438 observations for 13,599 unique firms. Variable definitions areprovided in the Appendix.
Aggregate Average Median Average MedianCash Cash Cash Average Median Net Net
Year N Ratio Ratio Ratio Leverage Leverage Leverage Leverage
1980 3,519 0.063 0.105 0.055 0.269 0.243 0.164 0.1781981 3,748 0.057 0.121 0.058 0.253 0.228 0.133 0.1601982 3,752 0.061 0.121 0.064 0.261 0.232 0.140 0.1581983 4,120 0.076 0.159 0.087 0.246 0.204 0.087 0.1111984 4,172 0.070 0.140 0.069 0.254 0.218 0.114 0.1411985 4,127 0.069 0.142 0.070 0.270 0.230 0.128 0.1511986 4,261 0.076 0.157 0.081 0.273 0.236 0.116 0.1431987 4,407 0.077 0.156 0.077 0.273 0.241 0.116 0.1531988 4,237 0.062 0.141 0.068 0.280 0.244 0.139 0.1631989 4,095 0.055 0.138 0.063 0.286 0.253 0.148 0.1731990 4,042 0.051 0.134 0.062 0.282 0.244 0.147 0.1681991 4,137 0.055 0.155 0.072 0.259 0.215 0.104 0.1291992 4,307 0.057 0.163 0.079 0.245 0.193 0.082 0.1111993 4,713 0.060 0.171 0.083 0.225 0.179 0.053 0.0911994 4,985 0.058 0.155 0.070 0.230 0.187 0.075 0.1061995 5,165 0.060 0.171 0.072 0.230 0.187 0.059 0.1051996 5,568 0.066 0.193 0.088 0.222 0.170 0.029 0.0771997 5,605 0.068 0.191 0.089 0.236 0.180 0.046 0.0851998 5,263 0.065 0.178 0.075 0.289 0.205 0.110 0.1191999 4,971 0.075 0.194 0.077 0.247 0.198 0.053 0.1042000 4,947 0.074 0.208 0.088 0.242 0.173 0.034 0.0752001 4,540 0.080 0.214 0.107 0.268 0.173 0.054 0.0622002 4,233 0.091 0.214 0.114 0.258 0.172 0.045 0.0542003 3,992 0.101 0.227 0.133 0.235 0.160 0.008 0.0162004 3,693 0.109 0.240 0.147 0.225 0.145 −0.015 −0.0032005 3,549 0.105 0.237 0.148 0.219 0.136 −0.020 −0.0052006 3,297 0.103 0.232 0.133 0.221 0.146 −0.010 0.015
Finally, we restrict our sample to firms that are incorporated in the UnitedStates.
The second column of Table I reports the number of sample firms in each year.We measure the cash ratio as cash and marketable securities (data item #1)divided by total assets (data item #6). The third column of Table I summarizesthe aggregate cash ratio for the sample firms, which is the sum of cash dividedby the sum of assets for all sample firms. This ratio is 6.3% in 1980 and increasesto 10.3% by 2006, reaching a peak of 10.9% in 2004. The next column reproducesthe average cash ratio for the sample firms by year. This ratio increases from10.5% in 1980 to 23.2% in 2006, peaking in 2004. The same trend is conveyedby the median cash ratio, which is reported in column 5. The median cash ratio
1992 The Journal of Finance R©
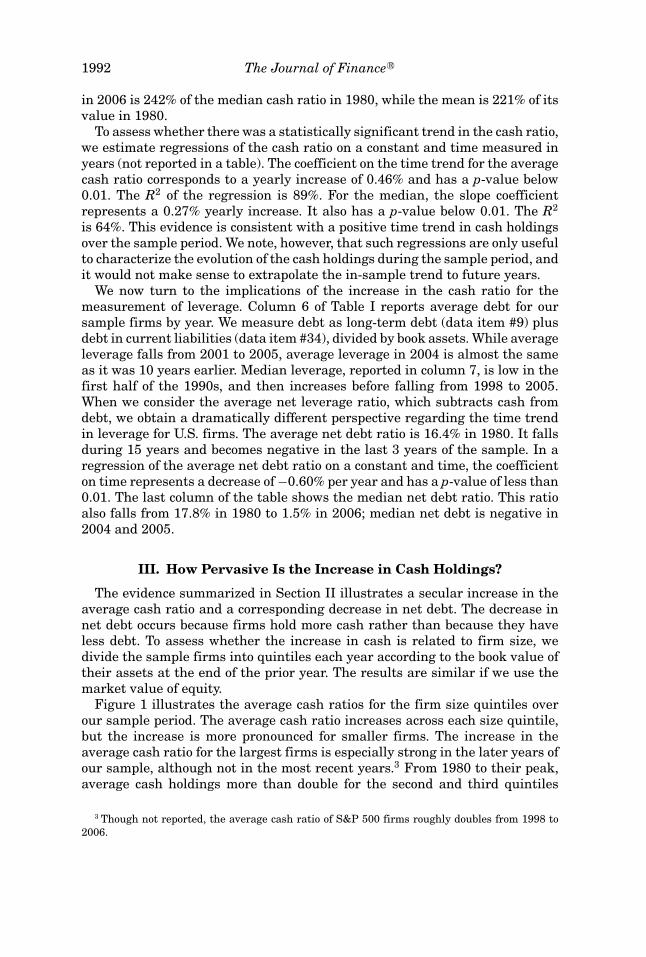
in 2006 is 242% of the median cash ratio in 1980, while the mean is 221% of itsvalue in 1980.
To assess whether there was a statistically significant trend in the cash ratio,we estimate regressions of the cash ratio on a constant and time measured inyears (not reported in a table). The coefficient on the time trend for the averagecash ratio corresponds to a yearly increase of 0.46% and has a p-value below0.01. The R2 of the regression is 89%. For the median, the slope coefficientrepresents a 0.27% yearly increase. It also has a p-value below 0.01. The R2
is 64%. This evidence is consistent with a positive time trend in cash holdingsover the sample period. We note, however, that such regressions are only usefulto characterize the evolution of the cash holdings during the sample period, andit would not make sense to extrapolate the in-sample trend to future years.
We now turn to the implications of the increase in the cash ratio for themeasurement of leverage. Column 6 of Table I reports average debt for oursample firms by year. We measure debt as long-term debt (data item #9) plusdebt in current liabilities (data item #34), divided by book assets. While averageleverage falls from 2001 to 2005, average leverage in 2004 is almost the sameas it was 10 years earlier. Median leverage, reported in column 7, is low in thefirst half of the 1990s, and then increases before falling from 1998 to 2005.When we consider the average net leverage ratio, which subtracts cash fromdebt, we obtain a dramatically different perspective regarding the time trendin leverage for U.S. firms. The average net debt ratio is 16.4% in 1980. It fallsduring 15 years and becomes negative in the last 3 years of the sample. In aregression of the average net debt ratio on a constant and time, the coefficienton time represents a decrease of −0.60% per year and has a p-value of less than0.01. The last column of the table shows the median net debt ratio. This ratioalso falls from 17.8% in 1980 to 1.5% in 2006; median net debt is negative in2004 and 2005.
III. How Pervasive Is the Increase in Cash Holdings?
The evidence summarized in Section II illustrates a secular increase in theaverage cash ratio and a corresponding decrease in net debt. The decrease innet debt occurs because firms hold more cash rather than because they haveless debt. To assess whether the increase in cash is related to firm size, wedivide the sample firms into quintiles each year according to the book value oftheir assets at the end of the prior year. The results are similar if we use themarket value of equity.
Figure 1 illustrates the average cash ratios for the firm size quintiles overour sample period. The average cash ratio increases across each size quintile,but the increase is more pronounced for smaller firms. The increase in theaverage cash ratio for the largest firms is especially strong in the later years ofour sample, although not in the most recent years.3 From 1980 to their peak,average cash holdings more than double for the second and third quintiles
3 Though not reported, the average cash ratio of S&P 500 firms roughly doubles from 1998 to2006.

Why Do U.S. Firms Hold So Much More Cash than They Used To? 1993
0
0.05
0.1
0.15
0.2
0.25
0.3
0.35
0.4
1980 1982 1984 1986 1988 1990 1992 1994 1996 1998 2000 2002 2004 2006
Year
cash
/ass
ets
Q1: Smallest firm size quintile Q2 Q3 Q4 Q5: Largest firm size quintile
Figure 1. Average cash ratios by firm size quintile from 1980 to 2006. The sample includesall Compustat firm-year observations from 1980 to 2006 with positive values for the book value oftotal assets and sales revenue for firms incorporated in the United States. Financial firms (SIC code6000-6999) and utilities (SIC codes 4900-4999) are also excluded from the sample, yielding a panelof 117,438 observations for 13,599 unique firms. The cash ratio is measured as the ratio of cashand marketable securities to the book value of total assets. Firms are sorted into quintiles basedon the book value of sample firm assets in the prior fiscal year. The first quintile (Q1) comprisesthe smallest firms in the sample, while the fifth quintile (Q5) comprises the largest firms in thesample.
and almost double for all other quintiles. We again regress the cash ratio on aconstant and time (measured in years) for each size quintile and find a positiveand significant slope coefficient for each. Given this evidence, we conclude thatthe secular increase in cash ratios is not driven by the largest firms in oursample, and is markedly more pronounced in smaller firms.
While not shown in the figure, average net debt falls sharply for the firmsin the first three quintiles (the smallest firms), but shows little decrease forthe largest firms. Notably, firms in the largest quintile have higher leveragein 2006 than in 1980, so the increase in leverage partly offsets the impact ofthe increase in cash holdings on net debt. All other size quintiles experience adecrease in leverage. The decrease in average leverage is small except for thesecond quintile. Median leverage, in contrast, falls substantially for the threesmallest quintiles but increases for the largest firms.
The 1990s witnessed a surge in IPO activity. IPO firms could have more cashbecause of the IPO and because they often issue seasoned equity within severalyears of the IPO. In columns 2 and 3 of Table II, we report average cash ratios forfirms that, respectively, did and did not go public within the last 5 years.4 Theaverage cash ratio more than doubles (from 9.9% to 21.8%) for non-IPO firms
4 We use Thomson’s SDC New Issues database to determine IPO dates, when available, andCRSP listing dates for firms not in SDC.

1994 The Journal of Finance R©
Table IIAverage Cash Ratios from 1980 to 2006 Delineated by New IssueStatus, the Payment of Dividends, and Accounting Performance
The sample includes all Compustat firm-year observations from 1980 to 2006 with positive valuesfor the book value of total assets and sales revenue for firms incorporated in the United States.Financial firms (SIC code 6000-6999) and utilities (SIC codes 4900-4999) are excluded from thesample, yielding a panel of 117,438 observations for 13,599 unique firms. Firms are assigned tothe IPO subsample if they have gone public within the prior 5 calendar years, and to the non-IPO subsample otherwise. A firm is classified as a dividend payer if it paid common dividends inthat year. Firms with accounting losses at the fiscal end of the designated year are assigned tothe negative net income subsample. Differences in the average cash ratio between the new issues,dividend status, and accounting performance subsamples are statistically different from zero atbetter than the 1% level for each reported year with the exception of differences in accountingperformance for 1982. Variable definitions are provided in the Appendix.
New Issues Dividend Status Accounting Performance
IPO Non-IPO Dividend Nondividend Negative Net Nonnegative NetYear Firms Firms Payer Payer Income Income
1980 0.211 0.099 0.086 0.130 0.122 0.1011981 0.231 0.109 0.092 0.151 0.140 0.1151982 0.209 0.110 0.103 0.138 0.119 0.1221983 0.275 0.131 0.118 0.189 0.173 0.1531984 0.214 0.117 0.101 0.165 0.159 0.1321985 0.206 0.120 0.106 0.164 0.150 0.1381986 0.225 0.132 0.111 0.181 0.169 0.1511987 0.209 0.134 0.109 0.178 0.182 0.1431988 0.187 0.126 0.103 0.159 0.165 0.1291989 0.181 0.125 0.098 0.156 0.147 0.1321990 0.187 0.120 0.097 0.151 0.145 0.1281991 0.245 0.132 0.103 0.177 0.172 0.1441992 0.262 0.135 0.104 0.188 0.193 0.1461993 0.265 0.136 0.105 0.198 0.214 0.1481994 0.222 0.125 0.092 0.179 0.206 0.1321995 0.248 0.131 0.096 0.198 0.207 0.1521996 0.276 0.143 0.097 0.224 0.262 0.1541997 0.263 0.149 0.102 0.218 0.252 0.1541998 0.251 0.143 0.088 0.205 0.235 0.1401999 0.302 0.146 0.084 0.225 0.265 0.1452000 0.327 0.157 0.079 0.239 0.280 0.1442001 0.345 0.175 0.090 0.243 0.273 0.1472002 0.362 0.180 0.099 0.241 0.266 0.1602003 0.380 0.200 0.126 0.256 0.289 0.1822004 0.402 0.217 0.131 0.276 0.337 0.1892005 0.324 0.227 0.131 0.276 0.332 0.1882006 0.326 0.218 0.120 0.277 0.351 0.176
during our sample period. The average cash ratio for IPO firms is 21.1% in 1980.It peaks to 40.2% in 2004, but falls to 32.6% in 2006. Though not reproduced inthe table, the median cash ratio for IPO firms triples over the sample period.When we estimate the time trend, the mean and median are significant for both
Why Do U.S. Firms Hold So Much More Cash than They Used To? 1995
IPO and non-IPO firms. This evidence shows that the increase in cash holdingswe document is not due to the capital raising activities of the IPO firms in oursample.
We next turn to the role of dividends. Fama and French (2001) show that firmshave become less likely to pay dividends during our sample period. Jensen’s(1986) free cash flow theory suggests that nondividend payers with poor growthopportunities will accumulate more cash. In columns 4 and 5 of Table II, wereproduce the time series of the average cash ratio for dividend payers andnondividend payers. The average cash ratio of dividend payers in a sampleyear is the average cash ratio of firms that pay a common dividend that year.There is a dramatic increase in the cash ratio among the nondividend pay-ers, but not among the dividend payers. For example, the average cash ratioof dividend payers is about the same in 2000 as in 1980. In contrast, the aver-age (median) cash ratio of nondividend payers is 113% (211%) higher in 2006than in 1980. Many papers consider nondividend paying firms to be finan-cially constrained (for instance, Almeida, Campello, and Weisbach (2004)), sug-gesting that the increase in cash holdings occurred in financially constrainedfirms. In light of the model of Han and Qiu (2007), our evidence on the cashholding increases of nondividend paying firms supports the precautionarymotive.
Firms with negative net income are more likely to be financially constrainedthan firms with positive net income. The existing literature shows that thecash flow sensitivity of corporate investment in cash differs for financially con-strained firms. We therefore divide the sample into firms with negative netincome and other firms. We report average cash ratios for these subsamples inthe last two columns of Table II. The firms with negative net income exhibita dramatic increase in cash holdings. The average cash ratio of these firmsalmost triples over the sample period. Firms with nonnegative net income alsoexhibit an increase in cash holdings, but the time trend is markedly lower.
The precautionary motive for cash holdings predicts that firms in industriesthat experience a large increase in idiosyncratic risk should have a greaterincrease in cash holdings than firms in industries that experience a small in-crease in idiosyncratic risk. To examine this, we divide the two-digit SIC codeindustries in our sample into industry quintiles according to their increase incash flow volatility over our sample period. We measure cash flow risk as thestandard deviation of industry cash flow to assets, computed as follows. Foreach firm-year, we compute the standard deviation of cash flow to assets forthe previous 10 years. We require at least three observations. We then aver-age the firm cash flow standard deviations each year across each two-digit SICcode. Strikingly, in recent years, more than half of the firms in the sample are inthe industries in the top quintile of the increase in idiosyncratic volatility. Fig-ure 2 shows the evolution of the average cash ratio for the five quintiles sortedaccording to the increase in idiosyncratic volatility. The firms in the highestquintile of the increase in volatility experience the most dramatic increase incash holdings. The average cash ratio of these firms is 12.9% in 1980 and in-creases to 39.0% in 2006. The clear evidence from the figure is that the increase

1996 The Journal of Finance R©
0
0.05
0.1
0.15
0.2
0.25
0.3
0.35
0.4
0.45
1980 1982 1984 1986 1988 1990 1992 1994 1996 1998 2000 2002 2004 2006
Year
cash
/ass
ets
Q1: Lowest cash flow volatility quintile Q2 Q3 Q4 Q5: Highest cash flow volatility quintile
Figure 2. Average cash ratios by idiosyncratic risk. The figure summarizes the averagecash-to-assets ratio for quintiles of industries sorted by increases in idiosyncratic risk. We firstdivide the two-digit SIC code industries in our sample into industry quintiles according to theincrease in idiosyncratic cash flow volatility over our sample period. We measure cash flow riskas the standard deviation of industry cash flow computed as follows. For each firm, we computecash flow standard deviation for the previous 10 years. We require at least three observations forthe standard deviation to be calculated. We then take the average across the two-digit SIC code ofthe firm cash flow standard deviations. The sample includes all Compustat firm-year observationsfrom 1980 to 2006 with positive values for the book value of total assets and sales revenue forfirms incorporated in the United States. Financial firms (SIC code 6000-6999) and utilities (SICcodes 4900-4999) are excluded from the sample, yielding a panel of 117,438 observations for 13,599unique firms. The cash ratio is measured as the ratio of cash and marketable securities to the bookvalue of total assets.
in cash ratios is concentrated in industries that experience a large increase incash flow volatility.
The evidence that nondividend paying firms increase their cash ratio morethan dividend paying firms is consistent with the evidence in Brown and Ka-padia (2007) that the idiosyncratic risk of newly listed firms, which are lesslikely to pay dividends, has increased over time. We investigate this possibilitydirectly by examining whether cash ratios are related to the period in which afirm went public. Following Brown and Kapadia, we construct cohorts of firmsaccording to their listing date. The 1960s cohort includes all firms that have alisting prior to 1970. The 1970 cohort includes all firms that list from 1970 to1975. We continue in this manner, constructing cohorts of firms that list withina 5-year period. We track the cash holdings of the cohorts from the 6th yearfollowing the listing year, to ensure that the cash accumulated at the IPO hasbeen used. The results shown in Figure 3 are striking. First, each successivecohort, with the exception of the 1980s cohort, has a higher average cash ra-tio than the previous cohort in the early years of its existence (in the 2000s,the 1985, 1990, and 1995 cohorts become similar). Second, while cash ratios of

Why Do U.S. Firms Hold So Much More Cash than They Used To? 1997
0
0.05
0.1
0.15
0.2
0.25
0.3
0.35
0.4
0.45
1980 1982 1984 1986 1988 1990 1992 1994 1996 1998 2000 2002 2004 2006
Year
cash
/asset
s1960s 1970s 1975s 1980s 1985s 1990s 1995s 2000s
Figure 3. Average cash ratios by an IPO cohort. The figure summarizes the average cash-to-assets ratio for cohorts of firms constructed by listing date. The 1960s cohort includes all firmsthat have a listing prior to 1970. The 1970s cohort includes all firms that list from 1970 to 1975.We then construct cohorts of firms that list within a 5-year period. Cash holdings for each firm ineach cohort are estimated beginning in the 6th year after the listing date. The sample includes allCompustat firm-year observations from 1980 to 2006 with nonmissing data for the book value oftotal assets and sales revenue for firms incorporated in the United States. Financial firms (SICcode 6000-6999) and utilities (SIC codes 4900-4999) are excluded from the sample, yielding a panelof 117,438 observations for 13,599 unique firms. The cash ratio is measured as the ratio of cashand marketable securities to the book value of total assets.
the pre-1980 cohorts first decrease before experiencing a sharp increase at theend of the sample period, the cash ratios of the other cohorts mostly increase.The later cohorts do not see a reduction in cash ratios as they mature (exceptfor the last 2 sample years), so that they hold more cash than firms in earliercohorts at the same stage of their lifecycles. Thus, a substantial part of theincrease in cash holdings can be attributed to the changing nature of newlylisted firms over time. This result is the cash counterpart of the disappearingdividend result of Fama and French (2001).
During the 1990s, an increasing proportion of newly public firms came fromhigh-tech industries. If technology firms are more reliant on precautionary cashholdings, then the above results may be due to an increase in the proportion ofhigh-tech firms in our sample. We use the definitions in Loughran and Ritter(2004) to categorize technology firms, and define “old-economy” manufacturingfirms as firms with SIC codes 2000-3999 that are not high technology firms.5
In 1980, the proportion of firms classified as high-tech was 28%. By 2000 thisproportion had increased to 45%. We find (but do not tabulate) that in everyyear the average cash ratio of high-tech firms is greater than the average cash
5 Results are quantitatively similar if we use the Department of Commerce definitions of high-tech industries.

1998 The Journal of Finance R©
ratio of manufacturing firms. In the first 5 years (1980 to 1984), the averagecash ratio of high-tech firms exceeds the average cash ratio of manufacturingfirms by 54%; in the last 5 years, it does so by 45%. Throughout the sampleperiod, the cash ratios of both types of firms increase. The average cash ratioincreases slightly less for high-tech firms than for manufacturing firms; fromthe first 5 years to the last 5 years, the increase is 90% for high-tech firms and101% for manufacturing firms. There is a positive and significant time trend forthe average and median cash ratios for both groups of firms, and both groupsexhibit a negative trend in net leverage. Consequently, while the increase incash holdings and the decrease in net leverage can be ascribed to a changein the composition of listed firms over time, this effect cannot be attributedspecifically to an increase in the proportion of technology firms in our sample.
Foley et al. (2007) note that during our sample period multinationals bene-fited from retaining the cash they earned abroad, given that earning repatria-tion would often have negative tax consequences. Toward the end of our sampleperiod, firms were allowed to repatriate cash held in foreign countries at alower tax rate. We use nonmissing foreign pretax income to identify firms forwhich avoidance of taxes on foreign income might lead to higher cash holdings.There is no evidence that cash holdings increase more for firms with foreignpretax income in our sample period. In particular, while the average cash ratioof firms without foreign taxable income increases from 14.3% in 1990 to 25.3%in 2006, the cash ratio of firms with foreign taxable income is 10.8% in 1990and increases to 20.2% in 2006.
Agency theory predicts that cash holdings will increase for firms with highfree cash flow. Our evidence on the changes in cash holdings for subsamplesof firms is largely inconsistent with the agency explanation. In particular, wefind that cash holdings increase more in firms that are financially constrained,as proxied by negative net income, than in other firms. Further, larger, moreestablished firms are more likely to have agency problems of free cash flowthat could lead to an increase in cash holdings. However, the increase in cashholdings is much more significant for smaller and recently listed firms. Wefurther investigate the agency explanation for the increase in cash ratios inSection VI.
IV. Did the Demand Function for Cash Holdings Change?
In this section, we examine whether the increase in cash holdings can beexplained by firm characteristics and whether the relation between firm char-acteristics and the cash ratio changes over time. We start from regressionsthat relate the cash ratio to firm characteristics and investigate whether suchregressions can explain the increase in cash ratios through changes in firmcharacteristics. This approach attempts to identify whether there was a regimeshift in how firms determine their cash holdings.
The literature employs several alternative definitions of the cash ratio, in-cluding (1) cash to assets, (2) cash to net assets (where net assets equals bookassets minus cash), (3) log of cash to net assets, and (4) cash to sales. Although

Why Do U.S. Firms Hold So Much More Cash than They Used To? 1999
cash to assets is the most traditional measure, OPSW use the cash-to-net as-sets ratio. The cash-to-net assets ratio generates extreme outliers for firms withmost of their assets in cash. This problem is significant for our sample. Foleyet al. (2007) use the logarithm of the cash-to-net assets ratio. Their measurereduces the magnitude of the problem of extreme outliers but does not elimi-nate it in our sample, which includes firms with assets less than $100 million.Thus, we focus primarily on regressions using cash to assets as the dependentvariable, but reproduce regressions using the log of cash to net assets. Usingcash to sales does not affect our results in a material way.
The explanatory variables that we use follow OPSW and are motivated bythe transaction and precautionary explanations for corporate cash holdingsdiscussed in Section I. We incorporate the ratio of a firm’s acquisition expensesto assets as an additional variable in the model since acquisitions and capitalexpenditures would seem to be substitutes.
The variables used (Compustat annual data items in parentheses) are asfollows:
1. Market-to-book ratio. Firms with better investment opportunities valuecash more since it is costly for these firms to be financially constrained.We use the book value of assets (#6) minus the book value of equity (#60)plus the market value of equity (#199 ∗ #25) as the numerator of the ratioand the book value of assets (#6) as the denominator.
2. Firm size. There are economies of scale to holding cash. We use as our sizemeasure the logarithm of book assets (#6) in 2004 dollars.
3. Cash flow to assets. We measure cash flow as earnings after interest, div-idends, and taxes but before depreciation divided by book assets ((#13 –#15 – #16 – #21) / #6). Firms with higher cash flow accumulate more cash,all else equal. Such firms might have better investment opportunities, butwe control for these through other variables.
4. Net working capital to assets. Net working capital (NWC) consists of assetsthat substitute for cash. We thus expect a negative relation between NWCand cash holdings. We subtract cash (#1) from NWC (#179), so our NWCmeasure is net of cash.
5. Capital expenditures to assets. We measure capital expenditures as theratio of capital expenditures (#128) to book assets (#6). If capital expen-ditures create assets that can be used as collateral, capital expenditurescould increase debt capacity and reduce the demand for cash. Further, asshown by Riddick and Whited (2009), a productivity shock that increasesinvestment can lead firms to temporarily invest more and save less cash,which would lead to a lower level of cash. At the same time, capital ex-penditures could proxy for financial distress costs and/or investment op-portunities, in which case they would be positively related to cash.
6. Leverage. We measure leverage as long-term debt (#9) plus debt in cur-rent liabilities (#34) divided by book assets (#6). If debt is sufficientlyconstraining, firms will use cash to reduce leverage, resulting in a nega-tive relation between cash holdings and leverage. The hedging argument

2000 The Journal of Finance R©
of Acharya, Almeida, and Campello (2007), however, is consistent with apositive relation between leverage and cash holdings.
7. Industry cash flow risk. We expect firms with greater cash flow risk (mea-sured as discussed in Section III) to hold more precautionary cash.
8. Dividend payout dummy. We define a dummy variable equal to one inyears in which a firm pays a common dividend (#21). Otherwise, thedummy equals zero. Firms that pay dividends are likely to be less riskyand have greater access to capital markets, so the precautionary motivefor cash holdings is weaker for them.
9. R&D to sales. This variable also measures growth opportunities. Firmswith greater R&D are assumed to have greater costs of financial distress.R&D expenditures consume cash, but R&D’s role as a proxy for growthopportunities and financial distress could lead to a positive relation be-tween the cash ratio and R&D spending. R&D is measured as R&D (#46)/ sales (#12), and is set equal to zero when R&D (#46) is missing. Resultsare similar if we use R&D/assets.
10. Acquisitions to assets. Acquisition activity is defined as acquisitions (#129)/ book assets (#6), where acquisition expenditures reflect only the cashoutflows associated with acquisitions. We would expect the sign on thiscoefficient to be the same as the sign for capital expenditures.
Data requirements limit the size of our sample. For example, the unrestrictedsample has 3,297 observations in 2006, but only 2,735 observations have suffi-cient data to estimate the OPSW regressions. The sample that meets the datarequirements has an increase in the average cash ratio of 112.0% over thesample period, close to the increase of 121.3% for the unrestricted sample. Out-liers in firm-year explanatory variables are winsorized as follows: Leverage iswinsorized so that it is between zero and one. R&D/assets, R&D/sales, acquisi-tions/assets, cash flow volatility, and capital expenditures/assets are winsorizedat the 1% level. The bottom tails of NWC/assets and cash flow/assets are win-sorized at the 1% level, and the top tail of the market-to-book ratio is winsorizedat the 1% level.
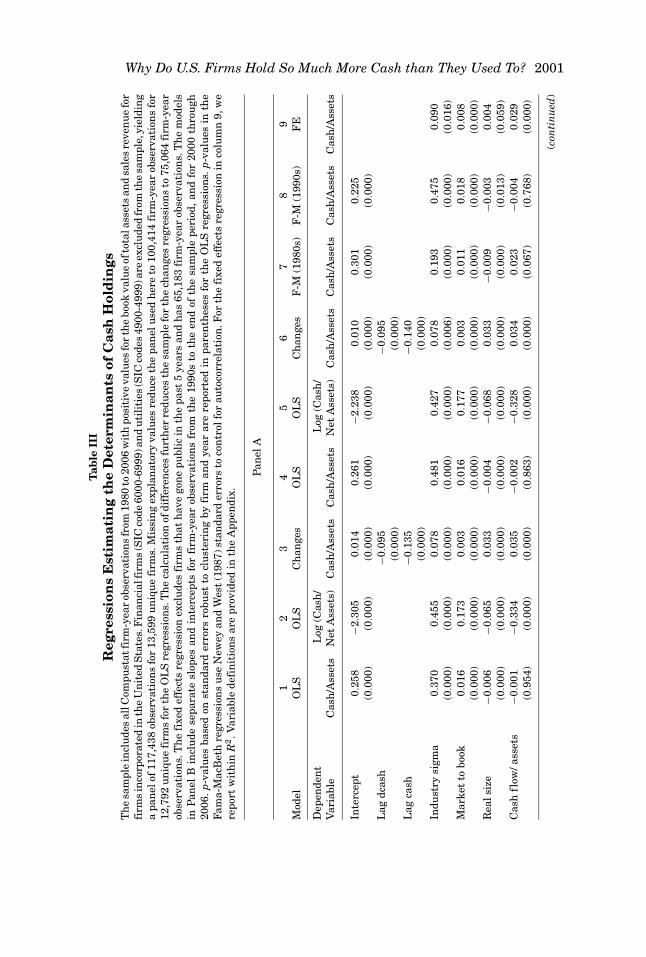
We report our initial regression results in Panel A of Table III. Our standarderrors allow for clustering by firm and by year, using the procedure in Cameron,Gelbach, and Miller (2006). Model 1 of Panel A shows the estimates for theregression using all sample years. Given our data restrictions, the panel consistsof 100,414 firm-year observations for 12,792 unique firms. We do not use dummyvariables for years or for industries in this regression. Market to book andcash flow risk (industry sigma) have positive and significant coefficients. Thesign and significance of the coefficients on size, NWC, leverage, R&D, and thedividend dummy are also similar to those documented in OPSW (whose sampleends in 1994). Capital and acquisition expenditures both have negative andsignificant coefficients.
The sign on capital expenditures is sensitive to whether the dependent vari-able is the ratio of cash to assets or the log of the ratio of cash to net assets. Model2 of Table III re-estimates Model 1 using the log of cash to net assets. In this
Why Do U.S. Firms Hold So Much More Cash than They Used To? 2001
Tab
leII
IR
egre
ssio
ns
Est
imat
ing
the
Det
erm
inan
tsof
Cas
hH
old
ings
Th
esa
mpl
ein
clu
des
allC
ompu
stat
firm
-yea
rob
serv
atio
ns
from
1980
to20
06w
ith
posi
tive
valu
esfo
rth
ebo
okva
lue
ofto
tala
sset
san
dsa
les
reve
nu
efo
rfi
rms
inco
rpor
ated
inth
eU
nit
edS
tate
s.F
inan
cial
firm
s(S
ICco
de60
00-6
999)
and
uti
liti
es(S
ICco
des
4900
-499
9)ar
eex
clu
ded
from
the
sam
ple,
yiel
din
ga
pan
elof
117,
438
obse
rvat
ion
sfo
r13
,599
un
iqu
efi
rms.
Mis
sin
gex
plan
ator
yva
lues
redu
ceth
epa
nel
use
dh
ere
to10
0,41
4fi
rm-y
ear
obse
rvat
ion
sfo
r12
,792
un
iqu
efi
rms
for
the
OL
Sre
gres
sion
s.T
he
calc
ula
tion
ofdi
ffer
ence
sfu
rth
erre
duce
sth
esa
mpl
efo
rth
ech
ange
sre
gres
sion
sto
75,0
64fi
rm-y
ear
obse
rvat
ion
s.T
he
fixe
def
fect
sre
gres
sion
excl
ude
sfi
rms
that
hav
ego
ne
publ
icin
the
past
5ye
ars
and
has
65,1
83fi
rm-y
ear
obse
rvat
ion
s.T
he
mod
els
inP
anel
Bin
clu
dese
para
tesl
opes
and
inte
rcep
tsfo
rfi
rm-y
ear
obse
rvat
ion
sfr
omth
e19
90s
toth
een
dof
the
sam
ple
peri
od,
and
for
2000
thro
ugh
2006
.p-v
alu
esba
sed
onst
anda
rder
rors
robu
stto
clu
ster
ing
byfi
rman
dye
arar
ere
port
edin
pare
nth
eses
for
the
OL
Sre
gres
sion
s.p-
valu
esin
the
Fam
a-M
acB
eth
regr
essi
ons
use
New
eyan
dW
est
(198
7)st
anda
rder
rors
toco
ntr
olfo
rau
toco
rrel
atio
n.F
orth
efi
xed
effe
cts
regr
essi
onin
colu
mn
9,w
ere
port
wit
hin
R2.V
aria
ble
defi
nit
ion
sar
epr
ovid
edin
the
App
endi
x.
Pan
elA
12
34
56
78
9M
odel
OL
SO
LS
Ch
ange
sO
LS
OL
SC
han
ges
F-M
(198
0s)
F-M
(199
0s)
FE
Dep
ende
nt
Log
(Cas
h/
Log
(Cas
h/
Var
iabl
eC
ash
/Ass
ets
Net
Ass
ets)
Cas
h/A
sset
sC
ash
/Ass
ets
Net
Ass
ets)
Cas
h/A
sset
sC
ash
/Ass
ets
Cas
h/A
sset
sC
ash
/Ass
ets
Inte
rcep
t0.
258
−2.3
050.
014
0.26
1−2
.238
0.01
00.
301
0.22
5(0
.000
)(0
.000
)(0
.000
)(0
.000
)(0
.000
)(0
.000
)(0
.000
)(0
.000
)L
agdc
ash
−0.0
95−0
.095
(0.0
00)
(0.0
00)
Lag
cash
−0.1
35−0
.140
(0.0
00)
(0.0
00)
Indu
stry
sigm
a0.
370
0.45
50.
078
0.48
10.
427
0.07
80.
193
0.47
50.
090
(0.0
00)
(0.0
00)
(0.0
00)
(0.0
00)
(0.0
00)
(0.0
06)
(0.0
00)
(0.0
00)
(0.0
16)
Mar
ket
tobo
ok0.
016
0.17
30.
003
0.01
60.
177
0.00
30.
011
0.01
80.
008
(0.0
00)
(0.0
00)
(0.0
00)
(0.0
00)
(0.0
00)
(0.0
00)
(0.0
00)
(0.0
00)
(0.0
00)
Rea
lsiz
e−0
.006
−0.0
650.
033
−0.0
04−0
.068
0.03
3−0
.009
−0.0
030.
004
(0.0
00)
(0.0
00)
(0.0
00)
(0.0
00)
(0.0
00)
(0.0
00)
(0.0
00)
(0.0
13)
(0.0
59)
Cas
hfl
ow/a
sset
s−0
.001
−0.3
340.
035
−0.0
02−0
.328
0.03
40.
023
−0.0
040.
029
(0.9
54)
(0.0
00)
(0.0
00)
(0.8
63)
(0.0
00)
(0.0
00)
(0.0
67)
(0.7
68)
(0.0
00)
(con
tin
ued
)

2002 The Journal of Finance R©
Tab
leII
I—C
onti
nu
ed
Pan
elA
12
34
56
78
9M
odel
OL
SO
LS
Ch
ange
sO
LS
OL
SC
han
ges
F-M
(198
0s)
F-M
(199
0s)
FE
Dep
ende
nt
Log
(Cas
h/
Log
(Cas
h/
Var
iabl
eC
ash
/Ass
ets
Net
Ass
ets)
Cas
h/A
sset
sC
ash
/Ass
ets
Net
Ass
ets)
Cas
h/A
sset
sC
ash
/Ass
ets
Cas
h/A
sset
sC
ash
/Ass
ets
NW
C/a
sset
s−0
.195
−0.5
52−0
.140
−0.2
00−0
.533
−0.1
39−0
.206
−0.2
02−0
.180
(0.0
00)
(0.0
00)
(0.0
00)
(0.0
00)
(0.0
00)
(0.0
00)
(0.0
00)
(0.0
00)
(0.0
00)
Cap
ex−0
.291
1.35
3−0
.179
−0.3
081.
380
−0.1
79−0
.263
−0.3
80−0
.243
(0.0
00)
(0.0
00)
(0.0
00)
(0.0
00)
(0.0
00)
(0.0
00)
(0.0
00)
(0.0
00)
(0.0
00)
Lev
erag
e−0
.364
−1.3
95−0
.188
−0.3
66−1
.395
−0.1
86−0
.364
−0.3
61−0
.234
(0.0
00)
(0.0
00)
(0.0
00)
(0.0
00)
(0.0
00)
(0.0
00)
(0.0
00)
(0.0
00)
(0.0
00)
R&
D/s
ales
0.06
60.
305
0.01
00.
065
0.30
80.
010
0.05
90.
064
0.01
9(0
.000
)(0
.000
)(0
.000
)(0
.000
)(0
.000
)(0
.000
)(0
.000
)(0
.000
)(0
.000
)D
ivid
end
dum
my
−0.0
40−0
.270
0.00
6−0
.045
−0.2
740.
005
−0.0
32−0
.054
0.00
1(0
.000
)(0
.000
)(0
.006
)(0
.000
)(0
.000
)(0
.006
)(0
.000
)(0
.000
)(0
.683
)A
cqu
isit
ion
acti
vity
−0.1
71−0
.486
−0.1
33−0
.170
−0.4
46−0
.132
−0.0
93−0
.215
−0.1
30(0
.000
)(0
.000
)(0
.001
)(0
.000
)(0
.000
)(0
.002
)(0
.000
)(0
.000
)(0
.000
)19
90s
dum
my
−0.0
28−0
.178
−0.0
00(0
.000
)(0
.000
)(0
.006
)20
00s
dum
my
−0.0
080.
261
0.01
5(0
.000
)(0
.000
)(0
.000
)Ye
ardu
mm
ies
Yes
Adj
ust
edR
20.
455
0.24
80.
199
0.45
90.
251
0.20
30.
357
0.48
80.
154

Why Do U.S. Firms Hold So Much More Cash than They Used To? 2003
Pan
elB
12
3M
odel
Cas
h/A
sset
sC
ash
/Ass
ets
Log
(Cas
h/N
etA
sset
s)
Dep
ende
nt
Inte
ract
ion
Inte
ract
ion
Inte
ract
ion
Inte
ract
ion
Inte
ract
ion
Inte
ract
ion
Var
iabl
eE
stim
ate
1990
s20
00s
Est
imat
e19
90s
2000
sE
stim
ate
1990
s20
00s
Inte
rcep
t0.
306
−0.0
73−0
.034
0.28
4−0
.068
−0.0
16−1
.990
−0.0
92−0
.251
(0.0
00)
(0.0
00)
(0.0
10)
(0.0
00)
(0.0
00)
(0.2
03)
(0.0
00)
(0.3
78)
(0.0
58)
Indu
stry
sigm
a0.
142
0.34
00.
022
0.22
20.
272
−0.0
190.
151
0.23
80.
127
(0.0
57)
(0.0
00)
(0.7
21)
(0.0
00)
(0.0
00)
(0.7
53)
(0.0
10)
(0.0
04)
(0.0
95)
Mar
ket
tobo
ok0.
011
0.00
70.
000
0.00
50.
006
0.00
40.
088
0.08
40.
020
(0.0
00)
(0.0
00)
(0.9
83)
(0.0
00)
(0.0
00)
(0.0
07)
(0.0
00)
(0.0
00)
(0.2
39)
Rea
lsiz
e−0
.009
0.00
50.
005
−0.0
090.
005
0.00
3−0
.076
−0.0
340.
062
(0.0
00)
(0.0
00)
(0.0
09)
(0.0
00)
(0.0
00)
(0.0
30)
(0.0
00)
(0.0
15)
(0.0
00)
Cas
hfl
ow/a
sset
s0.
024
−0.0
18−0
.041
0.06
60.
014
−0.0
73−0
.377
0.09
4−0
.057
(0.0
62)
(0.2
72)
(0.0
25)
(0.0
00)
(0.4
99)
(0.0
02)
(0.0
00)
(0.2
45)
(0.3
69)
NW
C/a
sset
s−0
.204
−0.0
060.
034
−0.2
360.
016
0.04
0−0
.466
−0.2
950.
134
(0.0
00)
(0.6
60)
(0.0
48)
(0.0
00)
(0.3
30)
(0.0
24)
(0.0
00)
(0.0
15)
(0.2
77)
Cap
ex−0
.255
−0.0
71−0
.079
−0.3
78−0
.067
−0.0
430.
870
0.33
8−0
.048
(0.0
00)
(0.0
04)
(0.1
23)
(0.0
00)
(0.0
44)
(0.4
07)
(0.0
00)
(006
6)(0
.932
)L
ever
age
−0.3
700.
001
0.01
3−0
.370
0.00
10.
013
−1.4
43−0
.164
0.52
7(0
.000
)(0
.965
)(0
.449
)(0
.000
)(0
.965
)(0
.449
)(0
.000
)(0
.293
)(0
.000
)R
&D
/sal
es0.
061
0.00
30.
001
0.05
20.
004
0.00
50.
277
0.02
3−0
.018
(0.0
00)
(0.5
85)
(0.8
34)
(0.0
00)
(0.3
64)
(0.0
83)
(0.0
00)
(0.5
33)
(0.5
93)
Div
iden
ddu
mm
y−0
.035
−0.0
13−0
.015
−0.0
16−0
.016
−0.0
23−0
.054
−0.2
30−0
.271
(0.0
00)
(0.0
16)
(0.0
07)
(0.0
00)
(0.0
03)
(0.0
00)
(0.4
13)
(0.0
01)
(0.0
00)
(con
tin
ued
)

2004 The Journal of Finance R©
Tab
leII
I—C
onti
nu
ed
Pan
elB
12
3M
odel
Cas
h/A
sset
sC
ash
/Ass
ets
Log
(Cas
h/N
etA
sset
s)
Dep
ende
nt
Inte
ract
ion
Inte
ract
ion
Inte
ract
ion
Inte
ract
ion
Inte
ract
ion
Inte
ract
ion
Var
iabl
eE
stim
ate
1990
s20
00s
Est
imat
e19
90s
2000
sE
stim
ate
1990
s20
00s
Acq
uis
itio
nac
tivi
ty−0
.076
−0.1
05−0
.081
−0.2
19−0
.149
0.02
0−0
.335
−0.7
540.
546
(0.0
00)
(0.0
00)
(0.0
00)
(0.0
00)
(0.0
00)
(0.5
72)
(0.0
31)
(0.0
00)
(0.0
50)
Net
equ
ity
issu
ance
0.12
90.
022
−0.0
800.
260
0.00
0−0
.518
(0.0
00)
(0.2
52)
(0.0
50)
(0.0
07)
(1.0
00)
(0.0
52)
Net
debt
issu
ance
0.17
30.
023
−0.0
700.
298
−0.0
23−0
.260
(0.0
00)
(0.4
60)
(0.0
28)
(0.0
24)
(0.8
98)
(0.0
76)
Los
sdu
mm
y0.
002
−0.2
13(0
.684
)(0
.000
)T-
bill
−0.0
00−0
.035
(0.7
76)
(0.0
01)
Cre
dit
spre
ad0.
009
0.14
5(0
.087
)(0
.056
)IP
O1
0.08
00.
736
(0.0
00)
(0.0
00)
IPO
20.
065
0.32
8(0
.000
)(0
.000
)IP
O3
0.04
20.
246
(0.0
00)
(0.0
00)
IPO
40.
027
0.18
9(0
.000
)(0
.006
)IP
O5
0.02
60.
171
(0.0
00)
(0.0
03)
Adj
ust
edR
20.
462
0.50
60.
274
Why Do U.S. Firms Hold So Much More Cash than They Used To? 2005
specification, the coefficient on capital expenditures switches signs but remainssignificant. Model 2 has a substantially lower R2 than Model 1, indicating thatModel 1 explains variation in cash holdings much better. Similar variation isobserved in the literature, including Haushalter, Klasa, and Maxwell (2007)and Harford, Mansi, and Maxwell (2008). The coefficient on capital expendi-tures is insignificant in the Fama-MacBeth regressions in OPSW, but positiveand significant in their pooled regressions, which do not control for clusteringlike we do.
Model 3 re-estimates Model 1 using changes in the variables rather than lev-els. This approach eliminates the impact of constant unobservable firm charac-teristics on cash holdings. In this specification, we include the lagged change incash and the lagged level of cash to allow for partial adjustment of the cash ratioto the equilibrium level. The coefficients on the modeled factors yield slightlydifferent results in sign and significance in comparison to those obtained inModel 1, including positive and significant coefficients on firm size, cash flow,and the dividend dummy. These factors are either negative or insignificant inModel 1. These differences may be due to changes in the influence of firm char-acteristics on cash holdings over time. We consider this when discussing theresults in Panel B of Table III.
We next investigate whether the intercepts of the models change over time,identifying an increase in the cash ratio not explained by changes in modeledfirm characteristics. We add two indicator variables to the models allowing forintercept shifts in the 1990s and the 2000s. In Model 4 both dummy variableshave negative and significant coefficients, suggesting that changes in firm char-acteristics lead to higher cash ratios than those actually observed in the 1990sand 2000s. Model 5 re-estimates Model 2 with the dummy variables. In thisspecification, the dummy variable for the 1990s is significantly negative butthe dummy variable for the 2000s is significantly positive. The intercept forthe 2000s is higher than for the 1980s or the 1990s. This evidence is consistentwith an increase in cash holdings in the 2000s that cannot be explained bychanges in firm characteristics. Model 6 re-estimates Model 3 with the dummyvariables and leads to the same conclusion as Model 5.
It is possible that the intercepts do not change over time but the slopes do, aswould be the case if the relation between firm characteristics and the cash ra-tio changes over time. To consider this possibility, we estimate Fama-MacBethregressions for two different subperiods—the 1980s and the remainder of oursample period. These regressions are summarized in Models 7 and 8, respec-tively. The coefficient estimates for both periods are consistent with those ofthe pooled regression of Model 1. Further, the intercept is higher in the 1980srelative to the latter half of the sample period.
Finally, we consider specifications with fixed effects. First, we estimate Model1 with industry fixed effects. With industry fixed effects, the coefficient on theindustry risk measure is 0.374 and significant at the 1% level (regression notreported). Second, we examine a regression specification using firm and yearfixed effects. In this specification (not reported), industry risk has a negativeand significant coefficient, a result attributable to firms in the sample that

2006 The Journal of Finance R©
recently went public. If we require each firm to have been public for 5 years,industry risk has a positive and significant coefficient, as shown in Model 9,but the magnitude of the coefficient is smaller than in the comparable Model 1.We report the R2 computed for changes within firms.
Though we do not report the results in the table, we also explore the sensitiv-ity of our results to alternate measures of risk. First, we use (1) an industry-levelmeasure estimated over 5 years, (2) a value-weighted average measure, and (3)a median measure, and find similar results to those reported in Table III. Wethen use a firm-level measure. With the firm-level measure, we have fewerobservations since we require that the firm exists for 5 years to estimate thisrisk measure. We again find similar results, but the coefficient on cash flowrisk is 0.10, substantially lower than the coefficient on industry risk in Model1. This result is not unexpected since industry cash flow risk is estimated moreprecisely than firm cash flow risk, and because requiring 5 years of firm-leveldata tilts our sample toward more established firms.
We perform a series of additional analyses that are unreported in Panel A ofTable III. First, we are concerned that normalizing NWC by total assets mightlead to biases in our regressions since a firm with more cash than another, other-wise identical, firm would have a lower cash ratio yielding a negative coefficientin the regression. Thus, we re-estimate our regressions using NWC divided bynet total assets, that is, total assets minus cash. Our results are unchangedusing this alternative measure of NWC. To check whether foreign income canexplain the increase in the cash ratio, we add the ratio foreign income to to-tal assets to our regressions. The coefficient on foreign income is significantlynegative, but this result is caused by large outliers. When we winsorize foreignincome to total assets at the 1% level, the coefficient on foreign income is notsignificantly different from zero. A concern is that leverage and NWC respondto the same variables as cash holdings. We re-estimate regression (1) exclud-ing leverage and NWC. When we do so, the coefficient on idiosyncratic riskalmost doubles. It could also be the case that firms substituted lines of creditfor cash holdings. To investigate whether this possibility could help explain ourresults, we use a sample of firms for which lines of credit data are availableand re-estimate regression (1) adding a firm’s lines of credit as an explanatoryvariable.6 As expected, the lines of credit variable has a significant negativecoefficient. However, the other coefficients in the regression are not affected.Finally, data on goodwill are available from Compustat beginning in 1988. Weinvestigate whether normalizing by tangible assets rather than total assets af-fects our results. We obtain coefficient estimates that are closer to Model 8, theFama-McBeth regression for the sample after 1990, than to Model 1. This isnot surprising since the sample for the regression with assets net of goodwillstarts in 1988.
In summary, Panel A of Table III shows that the relation between cash hold-ings and firm characteristics is generally consistent across the models we esti-mate, with the exception of the coefficient on capital expenditures which varieswith the construction of the cash ratio. We incorporate indicator variables
6 We thank Amir Sufi for allowing us to use his data on corporate lines of credit.

Why Do U.S. Firms Hold So Much More Cash than They Used To? 2007
allowing the intercept to change in the 1990s and the 2000s, and find no in-crease in the intercept in the 1990s. The intercept in the 2000s is no greaterthan in the 1980s for Model 4, but it is for Models 5 and 6. Consequently, Models5 and 6 do not allow us to exclude the possibility that a regime shift explainsthe higher cash holdings of the 2000s.
Differences in the intercepts could result from changes in the relation be-tween cash holdings and firm characteristics. To evaluate whether this is thecase, we estimate models in Panel B of Table III that allow for changes in boththe intercept and slope coefficients. Model 1 of Panel B replicates Model 1 ofPanel A, but with indicator variables for the 1990s and 2000s that interactwith all independent variables. Adding these indicator variables increases theadjusted R2 by less than 1%. In general, the absolute value of a coefficient in-creases over time (i.e., the interactions are of the same sign as the coefficient forthe whole sample period). When the absolute value of a coefficient does not in-crease, the changes are typically small. For all but two variables, the sign of thecoefficient is the same for each subperiod. The exceptions are the coefficientson cash flow and size. In Model 1 of Panel A, the coefficient on cash flow isinsignificant. In Model 1 of Panel B, the coefficient is positive and significant inthe 1980s, but switches to negative and significant in the 2000s (p-value froman F-test = 0.000). For size, the coefficient is negative and significant in the1980s and 1990s, but becomes trivially positive in the 2000s (p-value from anF-test = 0.551). The negative relation between cash holdings and firm size isconsistent with models of a transaction demand for cash. This relation appearsto disappear in the 2000s. A possible explanation is that the cash holdings inthe 2000s reflect agency problems, so that large firms hold cash that is notjustified by transaction models. We explore the agency explanation in detail inSection VI. In general, the sign on the relation between cash holdings and firmcharacteristics does not change during our sample period, but the strength ofthe relation does change for some variables. The most striking change is theincrease in the coefficient on cash flow risk in the 1990s.
We introduce several additional control variables in Model 2 of Panel B thatwere not incorporated in the OPSW model. We control for equity and debtissues, as well as proximity to an IPO. Since capital raising tends to be lumpy,firms should have more cash immediately after raising capital and cash shoulddecrease as they spend the capital raised. We define net debt issuance as debtissuance (data item #111) minus debt retirement (data item #114), divided bybook assets (data item #6). Net equity issuance is calculated as equity sales(data item #108) minus equity purchases (data item #115), divided by bookassets. Since Section III shows that firms with negative net income have morecash, we also add a dummy variable equal to one for firms reporting a loss.Finally, we add the T-bill yield and a credit spread measure. The T-bill yield isthe average annual 3-month rate published by the Federal Reserve. The creditspread is the difference between the AAA and BBB yields, also reported by theFederal Reserve. In models of the transaction demand for cash, a decrease in therisk-free rate decreases the opportunity cost of cash, so that we would expect apositive coefficient on the T-bill yield. An increase in credit spread would implyan increase in default risk and in the precautionary demand for cash. Adding

2008 The Journal of Finance R©
all of these variables increases the adjusted R2 by roughly 5 percentage points.As expected, IPO firms hold more cash and the cash ratio falls as the IPO getsmore distant.7 Also, firms that issue more equity or more debt have more cash,while the coefficient on the accounting loss indicator variable is insignificant.Taking into account these additional firm-specific variables has no meaningfulimpact on the intercepts for the 1990s and 2000s; they remain negative andsignificant. T-bill yields are uncorrelated with cash holdings, but the creditspread variable is positive and significant at the 10% level. Our conclusionsabout changes over time in the other coefficients discussed in relation to Model1 of Panel B are unchanged.
The third model reported in Panel B uses the log of the ratio of cash to netassets as the dependent variable. In Model 5 of Panel A, the coefficient on theintercept for the 2000s was positive, suggesting an upward shift in the demandfor cash not explained by changes in firm characteristics. This result no longerholds when we allow for shifts in slopes. Both indicator variables are negative,but neither is significant at the 5% level. One noticeable difference betweenModel 3 and Model 2 of Panel B is that the T-bill rate has a negative andsignificant coefficient in Model 3 but is not significant in Model 2.8
In an unreported regression, we replicate Model 3 of Panel A (the changesregression) with dummy variables for the 1990s and 2000s and their corre-sponding interaction terms. The model has six additional variables comparedto the models reported in Panel B, namely the lagged change in the cash ratio,the lagged level of the cash ratio, and their respective interaction terms. The re-sults from this model are consistent with the results in Model 6 of Panel A. Theintercept decreases in the 1990s and then increases in the 2000s, so that in the2000s it is the same as in the 1980s. Consequently, an increase in the interceptcannot explain the high cash ratios in the 2000s compared to the 1980s.
There are several important findings from the regressions in Table III. First,the models in Panel B suggest that cash holdings were lower than expected inthe 1990s. None of the evidence in Panel B indicates that, given their charac-teristics, firms had higher than expected cash holdings in the 2000s since theinteractions for the intercepts are negative. Second, allowing for time variationin the coefficients adds little to the explanatory power of the regressions. Third,the negative relation between cash holdings and firm size breaks down in the2000s.
We perform an additional evaluation of changes in intercepts and slopes thatis not reproduced in Table III. We estimate Model 1 of Panel A cross-sectionallyfor each year. This approach confirms the results of the regressions in Table III.In particular, the intercept of the regression falls over time. Interestingly, theexplanatory variables explain more of the cross-sectional distribution of cash
7 In unreported specifications we find that the correlation between cash and a firm’s temporaldistance from the IPO year is insignificant beyond the sixth year.
8 In addition, the loss indicator variable is negative and significant in this specification. Thissurprising result is due to the high negative correlation of the loss dummy with size and with cashflow to assets. If these two variables are removed from the regression, the loss indicator variablehas a positive and significant coefficient.

Why Do U.S. Firms Hold So Much More Cash than They Used To? 2009
holdings in recent years. The evolution of two coefficients is particularly inter-esting: The cash flow risk coefficient tends to be insignificant in the early yearsof the sample, while the firm size coefficient switches from negative and signif-icant in the 1980s and 1990s to positive and significant in the early 2000s. Thelatter result most likely reflects the increase in cash holdings of large firmsstarting in 2000.
V. Why Did the Cash Ratio Increase?
Section IV shows that changes in firm characteristics are the major reasonwhy cash holdings increase. In this section, we attribute the increase in cashholdings to changes in specific firm characteristics. We proceed in three steps.First, we estimate a modified version of the OPSW model for the 1980s usingFama-MacBeth regressions, the coefficients of which are the average coeffi-cients from annual cross-sectional regressions estimated over the period 1980to 1989. In contrast to the models estimated in Panel A of Table III, this model(reported in the legend of Table IV) takes into account net equity and net debtissues. Second, we compute how actual cash holdings in the 1990s and 2000sdiffer from cash holdings predicted by that model. Finally, we attribute theincrease in predicted cash holdings to changes in firm characteristics.
Column 2 of Table IV reports the predicted cash ratios for the whole sample.The difference between the actual and predicted cash ratios is shown in column3 and the t-statistic for the difference is shown in column 4. The actual averagecash ratios are not reproduced but are equal to the sum of columns 2 and 3.For example, in 2004, the difference between the predicted and actual cashratios is 0.7% with a t-statistic of 2.27. The model consistently overpredictscash holdings in the 1990s. For the 2000s, the difference between actual andpredicted cash holdings is significantly greater than zero in the last 3 yearsof the sample; however, the differences are proportionately small. The highestdifference is in 2006, when the model underpredicts cash holdings by 4.8%, orroughly 1% of assets.
The next three columns of Table IV examine firms in the S&P 500 index.The cash holdings model estimated in the 1980s overpredicts cash holdings ofS&P 500 firms in the 1990s and 2000s. The unexpected cash holdings are notsignificantly different from zero in 2002 through 2004, but actual holdings areless than predicted in 2005 and 2006. The unexpected cash holdings of the S&P500 subsample average to −1.3% of assets over the last 3 years of our sample,compared to 1.1% for non-S&P 500 firms.
Columns 8 and 11 of Table IV show the predicted average cash ratios for firmsthat do and do not pay a common dividend, respectively, while columns 9 and12 show the difference between actual and predicted. The model predicts anincrease in the average cash ratio of 42.6% from 1990 to 2006 for nondividendpayers, but an increase of only 24.3% for dividend payers. The actual increase inthe cash ratio for dividend payers is less than predicted throughout the sampleperiod. In contrast, the increase in cash holdings for nondividend payers ishigher than predicted in the latter half of the sample period. The maximumerror of the model for this subsample is 2.4% of assets in absolute value.
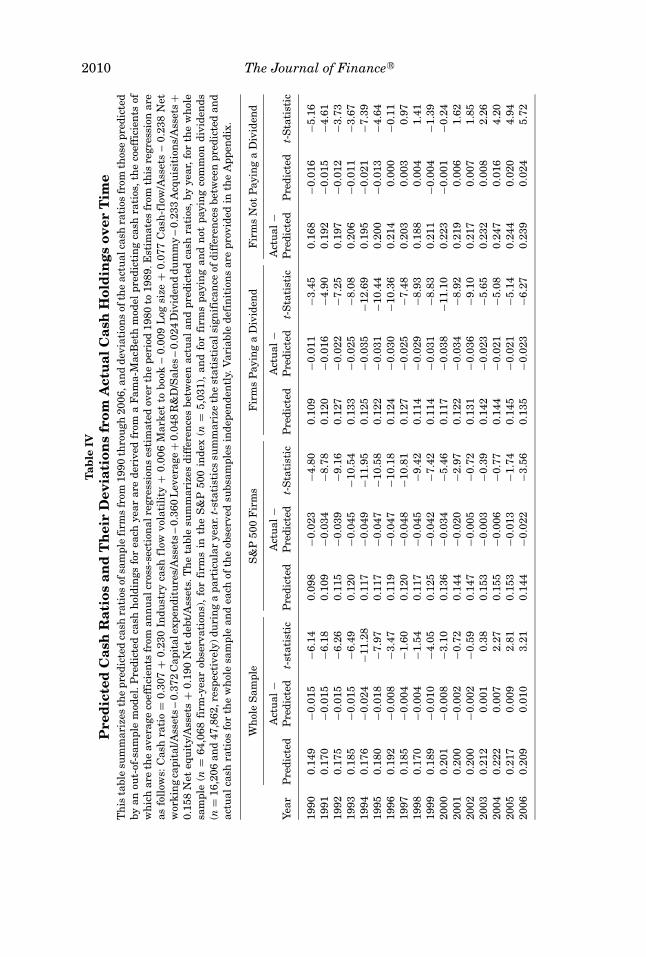
2010 The Journal of Finance R©
Tab
leIV
Pre
dic
ted
Cas
hR
atio
san
dT
hei
rD
evia
tion
sfr
omA
ctu
alC
ash
Hol
din
gsov
erT
ime
Th
ista
ble
sum
mar
izes
the
pred
icte
dca
shra
tios
ofsa
mpl
efi
rms
from
1990
thro
ugh
2006
,an
dde
viat
ion
sof
the
actu
alca
shra
tios
from
thos
epr
edic
ted
byan
out-
of-s
ampl
em
odel
.Pre
dict
edca
shh
oldi
ngs
for
each
year
are
deri
ved
from
aFa
ma-
Mac
Bet
hm
odel
pred
icti
ng
cash
rati
os,t
he
coef
fici
ents
ofw
hic
har
eth
eav
erag
eco
effi
cien
tsfr
oman
nu
alcr
oss-
sect
ion
alre
gres
sion
ses
tim
ated
over
the
peri
od19
80to
1989
.Est
imat
esfr
omth
isre
gres
sion
are
asfo
llow
s:C
ash
rati
o=
0.30
7+
0.23
0In
dust
ryca
shfl
owvo
lati
lity
+0.
006
Mar
ket
tobo
ok–
0.00
9L
ogsi
ze+
0.07
7C
ash
-flo
w/A
sset
s–
0.23
8N
etw
orki
ng
capi
tal/A
sset
s–
0.37
2C
apit
alex
pen
ditu
res/
Ass
ets
–0.
360
Lev
erag
e+
0.04
8R
&D
/Sal
es–
0.02
4D
ivid
end
dum
my
–0.
233
Acq
uis
itio
ns/
Ass
ets+
0.15
8N
eteq
uit
y/A
sset
s+
0.19
0N
etde
bt/A
sset
s.T
he
tabl
esu
mm
ariz
esdi
ffer
ence
sbe
twee
nac
tual
and
pred
icte
dca
shra
tios
,by
year
,for
the
wh
ole
sam
ple
(n=
64,0
68fi
rm-y
ear
obse
rvat
ion
s),
for
firm
sin
the
S&
P50
0in
dex
(n=
5,03
1),
and
for
firm
spa
yin
gan
dn
otpa
yin
gco
mm
ondi
vide
nds
(n=
16,2
06an
d47
,862
,res
pect
ivel
y)du
rin
ga
part
icu
lar
year
.t-s
tati
stic
ssu
mm
ariz
eth
est
atis
tica
lsig
nif
ican
ceof
diff
eren
ces
betw
een
pred
icte
dan
dac
tual
cash
rati
osfo
rth
ew
hol
esa
mpl
ean
dea
chof
the
obse
rved
subs
ampl
esin
depe
nde
ntl
y.V
aria
ble
defi
nit
ion
sar
epr
ovid
edin
the
App
endi
x.
Wh
ole
Sam
ple
S&
P50
0F
irm
sF
irm
sP
ayin
ga
Div
iden
dF
irm
sN
otP
ayin
ga
Div
iden
d
Act
ual
−A
ctu
al−
Act
ual
−A
ctu
al−
Year
Pre
dict
edP
redi
cted
t-st
atis
tic
Pre
dict
edP
redi
cted
t-S
tati
stic
Pre
dict
edP
redi
cted
t-S
tati
stic
Pre
dict
edP
redi
cted
t-S
tati
stic
1990
0.14
9−0
.015
−6.1
40.
098
−0.0
23−4
.80
0.10
9−0
.011
−3.4
50.
168
−0.0
16−5
.16
1991
0.17
0−0
.015
−6.1
80.
109
−0.0
34−8
.78
0.12
0−0
.016
−4.9
00.
192
−0.0
15−4
.61
1992
0.17
5−0
.015
−6.2
60.
115
−0.0
39−9
.16
0.12
7−0
.022
−7.2
50.
197
−0.0
12−3
.73
1993
0.18
5−0
.015
−6.4
90.
120
−0.0
45−1
0.54
0.13
3−0
.025
−8.0
80.
206
−0.0
11−3
.67
1994
0.17
6−0
.024
−11.
280.
117
−0.0
49−1
1.95
0.12
5−0
.035
−12.
690.
195
−0.0
21−7
.39
1995
0.18
0−0
.018
−7.9
70.
117
−0.0
47−1
0.58
0.12
2−0
.031
−10.
440.
200
−0.0
13−4
.64
1996
0.19
2−0
.008
−3.4
70.
119
−0.0
47−1
0.18
0.12
4−0
.030
−10.
360.
214
0.00
0−0
.11
1997
0.18
5−0
.004
−1.6
00.
120
−0.0
48−1
0.81
0.12
7−0
.025
−7.4
80.
203
0.00
30.
9719
980.
170
−0.0
04−1
.54
0.11
7−0
.045
−9.4
20.
114
−0.0
29−8
.93
0.18
80.
004
1.41
1999
0.18
9−0
.010
−4.0
50.
125
−0.0
42−7
.42
0.11
4−0
.031
−8.8
30.
211
−0.0
04−1
.39
2000
0.20
1−0
.008
−3.1
00.
136
−0.0
34−5
.46
0.11
7−0
.038
−11.
100.
223
−0.0
01−0
.24
2001
0.20
0−0
.002
−0.7
20.
144
−0.0
20−2
.97
0.12
2−0
.034
−8.9
20.
219
0.00
61.
6220
020.
200
−0.0
02−0
.59
0.14
7−0
.005
−0.7
20.
131
−0.0
36−9
.10
0.21
70.
007
1.85
2003
0.21
20.
001
0.38
0.15
3−0
.003
−0.3
90.
142
−0.0
23−5
.65
0.23
20.
008
2.26
2004
0.22
20.
007
2.27
0.15
5−0
.006
−0.7
70.
144
−0.0
21−5
.08
0.24
70.
016
4.20
2005
0.21
70.
009
2.81
0.15
3−0
.013
−1.7
40.
145
−0.0
21−5
.14
0.24
40.
020
4.94
2006
0.20
90.
010
3.21
0.14
4−0
.022
−3.5
60.
135
−0.0
23−6
.27
0.23
90.
024
5.72

Why Do U.S. Firms Hold So Much More Cash than They Used To? 2011
Though we do not report the results in the table, we compare the predictedcash ratio to the actual cash ratio for high-tech firms versus manufacturingfirms, and for firms that had an IPO within the past 5 years versus non-IPOfirms. Except for 1990, the model underpredicts the cash holdings of high-tech firms every year. The difference between actual and predicted is low inthe first half of the 1990s, but over the last 5 years of the sample period, theunderprediction averages 5.1% of assets. For recent IPO firms, the predictionerrors are positive in every year; although, the errors average only 2.2% ofassets in the 1990s, they exceed 8% of assets in 2002, 2003, and 2004. Asa result, the model substantially underpredicts the cash ratios of firms thathave recently gone public and overpredicts the cash holdings of the otherfirms.
The model predicts a 40.3% increase in the average cash ratio from 1990 to2006 for the whole sample. How can such a large increase be explained? Toanswer this question, we investigate how firm characteristics change over timeand how this change affects cash ratios. Consider a firm that has the sampleaverage industry cash flow volatility in the 1980s, which is 7.0%. The coefficienton industry cash flow volatility in the Fama-MacBeth regression is 0.230, sowe expect a cash ratio of 1.6% due to industry cash flow volatility (0.230 ∗7.0%) for this firm in the 1980s. Average industry cash flow volatility increasesduring our sample period. For example, average cash flow volatility in 2006 is16.3%. In 2006, a cash ratio of 3.7% could be attributed to average cash flowvolatility, and holding all other variable constant, we infer that the averagecash ratio increased by 2.1 percentage points from the 1980s to 2006 becauseof the increase in cash flow volatility. The various models we estimate in TableIII generally lead to a similar impact of the increase in cash flow volatility onthe cash ratio, except for the changes model and the fixed effects model, wherethe effect is also positive but lower.
Table V attributes the increase in the predicted cash ratio to changes inthe determinants of that ratio. The increase in the cash ratio is the differencebetween the average from 2000 to 2006 and the average for the 1980s. For eachestimate, we calculate standard errors based on the Delta method discussedin Greene (2008). The first column of Table V shows the decomposition for thewhole sample. Most of the change in predicted cash holdings is explained byfour variables. In order of importance, these variables are the change in NWCnet of cash, the change in cash flow risk, the change in capital expenditures,and the change in R&D.
NWC falls by more than 10% of assets from the 1980s to the 2000s. The largestcontributor to that fall is the decrease in inventories. In the 1980s, inventoriesaverage 19.9% of assets. In contrast, in the 2000s, the average is 12.3%. Thedecrease in inventories is more dramatic when we look at the median (notreported), which averages 18.3% in the 1980s, but only 7.4% in the 2000s. Inaddition to the decrease in inventories, a decrease in accounts receivable alsocontributes substantially to the fall in NWC. In the 1980s, accounts receivableaverages 20.3% of assets. In contrast, the average of accounts receivable is15.3% in the 2000s.

2012 The Journal of Finance R©
Tab
leV
Det
erm
inan
tsof
Ch
ange
sin
Pre
dic
ted
Cas
hb
etw
een
2000
and
2006
Th
ista
ble
sum
mar
izes
the
dete
rmin
ants
ofth
ech
ange
inpr
edic
ted
cash
rati
osbe
twee
n20
00an
d20
06,w
her
eth
ech
ange
inth
eca
shra
tio
ism
easu
red
asth
edi
ffer
ence
betw
een
the
aver
age
cash
rati
ofr
om20
00th
rou
gh20
06an
dth
eav
erag
eca
shra
tio
from
1980
thro
ugh
1989
.Th
ede
term
inan
tsof
the
cash
rati
oar
em
odel
edas
Cas
hra
tio
=0.
307
+0.
230
Indu
stry
cash
flow
vola
tili
ty+
0.00
6M
arke
tto
book
–0.
009
Log
size
+0.
077
Cas
h-
flow
/Ass
ets
–0.
238
Net
wor
kin
gca
pita
l/Ass
ets
–0.
372
Cap
ital
expe
ndi
ture
s/A
sset
s–
0.36
0L
ever
age
+0.
048
R&
D/S
ales
–0.
024
Div
iden
d–
0.23
3A
cqu
isit
ion
s/A
sset
s+
0.15
8N
eteq
uit
y/A
sset
s+
0.19
0N
etde
bt/A
sset
s.E
stim
ated
stan
dard
erro
rs(i
npa
ren
thes
es)a
reca
lcu
late
dba
sed
onth
eD
elta
met
hod
disc
uss
edin
Gre
ene
(200
8).V
aria
ble
defi
nit
ion
sar
epr
ovid
edin
the
App
endi
x.
Non
divi
den
dD
ivid
end
Pay
ing
Non
-S&
P50
0S
&P
500
Wh
ole
Sam
ple
Pay
ing
Fir
ms
Fir
ms
Dif
fere
nce
Fir
ms
Fir
ms
Dif
fere
nce
Indu
stry
sigm
a0.
020
0.02
10.
014
0.00
70.
021
0.01
80.
003
(0.0
011)
(0.0
012)
(0.0
008)
(0.0
011)
(0.0
011)
Mar
ket
tobo
ok0.
002
0.00
20.
002
−0.0
010.
002
0.00
6−0
.004
(0.0
001)
(0.0
001)
(0.0
002)
(0.0
001)
(0.0
003)
Rea
lsiz
e−0
.008
−0.0
13−0
.009
−0.0
04−0
.009
−0.0
07−0
.002
(0.0
003)
(0.0
004)
(0.0
004)
(0.0
003)
(0.0
004)
Cas
hfl
ow/a
sset
s−0
.002
−0.0
020.
001
−0.0
02−0
.003
0.00
2−0
.005
(0.0
002)
(0.0
002)
(0.0
001)
(0.0
002)
(0.0
002)
NW
C/a
sset
s0.
025
0.02
20.
021
0.00
10.
025
0.02
40.
002
(0.0
006)
(0.0
007)
(0.0
007)
(0.0
006)
(0.0
010)
Cap
ex0.
013
0.01
500.
011
0.00
40.
013
0.01
30.
001
(0.0
003)
(0.0
004)
(0.0
004)
(0.0
004)
(0.0
005)
Lev
erag
e0.
010
0.01
8−0
.004
0.02
20.
011
−0.0
030.
014
(0.0
007)
(0.0
009)
(0.0
010)
(0.0
007)
(0.0
015)
R&
D/s
ales
0.01
00.
012
0.00
00.
012
0.01
10.
002
0.01
0(0
.000
5)(0
.000
6)(0
.000
0)(0
.000
5)(0
.000
1)D
ivid
end
0.00
40.
000
0.00
00.
000
0.00
40.
005
−0.0
01(0
.000
2)(0
.000
0)(0
.000
0)(0
.000
2)(0
.000
4)A
cqu
isit
ion
acti
vity
−0.0
02−0
.001
−0.0
020.
001
−0.0
02−0
.001
−0.0
01(0
.000
1)(0
.000
2)(0
.000
3)(0
.000
1)(0
.000
4)N
eteq
uit
yis
suan
ce0.
000
−0.0
03−0
.002
−0.0
010.
001
−0.0
020.
003
(0.0
003)
(0.0
004)
(0.0
002)
(0.0
003)
(0.0
003)
Net
debt
issu
ance
−0.0
01−0
.001
−0.0
030.
002
−0.0
01−0
.001
0.00
0(0
.000
2)(0
.000
3)(0
.000
3)(0
.000
3)(0
.000
4)T
OT
AL
0.07
20.
071
0.03
00.
040
0.07
30.
055
0.01
8

Why Do U.S. Firms Hold So Much More Cash than They Used To? 2013
In risk management theories, greater volatility of cash flow increases thepresent value of deadweight costs of financial distress.9 One would expect firmswith greater volatility of cash flow to hedge more, but if they have unhedgeablerisks, they would hold more cash. It is therefore not surprising that firms holdmore cash as cash flow risk increases. Average industry cash flow risk morethan doubles during the sample period, from 7.0% in the 1980s to 15.9% in the2000s.
In the 1980s, average capital expenditures as a percentage of assets are morethan double average R&D expenditures as a percentage of assets (8.9% vs.3.2%). In contrast, in the 2000s, R&D exceeds capital expenditures (6.7% vs.5.4%). We would expect the increased importance of R&D relative to capitalexpenditures to have a significant effect on the cash ratio. The cash ratio isincreasing in R&D. A plausible interpretation is that, given lower asset tangi-bility, R&D investment opportunities are costly to finance using external capi-tal, so R&D intensive firms require a greater cash buffer against future shocksto internally generated cash flow. In contrast, capital expenditures are morelikely to generate assets that can be used as collateral and hence are easierto finance. As a result, capital expenditures may mostly consume cash, whichwould be consistent with their negative relation with the cash ratio.
The next three columns of Table V illustrate the determinants of changes inpredicted cash holdings for dividend payers and nondividend payers. For thisdecomposition, we use the change in the determinants of the cash ratio forsubsamples. For instance, when we attribute the change in the predicted cashratio for dividend-paying firms, we estimate the impact on the cash ratio of thechange in the average value of the explanatory variables between the 1980s andthe period from 2000 to 2006 for these firms. We first consider the decompositionfor nondividend payers. We see that the increase in cash flow risk and thedecrease in NWC explain an increase in the cash ratio of 2.1 percentage pointsand 2.2 percentage points, respectively. Further, a leverage decrease, a decreasein capital expenditures, and an increase in R&D together explain roughly a 4.5percentage point increase in the cash ratio. When we turn to dividend payers,the contributions of the decrease in NWC and of the increase in cash flowrisk stand out. The leverage of nondividend payers decreases relative to theleverage of the dividend payers, contributing to an increase in the cash ratio ofnondividend payers relative to dividend payers of 2.2 percentage points. R&Dexpenses increase more for nondividend payers, which explains a differentialof 1.2 percentage points in the cash flow ratio change. Finally, the cash flowrisk of dividend payers increases less than the cash flow risk of nondividendpayers.
In the last three columns of Table V, we examine why the average predictedcash ratio grew more for non-S&P 500 firms than for S&P 500 firms. The lastcolumn of Table V decomposes the difference in the change in the predictedcash ratio between the S&P 500 firms and the non-S&P 500 firms. For the
9 See, for instance, Smith and Stulz (1985) and Froot, Scharfstein, and Stein (1993). Minton andSchrand (1999) examine cash flow volatility and its deadweight costs empirically.

2014 The Journal of Finance R©
non-S&P 500 firms, the change in NWC and the change in cash flow risk to-gether explain an increase in the cash ratio of 4.6 percentage points. Other vari-ables that contribute in excess of 1 percentage point are the changes in capitalexpenditures, R&D, and leverage. When we consider the S&P 500 firms, weagain see that NWC, cash flow risk, and capital expenditures are important,but their contribution is slightly less than for the non-S&P 500 firms. From theaverage of the 1980s to the average of the 2000s, the difference in the increasein the predicted cash ratio between the non-S&P 500 and S&P 500 firms is 1.8percentage points. As seen from the decomposition, the two largest componentsin absolute value are leverage and R&D. As illustrated in Table III, the cashratio decreases with leverage and increases with R&D. Over our sample period,leverage falls slightly for the non-S&P 500 firms (from 26.1% in the 1980s to23.1% in the 2000s) but stays roughly constant for the S&P 500 firms. Moresignificantly, R&D increases more for the non-S&P 500 firms. In the 1980s,R&D as a percentage of assets was 3.3% for the non-S&P firms and 2.3% forthe S&P firms. In the 2000s, these percentages are, respectively, 7% and 3.3%.
The evidence confirms the role of a precautionary motive for the growth inthe cash ratio, and suggests that changes in firm characteristics largely explainsecular trends in the demand for cash. If firms are holding cash because of theprecautionary motive and their risk increases, we expect the volatility of cashholdings to increase as well. To consider this possibility, we proceed as follows.For each firm-year observation in our sample, we compute the standard devia-tion of cash holdings for the prior 5 years, requiring at least three observations.We then compute an equally weighted average of the standard deviation of cashholdings across firms in an industry. We expect (1) that the industry standarddeviation of cash holdings increases over the sample period and (2) that thereis a high correlation between the standard deviation of cash holdings and cashflow risk. We find that the mean and the median of the standard deviation ofcash holdings increase over time. The average of the medians is 7.1% in the1980s, 8.4% in the 1990s, and 9.3% in the 2000s. We also find that the correla-tion between the median standard deviation of cash holdings and the mediancash flow volatility is 84%.
VI. Agency Problems and Growth in the Cash Ratio
The evidence summarized thus far indicates that empirical models of the de-mand for cash can explain the increase in cash holdings over time primarilythrough changes in firm characteristics. We rely on models that incorporatevarious proxies for a firm’s demand for cash derived from transaction and pre-cautionary motives for cash holdings. We have not, however, investigated di-rectly whether variables that proxy for agency costs are related to changes incash holdings. In this section we conduct three formal tests to evaluate whetheragency problems provide a systematic explanation for the increasing cash hold-ings of firms in our sample.
First, we utilize the Gompers, Ishii, and Metric (2003) index (GIM index)as a measure of managerial entrenchment. The GIM index is a cumulativeindex of 24 antitakeover governance provisions obtained from the Investor

Why Do U.S. Firms Hold So Much More Cash than They Used To? 2015
0
0.05
0.1
0.15
0.2
0.25
1990 1992 1994 1996 1998 2000 2002 2004 2006
cash
/ass
ets
Year
Q1: Lowest GIM index quintile Q2 Q3 Q4 Q5: Highest GIM index quintile
Figure 4. Average cash ratios sorted by quintiles of the GIM index from 1990 to 2006.The figure summarizes the average cash-to-assets ratio for quintiles of firms sorted by their GIMindex. We split the firms for which we have the GIM index into quintiles in each year that IRCCpublishes its information on takeover protections, using values of the GIM index as break points.We keep the assignment of firms the same in years in which no information is published by IRCC.The sample includes all Compustat firm-year observations from 1990 to 2006 with positive valuesfor the book value of total assets and sales revenue for firms incorporated in the United Statesand for which we have IRRC data. Financial firms (SIC code 6000-6999) and utilities (SIC codes4900-4999) are excluded from the sample, yielding a panel of 17,556 observations for 2,362 uniquefirms. The cash ratio is measured as the ratio of cash and marketable securities to the book valueof total assets.
Responsibility Research Center (IRRC) volumes published periodically between1990 and 2006. Firms that have a high value of the GIM index are thought tohave more entrenched management. IRRC covers firms in the S&P 1500 andother major U.S. corporations, a subset of our initial sample. For instance, in1990, 709 firms have a GIM index while our full sample has 4,042 firms. Fol-lowing Gompers, Ishii, and Metrick, we assume that a firm’s governance pro-visions remain in place from the publication year of an IRRC volume until thepublication year of the next volume. We then sort firm-year observations withcorresponding IRRC data into quintiles formed on values of the GIM index.
Figure 4 shows the evolution of cash holdings for each quintile of the GIMindex from 1990 to 2006. We see that the average cash ratio increases for eachquintile. If entrenched managers are more likely to retain free cash flow, weshould see that the cash ratio of firms in the top quintile should increase morethan the cash ratio of firms in the bottom quintile. There is no evidence of suchan evolution. In 1990, the average cash ratio of the highest quintile is 55.73%of the average cash ratio of the lowest quintile. From 1991 to 2006, the averagecash ratio of the highest quintile represents more than 55.73% of the averagecash ratio of the lowest quintile in only 5 years. One might argue that thefact that 3 of these 5 years are the last years of the sample suggests that themost recent increase in cash holdings might be explained by agency problems.

2016 The Journal of Finance R©
However, in 2005, this percentage is 55.96%, roughly the same as in 1990. Sincefirms in low quintiles of the GIM index tend to be young, high growth firms,it is not surprising that they hold more cash. The fact that the firms with themost entrenched management hold the least amount of cash is inconsistentwith the view that entrenchment leads managers to hoard cash. This evidenceis consistent with the evidence in Pan (2007) that firms with a high GIM indexare also more likely to pay dividends and have a higher payout ratio.
Second, we examine the value of cash holdings over time. A number of recentpapers correlate agency costs of cash with the value of corporate cash hold-ings. We follow the approach in Pinkowitz and Williamson (2004), which uses avaluation regression developed by Fama and French (1998) and modifies it byintroducing cash holdings as an independent variable. While this approach isad hoc in that it does not specify a functional form that results directly from atheoretical model, it explains a substantial amount of the cross-sectional vari-ation in firm values. Their basic regression specification is as follows:
Vi,t = α + β1 Ei,t + β2dEi,t + β3dEi,t+2 + β4dAi,t + β5dAi,t+2 + β6RDi,t
+ β7dRDi,t + β8dRDi,t+2 + β9 Ii,t + β10dIi,t + β11dIi,t+2 + β12 Di,t
+ β13dDi,t + β14dDi,t+2 + β15dVi,t+2 + εi,t , (1)
where Xt is the level of variable X in year t divided by the level of total assetsin year t; dXt is the change in the level of X from year t − 2 to year t, Xt − Xt−2;dXt+2 is the change in the level of X from year t to year t + 2, Xt+2 − Xt;V is the market value of the firm calculated at fiscal year-end as the sum ofthe market value of equity, the book value of short-term debt, and the bookvalue of long-term debt; E is earnings before extraordinary items plus interest,deferred tax credits, and investment tax credits; A is total assets; RD is theresearch and development (R&D) expense; I is the interest expense; and D isdividends defined as common dividend paid. When R&D is missing, we set itequal to zero. A straightforward way to estimate the relation between marketvalue and cash holdings in the model is to split the change in assets into itscash and noncash components and estimate the following specification:
Vi,t = α + β1 Ei,t + β2dEi,t + β3dEi,t+2 + β4dNAi,t + β5dNAi,t+2 + β6RDi,t
+ β7dRDi,t + β8dRDi,t+2 + β9 Ii,t + β10d Ii,t + β11dIi,t+2 + β12 Di,t
+ β13dDi,t + β14dDi,t+2 + β15dVi,t+2 + β16Li,t + εi,t , (2)
where NA is net assets defined as total assets minus cash and L corresponds tocash holdings. The coefficient on cash holdings measures the value of holdinga dollar of cash. If the increase in cash holdings is a by-product of agency prob-lems, the value of cash will fall over time. Dittmar and Mahrt-Smith (2007) es-timate a regression similar to equation (2) for U.S. firms, and Pinkowitz, Stulz,and Williamson (2006) utilize a comparable specification for international firmsusing 1-year leads and lags.
Table VI reproduces estimates of the regression given by equation (2). Model1 of Table VI includes all firms in our sample for which the data can be obtainedto estimate the regression. We incorporate two interaction terms with cash to

Why Do U.S. Firms Hold So Much More Cash than They Used To? 2017
Table VI
OLS Regression Results for the Market Value of the FirmThe dependent variable for the regressions is the market value of the firm in year t, Mt. For eachindependent variable X, Xt is the level in year t, divided by the level of total assets in year t; dXt is thechange in the level of X from year t − 2 to year t, divided by total assets in year t ((Xt − Xt−2)/At); dXt+2
is the change in the level of X from year t + 2 to year t, divided by assets in year t ((Xt+2 − Xt)/At). Thefirst regression is for the full sample of firms that satisfy our prior data requirements, and for whichwe are able to calculate 2-year leads and lags, yielding a panel of 49,347 observations for 7,059 uniquefirms. The second regression imposes the additional requirement that assets exceed $100 million in2004, yielding a panel of 30,676 observations for 4,250 unique firms. p-values based on standard errorsrobust to clustering by firm and year are reported in parentheses. Variable definitions are provided inthe Appendix.
Model 1 2
VariableIntercept 0.620 0.302
(0.000) (0.000)Et −0.505 3.852
(0.051) (0.000)dEt 0.866 −0.392
(0.000) (0.016)dEt+2 0.238 1.428
(0.018) (0.000)dNAt 0.776 0.619
(0.000) (0.000)dNAt+2 0.421 0.224
(0.000) (0.000)RDt 3.012 3.468
(0.000) (0.000)dRDt 1.647 2.097
(0.001) (0.40)dRDt+2 3.953 4.463
(0.000) (0.000)It 1.622 0.512
(0.003) (0.411)dIt −4.079 −2.294
(0.000) (0.006)dIt+2 −2.743 −1.440
(0.000) (0.020)Dt 9.180 6.592
(0.000) (0.000)dDt 11.000 11.041
(0.000) (0.000)dDt+2 15.538 12.113
(0.000) (0.000)dVt+2 −0.083 −0.067
(0.001) (0.076)Lt 1.263 1.234
(0.000) (0.000)Lt ∗ D90s 0.475 0.777
(0.032) (0.000)Lt ∗ D00s 0.219 0.450
(0.455) (0.199)D90s 0.195 0.331
(0.000) (0.000)D00s 0.061 0.062
(0.147) (0.164)Adjusted R2 0.293 0.402

2018 The Journal of Finance R©
allow the value of cash to change from the 1980s to the 1990s and the 2000s.Coefficients on these interaction variables are positive, but only significantlydifferent from zero for the 1990s, providing no evidence of a decrease in the valueof cash. The estimated model yields sensible coefficients except for earnings,which has a negative coefficient. Fama and French (1998) point out that itcould be inappropriate to estimate their model across all firms if there are largesystematic differences in the cost of equity across subsamples. It is plausiblethat the cost of equity could be quite different for smaller firms. We thereforeestimate Model 2, which employs an identical specification to Model 1 but usesonly firms with assets in excess of $100 million in 2004. In this specification,earnings have the expected positive coefficient, but our conclusion about thetrend in the value of cash remains unchanged.
We conduct one final investigation (but do not report the results in a table)to identify whether agency problems can explain the increase in cash hold-ings. In a given year, we expect firms with high excess cash, defined as firmswith a high residual in the cross-sectional regression, to be more likely to havehigh agency problems. For agency problems to explain the growth in cash hold-ings, these firms should experience higher growth in cash holdings relative tofirms with low excess cash. We investigate this possibility as follows. Every 5years, we rank firms according to their excess cash using the residuals fromthe cross-sectional regression estimated using parameters from the modifiedOPSW model discussed in Section V. We then estimate the growth in cash hold-ings over the next 5 years for the average and median firms in each excess cashquintile. We find that for each quintile, there is a negative relation between theexcess cash and the growth rate of the cash ratio. This result is inconsistentwith an agency explanation for the increase in cash holdings over time.
VII. Conclusion
We document a dramatic increase from 1980 through 2006 in the average cashratio for U.S. firms. We show that this increase is concentrated among firmsthat do not pay dividends, firms in more recent IPO listing cohorts, and firmsin industries that experience the greatest increase in idiosyncratic volatility.After documenting the increase in cash ratios, we investigate the causes forthat increase. We use a model for cash holdings developed by Opler, Pinkowitz,Stulz, and Williamson (1999), but recognize that the literature has not madeenough progress to provide a model that dominates all others. We find that themain reasons for the increase in the cash ratio are that inventories have fallen,cash flow risk for firms has increased, capital expenditures have fallen, andR&D expenditures have increased. While the contribution of changes in thesefirm factors to the overall increase in cash holdings varies across alternativeempirical models of cash holdings, our conclusions are generally robust.
The increase in cash flow risk is connected to the widely studied increasein idiosyncratic risk. Recent evidence of a decrease in idiosyncratic risk, if itpersists, should lead firms to eventually reduce their cash holdings and may ex-plain why the average cash ratio peaked in 2004 in our sample.10 The decrease
10 See Brandt, Brav, Graham, and Kumar (2009).

Why Do U.S. Firms Hold So Much More Cash than They Used To? 2019
in inventories, however, is probably here to stay. Further, the greater impor-tance of R&D relative to capital expenditures also has a permanent effect onthe cash ratio. Becaues of lower asset tangibility, R&D investment opportu-nities are costlier to finance than capital using external capital expenditures.Consequently, greater R&D intensity relative to capital expenditures requiresfirms to hold a greater cash buffer against future shocks to internally generatedcash flow.
Our evidence shows that the increase in cash ratios, while dramatic, canlargely be explained by the change in firm characteristics over our sampleperiod and, less significantly, by changes in the relation between firm char-acteristics and cash holdings. The data are consistent with existing evidenceshowing that the precautionary motive to hold cash is a critical determinantof the demand for cash. Though the market for derivatives has grown dra-matically, our evidence suggests that firms face many risks that they cannothedge or are reluctant to hedge with derivatives. There is, of course, substantialcross-sectional variation in cash holdings that is not explained by our model.Consequently, our results could be consistent with the hypothesis that somefirms hold too much cash because of agency problems. However, agency prob-lems do not appear capable of explaining our aggregate evidence. In particular,there is no evidence that cash ratios grow more for firms with more entrenchedmanagement or that the value of cash falls during our sample period.
We also document a dramatic decrease in net debt for U.S. firms over thesample period. If cash is simply negative debt, leverage should be measuredusing net debt. In this case, the standard measures of leverage used in thefinance literature ignore a stunning evolution in the net debt of U.S. firms.By 2006, the average firm has no leverage when leverage is measured by netdebt. Assuredly, cash enables firms to forestall distress and default. Thus, thegrowing importance of cash should be taken into account when evaluating thefinancial condition and assessing the capital structure decisions of firms.
Appendix: Variable Definitions
Variable Definition
Acquisition activity The ratio of expenditures on acquisitions relative to the book value oftotal assets
Capex The ratio of capital expenditures to the book value of total assetsCash flow EBITDA − interest − taxes − common dividendsCash ratio The ratio of cash and marketable securities to the book value of total
assetsCredit spread The difference between the AAA and BBB yields published by the
Federal Reservedcash The cash ratio minus the lagged cash ratioDividend dummy A dummy variable equal to one if the firm paid a common dividend in
that year, and zero if it did notIndustry sigma The mean of the standard deviations of cash flow/assets over 10 years for
firms in the same industry, as defined by the two-digit SIC code
(continued)

2020 The Journal of Finance R©
Appendix—Continued
Variable Definition
IPO1 through IPO5 Dummy variables equal to one if the firm went public 1, 2, 3, 4 or 5 yearsago
Leverage The ratio of total debt to the book value of total assets, where debtincludes long-term debt plus debt in current liabilities
Loss A dummy variable equal to one if net income is less than zero, and zerootherwise
Market to book Measured as (book value of total assets – book value of equity + marketvalue of equity)/book value of total assets
Net debt issuance Calculated as annual total debt issuance minus debt retirement, dividedby the book value of total assets
Net equity issuance Calculated as equity sales minus equity purchases, divided by the bookvalue of total assets
Net Leverage Calculated as the difference between total debt and cash and marketablesecurities, divided by the book value of total assets
NWC Calculated as net working capital minus cash and marketable securitiesReal size The natural log of the book value of total assets in 2004 dollarsR&D/sales The ratio of research and development expense to salesT-bill The U.S. treasury bill yield measured as the average 3-month rate
published by the Federal ReserveC Cash and marketable securitiesD Common dividendsE Earnings, calculated as earnings before extraordinary items + interest +
income statement deferred tax credits + investment tax creditsI Interest expenseM Market value of equity + short-term debt + long-term debtNA Net assets, calculated as book value of total assets – cashRD Research and development expense or zero when missing
REFERENCESAcharya, Viral A., Heitor Almeida, and Murillo Campello, 2007, Is cash negative debt? A hedging
perspective on corporate financial policies, Journal of Financial Intermediation 16, 515–554.Almeida, Heitor, Murillo Campello, and Michael S. Weisbach, 2004, The cash flow sensitivity of
cash, Journal of Finance 59, 1777–1804.Baumol, William J., 1952, The transactions demand for cash: An inventory theoretic approach,
Quarterly Journal of Economics 66, 545–556.Brandt, Michael W., Alon Brav, John R. Graham, and Alok Kumar, 2009, The idiosyncratic volatility
puzzle: Time trend or speculative episodes? Review of Financial Studies forthcoming.Brown, Gregory, and Nishad Kapadia, 2007, Firm-specific risk and equity market development,
Journal of Financial Economics 84, 358–388.Cameron, A. Colin, Jonah B. Gelbach, and Douglas L. Miller, 2006, Robust inference with multi-way
clustering, Working paper, University of California, Davis.Campbell, John Y., Martin Lettau, Burton G. Malkiel, and Yexiao Xu, 2001, Have individual stocks
become more volatile? An empirical exploration of idiosyncratic risk, Journal of Finance 56,1–43.
Dittmar, Amy, and Jan Mahrt-Smith, 2007, Corporate governance and the value of cash holdings,Journal of Financial Economics 83, 599–634.
Dittmar, Amy, Jan Mahrt-Smith, and Henri Servaes, 2003, International corporate governanceand corporate cash holdings, Journal of Financial and Quantitative Analysis 38, 111–133.

Why Do U.S. Firms Hold So Much More Cash than They Used To? 2021
Fama, Eugene F., and Kenneth R. French, 1998, Taxes, financing decisions, and firm value, Journalof Finance 53, 819–843.
Fama, Eugene F., and Kenneth R. French, 2001, Disappearing dividends: Changing firm charac-teristics or lower propensity to pay? Journal of Financial Economics 60, 3–43.
Fama, Eugene F., and Kenneth R. French, 2004, New lists: Fundamentals and survival rates,Journal of Financial Economics 73, 229–269.
Faulkender, Michael, and Rong Wang, 2006, Corporate financial policy and the value of cash,Journal of Finance 61, 1957–1990.
Foley, C. Fritz, Jay Hartzell, Sheridan Titman, and Garry J. Twite, 2007, Why do firms hold somuch cash? A tax-based explanation, Journal of Financial Economics 86, 579–607.
Froot, Kenneth A., David S. Scharfstein, and Jeremy C. Stein, 1993, Risk management: Coordinat-ing corporate investment and financing policies, Journal of Finance 48, 1629–1658.
Gompers, Paul A., Joy L. Ishii, and Andrew Metrick, 2003, Corporate governance and equity prices,Quarterly Journal of Economics 118, 107–155.
Greene, William H., 2008, Econometric Analysis, 6th ed. (Prentice Hall, Englewood Cliffs, NJ).Han, Seungjin, and Jiaping Qiu, 2007, Corporate precautionary cash holdings, Journal of Corporate
Finance 13, 43–57.Harford, Jarrad, Sattar Mansi, and William Maxwell, 2008, Corporate governance and a firm’s
cash holdings, Journal of Financial Economics 87, 535–555.Haushalter, David, Sandy Klasa, and William Maxwell, 2007, The influence of product market
dynamics on the firm’s cash holdings and hedging behavior, Journal of Financial Economics84, 797–825.
Irvine, Paul J., and Jeffrey E. Pontiff, 2008, Idiosyncratic return volatility, cash flows, and productmarket competition, Review of Financial Studies, 22, 1149–1177.
Jensen, Michael, 1986, Agency costs of free cash flow, corporate finance and takeovers, AmericanEconomic Review 76, 323–329.
Loughran, Tim, and Jay Ritter, 2004, Why has IPO underpricing changed over time? FinancialManagement 33, 5–37.
Miller, Merton H., and Daniel Orr, 1966, A model of the demand for money by firms, QuarterlyJournal of Economics 80, 413–435.
Minton, Bernadette A., and Catherine Schrand, 1999, The impact of cash flow volatility on discre-tionary investment and the costs of debt and equity financing, Journal of Financial Economics54, 423–460.
Mulligan, Casey B., 1997, Scale economies, the value of time, and the demand for money: Longitu-dinal evidence from firms, Journal of Political Economy 105, 1061–1079.
Newey, Whitney K., and Kenneth D. West, 1987, A simple positive semi-definite heteroskedasticityand autocorrelation consistent covariance matrix, Econometrica 55, 703–708.
Opler, Tim, Lee Pinkowitz, Rene M. Stulz, and Rohan Williamson, 1999, The determinants andimplications of corporate cash holdings, Journal of Financial Economics 52, 3–46.
Pan, Carrie, 2007, Why are entrenched managers more likely to pay dividends? Working paper,The Ohio State University.
Pinkowitz, Lee, Rene M. Stulz, and Rohan Williamson, 2006, Do firms in countries with poorprotection of investor rights hold more cash? Journal of Finance 61, 2725–2751.
Pinkowitz, Lee, and Rohan Williamson, 2004, What is a dollar worth? The market value of cashholdings, Working paper, Georgetown University.
Riddick, Leigh A., and Toni M. Whited, 2009, The corporate propensity to save, Journal of Finance64, 1729–1766.
Smith, Clifford W., and Rene M. Stulz, 1985, The determinants of firms’ hedging policies, Journalof Financial and Quantitative Analysis 20, 391–405.