why do firms change their dividend policy?
TRANSCRIPT

International Journal of Economics and Financial Issues
ISSN: 2146-4138
available at http: www.econjournals.com
International Journal of Economics and Financial Issues, 2017, 7(3), 411-422.
International Journal of Economics and Financial Issues | Vol 7 • Issue 3 • 2017 411
Why do Firms Change Their Dividend Policy?
Ijaz Ali1*, Ali Gohar2, Omar Meharzi3
1Fahad Bin Sultan University Tabuk, Saudi Arabia, 2Fahad Bin Sultan University Tabuk, Saudi Arabia, 3University of Grenoble, France. *Email: [email protected]
ABSTRACT
Prior literature has largely documented managers’ preference of sticking to their dividend policy. This perceived inflexibility of managers makes a dividend policy switch an important milestone in a firm’s life. Blau and Fuller (2008) state that existing theories do not help understand why some firms never pay dividends, while others consistently pay them. This paper examines the factors that motivate managers to change their long term dividend policy. By employing univariate and multivariate tests and propensity score matching method, the authors provide empirical evidence consistent with the life cycle theory of dividends and Litner’s proposition, and inconsistent with the signaling theory of dividends. Unlike previous studies, by investigating the characteristics of dividend policy switchers, this study examines factors affecting firms’ long term dividend policy. In addition, by analyzing both positive and negative switchers, this study helps to determine whether the same factors are responsible for dividend abandonments and initiations.
Keywords: Dividend Policy, Signaling Theory of Dividends, Life Cycle Theory of Dividends JEL Classification: G35
1. INTRODUCTION
What are the factors that motivate lasting changes in dividend policies, i.e., changes that lead a regular dividend payer to stop payments permanently, or conversely those that lead a never paid firm to adopt a policy of regular dividend payments?
Since publication of the original Miller and Modigliani (1961) irrelevance proposition, several theories have been developed to explain the motivation behind dividend policies. Signaling models (Bhattacharya, 1979; John and Williams, 1985), Miller and Rock (1985) state that dividends aim to convey information about future prospects of firms, suggesting a positive relationship between dividend changes and changes in future earnings. In sharp contrast to the signaling theory, the life cycle theory of dividends (DeAngelo et al., 2006) predict that firms start paying dividends when they stop growing, i.e., when their future growth is expected to decline and their profitability to remain steady or decline, therefore suggesting lack of association or a negative relationship between dividend changes and changes in future earnings. Agency explanations (Easterbrook, 1984; Jensen, 1986) posit that firms use dividends to mitigate agency problems between insiders and outsiders. Venkatesh (1989), Dyl and Weigand (1998), Grullon
et al. (2002) hypothesize that changes in dividend policy convey information about changes in firms’ risk.
Empirical research finds evidence both in support of and contrary to these different theories of dividends. Blau and Fuller (2008) state that existing theories do not help understand why some firms never pay dividends, while others consistently pay them. According to Black (1976) “the harder we look at the dividend picture, the more it seems like a puzzle with pieces that just don’t fit together.”
This study extends the empirical dividend literature by examining firms from 21 European countries over the period 1990-2010. Unlike previous research, rather than analyzing annual firm dividend decisions, this study focuses on dividend policy switches. A positive switcher is a firm that initiates dividend payments, after having not paid dividends before over the sample period, and never omits them afterwards. Similarly, a negative switcher permanently stops paying dividends from the switch year after having paid them regularly in the pre-switch years.
According to Bulan et al. (2007) within the context of firm’s life cycle, durable dividend initiation (positive switches) is an important policy change. This is the same for lasting dividend omissions

Ali, et al.: Why do Firms Change Their Dividend Policy?
International Journal of Economics and Financial Issues | Vol 7 • Issue 3 • 2017412
(negative switches) since firms display strong reluctance to dividend omissions and dividend cuts. Twu (2010) suggests that managers are reluctant to make changes in their dividend policy. He named this behavior as dividend stickiness. DeAngelo and DeAngelo (1990) report that managers with long histories of dividend payments avoid dividend omissions, perhaps because such omissions would tag them as unsuccessful managers whose policies could not produce sufficient cash to pay dividends. Brav et al. (2005) conduct survey and field interviews of 407 chief financial officers and find that managers like to maintain the existing level of dividends and do not like to cut dividends except in extreme circumstances. Their analysis indicates that maintaining the dividend level is a priority on par with investment decisions. (Karpavičius, 2014) state that firms with more stable dividend stream are more valuable. This explains why firms stick to their dividend policy.
This perceived inflexibility of managers makes a dividend policy switch an important milestone in a firm’s life. Therefore, at the time of a dividend policy switch we expect some important changes in the characteristics of firms that dictate dividend policy.
The goal of the study is to investigate the determinants that may explain significant changes in firm dividend policies. To this end, using dividend policy theories, this study compares the characteristics of positive switchers to those of negative switchers. Regular dividend payers and regular non-payers are non-switchers. Regular payers (regular non-payers) are firms that have never omitted (never paid) dividends during the sample period. A negative switcher is a firm that has never omitted dividend payments during its Datastream history before the year of switch, and never paid dividends after the switch year. In contrast, a positive switcher is a firm that has never paid dividends during its Datastream history before the year of switch, and has never omitted dividends after the year of switch. The study uses regular dividend payers as control firms against negative switchers. Both regular payers and negative switchers were consistently paying dividends till the year of switch. In the switch year negative switchers, however, change their dividend policy but regular payers do not. Thus, this study compares the characteristics of regular payers and negative switchers around the switch year to track any extraordinary changes in the characteristics of negative switchers that did not take place in their peer firms. Similarly, positive switchers and regular non-payers were sharing the same dividend group before the year of the switch. Therefore, the study uses regular dividend payers as control firms against positive switchers.
These analyses will help us assess how the characteristics of switchers evolve during a 7 year window (T−3 to T+3) around the dividend policy switch. This will enable us to know the factors responsible for lasting changes in dividend policy of firms. In addition, the analysis will help us determine the timing of dividend changes in relation to changes in earnings, to see whether earnings changes precede dividend changes as suggested by Lintner (1956), or whether changes in dividends precede changes in earnings as suggested by the signaling theory.
Most previous dividend policy literature focuses on annual dividend payments only. It investigates either changes in the
amounts paid from 1 year to another or payment or non-payment decisions. By ignoring the long-term pattern of dividend payments, these studies do not consider dividend policy as such. To our knowledge, by investigating the characteristics of dividend switchers such as they are defined here, this study is the first to examine factors affecting firm long term dividend policy.
Studies similar to this one are those that investigate the determinants of dividend initiations and omissions; but the definitions of initiators and omitters used in these studies allow a firm to be included in the sample as an initiator at one time and as an omitter at another time during the same sample period. For example according to Baker and Wurgler (2004) and Goergen et al. (2005) a firm is an initiator even if it resumes dividend payments after a single year omission. Similarly, Goergen et al. (2005) define a dividend omitter as a firm that omits dividends after a single year dividend payment. They do not consider the long term pre- and post-event dividend payment behavior of firms. In contrast, our definition of switchers restricts our sample to those firms that change their dividend policy only once during the sample period. Furthermore, previous studies focus either on dividend initiations or dividend omissions. By analyzing both positive and negative switchers, this study will help to determine whether the same factors are responsible for dividend abandonments and initiations.
Both our univariate and multivariate results suggest that changes in past and current operating performance are the primary determinants in a firm’s decision to change its dividend policy. The univariate tests show that profitability, investment opportunities, and retained earnings rise around positive switches. On the other hand, negative switchers experience a decline in profitability and asset growth, and an increase in financial risk around switch year. During the pre-switch years we observe a substantial increase in profitability and asset growth of positive switchers, but profitability remains stable at a high level and asset growth follows a declining trend during the post-switch years. This behavior of positive switchers supports the life cycle theory of dividends that predicts that a firm will begin paying dividends when its ability to generate cash overtakes its growth opportunities. These findings are also consistent with the Lintner’s (1956) proposition that asserts that managers are reluctant to make dividend changes that might have to be reversed. In other words, managers change dividends when they expect a permanent change in earnings of their firms. The dividend payment behavior of switchers and non-switchers, however, does not support the signaling theory of dividends that predicts a change in the future profitability in response to current changes in dividends. Moreover, the findings suggest that the decision not to pay dividends by negative switchers and regular non-payers arises from significantly different circumstances.
Section 2 describes the sample selection procedure and methodology. Section 3 highlights the variables which may affect dividend policy of firms. Section 4 presents the findings or the study. Section 4 concludes.
2. DATA AND METHODOLOGY
The initial sample of the study consists of listed firms from 21 European countries. Data is collected from 1990 to 2010. The

Ali, et al.: Why do Firms Change Their Dividend Policy?
International Journal of Economics and Financial Issues | Vol 7 • Issue 3 • 2017 413
firm-level data is obtained from Thomson Financial Worldscope, Datastream and Osiris databases. The initial list consists of 11,524 firms. The study excludes firms that are not covered by Datastream and eliminates firms classified as financials (codes that start with “40”) by Global Industry Classification Standard.
To soften the impact of outliers, the dataset is winsorized. Any observation that falls more than three standard deviations away from the mean of the data under consideration is considered an outlier.
The final sample of the study includes 4,645 firms with ordinary dividend data available on Datastream. Table 1 reports the number of observations per year in each dividend group. From the primary sample of switchers, the study constructs matched samples of dividend non-switchers. Each dividend switcher is paired with a non-switcher from the same year and industry that is the closest in terms of total assets in the year of switch. This results in 340 year, size and industry matched control firms (regular non-payers) for 341 positive switchers, and 268 negative switchers along with 268 control firms (regular payers) for negative switchers. The sample contains 949 regular payers and 1488 regular non-payers.
3. VARIABLES
The idea that firm size and dividend payout are positively correlated is generally accepted by financial economists. Large firms are more likely to be mature, less risky, more profitable, having a high retained earnings-to-total capital ratio. Thus they have easier
access to capital markets for financing their business activities with lower transaction costs. This suggests that larger firms have greater flexibility in paying dividends. The life cycle theory of dividends predicts a positive relationship between firm size and dividend payments. In contrast, being relatively more exposed to outsiders (getting more coverage from analysts, newspaper, and magazines, etc), large firms experience low information asymmetry. Therefore, from the signaling hypothesis point of view, dividend payments and company size might be negatively associated. Sawicki (2005) reports that dividend payments can help monitor the performance of managers in large firms. That is, in a large firm, ownership is dispersed leading to high information asymmetry, thus decreasing shareholders’ ability to monitor the firm’s management. This results in inefficient control of management. Large payments of dividends force these firms to raise additional capital from markets to tap available investment opportunities. This leads to increased monitoring by new investors.
Smith and Watts (1992) suggest that the theoretical basis for the impact of size on dividend policy is weak. They consider that size should be regarded as a simple control variable, with no particular expected sign. However, empirical evidence largely supports the use of the size variable as a relevant characteristic of the firm’s life cycle. Most of prior studies report a positive relationship between size and dividend payments. Fama and French (2001) find that dividend payers are twelve times larger than non-payers. DeAngelo et al. (2004) and Benito and Young, (2003) also report a positive relation between firm size and dividend payment. This study measures a firm’s size using its total assets (in Euros) at the end of year under consideration. Von Eije and Megginson (2006) demonstrate that an increase in the relative size percentile increases the propensity to pay dividends. DeAngelo et al. (2004) report that 100% of the firms with at least $1 billion in real earnings paid dividends in 1978, whereas 85.7% paid dividends in 2000.
3.1. Investment/Growth OpportunitiesThe life cycle theory of dividends suggests that a firm will start paying dividends when its growth rate is expected to decline in future. In other words, dividend initiation conveys information about a firm transition to a “mature” phase characterized by slower growth. A firm with high investment opportunities will attempt to retain earnings for financing these opportunities. Firms with few investment opportunities will have greater cash flow and can thus pay higher dividends.
Rozeff (1982) reports a negative association between dividend payments and future or past growth opportunities. In a questionnaire survey of companies, Baker (1989) observes that 76% of the respondents list growth and expansion through investment as a reason for not paying dividends. Von Eije and Megginson (2006) find that rapidly growing companies are less likely to begin paying dividends. Payne (2011) reports that the greater the market-to-book ratio, the less likely the firm to be a dividend initiator.
In contrast Fama and French (2001) report a positive association between growth opportunities and dividend payments. Denis and Osobov (2008) find that the association between growth
Table 1: Number of switchers and non-switchers by yearYear Dividend non-switchers Dividend switchers
Regular non-payers
Regular payers
Positive switchers
Negative switchers
1990 11 102 - -1991 21 148 - -1992 48 438 - -1993 54 512 - -1994 68 532 - -1995 76 549 15 91996 98 565 12 81997 136 587 18 81998 245 639 5 91999 324 658 12 172000 547 758 9 302001 680 763 21 422002 799 784 25 412003 862 786 26 212004 952 768 38 222005 1070 753 63 192006 1128 711 50 342007 1131 692 47 82008 1050 664 - -2009 972 660 - -2010 903 650 - -Total 11175 12719 341 268A positive switcher is a firm that has never paid dividends during its Datastream history before the year of switch, and never omitted dividends after the year of switch. A negative switcher is a firm that has never omitted dividend payments during its Datastream history before the year of switch, and never paid dividends after the switch. Regular payers/regular non-payers are firms that have never omitted/paid dividends during their Datastream history till 2010

Ali, et al.: Why do Firms Change Their Dividend Policy?
International Journal of Economics and Financial Issues | Vol 7 • Issue 3 • 2017414
opportunities and dividend payments differs across countries. Bulan et al. (2007) find no significant change in firm size around dividend initiation. Following Denis and Osobov (2008) and Fama and French (2001), this study uses the market-to-book (M/B) ratio and the percent change in a firm’s total assets (dAt/At, dAt=At−At−1) as proxies for growth opportunities; where, At is measured as the book value of total assets at the end of year t. M/B ratio means the market value of the common equity divided by the book value of the common equity of the company.
3.2. ProfitabilityProfitability is an important determinant of dividend policy. The life cycle theory of dividends suggests that mature firms are more profitable and are inclined to dividend payment. This theory predicts stable or declining future earnings after dividend initiation. In sharp contrast with the life cycle theory, the signaling theory of dividends predicts a positive association between current dividend changes and changes in future earnings. Lintner (1956) proposes a positive association between current dividend change and past performance/earnings. Dyl and Weigand (1998) observe an increasing pattern of earnings during the pre-dividend period, followed by more stable level of earnings during the post-dividend period. Healy and Palepu (1988) report a rising trend in earnings for dividend initiators, which starts in the pre initiation years and lasts till 2 years following the initiation year. In contrast to the signaling theory, they report an increase in the earnings of dividend omitters in the year following the omission year. Benartzi et al. (1997) analyze the link between dividend changes and subsequent firm earnings and conclude that “the only strong predictive power we can find is that dividend cuts reliably signal an increase in future earnings.”
Focusing on newly public firms, Lipson et al. (1998) compare the performance of those firms that initiate dividends with those that do not. They report that earnings increases following dividend initiations and earnings surprises for initiating firms are more favorable than those of non-initiating firms. Bulan et al. (2007) find no significant changes in the profitability of initiators compared to non-initiators in the 6 years surrounding initiation. Wang et al. (2011) find that the dividend payment decisions taken by Chinese listed firms are heavily based on their contemporaneous earnings.
This study uses earnings before interest and taxes scaled by total assets (EBITt/At) to measure firm profitability.
3.3. Retained Earnings-to-total EquityThe life cycle theory of dividend suggests that a profitable firm with several years of successful business operations reaches a mature position where its ability to generate cash overtakes its ability to find profitable investment opportunities. Eventually, it starts dividend payments to distribute its free cash flow to shareholders. In contrast, a young firm faces a large investment opportunity set, but is relatively less profitable, leading to low earned equity ratio. Therefore, it needs to raise capital from external sources. In addition, being a relatively new and small firm, it faces substantial hurdles in terms of raising capital from
external sources. As a result, the firm will conserve cash by forgoing dividend payments to shareholders. DeAngelo et al. (2006) suggest that earned-to-contributed capital mix measures the extent to which firms finance their projects through external or internal sources. The earned-to-contributed capital is thus a logical proxy for the life-cycle stage of a firm.
DeAngelo et al. (2006) find that the propensity to pay dividend is strongly related to the retained earnings/contributed capital mix ratio (REt/TEt). Denis and Osobov (2008) report that firms with high proportion of retained earnings in relation to their equity are more likely to be dividend payers. This study considers retained earnings-to-total equity ratio (REt/TEt) as a proxy for firm maturity, where REt and TEt are retained earnings and total equity respectively.
3.4. Borrowing RatioJensen and Meckling (1976), Stulz (1988), and Jensen (1986) state that financial leverage plays a role in reducing agency costs arising from stockholder-manager conflicts of interest. Borrowing ratio can affect dividend payment decisions because of the potential monitoring role of debt on managers that results from the regular cash outflows that are necessary to ensure cash settlement of debt service. Von Eije and Megginson (2006) report that high leverage reduces both the propensity to pay and the amounts of dividends paid. Benito and Young (2003) analyze the relationship between leverage and dividend payments using a sample of UK firms and report that higher level of indebtedness leads to dividend omissions. Fama and French (2001) report that former dividend payers are more indebted than current dividend payers1. Level of debt may also affect dividend policy of firms because of debt covenants and related restrictions imposed on firms by their lenders. DeAngelo and DeAngelo (1990) show that debt covenants affect dividend policy of firms with multiple annual losses. According to Payne (2011) the greater the financial risk, the less likely the firm to be a dividend initiator. Thus, we can expect a negative association between financial risk and dividend payments. Insofar as financial debt increases risk, this reinforces our expectation of a negative relationship between dividends and leverage.
As dividend payments and borrowings are two substitutes likely to mitigate agency problems, we expect a negative association between dividend payments and leverage. This study measures leverage by scaling total loans with equity capital and reserves.
3.5. AgeThe life cycle hypothesis suggests that mature firms are more likely to pay dividends. A firm’s age, therefore, increases the propensity to pay dividends and the amount of dividends paid (Von Eije and Megginson, 2006). Thus, in addition to earned equity-to-contributed capital mix ratio, this study considers age as a second proxy for firm maturity status and uses the year of incorporation to determine age of sample firms. If the year of incorporation is not available, IPO date is considered as birth year of the firm. Using the IPO year as the “year of birth” leads to the same conclusions as the ones resulting from the use of the year of incorporation.
1 They define former payers as firms that have paid dividends in past but omit them in current year.

Ali, et al.: Why do Firms Change Their Dividend Policy?
International Journal of Economics and Financial Issues | Vol 7 • Issue 3 • 2017 415
4. CHARACTERISTICS OF DIVIDEND SWITCHERS AND NON-SWITCHERS
This section examines the characteristics of dividend switchers and non-switchers and analyzes the changes in their characteristics during each year of a 7 year switch window over the period 1994-2006. The switch window starts 3 years before the year of switch and ends 3 years after the switch. To highlight the determinants of firm dividend policies, the univariate and multivariate analysis compare: (i) Positive switchers (negative switchers) against regular non-payers (regular payers); (ii) pre switch years against post switch years (iii) regular payers against regular non-payers. These analyses will help to determine the factors that are crucial in defining firm dividend payment policies. They will also help to understand whether the determinants of dividend policies are the same for the different dividend groups under consideration, and whether these different dividend groups have the same level of sensitivity towards the factors. Furthermore, these analyses will help us establish which dividend theory best explains the dividend paying behaviour of the sample firms.
During pre-switch period, negative switchers pay dividends and positive switchers do not, while in the post-switch period positive switchers pay and negative switchers do not. Firms that start to pay dividends (positive switchers) are expected to adopt characteristics of pre-switch negative switchers; while negative switchers are expected to adopt characteristics of pre-switch positive switchers. For example, if negative switchers are more profitable than positive switchers during the pre-switch period, and if profitability is an important factor in formulating dividend policy for both type of switchers, a decline (increase) in the profitability of negative (positive) switchers should take place during the post-switch period. Bulan and Subramanian (2009) report that in the years following termination of dividends, non-payers have persistent debt overhang, low investment and continue to under-perform as compared with their industry peers. If these characteristics affect dividend policies, we expect that positive (negative) switchers will adopt the characteristics of regular payers (never-paid firms) during the post switch period. In addition these analyses will help us determine whether changes in the characteristics of these switchers are permanent or temporary. In addition these analyses will help us determine whether the changes in the characteristics of these switchers are permanent or temporary. Below are the results of the univariate statistics. Then the evidence is confirmed with logit regressions.
4.1. Univariate Tests4.1.1. SizeData in Table 2 panel B shows that regular dividend payers have an average size of 482.73 million Euro. This group is significantly larger than the other dividend groups. Negative switchers (with an average size of 98.97 m €) were part of the regular dividends payer sample before the switch, but they are much smaller in size. The possible reasons could be that: (i) Negative switchers were large in size in the past, but due to successive losses they became smaller; or/and (ii) these firms were small firms, but they tried to imitate large firms.
Table 2 shows that during the 7 year switch window, size of negative (positive) switchers decreases (increases) significantly. The median size of positive switchers rises from 100.2 m€ (T−3) to 192.7 m€ (T+3). On the other hand, the median size of negative switchers falls from 102.7 m€ (T−3) to 73.8 m€ (T+3).
4.1.2. Investment opportunitiesTable 2 indicates that during post switch years, positive switchers have higher growth opportunities than negative switchers and regular non-payers (matched sample). Median asset growth of positive switchers remains 14.7% in year T. On the other hand, negative switchers grow at the rate of −2.6%. Investment opportunities of positive switchers follow an increasing trend in the pre-switch period and a declining trend in the post-switch years. For negative switchers asset growth and M/B ratios register an overall decline during the 7 year switch window. The difference between the asset growth ratio of negative switchers and regular payers (matched sample) is not significant during the pre-switch period, but the ratio for negative switchers becomes significantly smaller in the post switch years. This indicates that before the switch year, when negative switchers were dividend payers, they had high investment opportunities. These findings suggest a positive association between dividend payments and growth opportunities.
Inconsistent with these findings, Panel B of Table 2 reports that regular non-payers have greater investment opportunities than regular payers, suggesting a negative relation between dividend payment and investment opportunities.
Negative switchers and regular non-payers should have similar characteristics during the post switch years, as they were both non-payers, but we find a significant difference between their asset growth ratios. This suggests that firms’ investment opportunities affect dividend policies of different dividend groups differently. Regular non-payers do not pay dividends in order to tap the available investment opportunities; in contrast, negative switchers stop dividend payments because of poor performance.
4.1.3. ProfitabilityPanel B of Table 2 reports that regular dividend payers are far more profitable than regular non-payers. The median of profitability ratio remains more than 10% for both the full sample and the matched sample of regular payers. Regular non-payers remained significantly less profitable than regular payers throughout the 1994-2010 period. Panel A of Table 2 shows that both positive and negative switchers have a high EBITt/TAt ratios when they are dividend payers.
The profitability of positive switchers improves substantially during the pre-switch years. It rises from 4.18% (T−3) to 10.03% (T). During the post switch years, however, this rising trend in the profitability of positive switchers stops and stability prevails in the ratio. During the switch year, profitability of positive switchers gets close to that of regular dividend payers. Negative switchers experience a substantial decline in their profitability during the pre-switch years. Their EBIT/TA ratio declines from 8.12% (T−3) to −1.56% (T). During the years T−3 and T−2, negative switchers are significantly more profitable than positive switchers of the
Ali, et al.: Why do Firms Change Their Dividend Policy?
International Journal of Economics and Financial Issues | Vol 7 • Issue 3 • 2017416
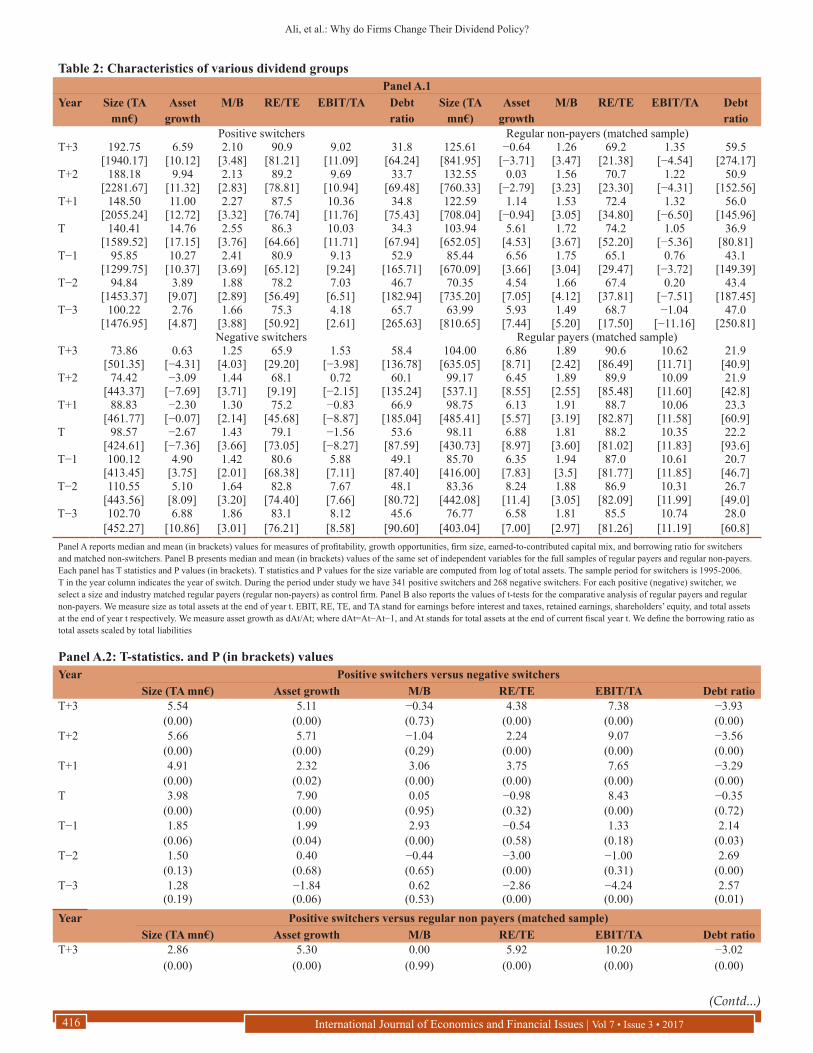
Table 2: Characteristics of various dividend groupsPanel A.1
Year Size (TA mn€)
Asset growth
M/B RE/TE EBIT/TA Debt ratio
Size (TA mn€)
Asset growth
M/B RE/TE EBIT/TA Debt ratio
Positive switchers Regular non-payers (matched sample)T+3 192.75 6.59 2.10 90.9 9.02 31.8 125.61 −0.64 1.26 69.2 1.35 59.5
[1940.17] [10.12] [3.48] [81.21] [11.09] [64.24] [841.95] [−3.71] [3.47] [21.38] [−4.54] [274.17]T+2 188.18 9.94 2.13 89.2 9.69 33.7 132.55 0.03 1.56 70.7 1.22 50.9
[2281.67] [11.32] [2.83] [78.81] [10.94] [69.48] [760.33] [−2.79] [3.23] [23.30] [−4.31] [152.56]T+1 148.50 11.00 2.27 87.5 10.36 34.8 122.59 1.14 1.53 72.4 1.32 56.0
[2055.24] [12.72] [3.32] [76.74] [11.76] [75.43] [708.04] [−0.94] [3.05] [34.80] [−6.50] [145.96]T 140.41 14.76 2.55 86.3 10.03 34.3 103.94 5.61 1.72 74.2 1.05 36.9
[1589.52] [17.15] [3.76] [64.66] [11.71] [67.94] [652.05] [4.53] [3.67] [52.20] [−5.36] [80.81]T−1 95.85 10.27 2.41 80.9 9.13 52.9 85.44 6.56 1.75 65.1 0.76 43.1
[1299.75] [10.37] [3.69] [65.12] [9.24] [165.71] [670.09] [3.66] [3.04] [29.47] [−3.72] [149.39]T−2 94.84 3.89 1.88 78.2 7.03 46.7 70.35 4.54 1.66 67.4 0.20 43.4
[1453.37] [9.07] [2.89] [56.49] [6.51] [182.94] [735.20] [7.05] [4.12] [37.81] [−7.51] [187.45]T−3 100.22 2.76 1.66 75.3 4.18 65.7 63.99 5.93 1.49 68.7 −1.04 47.0
[1476.95] [4.87] [3.88] [50.92] [2.61] [265.63] [810.65] [7.44] [5.20] [17.50] [−11.16] [250.81]Negative switchers Regular payers (matched sample)
T+3 73.86 0.63 1.25 65.9 1.53 58.4 104.00 6.86 1.89 90.6 10.62 21.9[501.35] [−4.31] [4.03] [29.20] [−3.98] [136.78] [635.05] [8.71] [2.42] [86.49] [11.71] [40.9]
T+2 74.42 −3.09 1.44 68.1 0.72 60.1 99.17 6.45 1.89 89.9 10.09 21.9[443.37] [−7.69] [3.71] [9.19] [−2.15] [135.24] [537.1] [8.55] [2.55] [85.48] [11.60] [42.8]
T+1 88.83 −2.30 1.30 75.2 −0.83 66.9 98.75 6.13 1.91 88.7 10.06 23.3[461.77] [−0.07] [2.14] [45.68] [−8.87] [185.04] [485.41] [5.57] [3.19] [82.87] [11.58] [60.9]
T 98.57 −2.67 1.43 79.1 −1.56 53.6 98.11 6.88 1.81 88.2 10.35 22.2[424.61] [−7.36] [3.66] [73.05] [−8.27] [87.59] [430.73] [8.97] [3.60] [81.02] [11.83] [93.6]
T−1 100.12 4.90 1.42 80.6 5.88 49.1 85.70 6.35 1.94 87.0 10.61 20.7[413.45] [3.75] [2.01] [68.38] [7.11] [87.40] [416.00] [7.83] [3.5] [81.77] [11.85] [46.7]
T−2 110.55 5.10 1.64 82.8 7.67 48.1 83.36 8.24 1.88 86.9 10.31 26.7[443.56] [8.09] [3.20] [74.40] [7.66] [80.72] [442.08] [11.4] [3.05] [82.09] [11.99] [49.0]
T−3 102.70 6.88 1.86 83.1 8.12 45.6 76.77 6.58 1.81 85.5 10.74 28.0[452.27] [10.86] [3.01] [76.21] [8.58] [90.60] [403.04] [7.00] [2.97] [81.26] [11.19] [60.8]
Panel A reports median and mean (in brackets) values for measures of profitability, growth opportunities, firm size, earned-to-contributed capital mix, and borrowing ratio for switchers and matched non-switchers. Panel B presents median and mean (in brackets) values of the same set of independent variables for the full samples of regular payers and regular non-payers. Each panel has T statistics and P values (in brackets). T statistics and P values for the size variable are computed from log of total assets. The sample period for switchers is 1995-2006. T in the year column indicates the year of switch. During the period under study we have 341 positive switchers and 268 negative switchers. For each positive (negative) switcher, we select a size and industry matched regular payers (regular non-payers) as control firm. Panel B also reports the values of t-tests for the comparative analysis of regular payers and regular non-payers. We measure size as total assets at the end of year t. EBIT, RE, TE, and TA stand for earnings before interest and taxes, retained earnings, shareholders’ equity, and total assets at the end of year t respectively. We measure asset growth as dAt/At; where dAt=At−At−1, and At stands for total assets at the end of current fiscal year t. We define the borrowing ratio as total assets scaled by total liabilities
Year Positive switchers versus negative switchersSize (TA mn€) Asset growth M/B RE/TE EBIT/TA Debt ratio
T+3 5.54 5.11 −0.34 4.38 7.38 −3.93(0.00) (0.00) (0.73) (0.00) (0.00) (0.00)
T+2 5.66 5.71 −1.04 2.24 9.07 −3.56(0.00) (0.00) (0.29) (0.00) (0.00) (0.00)
T+1 4.91 2.32 3.06 3.75 7.65 −3.29(0.00) (0.02) (0.00) (0.00) (0.00) (0.00)
T 3.98 7.90 0.05 −0.98 8.43 −0.35(0.00) (0.00) (0.95) (0.32) (0.00) (0.72)
T−1 1.85 1.99 2.93 −0.54 1.33 2.14(0.06) (0.04) (0.00) (0.58) (0.18) (0.03)
T−2 1.50 0.40 −0.44 −3.00 −1.00 2.69(0.13) (0.68) (0.65) (0.00) (0.31) (0.00)
T−3 1.28 −1.84 0.62 −2.86 −4.24 2.57(0.19) (0.06) (0.53) (0.00) (0.00) (0.01)
Year Positive switchers versus regular non payers (matched sample)Size (TA mn€) Asset growth M/B RE/TE EBIT/TA Debt ratio
T+3 2.86 5.30 0.00 5.92 10.20 −3.02(0.00) (0.00) (0.99) (0.00) (0.00) (0.00)
Panel A.2: T-statistics. and P (in brackets) values
(Contd...)

Ali, et al.: Why do Firms Change Their Dividend Policy?
International Journal of Economics and Financial Issues | Vol 7 • Issue 3 • 2017 417
Panel A.2: (Continued)Year Positive switchers versus negative switchers
Size (TA mn€) Asset growth M/B RE/TE EBIT/TA Debt ratioT+2 3.10 4.53 −0.68 5.16 10.91 −2.65
(0.00) (0.00) (0.49) (0.00) (0.00) (0.00)T+1 2.50 3.77 0.50 3.81 8.17 −2.69
(0.00) (0.00) (0.61) (0.00) (0.00) (0.00)T 1.43 3.86 0.06 0.76 9.65 −0.15
(0.15) (0.00) (0.94) (0.44) (0.00) (0.87)T−1 1.29 1.19 0.95 2.68 6.59 0.39
(0.19) (0.23) (0.34) (0.00) (0.00) (0.69)T−2 2.30 0.62 −1.12 2.38 5.61 −0.09
(0.02) (0.53) (0.26) (0.01) (0.00) (0.92)T−3 1.85 0.97 −0.58 1.58 5.25 0.16
(0.06) (0.33) (0.55) (0.11) (0.00) (0.87)Year Negative switchers versus regular payers (matched sample)
Size (TA mn€) Asset growth M/B RE/TE EBIT/TA Debt ratioT+3 2.65 4.42 −1.10 4.84 7.72 −5.54
(0.00) (0.00) (0.26) (0.00) (0.00) (0.00)T+2 2.35 4.77 −1.38 2.45 9.41 −4.84
(0.01) (0.00) (0.16) (0.01) (0.00) (0.00)T+1 2.51 3.57 2.07 4.56 7.57 −3.32
(0.01) (0.00) (0.03) (0.00) (0.00) (0.00)T 1.62 5.32 −0.21 1.83 8.33 0.10
(0.10) (0.00) (0.83) (0.06) (0.00) (0.91)T−1 2.28 1.34 2.57 3.10 3.46 −4.86
(0.02) (0.17) (0.01) (0.00) (0.00) (0.00)T−2 −0.27 1.56 −0.25 3.42 4.49 −3.35
(0.77) (0.11) (0.79) (0.00) (0.00) (0.00)T−3 −1.21 −1.63 −0.08 2.59 2.79 −1.57
(0.22) (0.10) (0.93) (0.00) (0.00) (0.11)
Panel B.1: Regular payers1995 1996 1997 1998 1999 2000 2001 2002
TA (mn€) 272.67 283.31 319.33 317.43 395.98 376.03 415.31 422.98[2123.36] [2282.06] [2622.52] [2897.22] [3346.35] [3864] [4278.03] [3806.85]
Asset growth 6.57 6.49 7.28 7.71 9.88 11.93 6.83 1.62[8.06] [7.88] [10.25] [10.27] [12.32] [14.41] [8.52] [1.86]
M/B 1.88 1.99 2.17 2.04 2.07 1.92 1.77 1.48[2.49] [2.60] [2.99] [2.86] [3.71] [2.97] [2.49] [1.95]
RE/TE 83.99 85.22 85.53 86.20 86.85 87.79 88.95 88.69[79.81] [79.86] [80.56] [80.62] [82.15] [82.43] [83.68] [83.38]
EBIT/TA 10.50 10.30 10.58 10.66 10.06 10.12 8.69 8.27[11.20] [11.32] [11.87] [11.75] [11.31] [11.3] [9.82] [8.71]
Borrowing ratio 36.47 34.31 34.28 37.72 43.38 44.19 48.76 46.88[55.43] [59.18] [63.46] [107.12] [56.48] [73.31] [81.16] [65.59]2003 2004 2005 2006 2007 2008 2009 2010
TA (mn€) 427.30 475.98 528.91 639.63 735.20 737.35 733.14 874.30[3642.39] [3806.33] [4710.1] [5266.17] [5634.56] [5953.47] [5726.51] [6841.16]
Asset growth 2.14 4.57 10.25 7.72 8.08 6.76 0.33 5.98[3.01] [5.59] [10.99] [9.24] [10.32] [7.52] [0.28] [6.47]
M/B 1.84 2.07 2.30 2.56 2.39 1.33 1.65 1.83[2.34] [2.69] [2.89] [3.17] [3.04] [1.83] [2.28] [2.53]
RE/TE 88.56 89.57 90.21 90.63 91.30 91.29 91.78 92.51[83.95] [84.68] [84.65] [86.33] [87.84] [87.6] [87.9] [88.54]
EBIT/TA 7.93 8.88 9.29 9.79 10.21 8.81 7.47 7.99[8.89] [10.21] [10.83] [11.45] [11.79] [10.23] [8.5] [9.49]
Borrowing ratio 48.17 45.37 43.63 45.38 45.45 51.83 44.55 42.88[68.12] [61.44] [79.14] [76.06] [79.89] [99.35] [93.87] [80.12]
Annual median, and mean (in brackets) values

Ali, et al.: Why do Firms Change Their Dividend Policy?
International Journal of Economics and Financial Issues | Vol 7 • Issue 3 • 2017418
same years, but after the dividend switch, positive switchers become significantly more profitable than negative switchers. Although, negative (positive) switchers were consistent payers (non-payers) in pre-switch years, they were still significantly less (more) profitable than regular payers (regular non-payers). In other words, operating performance is the primary factor that differentiates switchers from their matched peers.
These findings are consistent with the Lintner’s (1956) proposition that predicts that changes in earnings precede dividend changes, and that changes in earnings followed by dividend changes in the same direction indicate that these changes are permanent in nature and will be sustained in future.
4.1.4. Retained earnings-to-owner’s equityTable 2 reports that during the pre-switch period negative switchers have higher RE/TE ratio than positive switchers. But, around the
Regular non-payers1995 1996 1997 1998 1999 2000 2001 2002
TA (mn€) 34.18 31.13 32.60 16.55 19.40 37.85 31.58 20.05[319.7] [316.57] [254.21] [191.11] [189.23] [204.14] [285.5] [231.45]
Asset growth 8.13 8.66 8.30 17.10 17.74 39.27 1.68 −10.49[5.10] [10.07] [9.83] [9.73] [17.76] [36.24] [−10.03] [−29.61]
M/B 2.26 2.80 2.78 2.03 3.13 2.87 1.74 1.18[5.79] [5.36] [6.38] [4.18] [5.84] [5.28] [3.54] [3.56]
RE/TE 32.97 39.89 56.82 57.99 62.34 80.23 74.47 68.09[6.47] [6.22] [15.47] [−11.23] [10.07] [47.13] [−19.4] [−13.98]
EBIT/TA −1.08 −0.02 1.37 −5.42 −2.43 −5.24 −12.13 −14.86[−10.89] [−18.64] [−8.37] [−19.13] [−15.91] [−16.56] [−33.08] [−40.09]
Borrowing ratio 43.91 18.52 31.79 18.45 14.33 6.15 11.05 16.86[175.16] [137.28] [162.42] [113.64] [83.44] [124.43] [149.88] [124.86]
2003 2004 2005 2006 2007 2008 2009 2010TA (mn€) 18.18 16.29 18.73 23.89 30.09 31.87 36.90 46.77
[160.58] [166.01] [306.15] [815.33] [1291.56] [1312.22] [1454.5] [1887.3]Asset growth −4.68 7.75 18.01 13.05 13.74 8.62 −1.72 5.60
[−9.89] [7.82] [18.98] [10.9] [10.61] [1.37] [−12.98] [4.48]M/B 1.91 2.23 2.25 2.37 2.07 0.92 1.46 1.70
[4.66] [4.31] [3.95] [4.18] [3.46] [1.98] [3.14] [4.65]RE/TE 65.97 71.79 76.17 78.59 80.97 80.08 77.51 79.03
[−26.93] [−34.77] [12.56] [−5.04] [29.54] [20.3] [10.27] [15.22]EBIT/TA −8.75 −4.11 −3.87 −4.72 −3.95 −5.39 −4.68 −1.34
[−21.59] [−16.65] [−13.64] [−19.05] [−17.54] [−19.59] [−19.48] [−10.49]Borrowing ratio 13.81 9.99 9.41 9.45 12.16 15.15 20.20 16.26
[88.92] [123.11] [72.78] [116.69] [54.23] [91.26] [136.34] [114.55]Annual median, and mean (in brackets) values
Panel B.2: Regular payers versus regular non payers1995 1996 1997 1998 1999 2000 2001 2002 2003 2004 2005 2006 2007 2008 2009 2010
TA (log) 9.53 8.74 10.61 15.78 17.16 19.00 6.35 6.52 25.82 27.53 27.49 34.64 33.57 31.64 29.83 28.25(0.00) (0.00) (0.00) (0.00) (0.00) (0.00) (0.00) (0.00) (0.00) (0.00) (0.00) (0.00) (0.00) (0.00) (0.00) (0.00)
Asset growth 0.53 −0.39 0.09 0.13 −1.84 −9.07 5.17 7.67 4.82 −1.02 −4.09 −0.72 −0.13 2.51 5.59 1.29(0.59) (0.69) (0.92) (0.89) (0.06) (0.00) (0.00) (0.00) (0.00) (0.30) (0.00) (0.47) (0.89) (0.01) (0.00) (0.19)
M/B −2.72 −3.17 −2.85 −2.01 −1.81 −5.07 −3.59 −2.35 −5.03 −3.11 −3.65 −2.98 −1.72 −0.65 −2.85 −4.44(0.00) (0.00) (0.00) (0.04) (0.07) (0.00) (0.00) (0.01) (0.00) (0.00) (0.00) (0.00) (0.08) (0.51) (0.00) (0.00)
RE/TE 5.56 5.15 6.68 5.53 6.03 7.69 5.28 6.72 6.31 5.11 6.05 6.64 10.15 9.52 8.07 7.17(0.00) (0.00) (0.00) (0.00) (0.00) (0.00) (0.00) (0.00) (0.00) (0.00) (0.00) (0.00) (0.00) (0.00) (0.00) (0.00)
EBIT/TA 5.92 4.91 6.56 9.77 9.38 14.71 13.98 9.65 9.2 12.84 20.15 15.54 11.93 14.71 14.24 13.77(0.00) (0.00) (0.00) (0.00) (0.00) (0.00) (0.00) (0.00) (0.00) (0.00) (0.00) (0.00) (0.00) (0.00) (0.00) (0.00)
Borrowing ratio −2.12 −2.04 −3.00 −2.20 −1.61 −1.32 −1.01 −1.68 −1.08 −2.51 0.56 −0.98 2.07 0.42 −2.98 −1.43(0.03) (0.04) (0.00) (0.02) (0.10) (0.18) (0.30) (0.09) (0.27) (0.01) (0.56) (0.32) (0.03) (0.66) (0.18) (0.15)
T-statistics, and P values (in brackets)
switch year, a sharp increase (decline) appears in the ratio for positive (negative) switchers. It rises from 51% (T−3) to 91% (T+3) for positive switchers, and falls from 76% (T−3) to 66% (T+3) for negative switchers. Thus, the proportion of retained earnings in positive switchers’ equity becomes significantly higher than that of negative switchers during the post-switch period.
Around the switch year, positive switchers have a significantly higher RE/TE ratio than size and industry matched non-switchers (regular non-payers). Similarly during the post switch years, negative switchers have a significantly lower RE/TE ratio than their size and industry matched non-switchers (regular payers). Furthermore, Table 2 shows that regular dividend payers (full sample) have consistently and significantly higher RE/TE ratios than regular non-payers (full sample) during the sample period. These findings suggest that dividend payments are positively associated with RE/TE. This is consistent with the life cycle theory

Ali, et al.: Why do Firms Change Their Dividend Policy?
International Journal of Economics and Financial Issues | Vol 7 • Issue 3 • 2017 419
and the free cash flow theory of dividends. Both these theories predict that mature firms are more likely to pay dividends.
4.1.5. Borrowing ratioTable 2 reports that the borrowing ratio of positive switchers declines from 265.6 (T−3) to 64.2 (T+3). This could either be because of debt repayment or due to funds raised from equity markets. Negative switchers are more significantly indebted than positive switchers or regular payers (matched sample) during the post switch years. Similarly, regular non-payers (full sample) have significantly higher borrowing ratios than regular payers (full sample). These findings suggest a negative association between dividend payment and leverage.
4.1.6. AgeAppendix 1 shows age distribution of the sample firms. Consistent with Fama and French (2001), regular payers are older than all of the other dividend groups. For the period 1990-2010, averages of annual medians of age are 56 and 21 years for regular payers and regular non-payers respectively. Negative switchers (35 years) are slightly older than positive switchers (33 years). These findings suggest that old firms are less likely to change their dividend policy in the long run.
4.1.7. SummaryFirms in the regular payers group tend to be larger, older, and more profitable than those in the other dividend groups. Positive switchers are larger than negative switchers. These results cast doubt on signaling as a first-order determinant of dividend policy, as larger firms are followed by more analysts and are much more exposed to outsiders than smaller, newly registered firms. Regular non-payers exhibit high growth opportunities but low profitability. This induces them to retain earnings for financing their investment opportunities. Negative switchers, however, stop paying dividends because of poor operating performance. During the switch window, the improvement of profitability, size, asset growth and earned-to-contributed equity mix (RE/TE), and a decline in the debt ratio suggest that higher earnings enable positive switchers to pay dividends, reinvest part of their earnings, and repay part of their debts2. Positive switchers, once they start dividend payments, adopt several characteristics of regular payers. For instance both have very similar borrowing ratios, profitability ratios, and earned-to-contributed capital mix. Negative switchers are smaller in size than the other dividend groups. Their asset growth and profitability declines sharply, and their borrowing ratios rise around the switch year. Regular dividend payers are the largest in size as compared with the rest of the dividend groups. They exhibit higher profitability, and more retained earnings compared to their total equity than regular non-payers.
4.2. Logit RegressionsThe previous section, through univariate analyses, examines and compares the characteristics of various dividend groups. This study also examines how these characteristics evolve over time. This section uses logit regression to challenge the univariate findings. The study uses a matched sample method. For each positive
2 Beside earnings, the issue of new ordinary shares may also result in an increase in size, asset growth ratio and a decline in borrowing ratio.
(negative) switcher this study selects a year, size, and industry matched regular non payer (regular payer) as control firm in the year of switch. Thus, during the switch window each pair of firms faces the same market conditions3.
4.2.1. Positive switchersA positive switcher is a firm that has never paid dividends (during its Datastream history) before the year of switch, and after the switch year never omits them till the year of its delistment or year 2010, whichever is earlier. As mentioned above, the study has 341 positive switchers and 340 size and industry matched non-switchers (regular non-payers). The switch window consists of 7 years, starting from year T−3 to year T+3. Year T is the year of switch. The study measures averages for all independent variables for the pre-switch years (T−3 to T) and name them “L”. Similarly, it averages the 3 year
3 For further confirmation we construct matched samples of control firms on the basis of year, size, sector, andprofitability and the results are similar to those we report here.
Table 3: Cross-sectional logit regressions for positive switchers (size and industry matched)Column 1 (1) Column 2 (2)Log assets 0.000 Log assets 0.000
(0.409) (0.158)L-asset growth 0.450 D-asset growth −0.023
(0.132) (0.929)L-market to book −0.000 D-market to book −0.004
(0.996) (0.681)L-earned equity to equity
0.354*** D-earned equity to equity
−0.059*
(0.005) (0.081)L-EBIT/assets 2.535*** D-EBIT/assets 2.408***
(0.000) (0.000)L-borrowing ratio 0.000*** D-borrowing ratio −0.000***
(0.003) (0.003)Constant −0.464*** Constant −0.123
(0.001) (0.173)Pseudo-R2 (%) 5.79%Observations 659F-asset growth 0.000*
(0.082)F-market to book −0.023
(0.457)F-earned equity to equity
1.051***(0.001)
F-EBIT/assets 15.267***(0.000)
F-borrowing ratio −0.001*(0.057)
Constant −1.32***(0.000)
Pseudo-R2 (%) 33.8% 5.60%Observations 599 583***P<0.01, *P<0.1. Logit estimates of factors leading to a positive dividend switch. The dependent variable equals 1 if a firm is positive switcher and 0 if it is a regular non-payer. A positive switcher is a firm that has never paid dividends before the switch year but has never omitted dividend payments after the switch. The sample includes 341 positive switchers and 340 size and industry matched non-switchers (regular non-payers). “L” stands for pre switch period and is the average of values of independent variables over the 4 years ending in the year of switch (T). “F” stands for post switch period and is the average over the 3 years following the year of switch. “D” stands for the difference between F and L (i.e., F-L). Column 1 the P values are calculated from bootstrapped robust standard errors with 500 repetitions
Ali, et al.: Why do Firms Change Their Dividend Policy?
International Journal of Economics and Financial Issues | Vol 7 • Issue 3 • 2017420
(from T+1 to T+3) values and uses the letter “F” to distinguish them from other values. To find whether positive switchers experience significant changes in their characteristics around the switch, this study, subtracts “L” values from “F” values and name these values “D”. Then estimates logit regressions to identify factors that trigger positive switches (Table 3). The dependent variable equals 1 if the firm is a positive switcher and zero if it is a regular non-payer. This study uses firm size (log of total assets), profitability (EBIT/TA), asset growth (dAt/At), market-to-book, and borrowing ratio as independent variables. The P values are calculated from bootstrapped robust standard errors with 500 repetitions. Column 1 in Table 3 indicates that positive switchers are likely to be firms with significantly higher profitability and earned-to-contributed capital mix ratio than non-switchers (regular non-payers).
Column 2 reports that the increase in the profitability of positive switchers is higher than the increase in the profitability of regular non-payers. Similarly the decline in the retained earnings ratios and borrowing ratios of positive switchers are higher than those of regular non-payers.
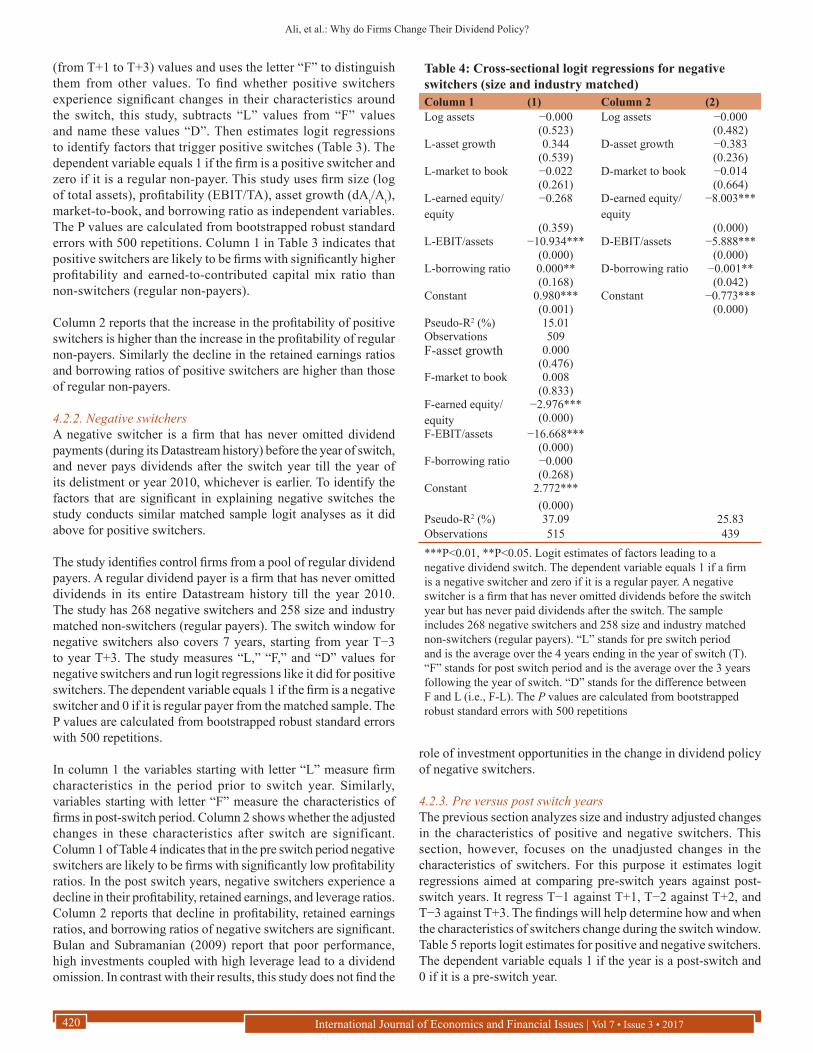
4.2.2. Negative switchersA negative switcher is a firm that has never omitted dividend payments (during its Datastream history) before the year of switch, and never pays dividends after the switch year till the year of its delistment or year 2010, whichever is earlier. To identify the factors that are significant in explaining negative switches the study conducts similar matched sample logit analyses as it did above for positive switchers.
The study identifies control firms from a pool of regular dividend payers. A regular dividend payer is a firm that has never omitted dividends in its entire Datastream history till the year 2010. The study has 268 negative switchers and 258 size and industry matched non-switchers (regular payers). The switch window for negative switchers also covers 7 years, starting from year T−3 to year T+3. The study measures “L,” “F,” and “D” values for negative switchers and run logit regressions like it did for positive switchers. The dependent variable equals 1 if the firm is a negative switcher and 0 if it is regular payer from the matched sample. The P values are calculated from bootstrapped robust standard errors with 500 repetitions.
In column 1 the variables starting with letter “L” measure firm characteristics in the period prior to switch year. Similarly, variables starting with letter “F” measure the characteristics of firms in post-switch period. Column 2 shows whether the adjusted changes in these characteristics after switch are significant. Column 1 of Table 4 indicates that in the pre switch period negative switchers are likely to be firms with significantly low profitability ratios. In the post switch years, negative switchers experience a decline in their profitability, retained earnings, and leverage ratios. Column 2 reports that decline in profitability, retained earnings ratios, and borrowing ratios of negative switchers are significant. Bulan and Subramanian (2009) report that poor performance, high investments coupled with high leverage lead to a dividend omission. In contrast with their results, this study does not find the
Table 4: Cross-sectional logit regressions for negative switchers (size and industry matched)Column 1 (1) Column 2 (2)Log assets −0.000 Log assets −0.000
(0.523) (0.482)L-asset growth 0.344 D-asset growth −0.383
(0.539) (0.236)L-market to book −0.022 D-market to book −0.014
(0.261) (0.664)L-earned equity/equity
−0.268 D-earned equity/equity
−8.003***
(0.359) (0.000)L-EBIT/assets −10.934*** D-EBIT/assets −5.888***
(0.000) (0.000)L-borrowing ratio 0.000** D-borrowing ratio −0.001**
(0.168) (0.042)Constant 0.980*** Constant −0.773***
(0.001) (0.000)Pseudo-R2 (%) 15.01Observations 509F-asset growth 0.000
(0.476)F-market to book 0.008
(0.833)F-earned equity/equity
−2.976***(0.000)
F-EBIT/assets −16.668***(0.000)
F-borrowing ratio −0.000(0.268)
Constant 2.772***(0.000)
Pseudo-R2 (%) 37.09 25.83Observations 515 439***P<0.01, **P<0.05. Logit estimates of factors leading to a negative dividend switch. The dependent variable equals 1 if a firm is a negative switcher and zero if it is a regular payer. A negative switcher is a firm that has never omitted dividends before the switch year but has never paid dividends after the switch. The sample includes 268 negative switchers and 258 size and industry matched non-switchers (regular payers). “L” stands for pre switch period and is the average over the 4 years ending in the year of switch (T). “F” stands for post switch period and is the average over the 3 years following the year of switch. “D” stands for the difference between F and L (i.e., F-L). The P values are calculated from bootstrapped robust standard errors with 500 repetitions
role of investment opportunities in the change in dividend policy of negative switchers.
4.2.3. Pre versus post switch yearsThe previous section analyzes size and industry adjusted changes in the characteristics of positive and negative switchers. This section, however, focuses on the unadjusted changes in the characteristics of switchers. For this purpose it estimates logit regressions aimed at comparing pre-switch years against post-switch years. It regress T−1 against T+1, T−2 against T+2, and T−3 against T+3. The findings will help determine how and when the characteristics of switchers change during the switch window. Table 5 reports logit estimates for positive and negative switchers. The dependent variable equals 1 if the year is a post-switch and 0 if it is a pre-switch year.

Ali, et al.: Why do Firms Change Their Dividend Policy?
International Journal of Economics and Financial Issues | Vol 7 • Issue 3 • 2017 421
Table 5: Logit regressions for pre versus post switch yearsVariables Positive switchers Negative switchers
T−3 to T+3 T−2 to T+2 T−1 to T+1 T−3 to T+3 T−2 to T+2 T−1 to T+1Total assets (log) 0.00** 0.00 0.00 −0.07 −0.12** −0.06
(0.04) (0.12) (0.11) (0.18) (0.02) (0.13)Asset growth −0.26 −0.66 −0.28 −0.44 −1.25** −0.15
(0.70) (0.22) (0.52) (0.51) (0.01) (0.24)Market/book −0.02 −0.02 −0.00 −0.02 −0.00 0.05*
(0.49) (0.49) (0.96) (0.19) (0.91) (0.07)RE/TE 2.22*** 1.35*** 0.76** −2.07*** 0.05 −0.21
(0.00) (0.00) (0.01) (0.00) (0.23) (0.19)EBIT/TA 13.21*** 7.50*** 3.29*** −8.24*** −6.01*** −5.15***
(0.00) (0.00) (0.00) (0.00) (0.00) (0.00)Debt ratio −0.00 0.00 −0.00 0.00 (0.00) (0.00)
(0.43) (0.32) (0.82) (0.27) (0.81) (0.57)Constant −1.45*** −0.82** −0.51* 2.39*** 1.46** 0.60
(0.00) (0.01) (0.09) (0.00) (0.01) (0.21)Observations 352 400 481 300 360 412r2_P 0.29 0.12 0.04 0.22 0.11 0.10χ2 125.3 62.26 26.86 94.61 57.76 58.68***P<0.01, **P<0.05, *P<0.1. The table reports logit estimates of pre-switch years against post-switch years for both positive and negative switchers. The dependent variable equals one for years of the post-switch period, and zero for years of the pre-switch one. T stands for the year of switch. The data for the independent variables are winsorized. The full sample includes 341 positive switchers and 268 negative switchers. These firms changed their dividend policies between 1994 and 2006. The smaller sample period enables us to follow firms’ dividend payment behavior before and after the year of switch. We took the sample period of 1994-2006 in order to be able to follow firms past dividend behaviour. All the variables are defined in Appendix A
Consistent with previous findings, coefficients associated with profitability are highly significant and positive for positive switchers, and negative and significant for negative switchers. This suggests that positive switches are associated with a significant increase in profitability from the pre-switch years to the post-switch ones. Conversely, a decrease in profitability between the pre-switch period and the post-switch one leads to a negative switch. Coefficients of the RE/TE ratio are systematically significant and positive for positive switchers indicating a significant growth in the proportion of retained earnings in the equity of positive switchers.
In contrast, negative switchers register a decline in the retained earnings ratio. For positive switchers, the coefficient of the size variable is positive and significant for year T+3, indicating an increase in the size of positive switchers over the 7-year window under consideration. For negative switchers, the coefficient of the size variable is negative for year T+2 only, indicating a decline in the size of negative switchers during the post switch period.
5. CONCLUSION
To better understand the motivation behind dividends payment, this study takes a closer look at the factors that lead to permanent changes in dividend policy of firms. The focus is on changes in characteristics of positive and negative switchers in 7 year window around dividend policy switch. Both the univariate and multivariate findings suggest that Positive (negative) switchers experience significant and relatively permanent improvement (decline) in current and/or previous year’s profitability. For positive switchers the improvement in profitability, size and earned-to-contributed equity mix and a decline in the debt ratio suggest that higher earnings enable positive switchers to pay dividends, reinvest part of their earnings, and repay part of their debts. Positive switchers, once start dividends payment, adopt characteristics of regular payers. Negative switchers are young
and small, and their profitability declines sharply and borrowing ration rises around switch year.
Regular dividend payers are larger, older, more profitable, and less investment opportunities. In contrast, regular non-payers are young, small, less profitable firms with greater investment opportunities and low retained earnings ratio. For switchers, earnings changes precede dividend changes. These findings are consistent with the life cycle theory of dividends and the Lintner’s (1956) proposition and do not support the signaling theory of dividends.
REFERENCES
Baker, H. (1989), Why companies pay no dividends. Akron Business and Economic Review, 20, 48-61.
Baker, M., Wurgler, J. (2004), A catering theory of dividends. Journal of Finance, 59(3), 1125-1165.
Benartzi, S., Michaely, R., Thaler, R. (1997), Do changes in dividends signal the future or the past? The Journal of Finance, 52(3), 1007-1034.
Benito, A., Young, G. (2003), Hard times or great expectations? Dividend omissions and dividend cuts by UK firms. Oxford Bulletin of Economics and Statistics, 65(5), 531-555.
Bhattacharya, S. (1979), Imperfect information, dividend policy, and “the bird in the hand” fallacy. The Bell Journal of Economics, 10(1), 259-270.
Black, F. (1976), The dividend puzzle. Journal of Portfolio Management, 2, 5-84.
Blau, B.M., Fuller, K.P. (2008), Flexibility and dividends. Journal of Corporate Finance, 14(2), 133-152.
Brav, A., Graham, J.R., Harvey, C.R. (2005), Payout policy in the 21st century. Journal of Financial Economics, 77(3), 483-527.
Bulan, L., Subramanian, N., Tanlu, L. (2007), On the timing of dividend initiations. Financial Management, 36(4), 31-65.
Bulan, L.T., Subramanian, N. (2009), A Closer Look at Dividend
Ali, et al.: Why do Firms Change Their Dividend Policy?
International Journal of Economics and Financial Issues | Vol 7 • Issue 3 • 2017422
Omissions: Payout Policy, Investment and Financial Flexibility. Working Paper Series No. 2.
DeAngelo, H., DeAngelo, L. (1990), Dividend policy and financial distress: An empirical investigation of troubled NYSE firms. Journal of Finance, 45(5), 1415-1431.
DeAngelo, H., DeAngelo, L., Skinner, D.J. (2004), Are dividends disappearing? Dividend concentration and the consolidation of earnings. Journal of Financial Economics, 72(3), 425-456.
DeAngelo, H., DeAngelo, L., Stulz, R.M. (2006), Dividend policy and the earned/contributed capital mix: A test of the life-cycle theory. Journal of Financial Economics, 81(2), 227-254.
Denis, D.J., Osobov, I. (2008), Why do firms pay dividends? International evidence on the determinants of dividend policy. Journal of Financial Economics, 89(1), 62-82.
Dyl, E.A., Weigand, R.A. (1998), The information content of dividend initiations: Additional evidence. Financial Management, 27(3), 27-35.
Easterbrook, F. (1984), Two agency-cost explanations of dividends. The American Economic Review, 74(4), 650-659. Available from: http://www.jstor.org/stable/1805130.
Fama, E.F., French, K.R. (2001), Disappearing dividends: Changing firm characteristics or lower propensity to pay? Journal of Financial Economics, 60(1), 3-43.
Goergen, M., Renneboog, L., Correia-da-Silva, L. (2005), When do German firms change their dividends? Journal of Corporate Finance, 11(1-2), 375-399.
Grullon, G., Michaely, R., Swaminathan, B. (2002), Are dividend changes a sign of firm maturity? The Journal of Business, 75(3), 387-424.
Healy, P.M., Palepu, K.G. (1988), Earnings information conveyed by dividend initiations and omissions. Journal of Financial Economics, 21(2), 149-175.
Jensen, M. (1986), Agency costs of free cash flow, corporate finance, and takeovers. The American Economic Review, 76(2), 323-329. Available from: http://www.jstor.org/stable/1818789.
Jensen, M.C., Meckling, W.H. (1976), Theory of the firm: Managerial behavior, agency costs and ownership structure. Journal of Financial Economics, 3(4), 305-360.
John, K., Williams, J. (1985), Dividends, dilution, and taxes: A signaling equilibrium. The Journal of Finance, 40(4), 1053-1070.
Karpavičius, S. (2014), Dividends: Relevance, rigidity, and signaling. Journal of Corporate Finance, 25, 289-312.
Lintner, J. (1956), Distribution of incomes of corporations among dividends, retained earnings and taxes. American Economic Review, 46(2), 97-113.
Lipson, M.L., Maquieira, C.P., Megginson, W. (1998), Dividend initiations and earnings surprises. FM: The Journal of the Financial Management Association, 27(3), 36.
Miller, M.H., Modigliani, F. (1961), Dividend policy, growth, and the valuation of shares. The Journal of Business, 34(4), 411-433.
Miller, M.H., Rock, K. (1985), Dividend policy under asymmetric information. The Journal of Finance, 40(4), 1031-1051.
Payne, B. (2011), On the financial characteristics of firms that initiated new dividends during a period of economic recession and financial market turmoil. Journal of Economics and Finance, 35(2), 149-163.
Rozeff, M. (1982), Growth, beta and agency costs as determinants of dividend payout ratios. Journal of Financial Research, 5, 249-259.
Sawicki, J. (2005), An Investigation into the Dividend of Firms in East Asia. Working Paper.
Smith, C.W.Jr., Watts, R.L. (1992), The investment opportunity set and corporate financing, dividend, and compensation policies. Journal of Financial Economics, 32(3), 263-292.
Stulz, R. (1988), Managerial control of voting rights: Financing policies and the market for corporate control. The Distribution of Power among Corporate Managers, Shareholders, and Directors, 20, 25-54.
Twu, M. (2010), Prior payment status and the likelihood to pay dividends: International evidence. Financial Review, 45(3), 785-802.
Venkatesh, P.C. (1989), The impact of dividend initiation on the information content of earnings announcements and returns volatility. The Journal of Business, 62(2), 175-197.
Von Eije, J., Megginson, W. (2006), Dividend Policy in the European Union. Available from: https://www.ssrn.com/abstract=891035.
Wang, M.H., Ke, M.C., Liu, D.Y., Huang, Y.S. (2011), Dividend policy and the life cycle hypothesis: Evidence from Taiwan. International Journal of Business and Finance Research, 5(1), 33-52.