whrc workshop 8-12 nov 2010, mulawarman
TRANSCRIPT

FOREST BIOMASS & CARBON STOCKS
MAPPING USING SATELLITE IMAGERIES &
ISSUES RELATING TO REDD+ IN MALAYSIA
Hamdan Omar
GeoInformation ProgrammeDivision of Forestry and Environment, FRIM
Workshop on Methods for Biomass Estimation and Forest-Cover MappingWoods Hole Research Center
8-12 October 2010Center for Climate Change Studies, University of Mulawarman, Indonesia

Presentation Outline
• What have we done
• What are we planning to do
• REDD+: Malaysia‟s perspective
2

Hamdan Omar, Mohd Azahari Faidi & Khali Aziz Hamzah
Proc. STSS 2010 | 1-2 June 2010, MS Garden Kuantan
ALOS PALSAR SATELLITE IMAGE FOR
TROPICAL FOREST CARBON STOCK MAPPING
L-BAND SAR SATELLITE IMAGE FOR TROPICAL
FOREST BIOMASS ESTIMATION
Hamdan Omar, Khali Aziz Hamzah & Abd Rahman Kassim
Journal of Tropical Forest Science (JTFS): Reviewing
1
2

Objective of Study
i) To establish empirical relationship between aboveground carbon stocks and L-band SAR signals,
ii) To determine aboveground biomass and carbon stocks of tropical forest by using L-band SAR data, and
iii) To identify capability of ALOS PALSAR satellite imagery in estimating aboveground biomass and carbon stocks.

Study Area
• Forest Research Institute Malaysia (FRIM) covers some 485.2 ha site in Kepong, Selangor.
• Surrounded by the Bukit Lagong Forest Reserve.
• Most of the forest trees standing in FRIM area are planted forest. Out of the total area of 485.2 ha, 420.11 ha (86.58%) are covered by forest and 379.98 ha (or 90.4%) of them are planted forest and the remaining 40.12 ha is natural forest.
• The age of most of the trees here are about 80 years old, which were planted since year 1929.


Materials & Methodology
Satellite Data
The Japanese Advanced Land Observing Satellite (ALOS), which carries polarimetric Phased Array L-band Synthetic Aperture Radar (PALSAR) satellite data was used in this study.
ALOS PALSAR image that was used in this research was acquired on 3rd October 2009 and has spatial resolution of 12 m.

Field Inventory Data
Field survey was carried out and more than 30 plots of 50 x 50 m size were established within the study area. The plots covered all forest types and various ages.
All the trees with the size of dbh of more than five centimetre (≥ 5 cm) were inventoried.

Design of the plots that were distributed and laid on the ground in the study area.

Plots were laid on the ground and the centre coordinate was recorded.
PLOT CENTER
NW
NE
SW
SE

Distance metric tape
Inventory Equipments
HypsometerLaser range for tree
height and slope measurements
Hand held GPS
Diameter TapeDBH measurement

Ground data collection

Ground data collection

High biomass & carbon concentration
Medium biomass & carbon concentration
Low biomass & carbon concentration
Dominant types of standing
trees that are found in the study area. Most of the
trees are above 25 m height
and reach up to 45 m.

Biomass equations to calculate AGB were based on Kato et al. (1978). The allometric function of trees applied in the calculation of standing biomass can be expressed as
1/H = 1/(2.0*D)+1/61
From the values of D and H, the dry mass values of stem, branches and leaves of the tree are estimated.
Ms = 0.0313*(D2H)0.9733Mb = 0.136*Ms1.0701/Ml = 1/(0.124Ms0.794)+1/125
where;H = total tree heightD = stem diameter at breast height (dbh)Ms, Mb and Ml denote the dry mass of stem, branches and leaves respectively.
Above Ground Biomass

Plot 05
Plot 07
Plot 09
Plot 04
SAR signals at the corresponding plots were sampled
out to generate empirical equation.

Radar band X C L P
Wavelength (cm) 2.4 – 3.75 3.75 – 7.5 15 - 30 30 – 100
Main scatterers Leaves, Twigs
Leaves, Small
branches
Branches, Trunk
Trunk
Response of SAR to the forest structure

Weak signalSmall stands
Strong signalDense standsHigh Biomass
Relationship between biomass and L-Band ALOS PALSAR signal

Results
The results found that the live aboveground woody biomass ranged from 25.9 to 569.3 t ha−1 with the dominant value of 193.6 t ha-1.
All the pixels values were converted into the unit of carbon stocks (t C ha−1) and found that the distribution of aboveground carbon stocks of forest within study area range from 12.45 to 284.65 t C ha−1.

CategoryRange of Biomass
(t/ha)Percentage of Area Coverage
(%)
Small, growing stands 26 - 116 28.2
Mixed small & mature stands 130 - 155 16.9
Mature, dense stands 168 - 414 51.1
Mature & very dense stands 427 - 569 3.9


Hamdan Omar & Khali Aziz Hamzah
Geoinformation Programme, Forestry and Environment Division
Forest Research Institute Malaysia (FRIM)
52109 Kepong, Selangor
ISFFP 2010 | 5-7 October 2010, Legend Hotel, KL
FOREST STAND VOLUME
ESTIMATION USING SATELLITE SAR
IMAGERY
3

Relationship Between ALOS Palsar Backscatter & Stem Volume
y = 104160e0.4735x
R2 = 0.865
0
50
100
150
200
250
300
350
400
450
500
-19 -18 -17 -16 -15 -14 -13 -12 -11 -10
Backscatter Coefficient (L-HV, dB)
Me
rch
an
tab
le V
olu
me
(m
^3
/ha
)
Scatter plot that consists of measured stem volume and corresponding SAR signal from PALSAR image.
Forested area

Chengalplot
Kapur
Dip & Non-Dip Arboretum
Kepong Botanic Garden

Geoinformation Programme, Environment and Forestry Division
Forest Research Institute Malaysia (FRIM)
52109 Kepong, Selangor
20-23 April 2010 | FRIM, Kepong
TRAINING ON USE OF REMOTE
SENSING FOR ASSESSING FOREST
BIOMASS & CARBON STOCKS
4

Participants listening attentively to the lecture.
Participants brought to the site for field data collection.
Participants learning the field data collection process.
Participants learning image sampling, modelling & mapping processes
A photograph of all participants and organisers.

A photograph of all participants and organisers.

CARBON STOCKS MONITORING ON PEAT
SWAMP FOREST IN PENINSULAR MALAYSIA:
TOWARDS REDD IMPLEMENTATION
Proposed for MOA-ScienceFund26 MEI 2010, FRIM
5

i. To update and map the current extents of peat swamp forest in Peninsular Malaysia,
ii. To quantify extents and changes of carbon stocks from year 2000 to 2010 on peat swamp forest,
iii. To generate spatially distributed map of carbon stock on peat swamp forest over Peninsular Malaysia, and
iv. To demonstrate the use of remote sensing techniques in carbon stocks monitoring for the REDD reporting.
Objectives:

Distribution of PSF in Malaysia:
(i) Pahang (200,000 ha), (ii) Selangor (76,000 ha), (iii)Terengganu (13,000 ha), (iv) Johor (13,000 ha).

MethodologyData acquisitions:
A series of SPOT & ALOS PalSAR imagery(2000 & 2010)
Image ClassificationIdentification of PSF extents in both PRF &
Stateland
Image ClassificationIdentification of PSF extents in both years
Map preparation for peat swamp forests extents
(2000 & 2010)
Field inventory
Plot-to-image sampling
Development of carbon stocks model
Carbon stocks monitoring/mapping
Carbon stocks changes assessment
Validation & Verification
Report preparations
Carbon Stocks Mapping- Using carbon stocks equation
derived from inventory data and SAR signal
SPOT image(2000 & 2010)
SAR image(2000 & 2010)

Output Matrix
Objectives Activities Expected Outputs
To update and map the current extents of peat swamp forest in Peninsular Malaysia,
Acquisitions of satellite and ancillary data A Geographic Information System (GIS) database comprise data layers that indicate previous, current, and changes of extents of peat swamps forests in Peninsular Malaysia,
Satellite image pre-processing
Satellite image classification for delineating peat swamp forests
Map preparation for peat swamp forests extents.
To quantify extents and changes of carbon stocks from year 2000 to 2010 on peat swamp forest,
Field inventory A model, which correlates ground measurement carbon stocks and SAR digital signal number. This model can be a carbon stocks predictor for all peat swamp forests in Malaysia and can be used to update or carbon monitoring in the future,
Plot-to-image sampling
Development of carbon stocks estimation equation
Carbon stocks monitoring
To generate spatially distributed map of carbon stock on peat swamp forest over Peninsular Malaysia, and
Gather information derived from objective (i) and (ii)
Thematic maps that indicate previous, current and changes of stored carbon in peat swamp forests in Peninsular Malaysia, Carbon stocks mapping
To demonstrate the use of remote sensing techniques in carbon stocks monitoring for the REDD reporting.
Carbon stocks changes assessment A project complete report, which will include the readiness for REDD.
Validation & Verification
Report preparations

RESEARCH ON DEVELOPMENT OF FOREST
CARBON MONITORING METHODOLOGIES
FOR REDD+ IN MALAYSIA
A Collaboration between: Forestry And Forest Products Research Institute (FFPRI), Japan
&Malaysian Forestry Research & Development Board (MFRDB): Forest Research Institute Malaysia (FRIM), Malaysia
6

The research aims the following outputs;
i. Land-use and land-use change MRV by satellite remote sensing
ii.Forest carbon change MRV by combination of remote sensing and ground measurements
iii.Social and/or economic drivers of deforestation/forest degradation
iv.Guidelines for development of forest carbon change MRV systems for tropical forest countries

Methdology
Series of satellites data (Landsat TM/ETM+, SPOT XS,
PALSAR)
1995 - 2010
Biomass & Carbon stocks measurements from
permanent sampling plots (PSPs)
Changes in forest area of all forest types :
Inland forest
Peat Swamp forest
Mangrove forest
Plantations forest
Changes in averaged stocks of all forest types
Carbon stocks changes
∑ (Forest areai x Averaged carbon stocki) = Total carbon stocks

REDD+ Malaysia’s Perspectives
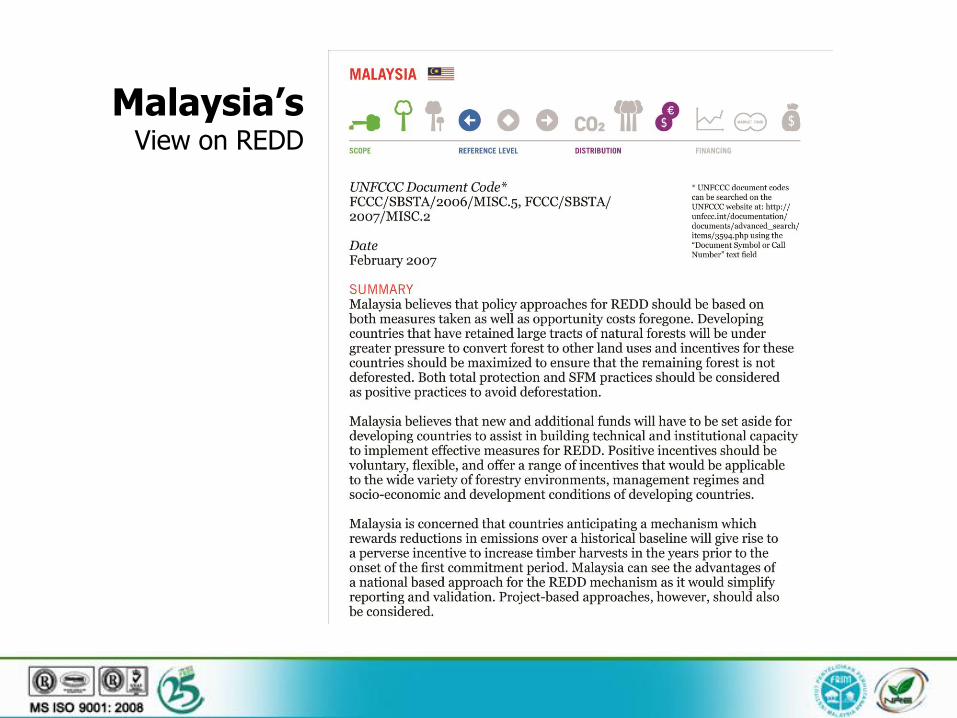
Malaysia’sView on REDD

Are we Ready?
“Readiness” is normally focused on the following national-level priority issues.
• Preparation of national strategies to reduce emissions through local stakeholder consultations,
• Institutional, technical, human capacity building,• Designing/implementing Monitoring, Reporting, and Verification
(MRV) systems, and national forest carbon accounting systems,• Developing national systems for determining baselines and
Reference Emissions Levels,• Transparent, equitable and accountable benefit sharing
mechanisms,• Developing safeguards and grievance mechanisms to protect
the interests of forest communities and the poor• Clarify national land, forest and carbon tenure rights.

Common threads and difficulties
• Inconsistency between criteria of the different programmes
• Excessive demand coupled with insufficient funds
• Incompatibility with national circumstances• Conditions and eligibility criteria• Calls for commitment to an as-yet undefined
instrument

Issues
It is very important to note that any notion of a cap on deforestation has deep and long-lasting implications for developing countries that:
• Have large and growing populations to feed • May already have converted large forest areas (i.e
to agriculture) for this purpose• Need to convert land for housing, industry and
infrastructure as identified as a priority in the Convention
• Need to eradicate poverty

Changes in forests land between 1980 and 2008 with projections to 2020 (Abdul Rashid et al. 2009)

Outstanding issues
• Degradation – the second „D‟ in REDD
• Regulating the voluntary sector
• Aligning REDD with Adaptation
• Resolving competing claims on forests
• Reforming forest governance

Common activities causing forest degradation in the tropics include (GOFC-GOLD, 2008):
• Selective logging• Large-scale and open forest fires• Over exploited of non-timber forest
products and wood for fuel• Shifting cultivation and mining
Challenge How do we measure forest degradation?

Use of remote sensing in MRV due to the forest degradation: Opportunity or challenge?
(GOFC-GOLD, 2008)

• COP -13 in 2007 in Bali outlined possible alternatives to REDD as climate change measure:i. Role of conservation ii. Sustainable forest management (SFM)iii.Enhancement of carbon stocks in developing
countries• Malaysia is now streamlining efforts and
strategies towards conserving and managing it‟s forest on a sustainable basis.
• Malaysia feels that the definitions of deforestation needs to be broad enough to cover various levels and patterns of forest degradation.
Conclusion

Malaysia welcomes early discussion on REDD, which is widely recognized as a highly cost effective method of emissions reduction.
In this regard, Malaysia would like to urge Parties to adopt a positive attitude in negotiations on this matter and support and facilitate the development of a simple and flexible mechanism that will benefit not only the developing countries but more importantly the global climate system.

REDDLong way to go…

Photo: Hamdan O.
THANK YOU