whotcm2006.2a leveli and ii main text -...
TRANSCRIPT
WHO/TCM/2006.2
Harvard Medical School and Harvard Pilgrim Health
Using indicators to measure country pharmaceutical situations
Fact Book on WHO Level I and Level II monitoring indicators

European Community
This document has been produced with the financial assistance of the European Community and the Department for International Development (DFID), UK. The views expressed herein are those of the authors and can therefore in no way be taken to reflect the official opinion of the European Community and the Department for International Development (DFID), UK.
© World Health Organization 2006 All rights reserved. Publications of the World Health Organization can be obtained from Marketing and Dissemination, World Health Organization, 20 Avenue Appia, 1211 Geneva 27, Switzerland (tel: +41 22 791 2476; fax: +41 22 791 4857; email: [email protected]). Requests for permission to reproduce or translate WHO publications – whether for sale or for noncommercial distribution – should be addressed to Publications, at the above address (fax: +41 22 791 4806; email: [email protected]). The designations employed and the presentation of the material in this publication do not imply the expression of any opinion whatsoever on the part of the World Health Organization concerning the legal status of any country, territory, city or area or of its authorities, or concerning the delimitation of its frontiers or boundaries. Dotted lines on maps represent approximate border lines for which there may not yet be full agreement. The mention of specific companies or of certain manufacturers’ products does not imply that they are endorsed or recommended by the World Health Organization in preference to others of a similar nature that are not mentioned. Errors and omissions excepted, the names of proprietary products are distinguished by initial capital letters. The World Health Organization does not warrant that the information contained in this publication is complete and correct and shall not be liable for any damages incurred as a result of its use.

Preface
- i -
PREFACE In 1975, the Twentieth World Health Assembly, in resolution WHA 28.66, stated the need for the World Health Organization (WHO) to develop means by which it can help Member States to formulate national medicines policies. It should also assist countries to implement strategies such as selection of essential drugs, appropriate procurement of quality drugs based on health needs and should provide education and training in various elements of pharmaceutical programmes.
Currently WHO’s work on medicines is guided by the 2004–2007 WHO medicines strategy. Against this backdrop, the Fact Book should be read in the context of the vision that people everywhere have access to the essential medicines they need, that the medicines are safe, effective and of good quality; and that the medicines are prescribed and used rationally. Part of the strategy is regular monitoring and evaluation which underpins every aspect of WHO’s activities in essential medicines. Monitoring and evaluation aim to answer the following questions: Do people have access to essential medicines? Are people getting medicines that are safe, effective and of good quality? Are these medicines being used properly?
There is a dearth of data and information to answer these questions. The conference of experts held in Nairobi in 1985 requested WHO to provide information on the drug situation at the global and national levels. Efforts have been made to develop tools and establish systems to collect and publish data regularly. In 1988 The world drug situation was published. This was updated in 2004 with the publication of The world medicines situation. Indicator tools have also been developed and improved during this time.
The data and information in this Fact Book are the product of several years of work on developing and improving data-gathering tools followed by the systematic gathering of information from countries through questionnaires and surveys. This Fact Book is the synthesis of data and information gathered from countries and also updates some of the information in The world medicines situation.
This Fact Book aims to summarize and provide a picture of the situations of different pharmaceutical sector components and the current status of national drug policies. In some ways this represents an attempt to measure the impact of the efforts of countries, WHO and other agencies that have been involved in and committed to improving pharmaceutical situations. We would therefore appreciate any comments and corrections on the data and information presented here that we can use to further improve the process of data-gathering and information sharing.
It is hoped that this Fact Book can be a useful tool for researchers, policy-makers, planners and others who need such data and information. We also hope that the data and information presented here can be used to inform priorities and set targets, to assess the strengths and weaknesses of strategies, and paint a picture of national and institutional problems. Countries that have done the survey have used the results to review their pharmaceutical implementation plans and adjust the strategies and activities in areas where problems were identified. This Fact Book could also inform international agencies and donors by supplying information that can be used as baseline data and possibly to infer the potential

Using indicators to measure country pharmaceutical situations
- ii -
impact of activities. Professional groups and nongovernmental organizations (NGOs) can use the results to focus their advocacy and information campaigns.
Acknowledgements
- iii -
ACKNOWLEDGEMENTS The development of indicators for monitoring country pharmaceutical situations and the publication of this Fact Book are initiatives of the Department of Technical Cooperation for Essential Drugs and Traditional Medicine. The book was produced with the assistance of the WHO Boston Collaborating Center on Pharmaceutical Policy at the Department of Ambulatory Care and Prevention, Harvard Medical School and Harvard Pilgrim Health Care.
Contributors: Precious Matsoso, German Velasquez and Gilles Forte provided valuable insights on the development of this Fact Book. Jonathan Quick gave support and advice on the development and evolution of the WHO medicines indicator process, including the collection of information from countries.
All data presented in this Fact Book were collected as part of the 2003 Global Medicines Survey (Level I indicators) or through systematic national surveys using the Level II indicators.
The collection of Level I data was coordinated by the WHO Regional Pharmaceutical Advisers/Acting Advisers: Jean-Marie Trapsida (WHO Regional Office for Africa (AFRO); Rosario D’Alessio (WHO Regional Office for the Americas (AMRO); Mohammed Bin Shahna (WHO Regional Office for the Eastern Mediterranean (EMRO); Kees de Joncheere (WHO Regional Office for Europe (EURO); Krisantha Weerasuriya (WHO Regional Office for South-East Asia (SEARO); and Budiono Santoso (WHO Regional Office for the Western Pacific (WPRO). In 2003, national officials in 146 countries completed the questionnaire on structures and processes of country pharmaceutical situations (Level I indicator data). We would like to acknowledge the efforts of our colleagues in countries who gathered these data and who made this Fact Book possible. Diane Whitney, Jorg Hetzke and Pierrick Gonet organized the extraction and computerization of the data.
WHO Regional Advisers assisted in the coordination of country surveys in their respective regions. In 26 countries, multidisciplinary teams devoted time and energy to providing training and to conducting the fieldwork to collect field data on specific aspects of the pharmaceutical situation (Level II indicator data). National teams computerized the data and produced country reports.
Gilles Forte and Helen Tata coordinated and supervised all Level II surveys and country reports in AFRO, supported by Diane Whitney. Martin Auton, Simona Chorliet and Indro Mattei provided technical assistance in training country data collectors and drafting country reports in African countries. Country coordinators were: Vera Lucia Luiza (Brazil); Tatjana Benisheva and Ilko Getov (Bulgaria); Djan Nakoy, Chroeng Sokhan (Cambodia); Pauline Ndam and Rose Ngono (Cameroon); Zarana Bandiang and Daniel B. Robndoh (Chad); Wang Qing (People's Republic of China); Maria Cristina La Torre (Columbia); Alemayehu Lemma and Bekele Tefera (Ethiopia); Martha Gyansa-Lutherodt and Edith Andrews (Ghana); María Celestina de Palma (Guatemala); Charles Kandie (Kenya); Sri Suryawati (Indonesia); Majid Cheraghali (Islamic Republic of Iran); Zinagul Djamanbaeva (Kyrgystan); Lamphone Syhakhang and Sivong Sengaloundeth (Lao People’s Democratic Republic); Mohammad Izsham. (Malaysia); Minkaïla Maiga and Ené Arama (Mali); Balkrishna Khakurel
Using indicators to measure country pharmaceutical situations
- iv -
(Nepal); R.K. Omotayo and Ogori Taylor (Nigeria); Guitelle Baghdadi and Bryan Gunn (Oman); Timoteo Badoy (Philippines); Munyankindi Védaste and Stella Matutina Tuyisenge (Rwanda); Abdoulahath Mangane and Mamadou Ngom (Senegal); Apollo Muhairwe and Joseph Serutoke (Uganda); Rainalds Malele and Rose Shija (United Republic of Tanzania).
The following people reviewed the document and made comments: Majid Cheraghali, Kathy Holloway, Thierry Mertens, Cecilia Oh, Phyllida Jane Travis, Dianne Whitney and Kees de Joncheere. Lynn Weeks contributed to the development of text. Lalit Dwivedi reviewed the report format, Susan Kaplan did the final editing of the report and Claude Da Re did the layout and supervised the printing of the report.
Marsha Pierre-Jacques cleaned and analysed all Level I and Level II data and together with Anita Wagner and Dennis Ross-Degnan, drafted the Fact Book. Edelisa D. Carandang coordinated and supervised the overall process of indicator data collection and the analysis, editing and development.
The Department for International Development (DFID), UK, supported most of the Level II survey in Africa and the European Community (EC) supported the printing of this Fact Book, as well as some country surveys and completion of individual country reports and surveys.
Table of contents
- v -
TABLE OF CONTENTS PREFACE.................................................................................................................................. I ACKNOWLEDGEMENTS.....................................................................................................III TABLE OF CONTENTS..........................................................................................................V LIST OF TABLES................................................................................................................. VII LIST OF FIGURES .................................................................................................................IX ABBREVIATIONS .................................................................................................................XI SUMMARY OF KEY POINTS............................................................................................XIII 1. INTRODUCTION
1.1 Background..............................................................................................................1 1.2 Level I, II and III indicators.....................................................................................1 1.3 Countries providing data..........................................................................................3 1.4 Performance standards for Level II indicators.........................................................4 1.5 Structure of the Fact Book .......................................................................................4
2. NATIONAL MEDICINES POLICY
2.1 Why is this important? .............................................................................................7 2.2 What is the current situation? ..................................................................................7 2.3 Have we made progress? .........................................................................................9
3. LEGISLATION AND REGULATION
3.1 Why is this important? ...........................................................................................11 3.2 What is the current situation? ................................................................................11 3.3 Have we made progress? .......................................................................................14 3.4 Have we achieved desired outcomes?....................................................................14
4. QUALITY CONTROL OF PHARMACEUTICALS
4.1 Why is this important? ...........................................................................................15 4.2 What is the current situation? ................................................................................15
5. MEDICINES FINANCING SYSTEMS AND POLICIES
5.1 Why is this important? ...........................................................................................19 5.2 What is the current situation? ................................................................................19 5.3 Have we made progress? .......................................................................................22
6. PUBLIC SECTOR MEDICINES SUPPLY
6.1 Why is this important? ...........................................................................................25 6.2 What is the current situation? ................................................................................26 6.3 Have we made progress? .......................................................................................27 6.4 Have we achieved the desired outcome? ...............................................................19
7. INTELLECTUAL PROPERTY, PATENTS AND PRODUCTION
7.1 Why is this important? ...........................................................................................29 7.2 What is the current situation? ................................................................................30

Using indicators to measure country pharmaceutical situations
- vi -
8. ACCESS TO ESSENTIAL MEDICINES 8.1 Why is this important? ...........................................................................................33 8.2 What is the current situation? ................................................................................33 8.3 Have we made progress? .......................................................................................34 8.4 Have we achieved desired outcomes?....................................................................35
9. RATIONAL USE OF MEDICINES 9.1 Why is this important? ...........................................................................................37
Essential Medicines Lists, Treatment Guidelines, Formularies 9.2 Why is this important? ...........................................................................................37 9.3 What is the current situation? ................................................................................38 9.4 Have we made progress? .......................................................................................40 9.5 Have we achieved desired outcomes?....................................................................40
Key Policies and Regulations to Promote Rational Use 9.6 Why is this important? ...........................................................................................41 9.7 What is the current situation? ................................................................................42 9.8 Have we achieved desired outcomes?....................................................................43
Education and Information about Rational Use 9.9 Why is this important? ...........................................................................................44 9.10 What is the current situation? ................................................................................45
Accessibility of Medicines Information 9.11 What is the current situation? ................................................................................46 9.12 Have we made progress? .......................................................................................47 9.13 Have we achieved desired outcomes?....................................................................47
10. METHODOLOGICAL LIMITATIONS AND RECOMMENDATIONS
10.1 Accomplishments...................................................................................................51 10.2 Questionnaire limitations and recommendations for improvement.......................51 10.3 Data management limitations and recommendations ............................................52 10.4 Further development of a household survey..........................................................52 10.5 Development of composite scores .........................................................................52
REFERENCES ........................................................................................................................55 ANNEXES...............................................................................................................................57
List of tables
- vii -
LIST OF TABLES Table 1. Status of national medicines policies (NMPs) in 2003............................................8 Table 2. Countries reporting recent indicator assessments ....................................................9 Table 3. Status of national medicines policies (NMPs) in 1999 and 2003 ..........................10 Table 4. Changes in status of national medicines policy (NMPs) from 1999 to 2003 ........10 Table 5. Presence of key pharmaceutical sector legislation.................................................11 Table 6. Legislation and regulation on registration of medicines........................................12 Table 7. Site inspection of establishments as requirement of licensing...............................12 Table 8. Monitoring of adverse drug reactions (ADRs) ......................................................13 Table 9. Legislation on prescribing and substitution of generic medicines in public
and private sectors..................................................................................................13 Table 10. Regulation on generic prescribing and substitution in 1999 and 2003..................14 Table 11. Product samples collected for regulatory purposes ...............................................15 Table 12. Presence of expired medicines in health facilities and warehouses.......................16 Table 13. Policies on medicines pricing covering different sectors ......................................19 Table 14. Use of fees from drug sales to pay salaries............................................................20 Table 15. Free provision of medicines and types of fees in public health facilities ..............20 Table 16. Health insurance and medicines coverage .............................................................21 Table 17. Countries with medicines covered by health insurance in 1999 and 2003 ............22 Table 18. Public medicines budget and per capita drug expenditures in 1999 and 2003 ......22 Table 19. Public sector procurement and distribution systems..............................................26 Table 20. Patent protection and marketing authorization provisions for medicines..............30 Table 21. Number and percentage of countries with capacities for the production of
medicines ...............................................................................................................31 Table 22. Estimated percentage of population with access to essential medicines
by WHO region and country income level ............................................................33 Table 23. Access to essential medicines by country income level, 1999 and 2003...............34 Table 24. Status of essential medicines lists (EMLs), standard treatment guidelines
(STGs) and national medicines formularies ..........................................................39 Table 25. Status of essential medicines lists (EMLs) in 1999 and 2003 ...............................40 Table 26. National standard treatment guideline (STG) status in 1999 and 2003 .................40 Table 27. Presence/availability of essential medicines list (EML) and standard
treatment guidelines (STGs) and adherence to EML in prescribing......................40 Table 28. Regulation of pharmaceutical promotion and advertising .....................................42 Table 29. National policies concerning drug and therapeutics committees (DTCs)
and antimicrobial resistance (AMR)......................................................................42 Table 30. Establishment of drug and therapeutics committees in hospitals ..........................43 Table 31. Over-the-counter (OTC) sales of antibiotics and injections ..................................43 Table 32. Types of basic medicines training available to health workers .............................45 Table 33. Obligatory continuing education on medicines for health care providers .............45 Table 34. Public or independent medicines information for providers and consumers.........46 Table 35. Public education campaigns on rational medicines use topics ..............................46 Table 36. Medicines information for prescribers and dispensers in 1999 and 2003 .............47 Table 37. Quality of treatment of diarrhoea and acute respiratory infections (ARIs) ...........48

Using indicators to measure country pharmaceutical situations
- viii -

List of figures
- ix -
LIST OF FIGURES Figure 1. WHO strategy for monitoring country pharmaceutical situations...........................1 Figure 2. Global status of national medicines policies (NMPs)..............................................8 Figure 3. Countries with national medicines policies (NMPs) in 1999–2003 ........................9 Figure 4. Prescribing by generic name in public facilities ....................................................14 Figure 5. Storage and handling conditions in public health facilities and warehouses.........16 Figure 6. Storage and handling conditions in public pharmacies by country .......................17 Figure 7. Storage and handling conditions in public warehouses by country.......................17 Figure 8. Stock availability of basket of essential medicines in different facilities..............27 Figure 9. Number of days on which key drugs were out of stock in public pharmacies
and warehouses ......................................................................................................28 Figure 10. Adequacy of records to evaluate when key drugs were out of stock.....................28 Figure 11. Estimated access to essential medicines within 1 hour's walking distance
in 1999 and 2003....................................................................................................34 Figure 12. Proportion of prescribed medicines dispensed in public facilities by country ......35 Figure 13. Affordability of pneumonia treatment in children and adults................................35 Figure 14. Countries with essential medicines lists (EMLs) updated within last five years...38 Figure 15. Rates of prescribing medicines from the essential medicines list (EML)
by country ..............................................................................................................41 Figure 16. Prescribing of antibiotics and injections ................................................................47 Figure 17. Medicines labelling and patient knowledge about use ..........................................48 Figure 18. Average number of medicines per prescription in public health facilities ............49
ANNEXES 1. Level I indicator survey form 2. Level II indicator survey and summary forms 3. Description of some Level II indicators reported in this Fact Book 4. Level I data from 2003, by country (alphabetically by country name and income-level
indicators); organized by sections in Level I survey and this final report.* 5. Level II data by country (alphabetically by country name and income-level indicators);
organized by Access (6 indicators), Quality (2 indicators), and Rational Use of Medicines indicators (10 indicators).*
6. Level I data from 1999, by country on variables used for comparisons between 1999 and 2003.*
7. Country income level by region * Available on CD-ROM. Requests should be addressed to the Department of Technical Cooperation for Essential Drugs and Traditional Medicine, World Health Organization, 1211 Geneva 27, Switzerland. Fax: + 41 22 791 4167, e-mail: [email protected]

Using indicators to measure country pharmaceutical situations
- x -
Abbreviations
- xi -
ABBREVIATIONS
ADR Adverse drug reaction AFRO* WHO Regional Office for Africa AMR Antimicrobial resistance AMRO* WHO Regional Office for the Americas ARI Acute respiratory infection DTC Drug and therapeutics committee EDM WHO Essential Drugs and Medicines Policy Department EML Essential medicines list EMRO* WHO Regional Office for the Eastern Mediterranean EURO* WHO Regional Office for Europe GNI Gross national income per capita HIV/AIDS Human immunodeficiency virus/Acquired immunodeficiency syndrome INN International Nonproprietary Name NGO Nongovernmental organization NMP National medicines policy ORS Oral rehydration solution OTC Over-the-counter PAR Policy, Access and Rational Use (WHO team) SEARO* WHO Regional Office for South-East Asia STG Standard treatment guidelines TM/CAM Traditional medicines and complementary and alternative medicines TRIPS Trade-Related Aspects of Intellectual Property Rights WHO World Health Organization WPRO* WHO Regional Office for the Western Pacific WTO World Trade Organization
* WHO regional offices were used to group countries for purposes of regional data summary and analysis.

Using indicators to measure country pharmaceutical situations
- xii -

Summary of key points
- xiii -
SUMMARY OF KEY POINTS
WHO pharmaceutical indicators
The WHA 54.11 WHO medicines strategy acknowledged the four main objectives of WHO’s medicines strategy, namely, to frame and implement policy; to ensure access; to ensure quality, safety and efficacy; and to promote rational use of medicines. To monitor the progress of efforts to improve the global medicines situation, WHO has developed a system of indicators that measure important aspects of a country’s pharmaceutical situation. Level 1 indicators measure the existence and performance of key national pharmaceutical structures and processes. Level II indicators measure key outcomes of these structures and processes in the areas of access, product quality and rational use. These indicators can be used to assess progress over time; to compare situations between countries; and to reassess and prioritize efforts based on the results.
This Fact Book gives the results of the assessment of Level I indicators conducted in 2003 and of Level II indicator surveys conducted between 2002 and 2004. Indicator data are summarized into eight component topics and within groups of countries classified as low-, middle- and high-income. The importance and key points to note on each component topic are introduced at the beginning of each section. Data and information are given in tables and graphs as current situation – result of 2003 Level I survey – and if progress has been made, by comparing Level I 1999 and 2003 surveys. Impact measures are illustrated by the results from Level I and outcome indicators from Level II.
The key findings are summarized below.
National medicines policy
In 1975, the World Health Assembly in resolution WHA28.66 requested WHO to develop means to assist Member States in formulating national drug policies. Thus, WHO recommends that countries consider formulating, implementing and monitoring a national medicines policy (NMP) as a “commitment to a goal and a guide for action” (1, 2) to define a framework for setting and monitoring medium- to long-term objectives in the pharmaceutical sector. The functions and strategies of each component of the policy should be brought together in an implementation plan.
Most countries, especially low-income countries, do have an NMP and implementation plan and most of the NMPs have been updated within the past 10 years. More countries had an official NMP in 2003 than in 1999. Few countries report assessing their pharmaceutical situations with indicators.
Legislation and regulation
A legislative framework is required to implement and enforce pharmaceutical policies both in the public and private sectors. Countries at all income levels report the presence of extensive legal and regulatory frameworks covering all aspects of the pharmaceutical sector. One specific area is policy on the use of generics, with the number of countries reporting that legislation requiring prescribing of generics
Using indicators to measure country pharmaceutical situations
- xiv -
or allowing substitution of generics in either the public or private sectors declining substantially since 1999. The results of a systematic survey of prescribing behaviour, did show that the rate of generic prescribing was 80% or more.
Quality control of pharmaceuticals
Quality control is important to ensure that patients receive medicines that are safe and effective. Drug regulatory authorities should have access to a quality control laboratory to test whether samples of medicines meet the required quality criteria. Quality control extends beyond testing to ensuring that medicines are properly stored and not expired (i.e. have not passed their expiry date).
Low-income countries collect fewer samples for quality control purposes and report higher rates of products that fail to meet quality control standards. None of the health facility surveys found expired products at health facilities, pharmacies or warehouses among the key medicines selected. Storage and handling scores are consistently high in warehouses in most countries. Scores for pharmacy stock areas in public health facilities are also satisfactory.
Medicines financing systems and policies
WHO is committed to guiding countries in the development of strategies to promote fair financing mechanisms to improve the affordability and availability of essential medicines in the private and public sectors (1). Improving the supply of medicines, particularly in the public sector, and increased public funding and provision of medicines benefits through social health insurance and prepayment schemes, including pricing information and policies, are important strategies (1).
Over half of countries have regulations and policies to control the prices of medicines in the public sector, and the percentage is increasing in parallel with increasing country income levels. Middle-income countries are somewhat more likely to regulate medicines prices in the private sector and more likely to subsidize access by providing free medicines for specific diseases in the public sector. Fees are also charged differently: low- and middle-income countries tend to charge flat rate co-payment fees in public health facilities, whereas high-income countries are more likely to charge a percentage co-payment fee.
Less than half as many low-income countries have insurance coverage that includes medicines as higher income countries. Medicines coverage by private insurance increased substantially between 1999 and 2003 in all country income categories.
Public sector medicines supply
A well-coordinated medicines supply system helps to ensure that funds available for purchasing medicines are used effectively and efficiently. An option (1) is to develop an efficient mixed system for supplying medicines with public, private and NGO procurement, storage, and distributions services.
Ministries of health are the main public sector procurement agencies, although individual institutions and NGOs play important roles in low-income countries. National competitive tender is the primary purchasing process in the majority of

Summary of key points
- xv -
countries, especially middle- and high-income countries, whereas international tender and negotiation or direct purchasing are widely used in low-income countries.
The proportion of countries that limit procurement to drugs contained in the national EML declines with increasing income.
The survey of health facilities showed that on average, more than 80% of key medicines are available in public and private pharmacies and public warehouses.
Intellectual property rights, patents and local production
Intellectual property rights have an important impact on the affordability and availability of medicines and thereby public health (1). The WTO Agreement on Trade-Related Aspects of Intellectual Property Rights (TRIPS) requires WTO member countries to implement and enforce minimum standards of intellectual property rights. However, the 2001 Doha Declaration on the TRIPS Agreement and Public Health had confirmed that TRIPS-compliant mechanisms and flexibilities can be used to enable access to lower priced medicines.
There are problems however in the manner in which the provisions for the TRIPS flexibilities are incorporated into national laws; thus the information on TRIPS flexibilities, such as parallel import, compulsory licensing and the early working exception, has limitations as presented in this Fact Book.
Taking into consideration these limitations and the way questions were asked in a comprehensive survey, it is reported that over 80% of high- and middle-income countries have patent protection for pharmaceutical products, compared to only half of low income countries. Only 1 in 3 low- and middle-income countries have parallel importation provisions in their legislation compared with two thirds of high-income countries. By 2003, 28 of 59 WTO member countries which participated in the survey were taking advantage of provisions allowing a transitional period to comply with TRIPS Article 65.
In this section local production was also described. Local production of medicines is aimed to improve access to high-quality, low-cost medicines. A key challenge is to determine whether the circumstances for successful local production are met, to ensure that investment in local production is not at the expense of cost or quality of medicines.
Production in most countries consists of repackaging finished dosage forms; research and development are mostly confined to high-income countries.
Access to essential medicines
Access can vary between urban and rural areas because of problems with health system development. Pharmacies, medicines distributors, health facilities, and public and private health providers are usually concentrated in cities and regional centres.
Most countries that reported that less than half of their population has adequate access to health facilities are low-income countries and over half are in Africa, whereas 8 out of 10 countries with very high access are in Europe and the Americas. The survey result also showed that the number of low-income countries
Using indicators to measure country pharmaceutical situations
- xvi -
reporting high rates of access to essential medicines rose between 1999 and 2003, but the number of high-income countries had fallen.
In many of the countries in which a systematic survey has been done, close to 100% of the medicines prescribed were in stock and dispensed in public health facilities. Medicine prices tended to be much less affordable in the private sector than in the public sector; likewise treatment for adult pneumonia in middle-income countries costs twice as many days’ wages as in low-income countries.
Rational use of medicines
Essential medicines lists and standard treatment guidelines
Many factors influence the use of medicines and countries need to implement various strategies to improve rational use. Such strategies can include developing and implementing the use of standard treatment guidelines (STGs) for common conditions, and using essential medicines lists (EMLs) to guide procurement and training.
Almost all low- and middle-income countries have a national EML, and most limit procurement to medicines on that list. The number of medicines included on national EMLs tends to increase with increasing country income. Few countries report that public or private sector insurance reimbursement is linked to the EML.
As an outcome measure, most public health facilities visited during the survey have an EML, although in some cases it is old and functionally obsolete. The rate of prescribing medicines from the EML is very high in public health facilities in most countries, with only two countries reporting rates lower than 60%.
Over 70% of countries reported that they have STGs for primary health care, which are available in most public health facilities surveyed, but some have not been updated recently.
Key policies and regulations to promote rational use
The role of a drug and therapeutics committee (DTC) is to ensure the safe and effective use of medicines. Nearly two thirds of countries report that DTCs are a mandated element in their national medicines policy.
Irrational use of antibiotics contributes to increased antimicrobial resistance (AMR), rendering essential antibiotics ineffective and requiring the use of newer, more expensive antibiotics for the treatment of bacterial illnesses. High-income countries are much more likely to have a national strategy to contain AMR, a national task force to implement the strategy, and a national reference laboratory to conduct surveillance.
Due to lack of regulation and enforcement, over-the-counter (OTC) sales of antibiotics have been a concern worldwide. Most countries surveyed report that OTC sales of antibiotics and injections occur only occasionally or never.
Given the known impact of advertising and promotion of medicines on both prescribing behaviour and patient demand, it is essential to regulate and monitor medicines promotion to ensure that it remains ethical. Most countries report that pharmaceutical promotion is regulated by the government medicines regulatory
Summary of key points
- xvii -
agency, although self-regulation of promotion is more common in high-income countries.
Education and information about rational use and accessibility of medicines from the Level I survey of countries revealed that health professionals are widely exposed to concepts of EMLs, STGs, problem-based pharmacotherapy, and rational prescribing during basic training.
Mandatory continuing education for health professionals is more common as country income increases. The requirement for health providers to attend continuing education programmes that include appropriate use of medicines had increased between 1999 and 2003.
Public or independent national drug information services are available for health workers or patients in less than half of the countries surveyed and availability is lowest in low-income countries. The number of countries that support national medicines information services for prescribers and dispensers did not increase between 1999 and 2003.
Public education about antibiotic use and misuse increases with country income level, whereas injection use is more often a focus of public education in low- and middle-income countries.
Improved prescribing behaviour of health workers is one of the expected outcomes shown in the systematic Level II survey of countries. However review of prescriptions revealed that the percentage of patients prescribed antibiotics continues to be high in all countries in which the systematic survey was conducted. First-line antibiotics are usually used to treat paediatric pneumonia, but antibiotics are also commonly given for non-pneumonia acute respiratory conditions (ARIs), most of which will not respond to antibiotics. Prescribing of injections is still very high in low-income countries.
Other outcome indicators are as follows: appropriate drug use is demonstrated with high levels of use of oral rehydration solution (ORS) to treat paediatric diarrhoea and low use of antidiarrhoeals or antispasmodics in children. The number of medicines prescribed per episode of outpatient care is between two and three in most countries. The adequacy of labelling of prescription items varies widely between countries. Four out of five patients in most countries know how to take their medicines when interviewed immediately after the medicines has been dispensed.
Methodological limitations and recommendations
Analyses of the most recent Level I and Level II survey data have also identified several limitations in the current survey instruments and in data collection and management. Recommendations for future improvements include shortening of the Level I questionnaire, automation of data collection and development of composite indicator scores based on Level I data in key domains such as access and rational use.
It is important to note that the current methodology does not measure access to and use of medicines from the perspective of the patient or consumer. Household surveys are needed to assess whether people have access to essential medicines, how they use them, how they pay for them, and how out-of-pocket payments for

Using indicators to measure country pharmaceutical situations
- xviii -
medicines impact on household finances. Only household surveys can provide information about the ultimate outcomes of pharmaceutical policies on the functioning and well-being of individuals.

Introduction
- 1 -
Level I Core structure
& process indicators
Level II Core outcome/impact indicators
Level III
Indicator tools for specific components of the pharmaceutical sector
● Household survey ● Pricing ● Traditional medicine ● HIV/AIDS ● Assessing regulation ● TRIPS
Systematic survey
Questionnaire (Health Officials)
1. INTRODUCTION
1.1 Background
The WHA 54.11 WHO medicines strategy acknowledged the four main objectives of WHO’s medicines strategy, namely, to frame and implement policy; to ensure access; to ensure quality, safety and efficacy; and to promote rational use of medicines. The WHO medicines strategy 2004–2007 presents the strategies developed to help staff at WHO headquarters and in the regions and countries to work towards realizing this vision.
Monitoring the progress of efforts to improve the global medicines situation is a crucial part of the strategy. WHO has developed a three-tiered monitoring strategy to assess progress, compare situations between countries, and reassess and prioritize efforts based on the results. Figure 1 illustrates the three levels of the monitoring strategy. The WHO operational package for monitoring and assessing the country pharmaceutical situation, specifically Level I and Level II indicators has provided a practical indicator-based tool that can be regularly implemented without the need to invest large amounts of human or financial resources (3). The core indicators can be easily collected using standardized methodologies, small samples of data and simple survey techniques.
Figure 1. WHO strategy for monitoring country pharmaceutical situations
1.2 Level I, II and III indicators
Level I indicators assess the structures and processes related to medicines in a country. They can be used to reveal the achievements and weaknesses of individual pharmaceutical systems and to illustrate common sectoral strategies and approaches. They also enable rapid assessment of the implementation of

Using indicators to measure country pharmaceutical situations
- 2 -
various components of a country pharmaceutical system. Every four years, health officials from WHO Member States are invited to complete a standardized questionnaire reporting on the status of national medicines policies and their components, including: legislation and regulations; quality control of medicines; essential medicines lists; supply systems; financing; access to medicines; production; rational use; and protection of intellectual property rights (see Annex 1 for the Level I questionnaire).
Level II indicators measure the degree of attainment or outcome of the strategic pharmaceutical objectives. The description of each indicator including calculations is contained in the manual WHO Operational package for monitoring and assessing country pharmaceutical situations (3).
• Access is measured in terms of the availability and affordability of essential medicines.
• Quality is represented by the absence of expired stock on pharmacy shelves and adequate handling and conservation conditions. Measuring quality by testing samples of pharmaceutical products was deemed too costly to be acceptable to most countries.
• Rational use is measured by examining prescribing and dispensing practices and the implementation of strategies that have been shown to support rational use, such as STGs and EMLs.
Countries calculate Level II indicators on the basis of data collected with standardized collection instruments at public health facilities, private pharmacies and warehouses (see Annex 2 for the Level II survey). Technical descriptions of some indicators, such as key drugs, measure of affordability, storage and handling scores, adequate labelling and patients’ knowledge about the drug dispensed, are given in Annex 3
Level III indicators assess specific components of the pharmaceutical sector, health system, or national medicines policy in more depth. Examples are indicators for investigating the use of medicines in health facilities; medicines price surveys; or indicators to monitor the impact of the TRIPS Agreement.
The present Fact Book details the results of the 2003 assessment of Level I and Level II indicators by 146 and 26 countries, respectively. The current situation is based on the results from the 2003 Level I survey. Where possible, 2003 Level I indicator results were compared with those reported in 1999 to determine whether progress had been made. Sections that describe outcome indicators used information from Level II surveys. For some areas, suitable outcome indicators have not yet been defined.
Some pharmaceutical components/topics presented and described in this Fact Book have more outcome indicator measures (Level II indicators) than others and thus more data are presented. This can be explained by the progress and process in the development of pharmaceutical indicators. There are certain areas in which indicators are more developed and have been used for several years, such as some of the indicators for rational drug use. Obtaining information on these indicators is relatively easy because the method of data collection has long been standardized. Collection of outcome indicators on quality of medicines from a comprehensive pharmaceutical survey is just
Introduction
- 3 -
being developed, including those for affordability. Other outcome indicators for availability are also being improved. This Fact Book will not attempt to analyse or address pharmaceutical policy issues, or to cover all key pharmaceutical components. The aim of the Fact Book is to provide the latest available information on pharmaceutical situations in various countries, and on the status of national medicines policies, as reflected by WHO Level I and Level II indicators. It is hoped that this information can be used as reference material by those who are interested in working on pharmaceutical sector issues at country, regional and global levels.
1.3 Countries providing data
The present Fact Book details the results of the 2003 assessment of Level I and Level II indicators. Data for Level I indicators were provided by 146 countries, including high-, medium- and low-income countries (see Annex 4 which presents individual Level I data for each country). Data were collected in 2003, thus allowing comparison with the results from 1999.
Most of the data for Level I indicators were gathered through the country’s ministry of health. Many WHO Member States submitted data in response to the Level I questionnaire. The WHO MedNet can be consulted to compare results over time and between countries (http://mednet.who.int/).
Some problems were noted during data processing owing to the nature of the questionnaires and high volume of information from the 146 countries. Problems included the limitations of the knowledge of respondents and hence the accuracy and validity of some responses. Attempts were made to validate the data as far as possible and to reflect them accurately in the survey report.
Data to measure Level II indicators were collected by 26 countries (see Annex 5 for Level II data on individual countries). Data were collected over a one-month period in each country between 2001 and 2004. The selection of indicators has evolved during this period and thus countries that did the survey later benefited from the experience of earlier surveys, which resulted in the refinement of some indicators. The writers had been careful in using indicators' results and ensuring that the processes of data collection, computation and analysis were standardized for each indicator.
Level II indicators are measured in public health facilities, private drug outlets and in warehouses supplying the public sector.1 Surveys of 30 public health facilities and their dispensaries gathered information about availability of essential medicines, medicine prices, stockout duration, adequacy of conservation conditions, affordability, prescribing and dispensing habits, and presence of guidelines. A similar survey of five warehouses supplying the public sector also examined availability, stockout duration, and adequacy of conservation conditions. Surveys of 30 private drug outlets assessed availability, affordability and prices of medicines.
1 For the purposes of the Level II survey package, a private drug outlet is a permanent retailer selling medicines,
whether a pharmacy, drug seller, drug store, or chemical seller. A warehouse is a central, regional or district warehouse supplying the public sector. A public health facility dispensary or public health facility pharmacy refers to the medicines dispensing area of the public health facility whether or not there is a pharmacist present.

Using indicators to measure country pharmaceutical situations
- 4 -
1.4 Performance standards for Level II indicators
The target for indicators measuring the extent of adequate labelling, proportion of prescribed medicines dispensed, adherence to treatment guidelines and availability of key medicines is ideally 100%. However, internationally valid standards for other indicators, such as average number of medicines per prescription, and the percentage use of antibiotics and injections, are more complex and have not been empirically established. Targets may require modification over time and between countries, but are currently recommended to be below 2, 30% and 20%, for the average number of medicines per prescription, percentage use of antibiotics and percentage use of injections, respectively. The optimal indicator values in these cases largely depend on disease patterns, policies and treatment guidelines and therefore may vary from country to country and over time.
1.5 Structure of the Fact Book
The Fact Book summarizes data for the Level I structure and process indicators and the Level II outcomes indicators according to eight topics:
• national medicines policy;
• legislation and regulation;
• quality control of pharmaceuticals;
• medicines financing systems and policies;
• supply of medicines in the public sector;
• intellectual property rights and patents, and local production;
• access to essential medicines; and
• rational use of medicines.
We briefly explain why each topic is important and summarize data on the situation in 2003. Where comparable data for 1999 are available, we describe progress made between 1999 and 2003. Level II indicators on access, quality, and rational use of medicines were used to assess whether outcome targets are being achieved.
Indicator data were summarized across countries classified as low-, middle-, or high-income, following the World Bank categorization of countries based on 2004 gross national income per capita (GNI). The criteria were: low-income, GNI of US$825 or less; middle-income, US$826–US$10 065; and high-income, US$10 066 or more (4). Annex 7 lists the countries that were included in each income category. Of 140 countries that responded to Level I surveys in 2003, 57 were low-, 65 middle-, and 18 high-income countries. Of 26 countries providing Level II data, 15 were low-, and 11 were middle-income countries.
In each country income category, the numbers and percentages of countries that responded positively to questions about the presence of documents, policies or institutions were reported. When countries were asked to provide numerical data (for example, on the annual budget for medicines and number

Introduction
- 5 -
of adverse events reported), medians, 25th and 75th percentiles of the responses were used. The median is the middle value of a series of numbers: that is, half of the responding countries reported a value lower than the median, and half reported a value higher than the median. Similarly, the 25th and 75th percentiles are the values reported by 25 and 75 per cent of the countries, respectively. Because medians and percentiles are less sensitive to extreme values than means (averages), they are the best summaries of indicator data which are highly skewed.
This Fact Book presents the information from the Level I database (Annex 4) and information from Level II country reports (Annex 5). However not all data from Level I have been included and analysed. Generally, only aggregate data for questions to which at least 50% of countries responded with a yes/no or numerical response (as requested) were reported. Countries that reported “don’t know” and those with missing data were excluded from analyses. For pharmaceutical areas where data for comparisons between 1999 (Annex 6) and 2003 were available, only countries that provided data for both years were included. Annexes 4, 5, and 6 included in this document are contained on a CD-ROM.*
Annexes 1 and 2 contain the Level I questionnaire and Level II survey forms that were the basis for data collection. Readers should consult these to see the content of each question.
It is important to note that assessments of country pharmaceutical situations using the existing Level I and Level II indicators have certain limitations. We discuss these limitations in Chapter 9 and suggest next steps in the process of evaluating and monitoring country pharmaceutical situations.
* Available on CD-ROM. Requests should be addressed to the Department of Technical Cooperation for Essential Drugs and Traditional Medicine, World Health Organization, 1211 Geneva 27, Switzerland. Fax: + 41 22 791 4167, e-mail: [email protected]

Using indicators to measure country pharmaceutical situations
- 6 -

National medicines policy
- 7 -
2. NATIONAL MEDICINES POLICY
2.1 Why is this important?
WHO recommends that countries consider formulating, implementing and monitoring a national medicines policy (NMP) as a “commitment to a goal and a guide for action” (1, 2). An NMP defines a framework for setting and monitoring medium- to long-term objectives in the public and private pharmaceutical sectors. The NMP should encompass:
• ensuring equitable availability and affordability of essential medicines;
• ensuring that all medicines are safe, efficacious and of high quality; and
• promoting rational use of medicines by health care professionals and consumers.
By attaining these objectives, countries can reduce morbidity and mortality, decrease the incidence of catastrophic illness that can increase impoverishment, and prevent large-scale losses to health and economic systems.
The functions and strategies of each component of the policy should be brought together in an implementation plan. It is recommended that an NMP implementation plan will cover a period of 3–5 years. Incorporation of the NMP into the national health system is necessary to ensure that the NMP goals and objectives are articulated in the broader national health plans, and so that resources can be used efficiently.
NMPs require regular review to evaluate whether objectives have been achieved. This should occur in connection with monitoring conducted as part of policy implementation and taking account of changes in health policy and the broader environment that have an impact on the pharmaceutical sector. Standardized indicators of the pharmaceutical situation allow countries to monitor and evaluate the impact of implementing an NMP.
2.2 What is the current situation?
Figure 2 illustrates which countries have either an official or a draft NMP, and whether the policy has been updated within the past 10 years.

Using indicators to measure country pharmaceutical situations
- 8 -
Figure 2. Global status of national medicines policies (NMPs)
Table 1. Status of national medicines policies (NMPs) in 2003
Country income level Low Middle High
NMP status Number % of countries
Number % of countries
Number % of countries
NMP official (or draft) 51 86.0 47 69.1 10 47.6 Official and updated < 10 years a 32 75.6 22 84.0 8 83.3 Official and updated > 10 years a 8 19.5 4 16.0 1 16.7
NMP implementation plan in place 34 64.2 23 51.1 7 58.3 NMP integrated in health plan 36 66.7 31 64.6 6 54.6
a Two low-income countries did not indicate year.
The majority of countries have an NMP and implementation plan integrated with the health plan.
Low-income countries perform particularly well on these indicators. The majority of NMPs have been updated within the past 10 years.
National medicines policy
- 9 -
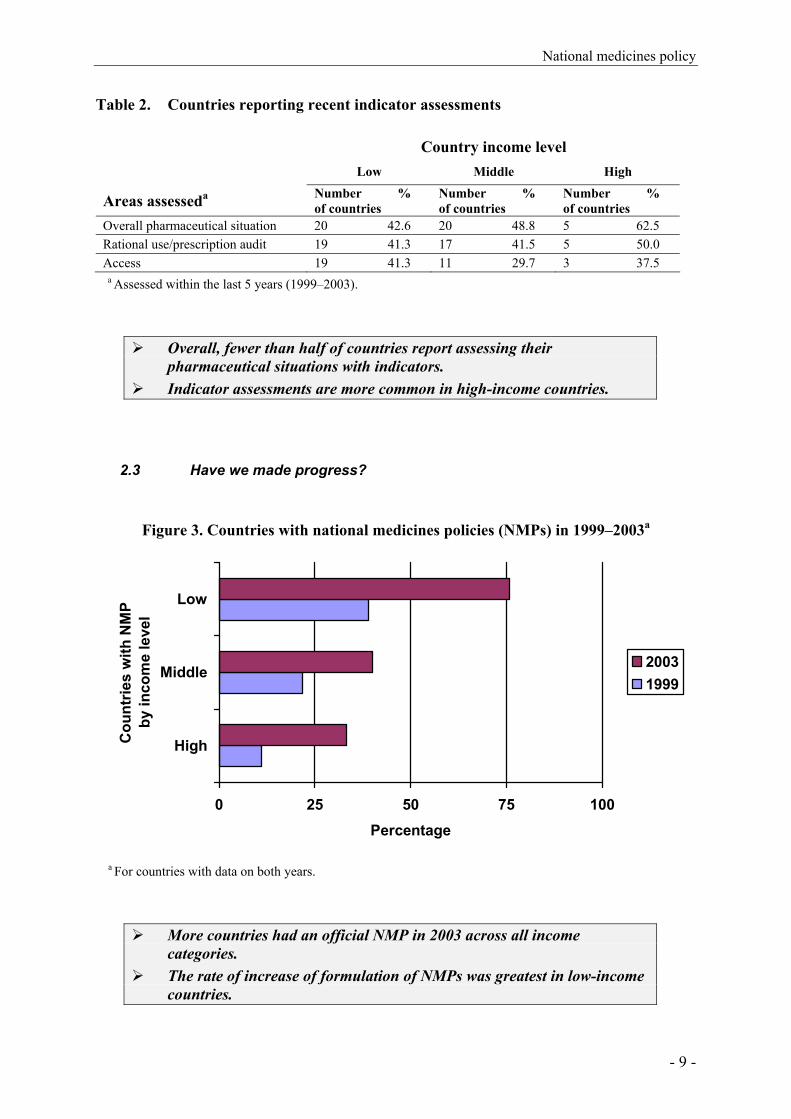
Table 2. Countries reporting recent indicator assessments
Country income level
Low Middle High
Areas assesseda Number % of countries
Number % of countries
Number % of countries
Overall pharmaceutical situation 20 42.6 20 48.8 5 62.5 Rational use/prescription audit 19 41.3 17 41.5 5 50.0 Access 19 41.3 11 29.7 3 37.5
a Assessed within the last 5 years (1999–2003).
Overall, fewer than half of countries report assessing their pharmaceutical situations with indicators.
Indicator assessments are more common in high-income countries.
2.3 Have we made progress?
Figure 3. Countries with national medicines policies (NMPs) in 1999–2003a
0 25 50 75 100
High
Middle
Low
Cou
ntrie
s w
ith N
MP
by in
com
e le
vel
Percentage
20031999
a For countries with data on both years.
More countries had an official NMP in 2003 across all income categories.
The rate of increase of formulation of NMPs was greatest in low-income countries.

Using indicators to measure country pharmaceutical situations
- 10 -
Table 3. Status of national medicines policies (NMPs) in 1999 and 2003a
NMP status 1999 Number of countries
2003 Number of countries
With official NMP 59 76 Updated within last 10 years 54 63 Not updated within last 10 years 5 13
No NMP 31 24 a For countries with data in both years.
Between 1999 and 2003, 17 additional countries adopted an NMP. The number of countries with an updated NMP (within the last 10 years)
increased from 54 in 1999 to 63 in 2003.
Table 4. Changes in status of national medicines policy (NMPs) from 1999 to 2003a
Country income level Low Middle High
Number % of countries
Number % of countries
Number % of countries
NMP status
1999 none, draft in 2003 4/8 50.0 10/24 41.7 1/13 7.7 1999 draft, still draft in 2003 2/14 14.3 5/14 35.7 0/2 0.0 1999 draft, official in 2003 11/14 78.6 4/14 28.6 1/2 50.0 1999 not updated >10 years, updated by 2003
0/3 0.0 1/3 33.3 0/0 0.0
NMP implementation plan
1999 none, plan in 2003 6/14 42.9 10/21 47.6 1/4 25.0 Same status in both years 29/37 78.4 21/34 61.8 4/6 66.7 1999 plan, no plan in 2003 2/37 5.4 3/34 8.8 1/6 16.7
a For countries with data in both years.
15 countries with no NMP in 1999 had a draft document by 2003. 16 countries progressed from draft NMP in 1999 to an official document in 2003. Only one of the six countries with an NMP that was not updated in 1999 had
updated the document by 2003. 17 countries with no NMP implementation plan in 1999 had developed one
by 2003.
Legislation and regulation
- 11 -
3. LEGISLATION AND REGULATION
3.1 Why is this important?
A legislative framework is required to implement and enforce policies regulating the pharmaceutical sector. Laws and regulations create a legal basis for the control of activities in the public and private pharmaceutical sectors, including administrative measures and sanctions in response to violations. Areas covered include the roles and responsibilities of the drug regulatory authority; market approval and registration of medicines; regulation of premises where medicines can be handled; and the qualifications, rights, and responsibilities of drug manufacturers, importers, exporters, distributors, prescribers and dispensers. Other key regulatory issues include implementation of policies on generic products to ensure the availability and use of lower-priced medicines, and monitoring of adverse drug reactions (ADRs) to products on the market.
Governments need strong national authorities to effectively regulate the manufacture, trade and use of medicines. The regulatory authority must ensure that only safe, effective, high quality medicines are produced, marketed, prescribed and dispensed to protect and promote public health.
3.2 What is the current situation?
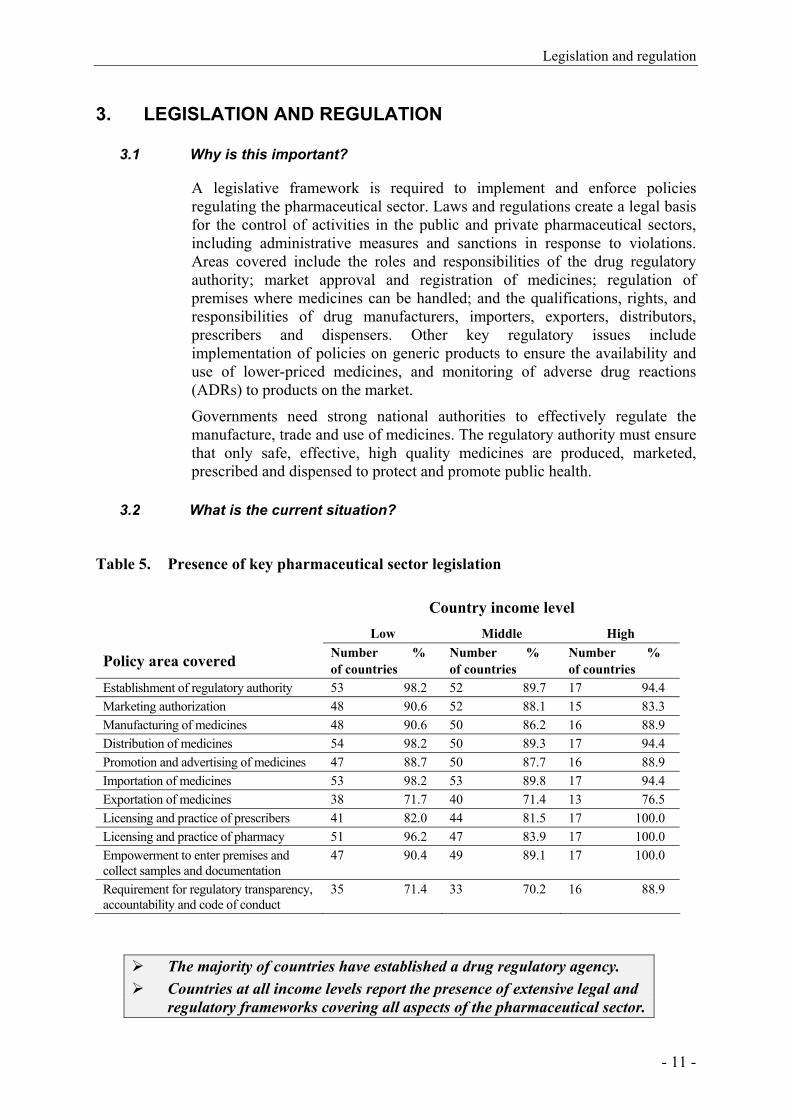
Table 5. Presence of key pharmaceutical sector legislation
Country income level Low Middle High
Policy area covered Number % of countries
Number % of countries
Number % of countries
Establishment of regulatory authority 53 98.2 52 89.7 17 94.4 Marketing authorization 48 90.6 52 88.1 15 83.3 Manufacturing of medicines 48 90.6 50 86.2 16 88.9 Distribution of medicines 54 98.2 50 89.3 17 94.4 Promotion and advertising of medicines 47 88.7 50 87.7 16 88.9 Importation of medicines 53 98.2 53 89.8 17 94.4 Exportation of medicines 38 71.7 40 71.4 13 76.5 Licensing and practice of prescribers 41 82.0 44 81.5 17 100.0 Licensing and practice of pharmacy 51 96.2 47 83.9 17 100.0 Empowerment to enter premises and collect samples and documentation
47 90.4 49 89.1 17 100.0
Requirement for regulatory transparency, accountability and code of conduct
35 71.4 33 70.2 16 88.9
The majority of countries have established a drug regulatory agency. Countries at all income levels report the presence of extensive legal and
regulatory frameworks covering all aspects of the pharmaceutical sector.
Using indicators to measure country pharmaceutical situations
- 12 -
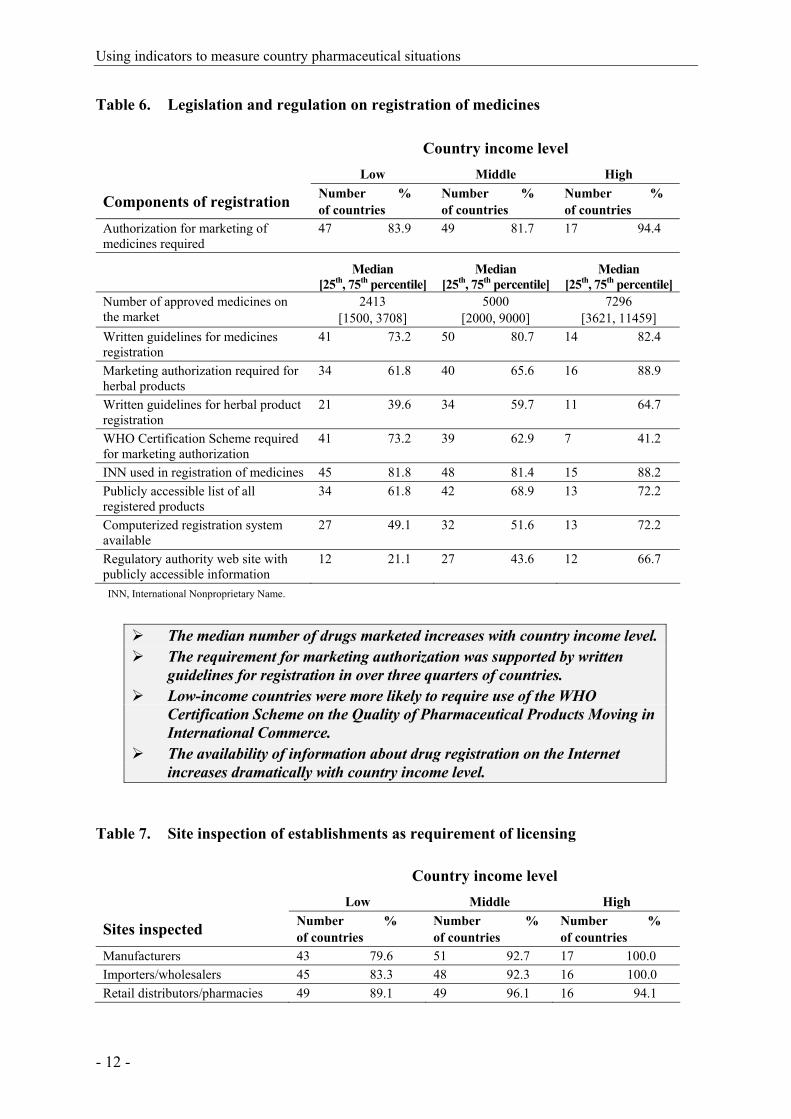
Table 6. Legislation and regulation on registration of medicines
Country income level Low Middle High
Components of registration Number % of countries
Number % of countries
Number % of countries
Authorization for marketing of medicines required
47 83.9 49 81.7 17 94.4
Median [25th, 75th percentile]
Median [25th, 75th percentile]
Median [25th, 75th percentile]
Number of approved medicines on the market
2413 [1500, 3708]
5000 [2000, 9000]
7296 [3621, 11459]
Written guidelines for medicines registration
41 73.2 50 80.7 14 82.4
Marketing authorization required for herbal products
34 61.8 40 65.6 16 88.9
Written guidelines for herbal product registration
21 39.6 34 59.7 11 64.7
WHO Certification Scheme required for marketing authorization
41 73.2 39 62.9 7 41.2
INN used in registration of medicines 45 81.8 48 81.4 15 88.2 Publicly accessible list of all registered products
34 61.8 42 68.9 13 72.2
Computerized registration system available
27 49.1 32 51.6 13 72.2
Regulatory authority web site with publicly accessible information
12 21.1 27 43.6 12 66.7
INN, International Nonproprietary Name.
The median number of drugs marketed increases with country income level. The requirement for marketing authorization was supported by written
guidelines for registration in over three quarters of countries. Low-income countries were more likely to require use of the WHO
Certification Scheme on the Quality of Pharmaceutical Products Moving in International Commerce.
The availability of information about drug registration on the Internet increases dramatically with country income level.
Table 7. Site inspection of establishments as requirement of licensing
Country income level Low Middle High
Sites inspected Number % of countries
Number % of countries
Number % of countries
Manufacturers 43 79.6 51 92.7 17 100.0 Importers/wholesalers 45 83.3 48 92.3 16 100.0 Retail distributors/pharmacies 49 89.1 49 96.1 16 94.1
Legislation and regulation
- 13 -
Most countries inspect importers, manufacturers, distributors and pharmacies.
Site inspection is somewhat less frequent in low-income countries.
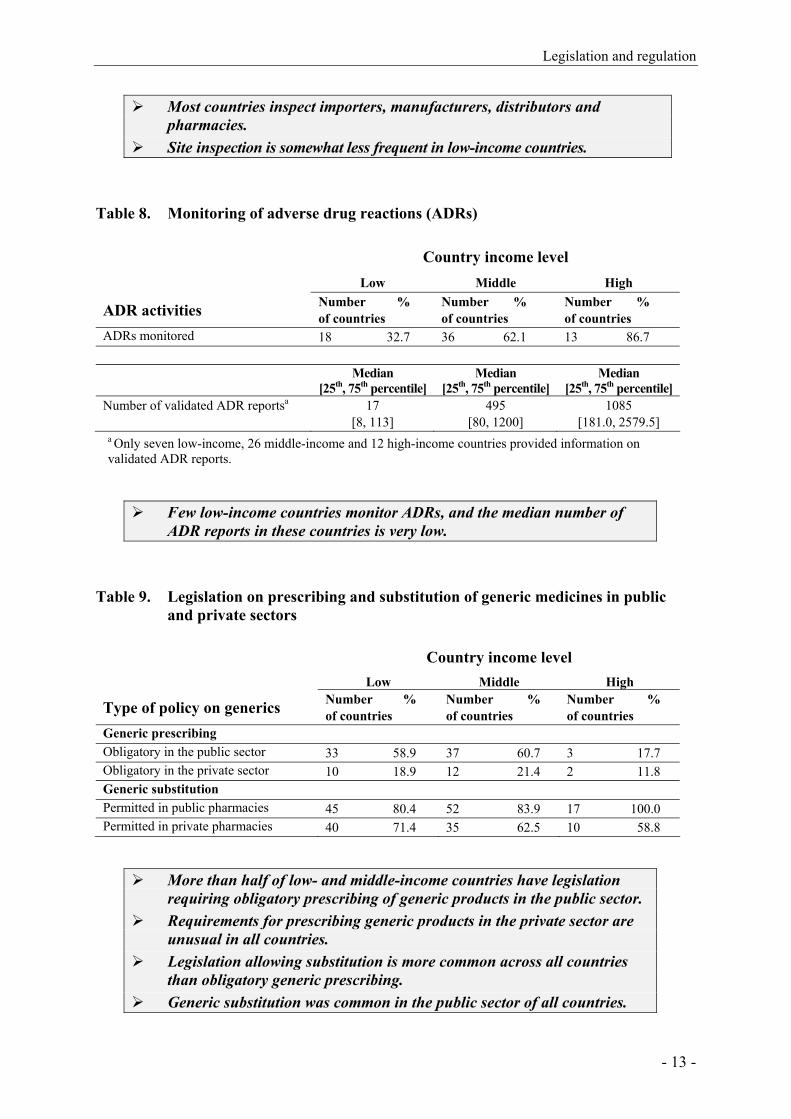
Table 8. Monitoring of adverse drug reactions (ADRs)
Country income level Low Middle High
ADR activities Number % of countries
Number % of countries
Number % of countries
ADRs monitored 18 32.7 36 62.1 13 86.7 Median
[25th, 75th percentile] Median
[25th, 75th percentile] Median
[25th, 75th percentile] Number of validated ADR reportsa 17
[8, 113] 495
[80, 1200] 1085
[181.0, 2579.5] a Only seven low-income, 26 middle-income and 12 high-income countries provided information on validated ADR reports.
Few low-income countries monitor ADRs, and the median number of ADR reports in these countries is very low.
Table 9. Legislation on prescribing and substitution of generic medicines in public and private sectors
Country income level Low Middle High
Type of policy on generics Number % of countries
Number % of countries
Number % of countries
Generic prescribing Obligatory in the public sector 33 58.9 37 60.7 3 17.7 Obligatory in the private sector 10 18.9 12 21.4 2 11.8 Generic substitution Permitted in public pharmacies 45 80.4 52 83.9 17 100.0 Permitted in private pharmacies 40 71.4 35 62.5 10 58.8
More than half of low- and middle-income countries have legislation requiring obligatory prescribing of generic products in the public sector.
Requirements for prescribing generic products in the private sector are unusual in all countries.
Legislation allowing substitution is more common across all countries than obligatory generic prescribing.
Generic substitution was common in the public sector of all countries.

Using indicators to measure country pharmaceutical situations
- 14 -
3.3 Have we made progress?
Table 10. Regulation on generic prescribing and substitution in 1999 and 2003
Country income levela Low Middle High
Type of generics policy Number (%) of countries 1999 2003
Number (%) of countries 1999 2003
Number (%) of countries 1999 2003
Generic prescribing Obligatory in the public sector 40 26
(100) (65.0) 49 31 (100) (63.3)
13 3 (100) (23.1)
Obligatory in the private sector 19 10 (51.4) (27.0)
29 11 (64.4) (25.0)
11 2 (84.6) (15.4)
Generic substitution Permitted in public pharmacies 39 27
(97.5) (67.5) 43 40 (89.6) (83.3)
13 11 (100) (84.6)
Permitted in private pharmacies 33 19 (89.2) (51.4)
35 32 (72.9) (66.7)
11 9 (78.6) (64.3)
a For countries with data on both years.
The number of countries that have legislation requiring prescription of generics in either the public or private sectors has decreased significantly since 1999.
The number of countries allowing generic substitution has also decreased in both sectors, although to a lesser extent.
3.4 Have we achieved the desired outcomes?
Figure 4. Prescribing by generic name in public facilities
0
20
40
60
80
100
Perc
enta
ge o
f pat
ient
s BrazilCambodiaCameroonKenyaLao PDRNepalRwandaSenegal
The majority of prescribed drugs in public facilities were written by generic name in the countries where this was surveyed.
In five of eight countries, the rate of generic prescribing was 80% or more.
Quality control of pharmaceuticals
- 15 -
4. QUALITY CONTROL OF PHARMACEUTICALS
4.1 Why is this important?
Quality control is important to ensure that patients receive medicines that are safe and effective. WHO recommends that the drug regulatory authority of each country should have access to a quality control laboratory to test whether medicines samples meet required quality criteria. WHO provides guidelines on establishing testing facilities (5, 6).
Quality control extends beyond testing whether medicinal products contain the right ingredients in the correct amount, to ensuring that they are properly stored and have not passed the expiry date. The latter measure is intended to ensure that, at the final distribution point, patients are getting high quality and efficacious drugs. Countries with tropical climates can experience difficulty in maintaining good drug storage conditions. Prevailing conditions of high temperature and high humidity; common storage problems, such as storage on the floor; lack of systematic arrangement of stock; presence of dust and pests; inadequate protection from direct sunlight; and lack of provision of temperature monitoring charts and facilities to monitor room temperature can lead to degradation of drugs.
4.2 What is the current situation?
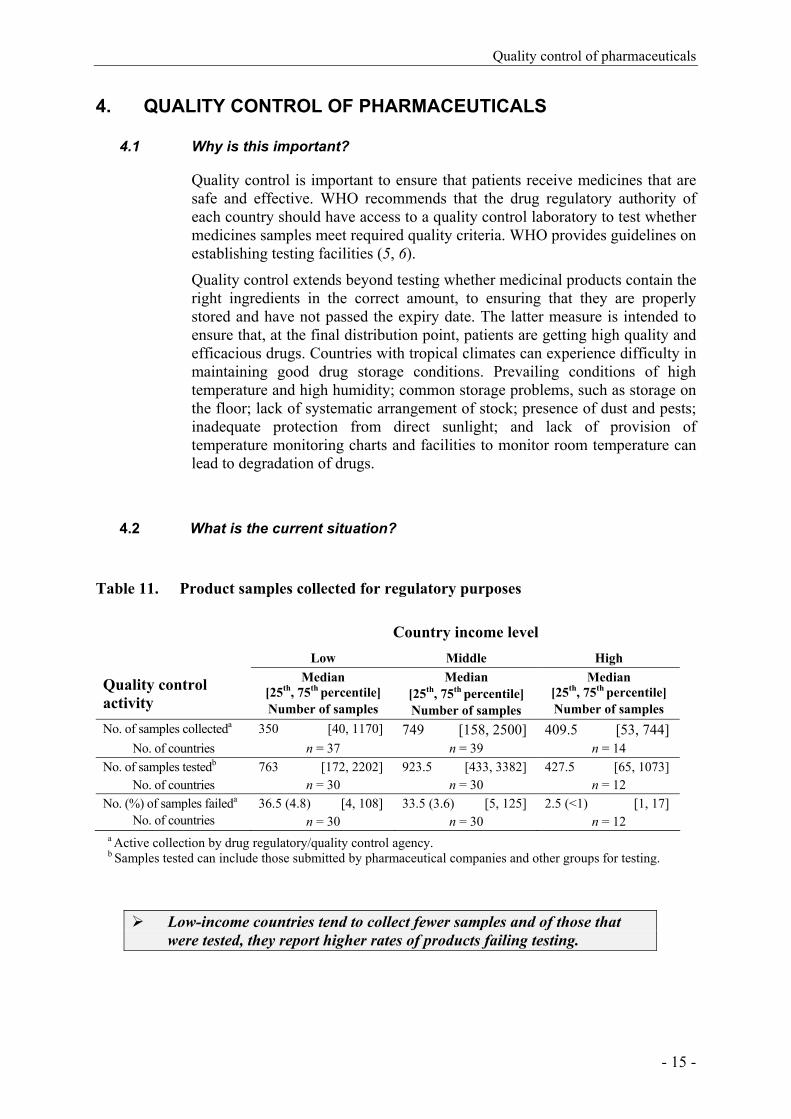
Table 11. Product samples collected for regulatory purposes
Country income level Low Middle High
Quality control activity
Median [25th, 75th percentile] Number of samples
Median [25th, 75th percentile] Number of samples
Median [25th, 75th percentile] Number of samples
No. of samples collecteda 350 [40, 1170] 749 [158, 2500] 409.5 [53, 744] No. of countries n = 37 n = 39 n = 14
No. of samples testedb 763 [172, 2202] 923.5 [433, 3382] 427.5 [65, 1073] No. of countries n = 30 n = 30 n = 12
No. (%) of samples faileda 36.5 (4.8) [4, 108] 33.5 (3.6) [5, 125] 2.5 (<1) [1, 17] No. of countries n = 30 n = 30 n = 12
a Active collection by drug regulatory/quality control agency. b Samples tested can include those submitted by pharmaceutical companies and other groups for testing.
Low-income countries tend to collect fewer samples and of those that were tested, they report higher rates of products failing testing.

Using indicators to measure country pharmaceutical situations
- 16 -
Table 12. Presence of expired medicines in health facilities and warehouses
Country income level
Low Middle Type of facility Public pharmacies 0 0 No. of countries n = 12 n = 9 Private pharmacies 0 0 No. of countries n = 11 n = 10 Public warehouses 0 0 No. of countries n = 9 n = 2
None of the survey teams that conducted Level II surveys of health facilities found expired products present at health facilities or warehouses among the 20 key medicines selected.
Figure 5. Storage and handling conditions in public health facilities and warehouses
Stock-keeping and handling of medicines in pharmacy stock areas in public health facilities were generally satisfactory.
Storage conditions in warehouses tended to be better than in pharmacy stock areas in public health facilities.
Public health facilities Warehouses
76.572.775.0
83.286.4 89.290.5
94.4
81.8
70.1
75.0
87.5
60
70
80
90
100
Low (n=11)
Middle(n=10)
Low (n=11)
Middle(n=10)
Country income level
% o
f max
imum
sto
rage
an
d ha
ndlin
g sc
ore
25 percentile Median 75 percentile
Quality control of pharmaceuticals
- 17 -
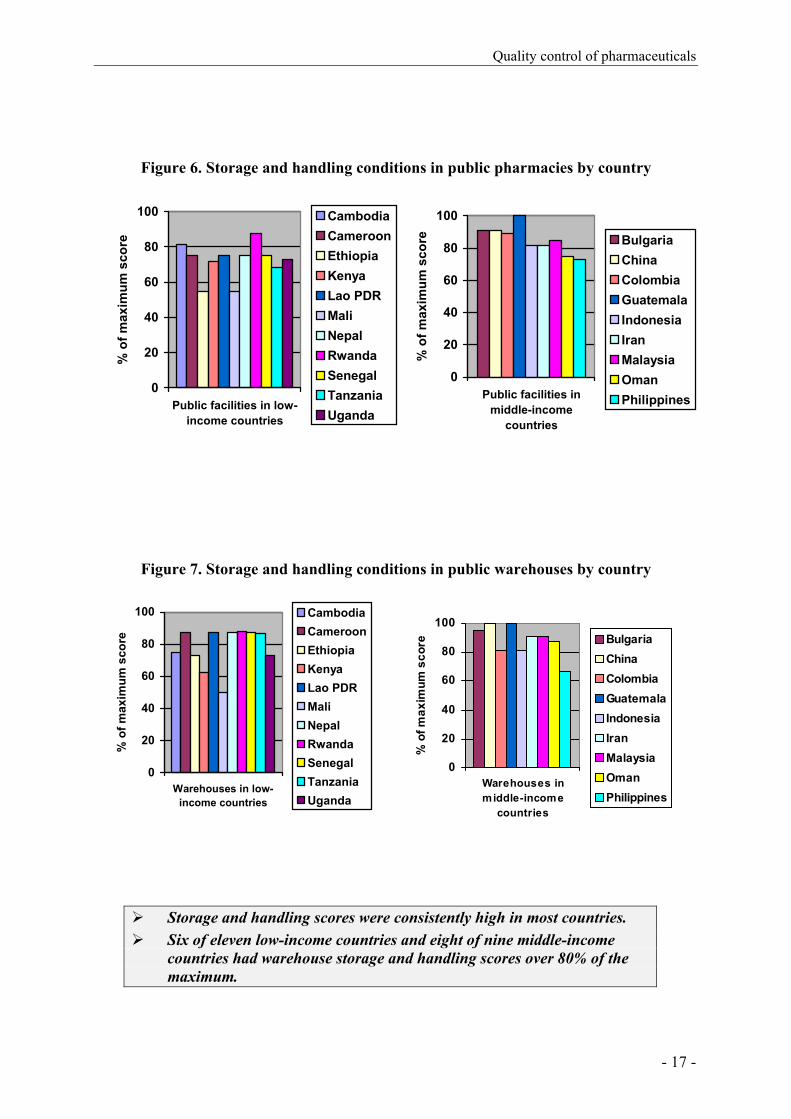
Figure 6. Storage and handling conditions in public pharmacies by country
Figure 7. Storage and handling conditions in public warehouses by country
0
20
40
60
80
100
Warehouses in low-income countries
% o
f max
imum
sco
re
CambodiaCameroonEthiopiaKenyaLao PDRMaliNepalRwandaSenegalTanzaniaUganda
Storage and handling scores were consistently high in most countries. Six of eleven low-income countries and eight of nine middle-income
countries had warehouse storage and handling scores over 80% of the maximum.
0
20
40
60
80
100
Public facilities inmiddle-income
countries%
of m
axim
um s
core Bulgaria
ChinaColombiaGuatemalaIndonesiaIranMalaysiaOmanPhilippines
0
20
40
60
80
100
Warehouses inmiddle-income
countries
% o
f max
imum
sco
re BulgariaChinaColombiaGuatemalaIndonesiaIranMalaysiaOmanPhilippines
0
20
40
60
80
100
Public facilities in low-income countries
% o
f max
imum
sco
re
CambodiaCameroonEthiopiaKenyaLao PDRMaliNepalRwandaSenegalTanzaniaUganda

Using indicators to measure country pharmaceutical situations
- 18 -
Medicines financing systems and policies
- 19 -
5. MEDICINES FINANCING SYSTEMS AND POLICIES
5.1 Why is this important?
In developing countries, expenditures on medicines account for 25-65% of total public and private health expenditures, and for 60-90% of out-of-pocket household expenditures on health (7). Households are more likely to incur catastrophic expenditures (greater that 40% of income, after subsistence needs are met) when health services, including medicines, require payments, households are poor, and when there is no prepayment or health insurance scheme (8).
WHO is committed to guiding countries in the development of strategies to promote fair financing mechanisms to improve medicines supply, especially in the public sector, and to improve affordability of essential medicines in both the private and public sectors (1). Increased public funding is important to enable the achievement of high public health impact and equitable access in most countries. Another strategy is the provision of medicines benefits through social health insurance and prepayment schemes (1).
Access to specific treatments for high-priority conditions has life-saving implications for individuals and major public health benefits for the community. Although users fees have some advantages if managed properly, they tend also to disproportionately burden the poor. Drug fees from drug sales can create perverse incentives to prescribe inappropriately and should be discouraged unless a strict drug use audit is in place. (9) Drug pricing policy is also an important strategy because the cost of medicine is one of the most important obstacles to access. Pricing regulation and policies can provide a good basis for equitable access if they are effectively enabled. Drug prices can be inflated in current market environments.
5.2 What is the current situation?
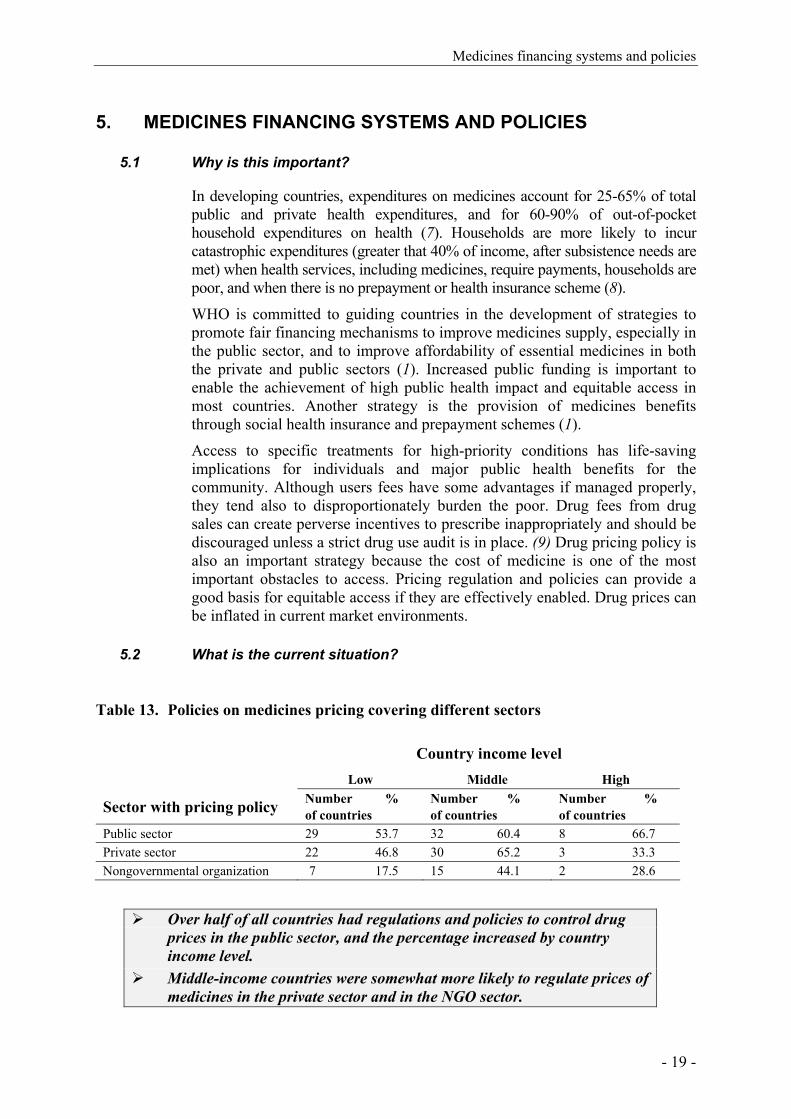
Table 13. Policies on medicines pricing covering different sectors
Country income level
Low Middle High
Sector with pricing policy Number % of countries
Number % of countries
Number % of countries
Public sector 29 53.7 32 60.4 8 66.7 Private sector 22 46.8 30 65.2 3 33.3 Nongovernmental organization 7 17.5 15 44.1 2 28.6
Over half of all countries had regulations and policies to control drug
prices in the public sector, and the percentage increased by country income level.
Middle-income countries were somewhat more likely to regulate prices of medicines in the private sector and in the NGO sector.

Using indicators to measure country pharmaceutical situations
- 20 -
Table 14. Use of fees from drug sales to pay salaries
Country income level Low Middle High How often fees are used to pay salaries
Number % of countries
Number % of countries
Number % of countries
Always 0 0.0 3 7.1 0 0.0 Often 0 0.0 0 0.0 0 0.0 Occasionally 11 26.2 4 9.5 1 8.3 Never 31 73.8 35 83.3 11 91.7
Most countries never use drug fees to pay salaries, but the use of fees is associated with lower income countries.
Only three middle-income countries always use fees from drug sales to pay the salaries of health workers.
Table 15. Free provision of medicines and types of fees in public health facilities
Country income level Low Middle High
Types of free medicines Number % of countries
Number % of countries
Number % of countries
All medicines 12 21.8 40 67.8 2 15.4 Malaria medicines 19 37.3 36 81.8 1 9.1 Tuberculosis medicinesa 50 96.2 45 93.8 9 75.0 Medicines for sexually transmitted diseases
17 34.0 38 79.2 2 18.2
HIV/AIDS-related medicines 16 35.6 37 78.7 7 58.3 All medicines for those who cannot afford them
30 58.8 31 72.1 5 41.7
Medicines for children under 5 years of age
19 38.0 34 77.3 3 23.1
Medicines for pregnant women 19 37.3 34 79.1 1 8.3 Medicines for elderly persons 12 22.2 18 35.3 4 28.6 Nonea 8 14.8 2 3.1 2 11.1
Types of fees charged
Registration/consultation fees 43 78.2 31 55.4 8 61.5 Dispensing fees 17 33.3 11 21.2 5 38.5 Flat rate co-payments 11 35.5 11 33.3 1 14.3 Percentage co-payments 13 29.6 10 20.4 10 76.9
a Inconsistencies in reporting noted.

Medicines financing systems and policies
- 21 -
Medium-income countries are better able to subsidize access by providing free medicines for specific diseases.
Tuberculosis medicines were the most commonly subsidized medicines at all country income levels, followed by medicines for the indigent population.
Low-income countries were more likely to report that patients paid consultation fees.
If there are co-payments in public facilities, low- and middle-income countries tended to charge flat co-payment fees whereas high-income countries were more likely to charge a percentage co-payment fee.
Table 16. Health insurance and medicines coverage
Country income level Low Middle High
Type of insurance coverage Number % of countries
Number % of countries
Number % of countries
Public health insurance 22 50.0 33 70.2 11 91.7 Private health insurance 31 73.8 33 80.5 10 76.9 Medicines covered, public insurance 17 38.6 34 73.9 12 85.7 Medicines covered, private insurance 28 77.8 33 80.5 9 100.0
Percentage of cost covered Median [25th, 75th percentile]
Median [25th, 75th percentile]
Median [25th, 75th percentile]
Percentage of cost covered, public insurance
50 [10, 80] 95 [20, 100] 75 [60, 100]
No. of countries n = 13 n = 22 n = 6 Percentage of cost covered, private insurance
85 [75, 100] 77.5 [40, 90] 62.5 [12.5, 100]
No. of countries n = 15 n = 14 n = 4
Fewer low-income countries have public insurance coverage or any insurance that covers medicines.
Private insurance coverage is more likely to provide medicines benefits across all country income levels.
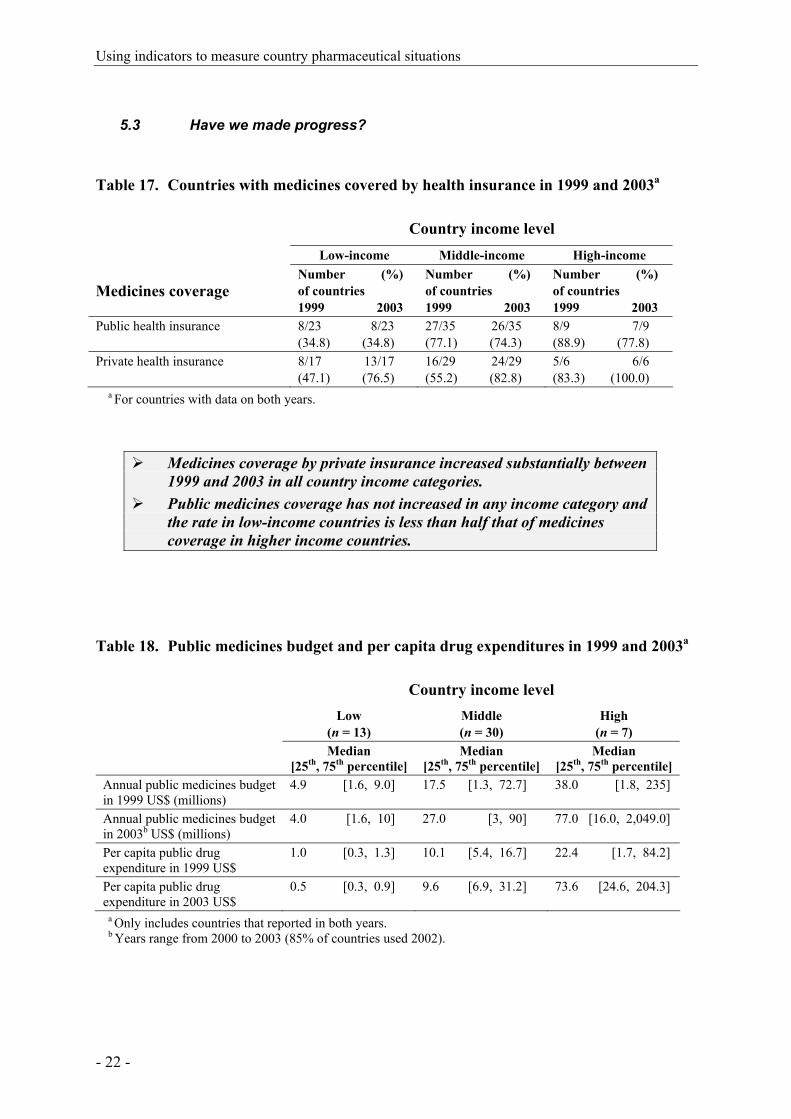
Using indicators to measure country pharmaceutical situations
- 22 -
5.3 Have we made progress?
Table 17. Countries with medicines covered by health insurance in 1999 and 2003a
Country income level
Low-income Middle-income High-income
Medicines coverage Number (%) of countries 1999 2003
Number (%) of countries 1999 2003
Number (%) of countries 1999 2003
Public health insurance
8/23 8/23 (34.8) (34.8)
27/35 26/35 (77.1) (74.3)
8/9 7/9 (88.9) (77.8)
Private health insurance
8/17 13/17 (47.1) (76.5)
16/29 24/29 (55.2) (82.8)
5/6 6/6 (83.3) (100.0)
a For countries with data on both years.
Medicines coverage by private insurance increased substantially between 1999 and 2003 in all country income categories.
Public medicines coverage has not increased in any income category and the rate in low-income countries is less than half that of medicines coverage in higher income countries.
Table 18. Public medicines budget and per capita drug expenditures in 1999 and 2003a
Country income level Low
(n = 13) Middle (n = 30)
High (n = 7)
Median [25th, 75th percentile]
Median [25th, 75th percentile]
Median [25th, 75th percentile]
Annual public medicines budget in 1999 US$ (millions)
4.9 [1.6, 9.0] 17.5 [1.3, 72.7] 38.0 [1.8, 235]
Annual public medicines budget in 2003b US$ (millions)
4.0 [1.6, 10] 27.0 [3, 90] 77.0 [16.0, 2,049.0]
Per capita public drug expenditure in 1999 US$
1.0 [0.3, 1.3] 10.1 [5.4, 16.7] 22.4 [1.7, 84.2]
Per capita public drug expenditure in 2003 US$
0.5 [0.3, 0.9] 9.6 [6.9, 31.2] 73.6 [24.6, 204.3]
a Only includes countries that reported in both years. b Years range from 2000 to 2003 (85% of countries used 2002).
Medicines financing systems and policies
- 23 -
Public medicines budgets and per capita drug expenditure were lower in 2003 than in 1999.
Differences between low- and high-income countries in annual medicines budgets and expenditures have increased.
Per capita public drug expenditure during 2003 in low-income countries was 5% that of middle-income countries and 0.7% that of high-income countries.
During 1999–2003 per capita public drug expenditure decreased by 50% in low-income countries and by 5% in middle-income countries but increased by 228% in high-income countries.

Using indicators to measure country pharmaceutical situations
- 24 -

Public sector medicines supply
- 25 -
6. PUBLIC SECTOR MEDICINES SUPPLY
6.1 Why is this important?
A well-coordinated medicines supply system helps to ensure that funds available for purchasing medicines are used effectively and efficiently. Failures in the supply system can lead to life-threatening shortages of medicines and waste of scarce resources. Problems frequently result when an inefficient public medicines supply system is intended to serve an entire country and/or more efficient private sector supply systems serve only urban populations. An option (1) is to develop an efficient mixed medicines supply system of public, private and NGO procurement, storage and distributions services. It can be assumed that there is a tendency for NGOs and private organizations in low-income countries to be involved in procurement and distribution, specifically in relation to aid programmes and as a means to address capacity and infrastructure problems.
Individual facility-based purchasing may be intended to improve the efficiency of medicines management by allowing decisions about drug purchasing to take place closer to the point of use, thus maximizing responsiveness to local needs. However, purchasing of medicines by individual health institutions often lacks transparency, and may not benefit from economies that result from bulk purchasing and centralized tender and procurement. In higher income countries, better infrastructure and a more competitive market among private drug wholesalers can mitigate the possible inefficiencies of individual purchasing.

Using indicators to measure country pharmaceutical situations
- 26 -
6.2 What is the current situation?
Table 19. Public sector procurement and distribution systems
Country income level Low Middle High
Procurement agencies Number % of countries
Number % of countries
Number % of countries
Ministry/department of health 46 90.2 45 88.2 9 75.0 Nongovernmental organization 19 50.0 5 15.6 3 37.5 Private organization contracted by government
15 41.7 7 20.6 2 22.2
Individual health institutions 25 58.1 21 55.3 6 66.7 Median
[25th, 75thpercentile] Median
[25th, 75thpercentile] Median
[25th, 75thpercentile] Percentage of procurement done by individual health institutions to total public procurement cost
20% [2%, 20%] 85% [20%, 100%] 55% [20%, 100%)
n = 15 n = 15 n = 2
Distribution agencies
Ministry/department of health 37 86.1 28 80.0 6 54.6 Nongovernmental organization 12 41.4 4 19.1 2 28.6 Private organization contracted by the government
10 35.7 6 25.0 1 14.3
Individual health institutions 22 59.5 10 40.0 2 28.6
Tender process
National competitive 29 72.5 37 90.2 6 85.7 International competitive 41 82.0 26 68.4 3 37.5 Negotiation/direct purchasing 36 83.7 31 73.8 4 57.1 Median
[25th, 75thpercentile] Median
[25th, 75thpercentile] Median
[25th, 75thpercentile] Percentage of tender done by negotiation/direct purchasing to total cost of tender
10% [5%, 20%] 20% [5%, 65%] 53.5% [5.3%, 99%]
n = 25 n = 19 n = 4
EML procurement
Procurement limited to EML 43 76.8 27 49.1 1 7.7 EML, Essential medicines list.
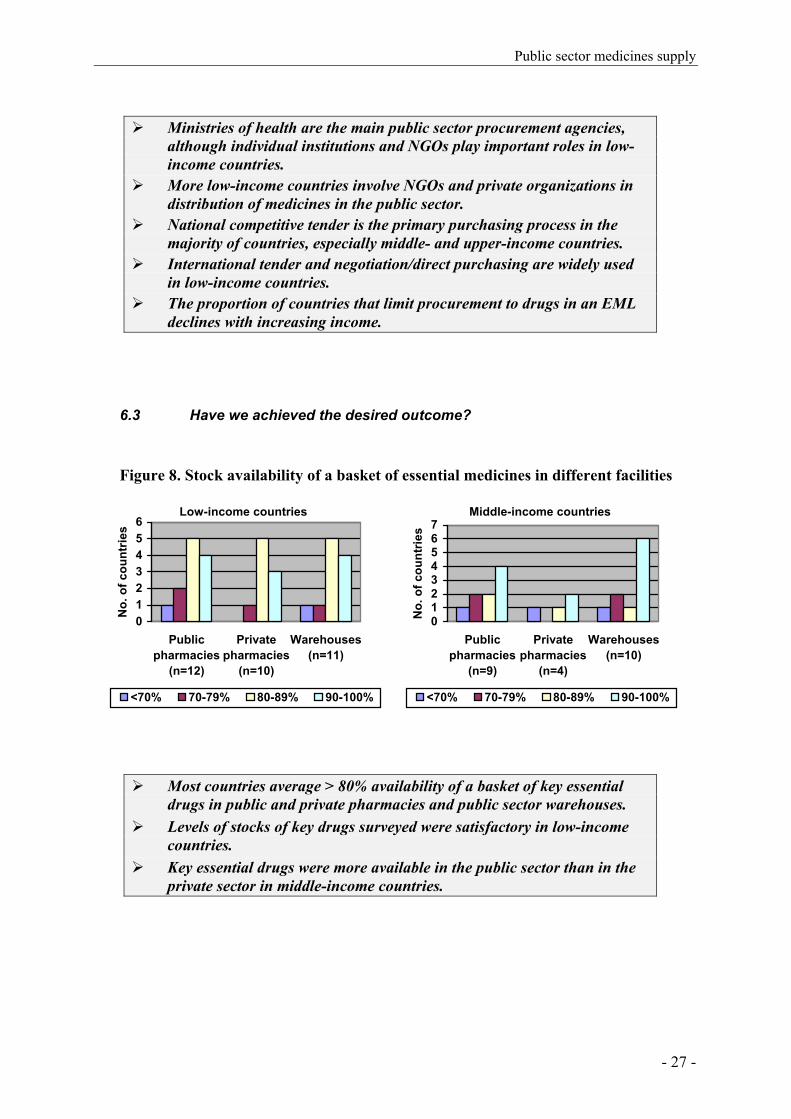
Public sector medicines supply
- 27 -
Ministries of health are the main public sector procurement agencies,
although individual institutions and NGOs play important roles in low-income countries.
More low-income countries involve NGOs and private organizations in distribution of medicines in the public sector.
National competitive tender is the primary purchasing process in the majority of countries, especially middle- and upper-income countries.
International tender and negotiation/direct purchasing are widely used in low-income countries.
The proportion of countries that limit procurement to drugs in an EML declines with increasing income.
6.3 Have we achieved the desired outcome?
Figure 8. Stock availability of a basket of essential medicines in different facilities
Low-income countries
0123456
Publicpharmacies
(n=12)
Privatepharmacies
(n=10)
Warehouses(n=11)
No.
of c
ount
ries
<70% 70-79% 80-89% 90-100%
Middle-income countries
01234567
Publicpharmacies
(n=9)
Privatepharmacies
(n=4)
Warehouses(n=10)
No.
of c
ount
ries
<70% 70-79% 80-89% 90-100%
Most countries average > 80% availability of a basket of key essential drugs in public and private pharmacies and public sector warehouses.
Levels of stocks of key drugs surveyed were satisfactory in low-income countries.
Key essential drugs were more available in the public sector than in the private sector in middle-income countries.
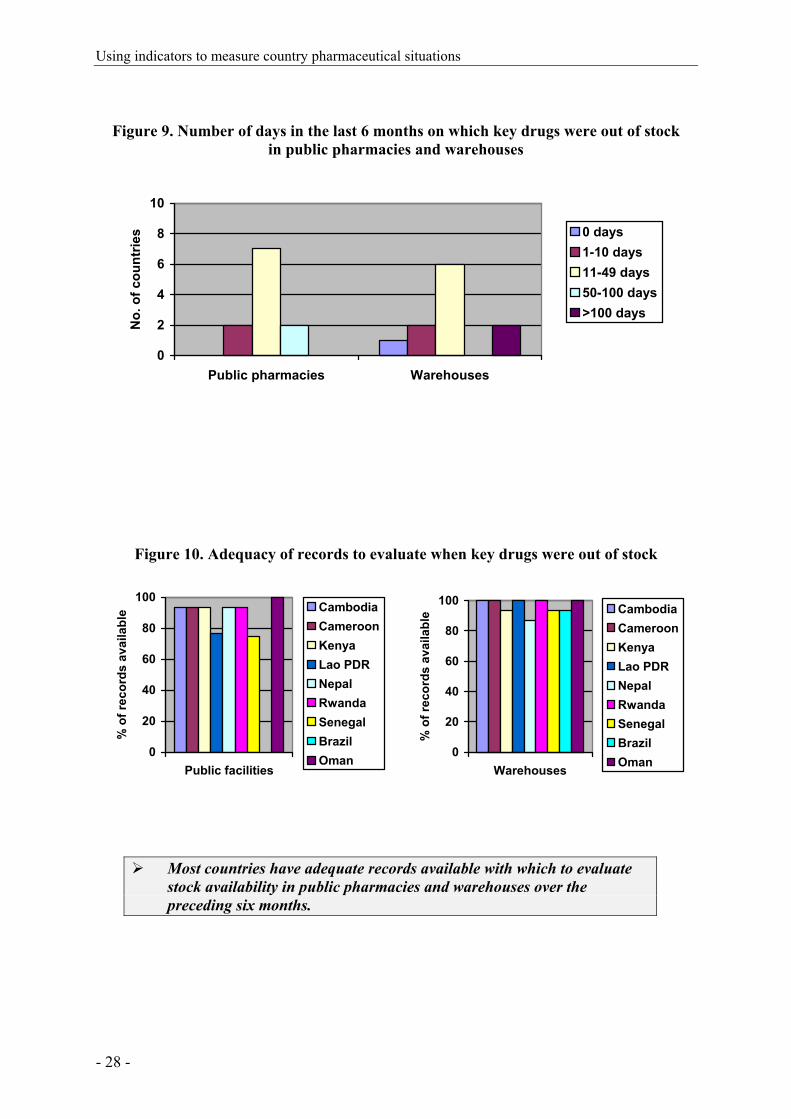
Using indicators to measure country pharmaceutical situations
- 28 -
Figure 9. Number of days in the last 6 months on which key drugs were out of stock in public pharmacies and warehouses
0
2
4
6
8
10
Public pharmacies Warehouses
No.
of c
ount
ries 0 days
1-10 days11-49 days50-100 days>100 days
Figure 10. Adequacy of records to evaluate when key drugs were out of stock
0
20
40
60
80
100
Public facilities
% o
f rec
ords
ava
ilabl
e CambodiaCameroonKenyaLao PDRNepalRwandaSenegalBrazilOman
0
20
40
60
80
100
Warehouses
% o
f rec
ords
ava
ilabl
e CambodiaCameroonKenyaLao PDRNepalRwandaSenegalBrazilOman
Most countries have adequate records available with which to evaluate stock availability in public pharmacies and warehouses over the preceding six months.
Intellectual property, patents and production
- 29 -
7. INTELLECTUAL PROPERTY, PATENTS AND PRODUCTION
7.1 Why is this important?
Intellectual property rights have an important impact on affordability and availability of medicines and thereby public health. The WTO Agreement on Trade-Related Aspects of Intellectual Property Rights (TRIPS) requires WTO Members to provide minimum standards of intellectual property protection, including patent protection. Patent protection grants exclusive rights to the patent holder for the use, manufacture and sale of a medicine. During the term of the patent, the patent holder has a monopoly on the medicine, which prevents generic competition as a means of reducing prices. Poorer populations in developing countries cannot pay the same prices as those affordable in wealthier countries for newer medicines. TRIPS-compliant mechanisms can be used to access lower-priced drugs. It is important to consider adapting national legislation to incorporate all flexibilities available in the TRIPS Agreement (see below) to safeguard access to essential medicines for all (1).
It is crucial that countries assess the impact of the TRIPS Agreement and other international, regional and bilateral trade agreements. WHO supports its Member States in the use of TRIPS flexibilities to enhance affordability and availability of medicines. These safeguards also include setting the criteria for patentability of pharmaceuticals which adequately reflect public health concerns, legislative provisions for compulsory licensing, government use authorization, parallel import, exceptions to exclusive patent rights and other measures that promote generic competition and extension of the transition period.
There are variations in the manner in which the provisions for such flexibilities have been incorporated into national laws (10), thus there are limitations in the completeness of the information on TRIPS flexibilities as presented in the tables below. For example, provisions on parallel import may exist in some countries, but there may be limitations which restrict parallel importation – such as when the explicit consent of the patent holder is required before parallel importation can take place. In such cases, the so-called flexibility is lost. Also, there are essentially two kinds of parallel importation regimes – international exhaustion and regional exhaustion. When the international exhaustion regime is incorporated into the national law, parallel import of a product will be permitted into the country from anywhere else, whereas regional exhaustion (as for the whole of the EU) would allow products to be imported only from within a particular regional grouping. There may therefore be differences in the parallel import provisions that will be important in determining whether or not the flexibilities are maintained. Such variations also exist in countries in terms of their provisions for compulsory licensing. Whilst compulsory licensing provisions exist within most national laws, the provisions may differ, for example, in terms of the various grounds on which compulsory licence may be granted. It was agreed in the Doha Declaration concerning the TRIPS Agreement and Public Health

Using indicators to measure country pharmaceutical situations
- 30 -
that WTO Members were free to determine the grounds on which compulsory licences may be granted. However, this flexibility may not have yet been properly incorporated in all national laws. For Article 65 of the TRIPS Agreement – there are four separate and different transition periods. The first transition period was in 1995 when developed country WTO members had to implement the TRIPS Agreement, but developing country Members had to implement the basic TRIPS provisions of most-favoured nation and national treatment. The second transition period was on 1 January 2000 for developing countries to implement the TRIPS Agreement. The third transition period is for centrally-planned economies, and finally the fourth transition period expired on 1 January 2005, at which time those countries which had delayed product patent protection for certain types of products and technology (such as pharmaceuticals) were required to provide such protection.
Some information on local production of medicines aimed to improve access to high-quality, low-cost medicines is also included below. A key challenge is to determine whether the circumstances for successful local production are being met, so that investment in local production is not at the expense of the cost or quality of medicines.
7.2 What is the current situation?
Table 20. Patent protection and marketing authorization provisions for medicines Country income level Low Middle High
Number % of countries
Number % of countries
Number % of countries
Countries with patent protection for pharmaceutical productsa
25 51.0 42 82.4 14 87.5
Provisions in national legislation
Parallel import provisions 17 35.4 16 37.2 9 64.3 Compulsory licensing provisions 21 44.7 24 55.8 4 33.3 Manufacturers allowed to use patented inventions prior to patent expiration
11 30.6 16 42.1 6 40.0
TRIPS provisions:b
TRIPS Agreement in legislation (n = 70)
11 35.5 23 79.3 9 90.0
Article 65 used (n = 59) 17 70.8 9 36.0 2 20.0 Article 66 usedc (n = 20) 10 66.7 2 66.7 0 0.0
a Currently patent legislation of 49 countries has been reviewed. b World Trade Organization member countries (n = 98). c Least-developed countries.
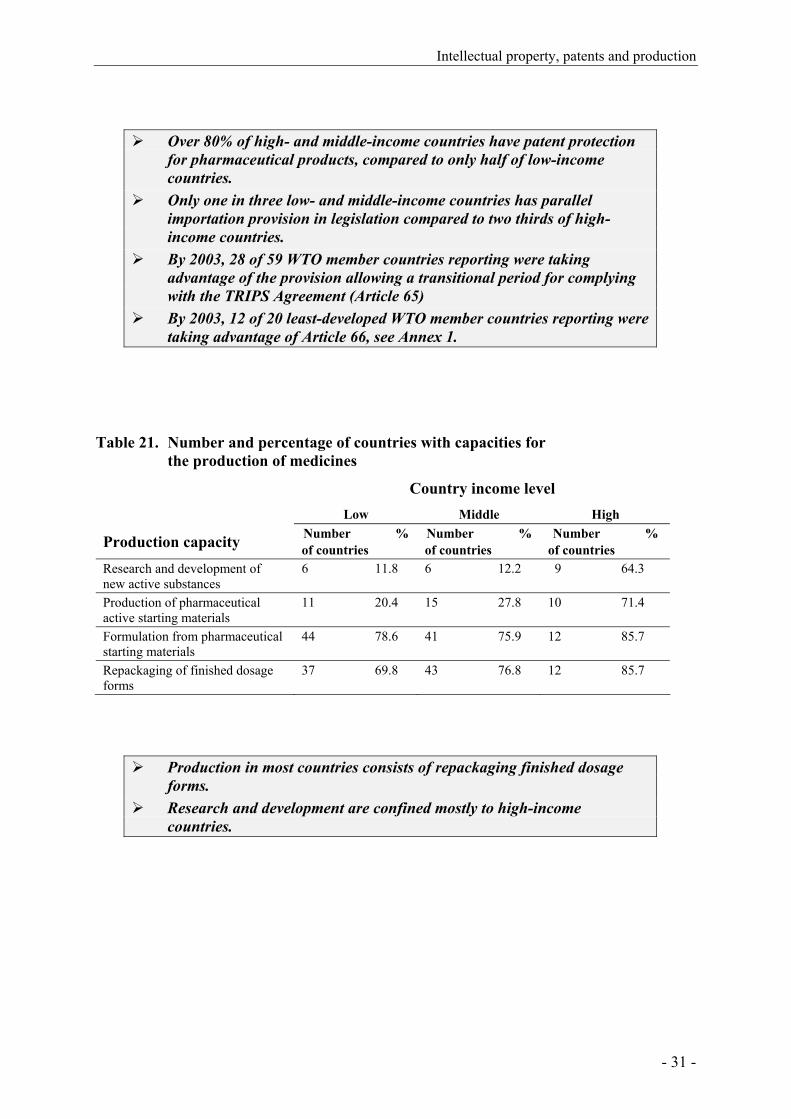
Intellectual property, patents and production
- 31 -
Over 80% of high- and middle-income countries have patent protection for pharmaceutical products, compared to only half of low-income countries.
Only one in three low- and middle-income countries has parallel importation provision in legislation compared to two thirds of high-income countries.
By 2003, 28 of 59 WTO member countries reporting were taking advantage of the provision allowing a transitional period for complying with the TRIPS Agreement (Article 65)
By 2003, 12 of 20 least-developed WTO member countries reporting were taking advantage of Article 66, see Annex 1.
Table 21. Number and percentage of countries with capacities for the production of medicines
Country income level Low Middle High
Production capacity Number % of countries
Number % of countries
Number % of countries
Research and development of new active substances
6 11.8 6 12.2 9 64.3
Production of pharmaceutical active starting materials
11 20.4 15 27.8 10 71.4
Formulation from pharmaceutical starting materials
44 78.6 41 75.9 12 85.7
Repackaging of finished dosage forms
37 69.8 43 76.8 12 85.7
Production in most countries consists of repackaging finished dosage forms.
Research and development are confined mostly to high-income countries.
Using indicators to measure country pharmaceutical situations
- 32 -

Access to essential medicines
- 33 -
8. ACCESS TO ESSENTIAL MEDICINES
8.1 Why is this important?
Essential medicines save lives, reduce suffering, and improve the functioning and well-being of people who have access to them. On the population level, access to affordable and appropriately used high-quality medicines boosts productivity and economic output (1). The Commission on Macroeconomics and Health (11) estimated in 2001 that 10.5 million lives per year could be saved by 2015 by scaling up access to existing health interventions to prevent and treat prevalent diseases – many of which depend on essential medicines.
Many factors, including all those reported in this Fact Book, determine access to essential medicines. Access can vary between urban and rural areas because of problems with health system development. Pharmacies, medicines distributors, health facilities, and public and private health providers are usually concentrated in cities and regional centres.
The retail prices of essential drugs can vary widely. Reliance on distribution of medicines in the private sector often means that essential medicines are too expensive for poor patients to afford.
8.2 What is the current situation?
Table 22: Estimated percentage of population with access to essential medicines by WHO region and country income level Level of access to essential medicines
within one hour’s walking distance
Very low access (< 50%) n = 18
Low to medium (50–80%)
n = 46
Medium to high (81–95%)
n = 20
Very high access (>95%) n = 20
WHO Region No. % of countries
No. % of countries
No. % of countries
No. % of countries
Africa 10 55.6 19 41.3 4 20.0 0 Americas 2 11.1 10 21.7 1 5.0 7 35.0 Eastern Mediterranean 1 5.6 2 4.3 4 20.0 1 5.0 Europe 3 16.7 6 13.0 2 10.0 9 45.0 South-East Asia 0 0.0 4 8.7 3 15.0 0 0.0 Western Pacific 2 11.1 5 10.9 6 30.0 3 15.0
Income level
Low 13 72.2 24 52.2 5 25.0 0 0.0 Medium 5 27.8 19 41.3 15 75.0 10 50.0 High 0 0.0 3 6.5 0 0.0 10 50.0
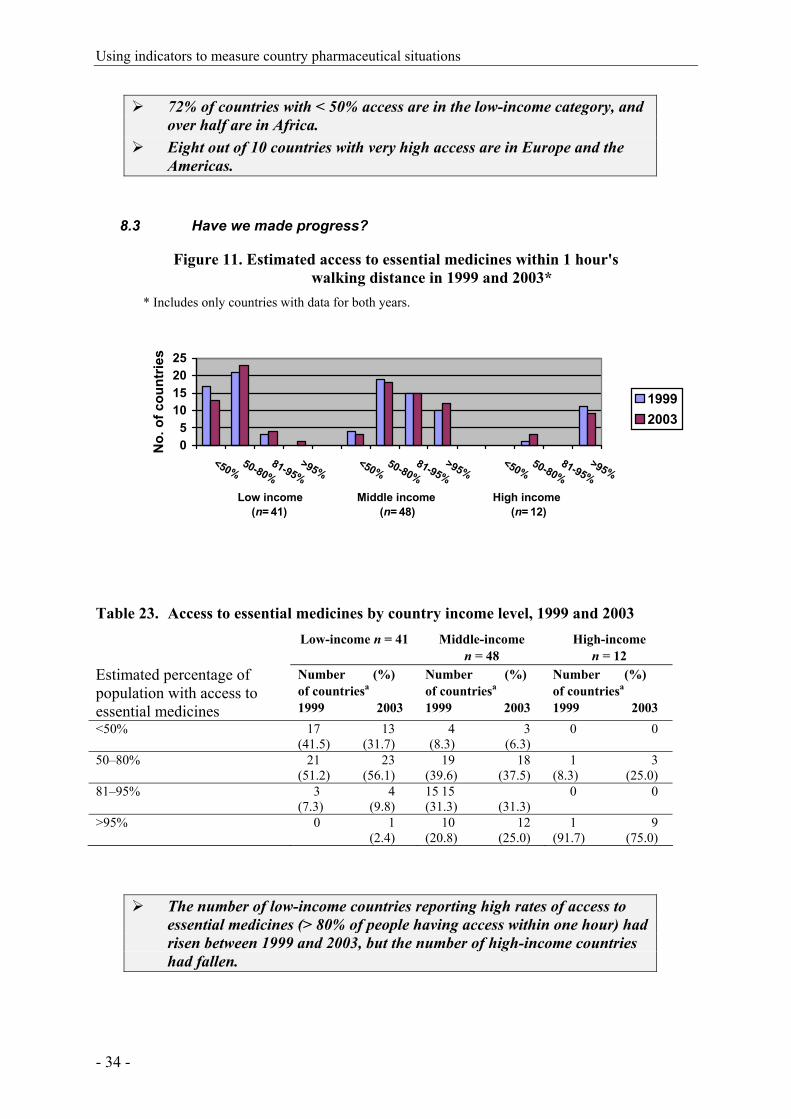
Using indicators to measure country pharmaceutical situations
- 34 -
72% of countries with < 50% access are in the low-income category, and over half are in Africa.
Eight out of 10 countries with very high access are in Europe and the Americas.
8.3 Have we made progress?
Figure 11. Estimated access to essential medicines within 1 hour's walking distance in 1999 and 2003*
* Includes only countries with data for both years.
05
10152025
<50%50-80%
81-95%>95%
<50%50-80%
81-95%>95%
<50%50-80%
81-95%>95%
Low income Middle income High income(n= 41) (n= 48) (n= 12)
No.
of c
ount
ries
19992003
Table 23. Access to essential medicines by country income level, 1999 and 2003 Low-income n = 41 Middle-income
n = 48 High-income
n = 12 Estimated percentage of population with access to essential medicines
Number (%) of countriesa 1999 2003
Number (%) of countriesa 1999 2003
Number (%) of countriesa 1999 2003
<50% 17 13 (41.5) (31.7)
4 3 (8.3) (6.3)
0 0
50–80% 21 23 (51.2) (56.1)
19 18 (39.6) (37.5)
1 3 (8.3) (25.0)
81–95% 3 4 (7.3) (9.8)
15 15 (31.3) (31.3)
0 0
>95% 0 1 (2.4)
10 12 (20.8) (25.0)
1 9 (91.7) (75.0)
The number of low-income countries reporting high rates of access to essential medicines (> 80% of people having access within one hour) had risen between 1999 and 2003, but the number of high-income countries had fallen.
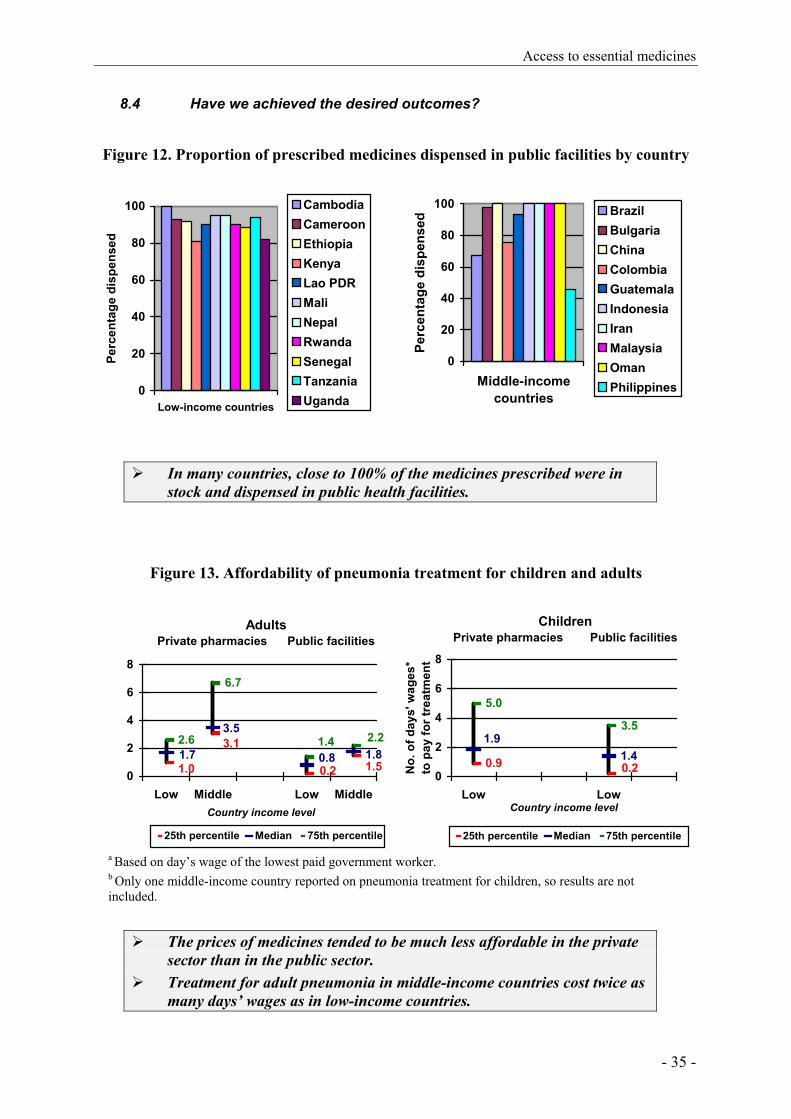
Access to essential medicines
- 35 -
8.4 Have we achieved the desired outcomes?
Figure 12. Proportion of prescribed medicines dispensed in public facilities by country
In many countries, close to 100% of the medicines prescribed were in stock and dispensed in public health facilities.
Figure 13. Affordability of pneumonia treatment for children and adults
AdultsPrivate pharmacies Public facilities
6.7
0.2
3.1
1.0 1.51.80.81.7
3.52.21.42.6
0
2
4
6
8
Low Middle Low MiddleCountry income level
25th percentile Median 75th percentile
ChildrenPrivate pharmacies Public facilities
1.40.20.9
1.93.5
5.0
0
2
4
6
8
Low LowCountry income level
No.
of d
ays'
wag
es*
to p
ay fo
r tre
atm
ent
25th percentile Median 75th percentile
a Based on day’s wage of the lowest paid government worker. b Only one middle-income country reported on pneumonia treatment for children, so results are not included.
The prices of medicines tended to be much less affordable in the private
sector than in the public sector. Treatment for adult pneumonia in middle-income countries cost twice as
many days’ wages as in low-income countries.
0
20
40
60
80
100
Middle-incomecountries
Perc
enta
ge d
ispe
nsed
BrazilBulgariaChinaColombiaGuatemalaIndonesiaIranMalaysiaOmanPhilippines0
20
40
60
80
100
Low-income countries
Perc
enta
ge d
ispe
nsed
CambodiaCameroonEthiopiaKenyaLao PDRMaliNepalRwandaSenegalTanzaniaUganda

Using indicators to measure country pharmaceutical situations
- 36 -

Rational use of medicines
- 37 -
9. RATIONAL USE OF MEDICINES
9.1 Why is this important?
Rational use of medicines means that “patients receive medications appropriate to their clinical needs, in doses that meet their own individual requirements, for an adequate period of time, and at the lowest cost to them and their community” (12). Overuse, underuse and misuse of medicines may lead to unnecessary suffering and death, and waste of scarce resources. Examples of irrational use of medicines include:
• use of antibiotics for non-bacterial illnesses, thus contributing to increased antimicrobial resistance;
• non adherence to recommended dosing regimens, preventing desired therapeutic outcomes from being achieved and potentially increasing antimicrobial resistance.
• use of expensive and frequently unsafe injections when less expensive oral formulations would be more appropriate, contributing to increased incidence of hepatitis B and C and HIV; and
Many factors influence use of medicines, and countries need to implement various strategies to improve rational use. Some policies, strategies and interventions found to be of value include: creating a mandated multi-disciplinary national body to coordinate policies on medicine use; standard treatment guidelines (STGs) for common conditions; using essential medicines lists (EMLs) to guide procurement and training; establishing drug and therapeutics committees to coordinate medicines management in hospitals; implementing problem-based pharmacotherapy training in undergraduate curricula; mandating continuing in-service medical education as a licensure requirement; establishing effective supervision in health systems; using audit and feedback to inform clinicians and facilities about their practice; developing independent sources of information about medicines for providers and consumers; avoiding perverse financial incentives to overuse medicines; establishing and enforcing a sound regulatory framework; and guaranteeing sufficient government expenditure to ensure availability of medicines and retain well-trained staff.
Essential medicines lists, treatment guidelines, formularies
9.2 Why is this important?
The essential medicines concept is the basis for rational use of medicines (1). Ideally, countries develop and routinely update EMLs and drug formularies that meet the needs of their population according to a number of criteria, including disease patterns, patient characteristics, treatment recommendations formulated in STGs, and level of care provided. Using an EML makes management of medicines easier in all respects: procurement, storage and distribution are easier with fewer items, and prescribing and dispensing are

Using indicators to measure country pharmaceutical situations
- 38 -
more straightforward for health professionals if they have to know about fewer medicines. A national EML should be based upon national STGs.
Together an EML and STGs help to ensure rational drug use. STGs should be developed for each level of care, based on prevalent clinical conditions and the skills of prescribers practicing at that level. The STGs consist of systematically developed statements to help prescribers make decisions about appropriate treatments for specific clinical conditions, providing a benchmark for satisfactory diagnosis and treatment. Adherence to the recommendations in STGs should be reinforced by prescription audit and feedback.
A formulary can be an important source of evidence-based information about medicines but it is important that it is consistent with STGs and the EML if all three strategies are to achieve the maximum overall effect.
9.3 What is the current situation?
Figure 14. Countries with essential medicines lists (EMLs) updated within last five years
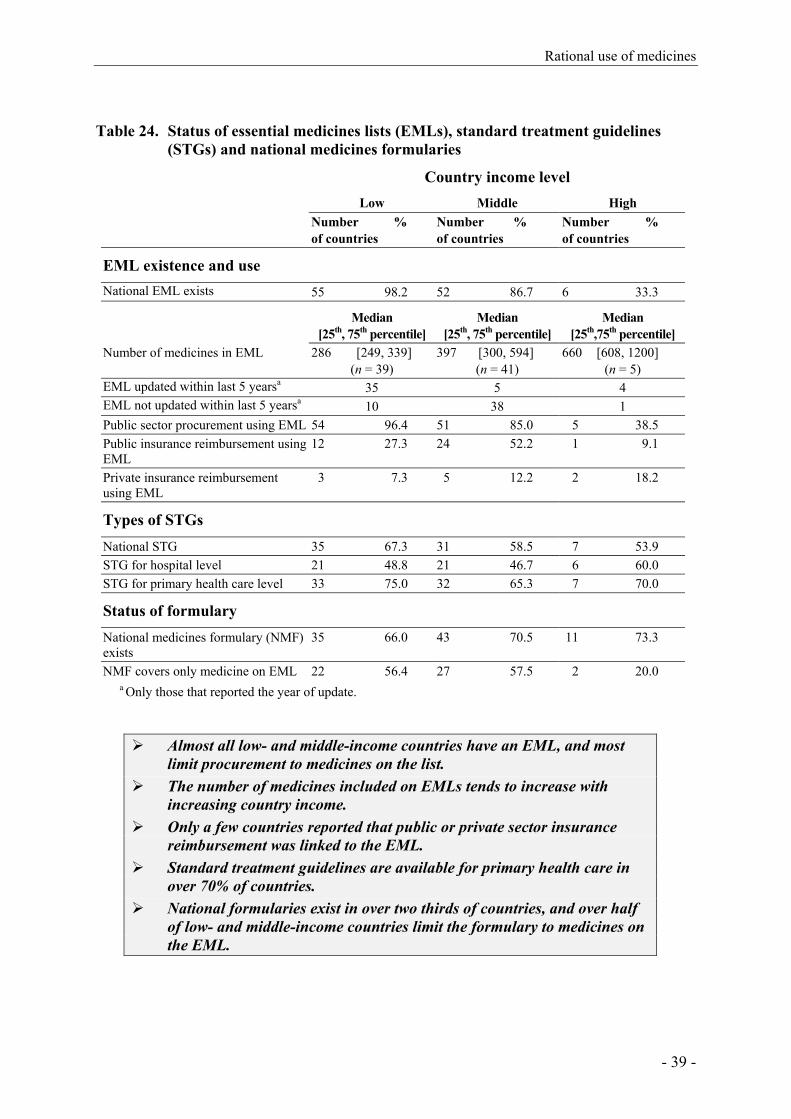
Rational use of medicines
- 39 -
Table 24. Status of essential medicines lists (EMLs), standard treatment guidelines (STGs) and national medicines formularies
Country income level Low Middle High Number %
of countries Number % of countries
Number % of countries
EML existence and use
National EML exists 55 98.2 52 86.7 6 33.3 Median
[25th, 75th percentile] Median
[25th, 75th percentile] Median
[25th,75th percentile] Number of medicines in EML 286 [249, 339]
(n = 39) 397 [300, 594]
(n = 41) 660 [608, 1200]
(n = 5) EML updated within last 5 yearsa 35 5 4 EML not updated within last 5 yearsa 10 38 1 Public sector procurement using EML 54 96.4 51 85.0 5 38.5 Public insurance reimbursement using EML
12 27.3 24 52.2 1 9.1
Private insurance reimbursement using EML
3 7.3 5 12.2 2 18.2
Types of STGs
National STG 35 67.3 31 58.5 7 53.9 STG for hospital level 21 48.8 21 46.7 6 60.0 STG for primary health care level 33 75.0 32 65.3 7 70.0
Status of formulary
National medicines formulary (NMF) exists
35 66.0 43 70.5 11 73.3
NMF covers only medicine on EML 22 56.4 27 57.5 2 20.0 a Only those that reported the year of update.
Almost all low- and middle-income countries have an EML, and most limit procurement to medicines on the list.
The number of medicines included on EMLs tends to increase with increasing country income.
Only a few countries reported that public or private sector insurance reimbursement was linked to the EML.
Standard treatment guidelines are available for primary health care in over 70% of countries.
National formularies exist in over two thirds of countries, and over half of low- and middle-income countries limit the formulary to medicines on the EML.

Using indicators to measure country pharmaceutical situations
- 40 -
9.4 Have we made progress?
Table 25. Status of essential medicines lists (EMLs) in 1999 and 2003a Country income level
Low Middle High
EML status Number
of countries 1999 2003
Number of countries
1999 2003
Number of countries
1999 2003 EML < 5 years (updated)a 38 34 42 39 7 5 EML > 5 years (not updated)a 14 9 16 5 7 none listed 1999 EML not updated in previous 5 years, but updated by 2003b
7/14 (50.0)
9/16 (56.3)
0 (0.0)
a Includes only countries responding and indicating date of update in both years. b Includes countries responding in both years (with EML >5 years in 1999 and has updated in 2003.
Table 26. National standard treatment guideline (STG) status in 1999 and 2003 1999 2003
Number of countries
Number of countries
STGs updated within previous 3 years 37 14 STGs not updated within previous 3 years 87 78
Most countries have updated their EML. Most countries have STGs, but some have not been updated recently.
9.5 Have we achieved desired outcomes?
Table 27. Presence/availability of essential medicines list (EML) and standard treatment guidelines (STGs) and adherence to EML in prescribing
Country income level
In public facilities Low Middle
Number (%) of countries with current EML present in public facilities
10 83.3 8 88.9
Number (%) of countries with at least 2 STGs present (1 national and 1 disease-specific)
10 83.3 8 88.9
Median [25th, 75th percentile]
Median [25th, 75th percentile]
% patients prescribed medicines on EML 91.5 [85.4, 93.8] (n = 11)
97.0 [86.6,100] (n = 9)
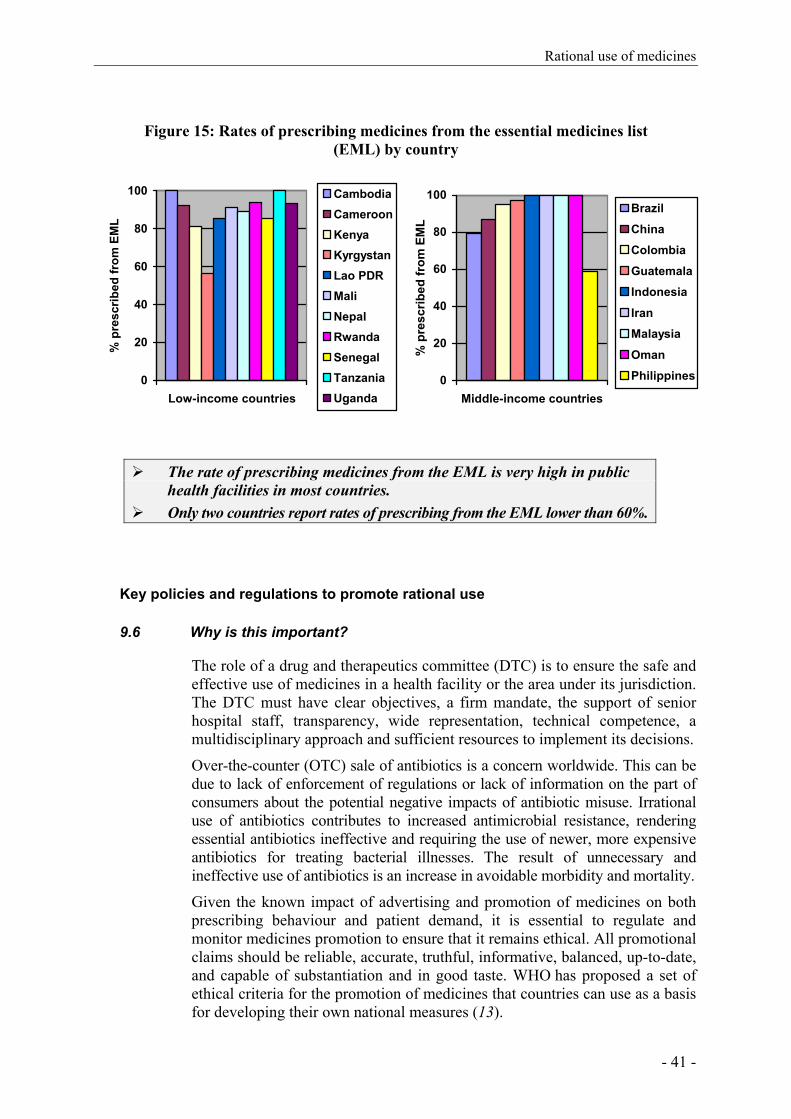
Rational use of medicines
- 41 -
Figure 15: Rates of prescribing medicines from the essential medicines list (EML) by country
0
20
40
60
80
100
Low-income countries
% p
resc
ribed
from
EM
L
CambodiaCameroonKenyaKyrgystanLao PDRMaliNepalRwandaSenegalTanzaniaUganda
0
20
40
60
80
100
Middle-income countries
% p
resc
ribed
from
EM
L
Brazil
China
Colombia
Guatemala
Indonesia
Iran
Malaysia
Oman
Philippines
The rate of prescribing medicines from the EML is very high in public health facilities in most countries.
Only two countries report rates of prescribing from the EML lower than 60%.
Key policies and regulations to promote rational use
9.6 Why is this important?
The role of a drug and therapeutics committee (DTC) is to ensure the safe and effective use of medicines in a health facility or the area under its jurisdiction. The DTC must have clear objectives, a firm mandate, the support of senior hospital staff, transparency, wide representation, technical competence, a multidisciplinary approach and sufficient resources to implement its decisions.
Over-the-counter (OTC) sale of antibiotics is a concern worldwide. This can be due to lack of enforcement of regulations or lack of information on the part of consumers about the potential negative impacts of antibiotic misuse. Irrational use of antibiotics contributes to increased antimicrobial resistance, rendering essential antibiotics ineffective and requiring the use of newer, more expensive antibiotics for treating bacterial illnesses. The result of unnecessary and ineffective use of antibiotics is an increase in avoidable morbidity and mortality.
Given the known impact of advertising and promotion of medicines on both prescribing behaviour and patient demand, it is essential to regulate and monitor medicines promotion to ensure that it remains ethical. All promotional claims should be reliable, accurate, truthful, informative, balanced, up-to-date, and capable of substantiation and in good taste. WHO has proposed a set of ethical criteria for the promotion of medicines that countries can use as a basis for developing their own national measures (13).
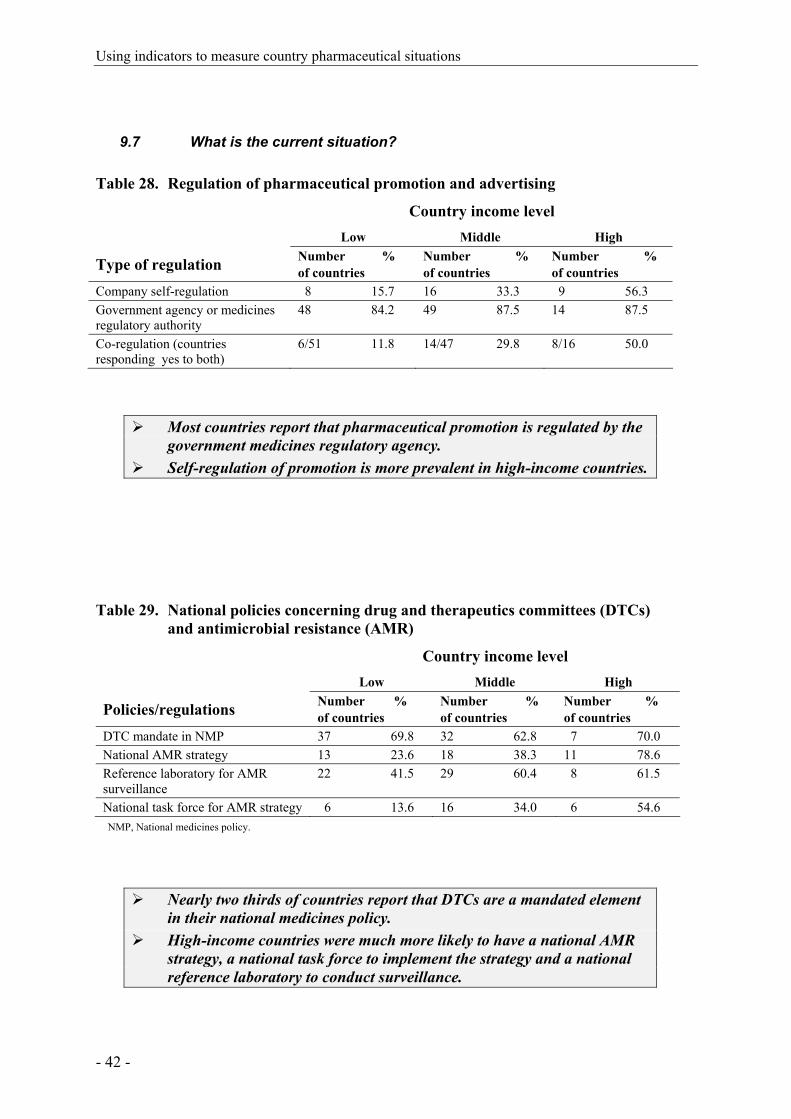
Using indicators to measure country pharmaceutical situations
- 42 -
9.7 What is the current situation?
Table 28. Regulation of pharmaceutical promotion and advertising Country income level Low Middle High
Type of regulation Number % of countries
Number % of countries
Number % of countries
Company self-regulation 8 15.7 16 33.3 9 56.3 Government agency or medicines regulatory authority
48 84.2 49 87.5 14 87.5
Co-regulation (countries responding yes to both)
6/51 11.8 14/47 29.8 8/16 50.0
Most countries report that pharmaceutical promotion is regulated by the government medicines regulatory agency.
Self-regulation of promotion is more prevalent in high-income countries.
Table 29. National policies concerning drug and therapeutics committees (DTCs) and antimicrobial resistance (AMR)
Country income level Low Middle High
Policies/regulations Number % of countries
Number % of countries
Number % of countries
DTC mandate in NMP 37 69.8 32 62.8 7 70.0 National AMR strategy 13 23.6 18 38.3 11 78.6 Reference laboratory for AMR surveillance
22 41.5 29 60.4 8 61.5
National task force for AMR strategy 6 13.6 16 34.0 6 54.6 NMP, National medicines policy.
Nearly two thirds of countries report that DTCs are a mandated element in their national medicines policy.
High-income countries were much more likely to have a national AMR strategy, a national task force to implement the strategy and a national reference laboratory to conduct surveillance.

Rational use of medicines
- 43 -
9.8 Have we achieved desired outcomes?
Table 30. Establishment of drug and therapeutics committees in hospitalsa Country Income Level Low Middle High
Level of hospital Number % of countries
Number % of countries
Number % of countries
Referral hospitals 25 52.1 27 61.4 6 85.7 General hospitals 19 38.8 25 55.6 10 90.9 Regional/provincial hospitals 17 36.2 13 31.7 6 75.0
a Countries responding that all or most hospitals have drug and therapeutics committees.
The number of DTCs remains low in medium- and low-income countries.
Table 31. Over-the-counter (OTC) sales of antibiotics and injectionsa Country income level Low Middle High
Type of medication Number % of countries
Number % of countries
Number % of countries
Antibiotics never available OTC 5/26 19.2 17/34 50.0 8/17 47.0 Antibiotics occasionally available OTC
18/26 69.2 15/34 44.1 6/17 35.2
Injections never available OTC 6/29 20.6 22/43 51.1 11/16 68.7 Injections occasionally available OTC
19/29 65.5 19/43 44.1 3/16 18.7
a Only countries that responded to the questions of whether antibiotics and injections are “ always”, “only on occasion” or “never sold OTC”.
Very few low-income countries reported that antibiotics and injections are never sold OTC and the majority reported that they were occasionally sold OTC; few responding countries reported that antibiotics and injections are always sold OTC.

Using indicators to measure country pharmaceutical situations
- 44 -
Education and information about rational use
9.9 Why is this important?
Rational use of medicines depends on the knowledge, attitudes and behaviours of prescribers and patients. Training in rational pharmacotherapy, linked to STGs and EMLs, can help establish good prescribing habits and should be part of the basic curricula of medical, nursing and pharmacy students. In-service education allows health workers to keep up to date with changes in pharmacotherapy, to become familiar with policies, to share experiences and learn from discussion with their peers. In some countries, continuing education is a licensure requirement for health professionals. Continuing education is more likely to be effective if it is problem-based, face-to-face, targeted, and involves professional societies, universities and the ministry of health.
Patient demand and popular media are important drivers of medicines use. Without sufficient and accurate knowledge about the risks and benefits of using medicines, consumers can have unrealistic expectations. Countries should consider a range of strategies to better inform consumers about appropriate use of medicines.
Frequently, advertising by pharmaceutical companies is the only source of easily available information on medicines. Unbiased consumer information on use of medicines is much needed in the form of public education campaigns or through independent information centres. Targeted public education should take into account the cultural beliefs and social factors that influence use of medicines.
Health facilities where medicines are dispensed should also provide adequate information through verbal information and adequate labelling. Both prescription and non-prescription medicines should have labels that are accurate, legible and easily understood.

Rational use of medicines
- 45 -
9.10 What is the current situation?
Table 32. Types of basic medicines training available to health workers Country income level Low Middle High
EML concepts Number % of countries
Number % of countries
Number % of countries
Doctors 33 67.4 25 67.6 5 62.5 Nurses 39 76.5 25 65.8 3 42.9 Pharmacists 38 77.6 32 78.1 3 42.9 Pharmacy assistants 30 65.2 22 56.4 2 25.0 Paramedical staff 24 57.1 12 46.2 0 0.0
STG concepts
Doctors 28 62.2 23 67.7 6 85.7 Nurses 30 62.5 20 62.5 4 66.7 Pharmacists 28 63.6 17 46.0 4 66.7 Pharmacy assistants 22 50.0 10 33.3 1 14.3 Paramedical staff 18 42.9 12 46.2 0 0.0
Pharmacotherapy training
Doctors 27 62.8 25 83.3 7 77.8 Nurses 20 47.6 14 51.9 3 42.9 Pharmacists 27 62.8 19 55.9 2 28.6 Pharmacy assistants 14 33.3 10 35.7 0 0.0 Paramedical staff 10 27.0 7 30.4 0 0.0
Rational prescribing concepts
Doctors 31 70.5 25 78.1 7 87.5 Nurses 28 62.2 19 63.3 4 57.1 Pharmacists 26 61.9 23 65.7 4 57.1 Pharmacy assistants 17 41.5 13 43.3 1 12.5 Paramedical staff 14 35.9 8 33.3 0 0.0
EML, Essential medicines list; STG, standard treatment guideline.
Health professionals are widely exposed to concepts of EMLs, STGs, problem-based pharmacotherapy and rational prescribing during basic training.
Table 33. Obligatory continuing education on medicines for health care providers Country income level
Low Middle High
Provider type Number % of countries
Number % of countries
Number % of countries
Doctors 20 37.7 28 53.8 7 77.8 Nurses/midwives/paramedical staff 22 40.7 18 40.0 5 55.6 Pharmacists 17 32.1 26 49.1 6 60.0 Pharmacy aides/assistants 14 26.4 17 34.7 4 44.4

Using indicators to measure country pharmaceutical situations
- 46 -
The likelihood of requiring mandatory continuing education for health
professionals increases with country income.
Accessibility of medicines information
9.11 What is the current situation?
Table 34. Public or independent medicines information for providers and consumers Country income level Low Middle High
Recipient Number % of countries
Number % of countries
Number % of countries
Prescribers 18 32.1 28 45.2 6 46.2 Dispensers 17 30.9 29 48.3 6 46.2 Consumers 14 25.5 24 40.7 7 53.9
Public or independently funded national drug information services were available for health workers or patients in less than half the countries, irrespective of income level.
Low-income countries have the lowest rates of provision of drug information.
Table 35. Public education campaigns on rational medicines use topics Country income level Low Middle High
Topic of campaign Number % of countries
Number % of countries
Number % of countries
Use of antibioticsa 20 37.0 26 49.1 9 64.3 Use of injectionsa 20 36.4 17 34.7 2 18.2 Other topics/issuesa 27 51.9 30 61.2 7 58.3
a Campaign must have been conducted in the previous 2 years (2001–2003).
The likelihood of public education about antibiotic use and misuse increases with country income level.
Injection use is more often the focus of public education in low- and middle-income countries.

Rational use of medicines
- 47 -
9.12 Have we made progress?
Table 36. Medicines information for prescribers and dispensers in 1999 and 2003a Country income level Low Middle High Information recipients Number %
of countries Number % of countries
Number % of countries
1999 prescribers/dispensers 12 38.7 26 51.0 8 66.7 2003 prescribers 18 32.1 28 45.2 6 46.2 2003 dispensers 17 30.9 29 48.3 6 46.2
a Asked about prescribers and dispensers in combination in 1999, but asked about them separately in 2003.
The percentage of countries that support national medicines information services for prescribers and dispensers does not appear to have increased between 1999 and 2003 at any income level.
9.13 Have we achieved desired outcomes?
Figure 16. Prescribing of antibiotics and injections
Antibiotics Injections
11.3
0.0
45.036.7
23.1
6.7
51.743.350.0
60.0
28.8
10.50
20
40
60
80
Low Middle Low Middle
Country income level
% o
f pat
ient
s
25th percentile Median 75th percentile
The percentage of patients prescribed antibiotics is high in all countries. Prescribing of injections is still very high in low-income countries.
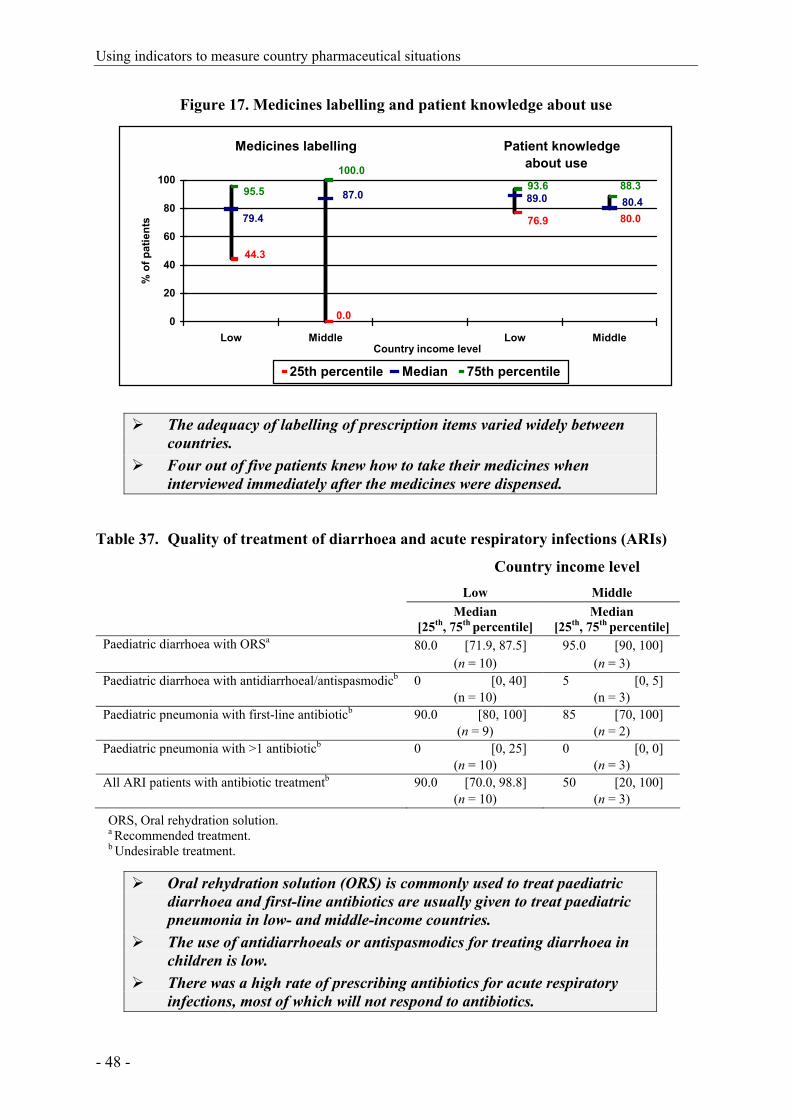
Using indicators to measure country pharmaceutical situations
- 48 -
Figure 17. Medicines labelling and patient knowledge about use
Medicines labelling Patient knowledge about use
80.0
44.3
0.0
76.9
89.087.0
79.480.4
95.5 93.6 88.3100.0
0
20
40
60
80
100
Low Middle Low MiddleCountry income level
% o
f pat
ient
s
25th percentile Median 75th percentile
The adequacy of labelling of prescription items varied widely between
countries. Four out of five patients knew how to take their medicines when
interviewed immediately after the medicines were dispensed.
Table 37. Quality of treatment of diarrhoea and acute respiratory infections (ARIs) Country income level Low Middle Median
[25th, 75th percentile] Median
[25th, 75th percentile] Paediatric diarrhoea with ORSa 80.0 [71.9, 87.5] 95.0 [90, 100] (n = 10) (n = 3) Paediatric diarrhoea with antidiarrhoeal/antispasmodicb 0 [0, 40] 5 [0, 5] (n = 10) (n = 3) Paediatric pneumonia with first-line antibioticb 90.0 [80, 100] 85 [70, 100] (n = 9) (n = 2) Paediatric pneumonia with >1 antibioticb 0 [0, 25] 0 [0, 0] (n = 10) (n = 3) All ARI patients with antibiotic treatmentb 90.0 [70.0, 98.8] 50 [20, 100] (n = 10) (n = 3) ORS, Oral rehydration solution. a Recommended treatment. b Undesirable treatment.
Oral rehydration solution (ORS) is commonly used to treat paediatric diarrhoea and first-line antibiotics are usually given to treat paediatric pneumonia in low- and middle-income countries.
The use of antidiarrhoeals or antispasmodics for treating diarrhoea in children is low.
There was a high rate of prescribing antibiotics for acute respiratory infections, most of which will not respond to antibiotics.
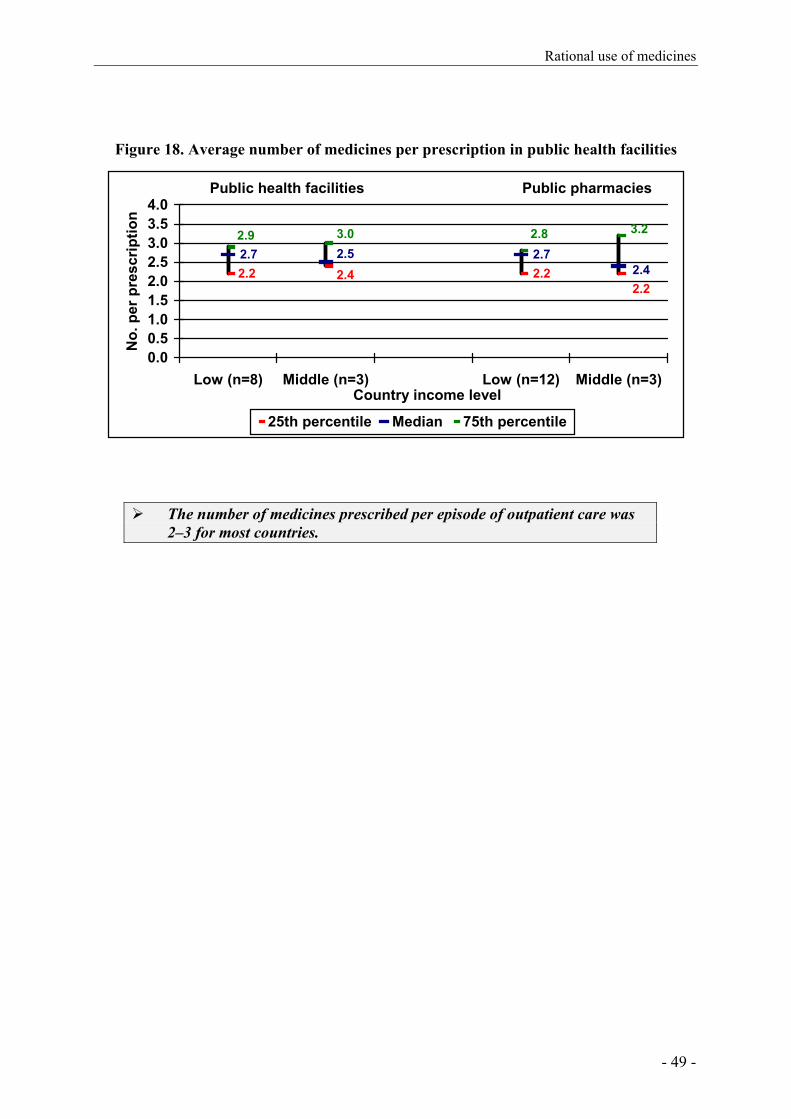
Rational use of medicines
- 49 -
Figure 18. Average number of medicines per prescription in public health facilities
Public health facilities Public pharmacies
2.22.7 2.7
2.22.2 2.4 2.4
2.53.02.9 2.8 3.2
0.00.51.01.52.02.53.03.54.0
Low (n=8) Middle (n=3) Low (n=12) Middle (n=3)Country income level
No.
per
pre
scrip
tion
25th percentile Median 75th percentile
The number of medicines prescribed per episode of outpatient care was 2–3 for most countries.

Using indicators to measure country pharmaceutical situations
- 50 -

Methodological limitations and recommendations
- 51 -
10. METHODOLOGICAL LIMITATIONS AND RECOMMENDATIONS
10.1 Accomplishments
Much progress has been made since WHO began developing indicators for monitoring country pharmaceutical situations more than 10 years ago (14, 15). This Fact Book summarizes what is known about country pharmaceutical situations, using the most recently collected data on Level I and Level II indicators. With 140 of 192 WHO Member States responding to Level I surveys in 2003, many data on the structure and process of pharmaceutical sectors are available. Some comparisons with 1999 data are now possible as the start of longitudinal monitoring. Data on access to, and quality and rational use of medicines have been collected in Level II surveys of samples of facilities in 31 countries. The methodology for data collection has been refined, and trained individuals are now available in countries to conduct future Level II surveys.
Using the current indicators and methods, countries are able to perform comprehensive assessments of their pharmaceutical sector, to evaluate their data in the light of existing policies and in comparison to other countries, and to develop strategies for change and improvement.
Analyses of the Level I and Level II survey data contained in this Fact Book also highlight some of the limitations of the surveys and point to recommendations for future improvements. Limitations fall into two broad categories: limitations of the current questionnaires and data collection instruments, and limitations related to survey administration and data management.
10.2 Limitations of the questionnaire and recommendations for improvement
The current Level I questionnaire is long; some skip patterns are difficult to follow, and, based on responses received, the wording of several items was unclear. These characteristics tended to increase the amount of missing data. Changes in the wording of some items between the 1999 and the 2003 surveys limited the possibilities for comparing results over time.
In future surveys, the Level I questionnaire could be shortened by focusing on key items with face validity and high response rates which also are important for longitudinal monitoring. Administering the survey electronically using a web-based technology where skip patterns can be automatically controlled would eliminate confusion in the flow of items and force completion of required items.
It is important to note that informed country officials are asked to provide Level I data, and the accuracy of the data depends largely on the knowledge of individual respondents. Some data asked for in the survey may be difficult to obtain, particularly when numerical estimates are required (e.g. percentage of the population with access to medicines within 1 hour’s walking distance and percentage of cost of medicines covered by insurance).

Using indicators to measure country pharmaceutical situations
- 52 -
It is unclear to what extent responses to Level I questionnaires would coincide if two respondents were to be asked. Some items may be more liable to subjective errors, and completion of the survey by more than one individual could be used to test the reliability of data on individual items. Responses to some items could also be validated against data from other sources. Only items with high reliability and validity should be retained in future surveys.
The current Level II surveys assess the overall situation related to availability and use of medicines in small convenience samples of health centres and pharmacies. The aim of these surveys is to provide reasonable indicators of policy issues to be targeted in future interventions. Because the samples are small, the results cannot capture all aspects of the situation in the country as a whole. When countries desire more precise estimates, the numbers, types and geographical distribution of facilities can be expanded.
10.3 Limitations of data management and recommendations for improvement
Level I and II surveys are currently completed in the form of electronic questionnaires sent to respondents in the countries being surveyed. As mentioned above, one way to increase the reliability of data and decrease the numbers of missing responses would be to develop an automated web-based data collection method for both surveys, with built-in controls for admissible answers, an online glossary of terms, and answers to frequently asked questions. For greater consistency over time, respondents could be shown their previous answers to individual survey items. Collection of Level II survey data requires fieldwork. Additional training for collectors of data in Level II surveys may be needed to increase data quality. Standard computerized data entry and reporting templates would facilitate data analysis.
10.4 Further development of a household survey
Level I and Level II surveys do not measure access to and use of medicines from the perspective of patients and consumers. Only household surveys can provide population-based information about how pharmaceutical policies affect the well-being of individuals. Household surveys were tested on a pilot basis in some Level II surveys. The methods and content of these household surveys will need further work to develop standardized approaches to assess whether and how people access medicines, how they use them, how much they pay for them, and how out-of-pocket payments for medicines affect household finances.
10.5 Development of composite scores
Monitoring involves looking at many different aspects of the structure, process and outcomes of a pharmaceutical system. It would be advantageous to be able to summarize key dimensions of performance such as access or rational use with a single composite score. For example, the current Level I questionnaire contains 19 questions on various aspects of access to medicines. A composite access score might be able to summarize these items into one measure that gives an indication of the overall performance of the system in this area.

Methodological limitations and recommendations
- 53 -
Responses to the individual Level I items that contribute to such a score would guide the development of strategies for improvement.
Composite measures of Level I structure and process indicators would be particularly advantageous if they could reliably predict performance on Level II outcome indicators. If Level I composite scores correlated well with Level II indicators of access and rational use, then it may be possible to use Level I data, which are easier and less expensive to collect, to monitor progress in these domains. Level II surveys could then be targeted to countries for which Level I access composite scores indicate a problem. Psychometric methods exist for the systematic development of composite and index scores from individual items and scales. These methods use statistical tests to evaluate the correlations between items and their optimal contribution to an overall score (for example, access to medicines). Only items that are sufficiently correlated would be included in a composite score. Correlation coefficients rather than expert opinion would form the basis for weighting the items that contribute to a composite score.
To proceed with the development of composite scores would require a multi-step approach. The first step would be to define the aspect that each composite score is intended to measure (e.g. access to medicines, rational use and product quality assurance), as well as specific components of that domain (e.g. availability, affordability and acceptability might all be components of the domain of access to medicines). The second step would be to formulate specific questions with face validity that address each of the identified components. These questions would include many of the current Level I items. Next, several respondents would be asked to complete the individual items and the reliability of their responses would be checked. Finally, for items that prove to be reliable, statistical methods would be used to develop an overall composite measure for each domain.
Validating each composite score would also include assessing its relationship with related domains. For example, composite scores of access to medicines should be higher in countries with higher incomes and/or cheaper medicines, as well as in countries with universal health insurance covering medicines. Similarly, if Level I composite scores are correlated with Level II indicators that measure outcomes of pharmaceutical objectives in a given domain, this would further validate the use of the composite score as a monitoring tool.

Using indicators to measure country pharmaceutical situations
- 54 -
References
- 55 -
REFERENCES
1) WHO medicines strategy 2004-2007. Countries at the core. Geneva, World Health Organization, 2004.
2) How to develop and implement a national drug policy. 2nd ed. Geneva, World Health Organization, 2001.
3) WHO operational package for monitoring and assessing country pharmaceutical situations. Guide for coordinators and data collectors. Geneva, World Health Organization, June 2003. Working draft.
4) The World Bank country classification: http://www.worldbank.org/data/countryclass/countryclass.html
5) National laboratories for drug quality surveillance and control. WHO Expert Committee on Specification for Pharmaceutical Preparations. Twenty-ninth Report. WHO Technical Report Series No.704, Annex 1. Geneva, World Health Organization, 1984.
6) Good laboratory practices in government drug control laboratories. WHO Expert Committee on Specification for Pharmaceutical Preparations. Twentieth Report. WHO Technical Report Series No.748, Annex 1. Geneva, World Health Organization, 1987.
7) Global comparative pharmaceutical expenditures with related reference information. Geneva, World Health Organization, 2000.
8) Xu K, et al. Household catastrophic health expenditure: a multicountry analysis. Lancet 2003; 362:111–117.
9) Holloway KA, Gautam BR, Reeves BC. The effects of different kinds of user fees on prescribing quality in rural Nepal. Journal of Clinical Epidemiology 2001; 54(10):1065-71.
10) The use of flexibilities in TRIPS by developing countries: can they promote access to medicines? South Centre and World Health Organization,2005 http://www.who.int/intellectualproperty/studies/TRIPS_flexibilities/en/index.html
11) Macroeconomics and health: Investing in health for economic development. Report of the Commission on Macroeconomics and Health. 2001. http://www3.who.int/whosis/cmh/cmh_report/e/pdf/cmh_english.zip
12) The rational use of drugs. Report of the Conference of Experts, Nairobi, 1985. Geneva, World Health Organization, 1985.
13) Ethical criteria for medicinal drug promotion. Geneva, World Health Organization, 1988.
14) Brudon P, et al. Indicators for monitoring national drug policies. Geneva, World Health Organization,1994.
15) Brudon P, et al. Indicators for monitoring national drug policies. 2nd ed. Geneva, World Health Organization,1999.
Using indicators to measure country pharmaceutical situations
- 56 -
Annexes
- 57 -
ANNEXES
1. Level I indicator survey form 2. Level II indicator survey and summary forms 3. Description of some Level II indicators reported in this Fact Book
4. Level I data from 2003, by country (alphabetically by country name and income-level
indicators); organized by sections in Level I survey and this final report.*
5. Level II data by country (alphabetically by country name and income-level indicators); organized by Access (6 indicators), Quality (2 indicators), Rational use of medicines indicators (10 indicators).*
6. Level I data from 1999, by country on variables used for comparisons between 1999 and 2003.*
7. Country income level by region * Available on CD-ROM. Requests should be addressed to the Department of Technical Cooperation for Essential Drugs and Traditional Medicine, World Health Organization, 1211 Geneva 27, Switzerland. Fax: + 41 22 791 4167, e-mail: [email protected]

Using indicators to measure country pharmaceutical situations
- 58 -
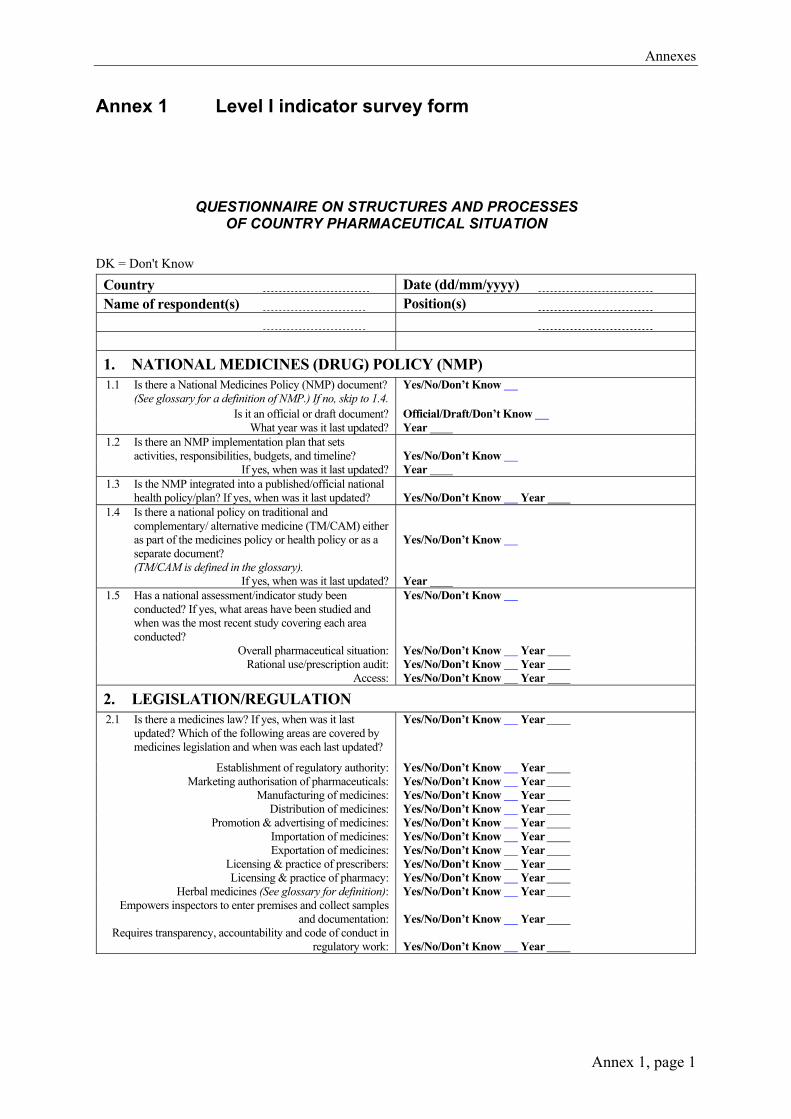
Annexes
Annex 1, page 1
Annex 1 Level I indicator survey form
QUESTIONNAIRE ON STRUCTURES AND PROCESSES
OF COUNTRY PHARMACEUTICAL SITUATION
DK = Don't Know
Country Date (dd/mm/yyyy) Name of respondent(s) Position(s) 1. NATIONAL MEDICINES (DRUG) POLICY (NMP) 1.1 Is there a National Medicines Policy (NMP) document?
(See glossary for a definition of NMP.) If no, skip to 1.4. Yes/No/Don’t Know
Is it an official or draft document? Official/Draft/Don’t Know What year was it last updated? Year
1.2 Is there an NMP implementation plan that sets activities, responsibilities, budgets, and timeline?
Yes/No/Don’t Know
If yes, when was it last updated? Year 1.3 Is the NMP integrated into a published/official national
health policy/plan? If yes, when was it last updated? Yes/No/Don’t Know Year
1.4 Is there a national policy on traditional and complementary/ alternative medicine (TM/CAM) either as part of the medicines policy or health policy or as a separate document? (TM/CAM is defined in the glossary).
Yes/No/Don’t Know
If yes, when was it last updated? Year 1.5 Has a national assessment/indicator study been
conducted? If yes, what areas have been studied and when was the most recent study covering each area conducted?
Yes/No/Don’t Know
Overall pharmaceutical situation: Yes/No/Don’t Know Year Rational use/prescription audit: Yes/No/Don’t Know Year
Access: Yes/No/Don’t Know Year
2. LEGISLATION/REGULATION 2.1 Is there a medicines law? If yes, when was it last
updated? Which of the following areas are covered by medicines legislation and when was each last updated?
Yes/No/Don’t Know Year
Establishment of regulatory authority: Yes/No/Don’t Know Year Marketing authorisation of pharmaceuticals: Yes/No/Don’t Know Year
Manufacturing of medicines: Yes/No/Don’t Know Year Distribution of medicines: Yes/No/Don’t Know Year
Promotion & advertising of medicines: Yes/No/Don’t Know Year Importation of medicines: Yes/No/Don’t Know Year Exportation of medicines: Yes/No/Don’t Know Year
Licensing & practice of prescribers: Yes/No/Don’t Know Year Licensing & practice of pharmacy: Yes/No/Don’t Know Year
Herbal medicines (See glossary for definition): Yes/No/Don’t Know Year Empowers inspectors to enter premises and collect samples
and documentation: Yes/No/Don’t Know Year
Requires transparency, accountability and code of conduct in regulatory work:
Yes/No/Don’t Know Year
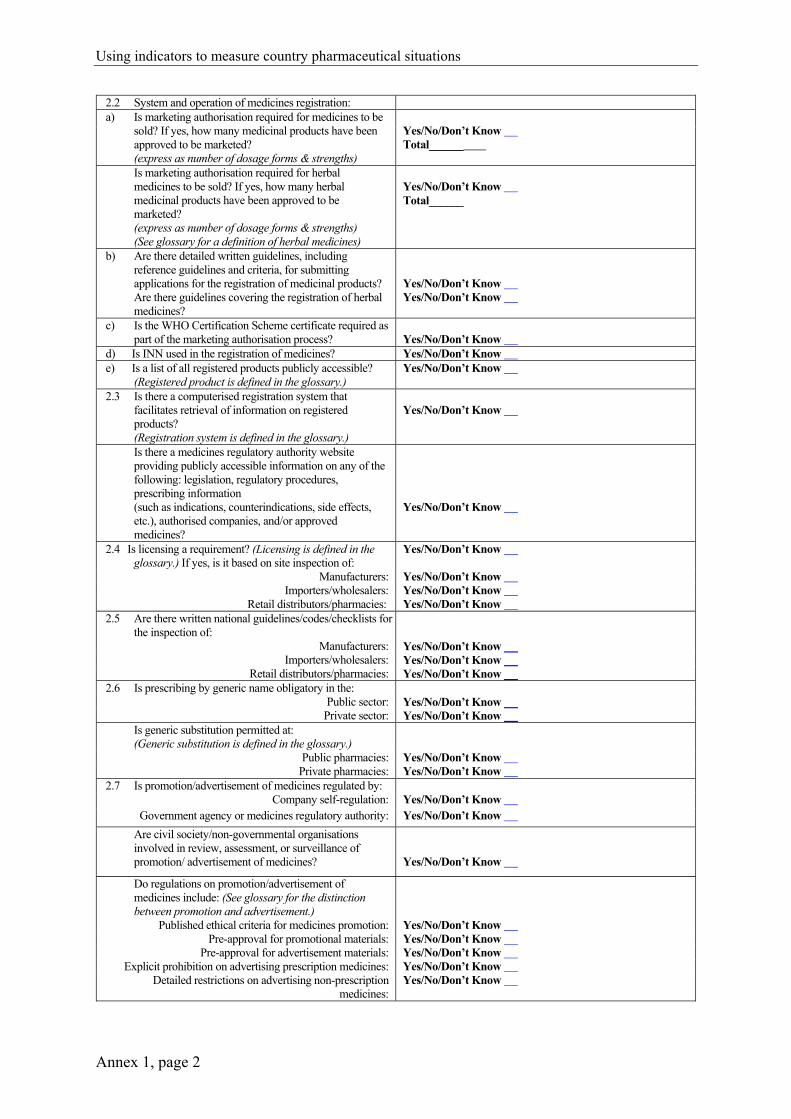
Using indicators to measure country pharmaceutical situations
Annex 1, page 2
2.2 System and operation of medicines registration: a) Is marketing authorisation required for medicines to be
sold? If yes, how many medicinal products have been approved to be marketed? (express as number of dosage forms & strengths)
Yes/No/Don’t Know Total______
Is marketing authorisation required for herbal medicines to be sold? If yes, how many herbal medicinal products have been approved to be marketed? (express as number of dosage forms & strengths) (See glossary for a definition of herbal medicines)
Yes/No/Don’t Know Total______
b) Are there detailed written guidelines, including reference guidelines and criteria, for submitting applications for the registration of medicinal products? Are there guidelines covering the registration of herbal medicines?
Yes/No/Don’t Know Yes/No/Don’t Know
c) Is the WHO Certification Scheme certificate required as part of the marketing authorisation process?
Yes/No/Don’t Know
d) Is INN used in the registration of medicines? Yes/No/Don’t Know e) Is a list of all registered products publicly accessible?
(Registered product is defined in the glossary.) Yes/No/Don’t Know
2.3 Is there a computerised registration system that facilitates retrieval of information on registered products? (Registration system is defined in the glossary.)
Yes/No/Don’t Know
Is there a medicines regulatory authority website providing publicly accessible information on any of the following: legislation, regulatory procedures, prescribing information (such as indications, counterindications, side effects, etc.), authorised companies, and/or approved medicines?
Yes/No/Don’t Know
2.4 Is licensing a requirement? (Licensing is defined in the glossary.) If yes, is it based on site inspection of:
Yes/No/Don’t Know
Manufacturers: Yes/No/Don’t Know Importers/wholesalers: Yes/No/Don’t Know
Retail distributors/pharmacies: Yes/No/Don’t Know 2.5 Are there written national guidelines/codes/checklists for
the inspection of:
Manufacturers: Yes/No/Don’t Know Importers/wholesalers: Yes/No/Don’t Know
Retail distributors/pharmacies: Yes/No/Don’t Know 2.6 Is prescribing by generic name obligatory in the:
Public sector: Yes/No/Don’t Know Private sector: Yes/No/Don’t Know
Is generic substitution permitted at: (Generic substitution is defined in the glossary.)
Public pharmacies: Yes/No/Don’t Know Private pharmacies: Yes/No/Don’t Know
2.7 Is promotion/advertisement of medicines regulated by: Company self-regulation: Yes/No/Don’t Know
Government agency or medicines regulatory authority: Yes/No/Don’t Know Are civil society/non-governmental organisations
involved in review, assessment, or surveillance of promotion/ advertisement of medicines?
Yes/No/Don’t Know
Do regulations on promotion/advertisement of medicines include: (See glossary for the distinction between promotion and advertisement.)
Published ethical criteria for medicines promotion: Yes/No/Don’t Know Pre-approval for promotional materials: Yes/No/Don’t Know
Pre-approval for advertisement materials: Yes/No/Don’t Know Explicit prohibition on advertising prescription medicines: Yes/No/Don’t Know
Detailed restrictions on advertising non-prescription medicines:
Yes/No/Don’t Know
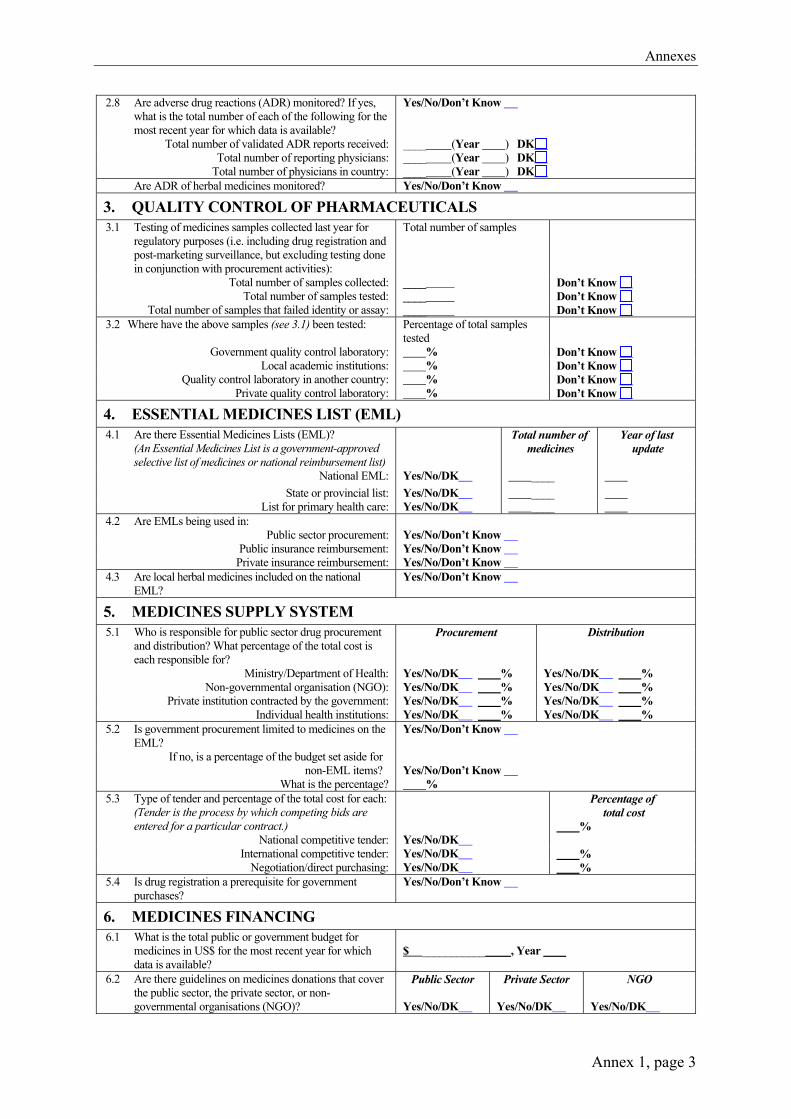
Annexes
Annex 1, page 3
2.8 Are adverse drug reactions (ADR) monitored? If yes, what is the total number of each of the following for the most recent year for which data is available?
Yes/No/Don’t Know
Total number of validated ADR reports received: ____ (Year ) DK Total number of reporting physicians: ____ (Year ) DK
Total number of physicians in country: ____ (Year ) DK Are ADR of herbal medicines monitored? Yes/No/Don’t Know
3. QUALITY CONTROL OF PHARMACEUTICALS 3.1 Testing of medicines samples collected last year for
regulatory purposes (i.e. including drug registration and post-marketing surveillance, but excluding testing done in conjunction with procurement activities):
Total number of samples
Total number of samples collected: ____ Don’t Know Total number of samples tested: ____ Don’t Know
Total number of samples that failed identity or assay: ____ Don’t Know 3.2 Where have the above samples (see 3.1) been tested: Percentage of total samples
tested
Government quality control laboratory: % Don’t Know Local academic institutions: % Don’t Know
Quality control laboratory in another country: % Don’t Know Private quality control laboratory: % Don’t Know
4. ESSENTIAL MEDICINES LIST (EML) 4.1 Are there Essential Medicines Lists (EML)?
(An Essential Medicines List is a government-approved selective list of medicines or national reimbursement list)
Total number of medicines
Year of last update
National EML: Yes/No/DK ____
State or provincial list: Yes/No/DK ____ List for primary health care: Yes/No/DK ____
4.2 Are EMLs being used in: Public sector procurement:
Yes/No/Don’t Know
Public insurance reimbursement: Yes/No/Don’t Know Private insurance reimbursement: Yes/No/Don’t Know
4.3 Are local herbal medicines included on the national EML?
Yes/No/Don’t Know
5. MEDICINES SUPPLY SYSTEM 5.1 Who is responsible for public sector drug procurement
and distribution? What percentage of the total cost is each responsible for?
Ministry/Department of Health:
Procurement Yes/No/DK %
Distribution Yes/No/DK %
Non-governmental organisation (NGO): Yes/No/DK % Yes/No/DK % Private institution contracted by the government: Yes/No/DK % Yes/No/DK %
Individual health institutions: Yes/No/DK % Yes/No/DK % 5.2 Is government procurement limited to medicines on the
EML? Yes/No/Don’t Know
If no, is a percentage of the budget set aside for non-EML items?
Yes/No/Don’t Know
What is the percentage? % 5.3 Type of tender and percentage of the total cost for each:
(Tender is the process by which competing bids are entered for a particular contract.)
National competitive tender:
Yes/No/DK
Percentage of total cost
%
International competitive tender: Yes/No/DK % Negotiation/direct purchasing: Yes/No/DK %
5.4 Is drug registration a prerequisite for government purchases?
Yes/No/Don’t Know
6. MEDICINES FINANCING 6.1 What is the total public or government budget for
medicines in US$ for the most recent year for which data is available?
$ ___________ , Year
6.2 Are there guidelines on medicines donations that cover the public sector, the private sector, or non-governmental organisations (NGO)?
Public Sector Yes/No/DK
Private Sector Yes/No/DK
NGO Yes/No/DK
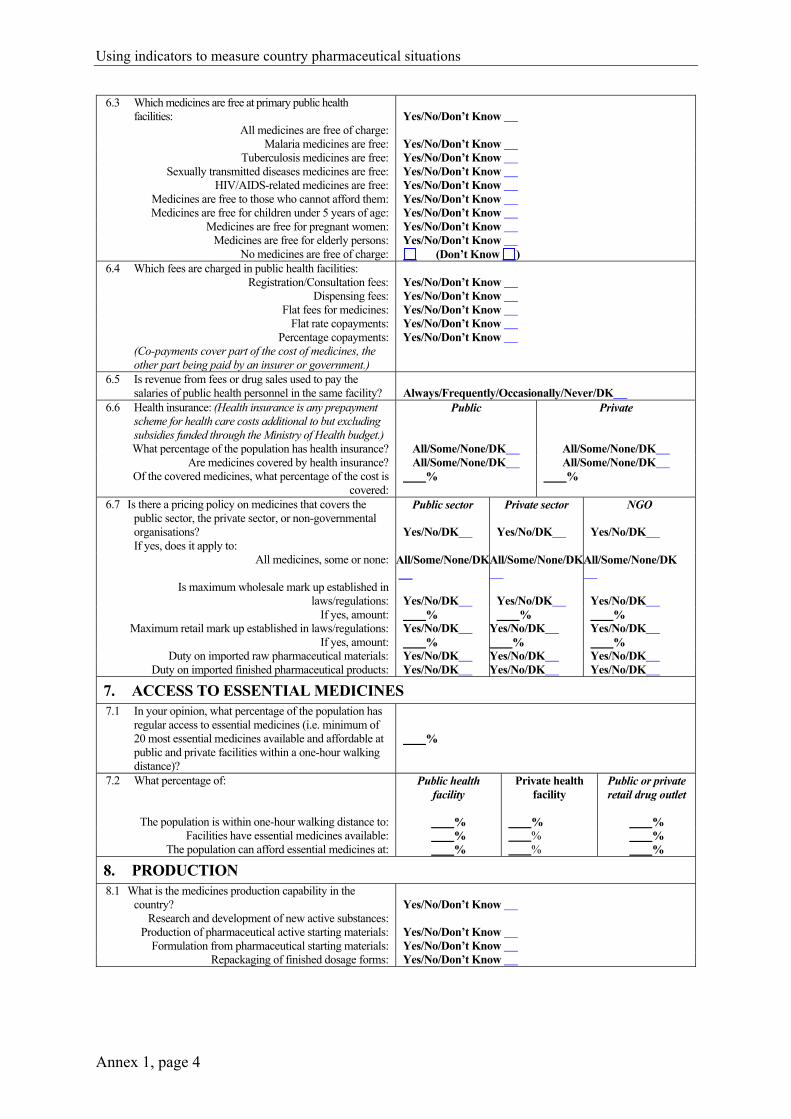
Using indicators to measure country pharmaceutical situations
Annex 1, page 4
6.3 Which medicines are free at primary public health facilities:
All medicines are free of charge:
Yes/No/Don’t Know
Malaria medicines are free: Yes/No/Don’t Know Tuberculosis medicines are free: Yes/No/Don’t Know
Sexually transmitted diseases medicines are free: Yes/No/Don’t Know HIV/AIDS-related medicines are free: Yes/No/Don’t Know
Medicines are free to those who cannot afford them: Yes/No/Don’t Know Medicines are free for children under 5 years of age: Yes/No/Don’t Know
Medicines are free for pregnant women: Yes/No/Don’t Know Medicines are free for elderly persons: Yes/No/Don’t Know
No medicines are free of charge: (Don’t Know ) 6.4 Which fees are charged in public health facilities:
Registration/Consultation fees: Yes/No/Don’t Know
Dispensing fees: Yes/No/Don’t Know Flat fees for medicines: Yes/No/Don’t Know
Flat rate copayments: Yes/No/Don’t Know Percentage copayments:
(Co-payments cover part of the cost of medicines, the other part being paid by an insurer or government.)
Yes/No/Don’t Know
6.5 Is revenue from fees or drug sales used to pay the salaries of public health personnel in the same facility?
Always/Frequently/Occasionally/Never/DK
6.6 Health insurance: (Health insurance is any prepayment scheme for health care costs additional to but excluding subsidies funded through the Ministry of Health budget.) What percentage of the population has health insurance?
Public
All/Some/None/DK
Private
All/Some/None/DK Are medicines covered by health insurance? All/Some/None/DK All/Some/None/DK
Of the covered medicines, what percentage of the cost is covered:
% %
6.7 Is there a pricing policy on medicines that covers the public sector, the private sector, or non-governmental organisations? If yes, does it apply to:
Public sector
Yes/No/DK
Private sector
Yes/No/DK
NGO
Yes/No/DK
All medicines, some or none: All/Some/None/DK
All/Some/None/DK
All/Some/None/DK
Is maximum wholesale mark up established in laws/regulations:
Yes/No/DK
Yes/No/DK
Yes/No/DK
If yes, amount: % % % Maximum retail mark up established in laws/regulations: Yes/No/DK Yes/No/DK Yes/No/DK
If yes, amount: % % % Duty on imported raw pharmaceutical materials: Yes/No/DK Yes/No/DK Yes/No/DK
Duty on imported finished pharmaceutical products: Yes/No/DK Yes/No/DK Yes/No/DK
7. ACCESS TO ESSENTIAL MEDICINES 7.1 In your opinion, what percentage of the population has
regular access to essential medicines (i.e. minimum of 20 most essential medicines available and affordable at public and private facilities within a one-hour walking distance)?
%
7.2 What percentage of:
The population is within one-hour walking distance to:
Public health facility
%
Private health facility
%
Public or private retail drug outlet
%
Facilities have essential medicines available: % % % The population can afford essential medicines at: % % %
8. PRODUCTION 8.1 What is the medicines production capability in the
country? Research and development of new active substances:
Yes/No/Don’t Know
Production of pharmaceutical active starting materials: Yes/No/Don’t Know Formulation from pharmaceutical starting materials: Yes/No/Don’t Know
Repackaging of finished dosage forms: Yes/No/Don’t Know
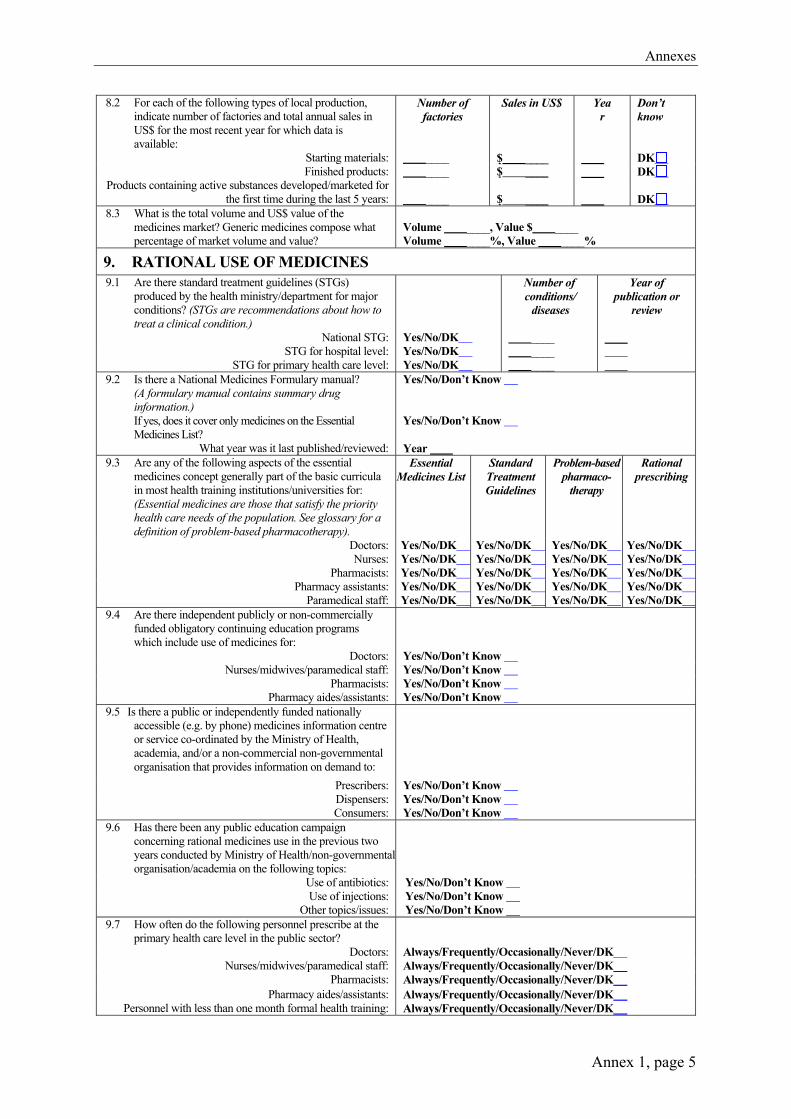
Annexes
Annex 1, page 5
8.2 For each of the following types of local production, indicate number of factories and total annual sales in US$ for the most recent year for which data is available:
Starting materials:
Number of factories
____
Sales in US$
$ ____
Yea r
Don’t know DK
Finished products: ____ $ ____ DK Products containing active substances developed/marketed for
the first time during the last 5 years: ____
$ ____
DK
8.3 What is the total volume and US$ value of the medicines market? Generic medicines compose what percentage of market volume and value?
Volume ____, Value $ ____ Volume ____%, Value ____%
9. RATIONAL USE OF MEDICINES 9.1 Are there standard treatment guidelines (STGs)
produced by the health ministry/department for major conditions? (STGs are recommendations about how to treat a clinical condition.)
National STG:
Yes/No/DK
Number of conditions/
diseases
____
Year of publication or
review
STG for hospital level: Yes/No/DK ____
STG for primary health care level: Yes/No/DK ____ 9.2 Is there a National Medicines Formulary manual?
(A formulary manual contains summary drug information.) If yes, does it cover only medicines on the Essential Medicines List?
Yes/No/Don’t Know Yes/No/Don’t Know
What year was it last published/reviewed: Year 9.3 Are any of the following aspects of the essential
medicines concept generally part of the basic curricula in most health training institutions/universities for: (Essential medicines are those that satisfy the priority health care needs of the population. See glossary for a definition of problem-based pharmacotherapy).
Essential Medicines List
Standard Treatment Guidelines
Problem-based pharmaco-
therapy
Rational prescribing
Doctors: Yes/No/DK Yes/No/DK Yes/No/DK Yes/No/DK Nurses: Yes/No/DK Yes/No/DK Yes/No/DK Yes/No/DK
Pharmacists: Yes/No/DK Yes/No/DK Yes/No/DK Yes/No/DK Pharmacy assistants: Yes/No/DK Yes/No/DK Yes/No/DK Yes/No/DK
Paramedical staff: Yes/No/DK Yes/No/DK Yes/No/DK Yes/No/DK 9.4 Are there independent publicly or non-commercially
funded obligatory continuing education programs which include use of medicines for:
Doctors: Yes/No/Don’t Know Nurses/midwives/paramedical staff: Yes/No/Don’t Know
Pharmacists: Yes/No/Don’t Know Pharmacy aides/assistants: Yes/No/Don’t Know
9.5 Is there a public or independently funded nationally accessible (e.g. by phone) medicines information centre or service co-ordinated by the Ministry of Health, academia, and/or a non-commercial non-governmental organisation that provides information on demand to:
Prescribers: Yes/No/Don’t Know Dispensers: Yes/No/Don’t Know Consumers: Yes/No/Don’t Know
9.6 Has there been any public education campaign concerning rational medicines use in the previous two years conducted by Ministry of Health/non-governmental organisation/academia on the following topics:
Use of antibiotics: Yes/No/Don’t Know Use of injections: Yes/No/Don’t Know
Other topics/issues: Yes/No/Don’t Know 9.7 How often do the following personnel prescribe at the
primary health care level in the public sector?
Doctors: Always/Frequently/Occasionally/Never/DK
Nurses/midwives/paramedical staff: Always/Frequently/Occasionally/Never/DK Pharmacists: Always/Frequently/Occasionally/Never/DK
Pharmacy aides/assistants: Always/Frequently/Occasionally/Never/DK Personnel with less than one month formal health training: Always/Frequently/Occasionally/Never/DK
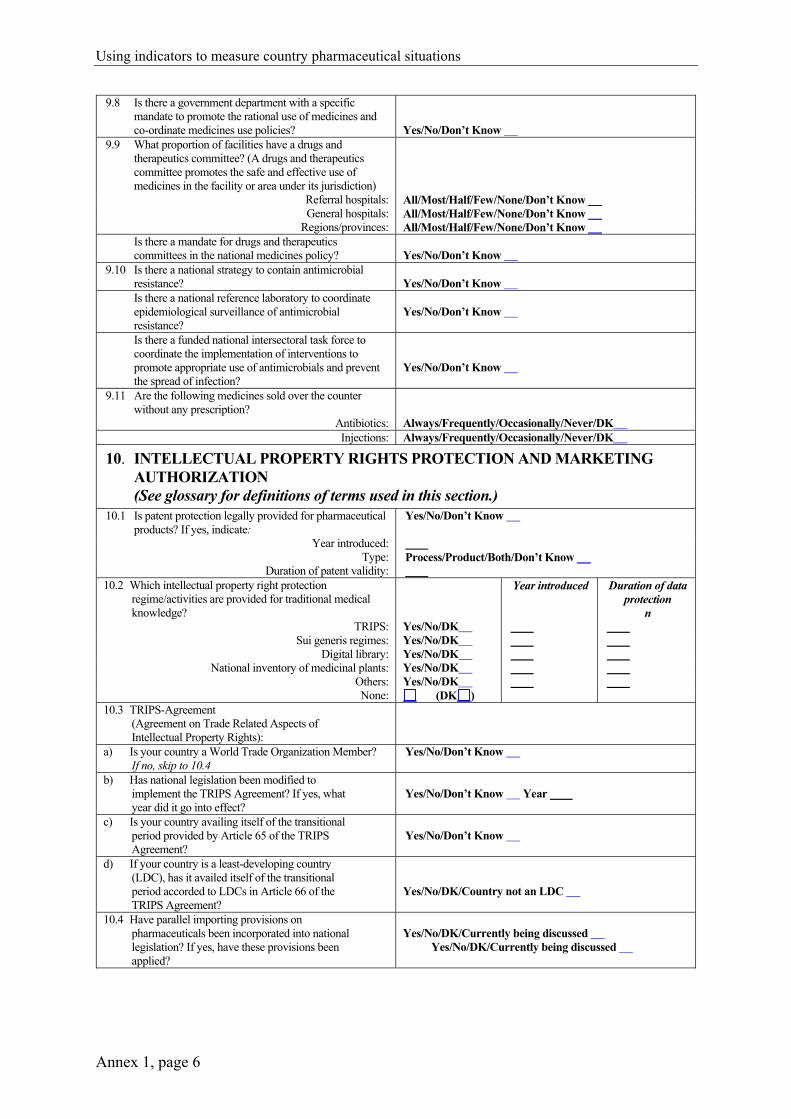
Using indicators to measure country pharmaceutical situations
Annex 1, page 6
9.8 Is there a government department with a specific mandate to promote the rational use of medicines and co-ordinate medicines use policies?
Yes/No/Don’t Know
9.9 What proportion of facilities have a drugs and therapeutics committee? (A drugs and therapeutics committee promotes the safe and effective use of medicines in the facility or area under its jurisdiction)
Referral hospitals: All/Most/Half/Few/None/Don’t Know General hospitals: All/Most/Half/Few/None/Don’t Know
Regions/provinces: All/Most/Half/Few/None/Don’t Know Is there a mandate for drugs and therapeutics
committees in the national medicines policy? Yes/No/Don’t Know
9.10 Is there a national strategy to contain antimicrobial resistance?
Yes/No/Don’t Know
Is there a national reference laboratory to coordinate epidemiological surveillance of antimicrobial resistance?
Yes/No/Don’t Know
Is there a funded national intersectoral task force to coordinate the implementation of interventions to promote appropriate use of antimicrobials and prevent the spread of infection?
Yes/No/Don’t Know
9.11 Are the following medicines sold over the counter without any prescription?
Antibiotics: Always/Frequently/Occasionally/Never/DK Injections: Always/Frequently/Occasionally/Never/DK
10. INTELLECTUAL PROPERTY RIGHTS PROTECTION AND MARKETING AUTHORIZATION (See glossary for definitions of terms used in this section.)
10.1 Is patent protection legally provided for pharmaceutical products? If yes, indicate:
Yes/No/Don’t Know
Year introduced: Type: Process/Product/Both/Don’t Know
Duration of patent validity: 10.2 Which intellectual property right protection
regime/activities are provided for traditional medical knowledge?
TRIPS:
Yes/No/DK
Year introduced
Duration of data protection
n
Sui generis regimes: Yes/No/DK Digital library: Yes/No/DK
National inventory of medicinal plants: Yes/No/DK Others: Yes/No/DK None: (DK )
10.3 TRIPS-Agreement (Agreement on Trade Related Aspects of Intellectual Property Rights):
a) Is your country a World Trade Organization Member? If no, skip to 10.4
Yes/No/Don’t Know
b) Has national legislation been modified to implement the TRIPS Agreement? If yes, what year did it go into effect?
Yes/No/Don’t Know Year
c) Is your country availing itself of the transitional period provided by Article 65 of the TRIPS Agreement?
Yes/No/Don’t Know
d) If your country is a least-developing country (LDC), has it availed itself of the transitional period accorded to LDCs in Article 66 of the TRIPS Agreement?
Yes/No/DK/Country not an LDC
10.4 Have parallel importing provisions on pharmaceuticals been incorporated into national legislation? If yes, have these provisions been applied?
Yes/No/DK/Currently being discussed
Yes/No/DK/Currently being discussed
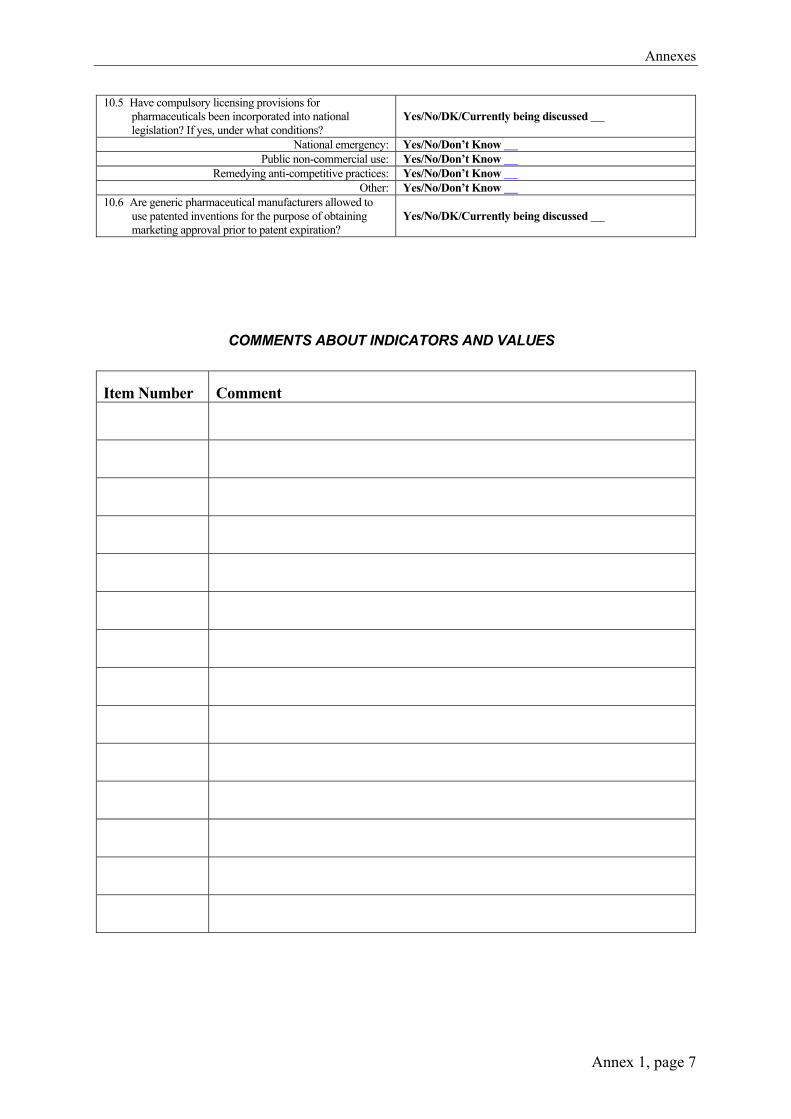
Annexes
Annex 1, page 7
10.5 Have compulsory licensing provisions for pharmaceuticals been incorporated into national legislation? If yes, under what conditions?
Yes/No/DK/Currently being discussed
National emergency: Yes/No/Don’t Know Public non-commercial use: Yes/No/Don’t Know
Remedying anti-competitive practices: Yes/No/Don’t Know Other: Yes/No/Don’t Know
10.6 Are generic pharmaceutical manufacturers allowed to use patented inventions for the purpose of obtaining marketing approval prior to patent expiration?
Yes/No/DK/Currently being discussed
COMMENTS ABOUT INDICATORS AND VALUES
Item Number Comment
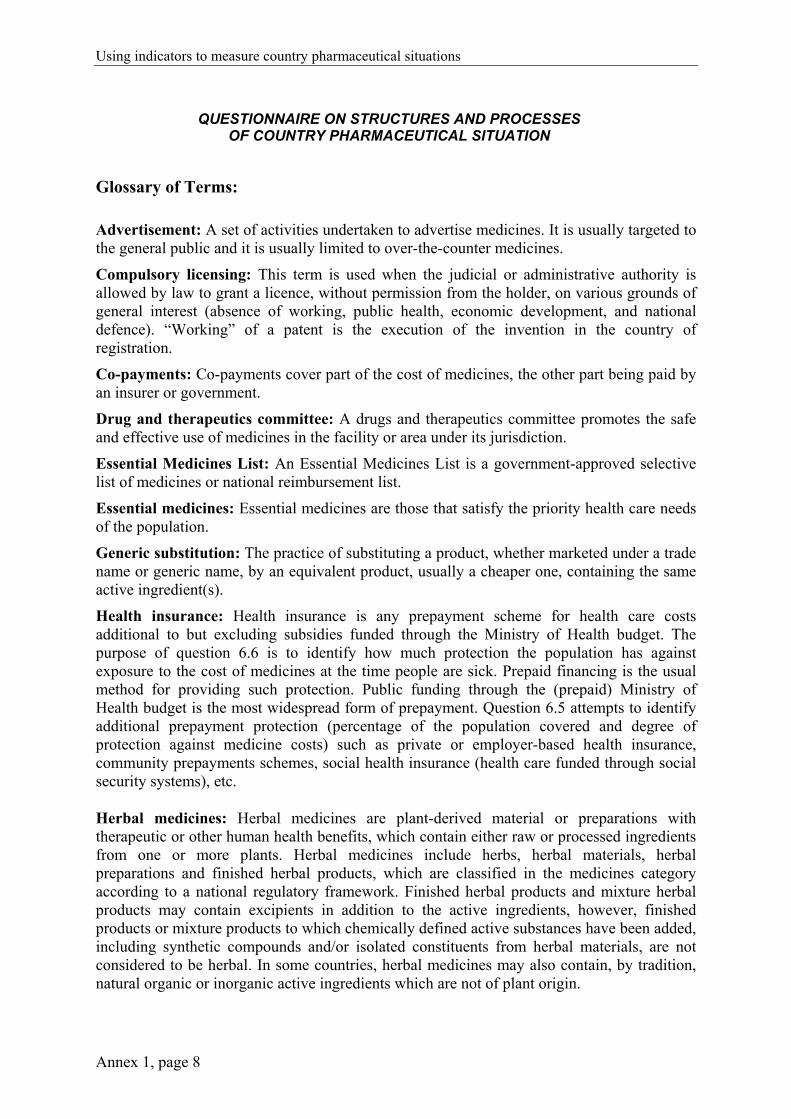
Using indicators to measure country pharmaceutical situations
Annex 1, page 8
QUESTIONNAIRE ON STRUCTURES AND PROCESSES
OF COUNTRY PHARMACEUTICAL SITUATION
Glossary of Terms:
Advertisement: A set of activities undertaken to advertise medicines. It is usually targeted to the general public and it is usually limited to over-the-counter medicines.
Compulsory licensing: This term is used when the judicial or administrative authority is allowed by law to grant a licence, without permission from the holder, on various grounds of general interest (absence of working, public health, economic development, and national defence). “Working” of a patent is the execution of the invention in the country of registration.
Co-payments: Co-payments cover part of the cost of medicines, the other part being paid by an insurer or government.
Drug and therapeutics committee: A drugs and therapeutics committee promotes the safe and effective use of medicines in the facility or area under its jurisdiction.
Essential Medicines List: An Essential Medicines List is a government-approved selective list of medicines or national reimbursement list.
Essential medicines: Essential medicines are those that satisfy the priority health care needs of the population.
Generic substitution: The practice of substituting a product, whether marketed under a trade name or generic name, by an equivalent product, usually a cheaper one, containing the same active ingredient(s).
Health insurance: Health insurance is any prepayment scheme for health care costs additional to but excluding subsidies funded through the Ministry of Health budget. The purpose of question 6.6 is to identify how much protection the population has against exposure to the cost of medicines at the time people are sick. Prepaid financing is the usual method for providing such protection. Public funding through the (prepaid) Ministry of Health budget is the most widespread form of prepayment. Question 6.5 attempts to identify additional prepayment protection (percentage of the population covered and degree of protection against medicine costs) such as private or employer-based health insurance, community prepayments schemes, social health insurance (health care funded through social security systems), etc.
Herbal medicines: Herbal medicines are plant-derived material or preparations with therapeutic or other human health benefits, which contain either raw or processed ingredients from one or more plants. Herbal medicines include herbs, herbal materials, herbal preparations and finished herbal products, which are classified in the medicines category according to a national regulatory framework. Finished herbal products and mixture herbal products may contain excipients in addition to the active ingredients, however, finished products or mixture products to which chemically defined active substances have been added, including synthetic compounds and/or isolated constituents from herbal materials, are not considered to be herbal. In some countries, herbal medicines may also contain, by tradition, natural organic or inorganic active ingredients which are not of plant origin.

Annexes
Annex 1, page 9
Licensing: Licensing is a system that subjects all premises to evaluation against a set of requirements before a specific activity (e.g. manufacturing, storage etc.) is authorised to take place.
Medicines formulary manual: A formulary manual contains summary drug information.
National medicines (drug) policy (NMP): A national medicines policies is an expression of the government’s goals and priorities for the medium to long term for the pharmaceutical sector. It also identifies the main strategies for attaining them. It provides a framework within which the activities of the pharmaceutical sector can be coordinated. It covers both the public and private sectors, and involves all the main actors in the pharmaceutical field.
Parallel importing: Parallel importation is importation, without the consent of the patent-holder, of a patented product marketed in another country either by the patent-holder or with the patent-holder’s consent. Parallel importation enables promotion of competition for the patented product by allowing importation of equivalent patented products marketed at lower prices in other countries.
Problem-based pharmacotherapy: Problem-based pharmacotherapy is a problem-based practical approach to teaching prescribing.
Promotion: A set of activities undertaken to promote prescription of prescription-only medicines. It is usually targeted to health providers only and it is usually forbidden to target the general public.
Registered products: Products that have been evaluated for quality, safety and efficacy and thence authorised for marketing.
Registration system: A system that subjects all products to evaluation of quality, safety and efficacy before they are authorised for marketing.
Standard Treatment Guidelines (STG): STGs are recommendations about how to treat a clinical condition.
Tender: Tender is the process by which competing bids are entered for a particular contract.
Traditional medical knowledge: Knowledge related to traditional medicine (see definition of Traditional medicine and complementary/alternative medicine).
Traditional medicine and complementary/alternative medicine (TM/CAM): Traditional medicine is the sum total of the knowledge, skills, and practices based on theories, beliefs and experiences indigenous to different cultures, whether explicable or not, used in the maintenance of health as well as in prevention, diagnosis, improvement or treatment of physical and mental illnesses. The terms “complementary medicine” and “alternative medicine” can be used interchangeably with “traditional medicine” in some countries. The term “complementary and alternative medicine” can also be used to refer to a broad set of health care practices that are not part of the country’s own tradition and are not integrated into the dominant health care system.
Using indicators to measure country pharmaceutical situations
Annex 1, page 10
Transitional period: TRIPS provides transitional periods during which countries are required to bring their national legislation and practices into conformity with its provisions. The latest dates for WTO Members were/are: 1996 for developed countries; 2000 for developing countries (as a general rule); 2005 for developing countries who had not introduced patents before joining the WTO; and 2006 for least-developed countries (extended to 2016 by the Doha Declaration). The TRIPS Agreement specifically recognizes the economic, financial, administrative and technological constraints of the least-developed countries. It therefore provides the possibility for further extension of the transitional period.
TRIPS Agreement (Agreement on Trade-Related Aspects of Intellectual Property Rights) Article 65: Transitional Arrangements 1. Subject to the provisions of paragraphs 2, 3 and 4, no Member shall be obliged to apply
the provisions of this Agreement before the expiry of a general period of one year following the date of entry into force of the WTO Agreement.
2. A developing country Member is entitled to delay for a further period of four years the date of application, as defined in paragraph 1, of the provisions of this Agreement other than Articles 3, 4 and 5.
3. Any other Member which is in the process of transformation from a centrally-planned into a market, free-enterprise economy and which is undertaking structural reform of its intellectual property system and facing special problems in the preparation and implementation of intellectual property laws and regulations, may also benefit from a period of delay as foreseen in paragraph 2.
4. To the extent that a developing country Member is obliged by this Agreement to extend product patent protection to areas of technology not so protectable in its territory on the general date of application of this Agreement for that Member, as defined in paragraph 2, it may delay the application of the provisions on product patents of Section 5 of Part II to such areas of technology for an additional period of five years.
5. A Member availing itself of a transitional period under paragraphs 1, 2, 3 or 4 shall ensure that any changes in its laws, regulations and practice made during that period do not result in a lesser degree of consistency with the provisions of this Agreement.
Article 66: Least-Developed Country Members 1. In view of the special needs and requirements of least-developed country Members, their
economic, financial and administrative constraints, and their need for flexibility to create a viable technological base, such Members shall not be required to apply the provisions of this Agreement, other than Articles 3, 4 and 5, for a period of 10 years from the date of application as defined under paragraph 1 of Article 65. The Council for TRIPS shall, upon duly motivated request by a least-developed country Member, accord extensions of this period.
2. Developed country Members shall provide incentives to enterprises and institutions in their territories for the purpose of promoting and encouraging technology transfer to least-developed country Members in order to enable them to create a sound and viable technological base.
[WIPO note] January 1, 1995

Annexes
Annex 2, page 1
Annex 2 Level II indicator survey and summary forms
Survey Forms 1–15
Number of copies needed for: Survey Forms
Training* Field Test* Survey**
Total numberof copies needed
Public health facility pharmacies/dispensaries SF 1 Availability of key medicines (% medicines expired) SF 2 Price of key medicines SF 3 Average stockout duration Adequate record keeping SF 4 Adequate conservation conditions and handling of medicines SF 5 Affordability of treatment for adults and children under 5 years of age SF 6 Average number of medicines per prescription % medicines dispensed or administered % medicines adequately labelled % patients know how to take medicines Average cost of medicines and related fees
10
10
10
10
10
10
10
10
10
10
10
10
30
30
30
30
30
30
50
50
50
50
50
50
Public health facilities SF 7 Average number of medicines per prescription % patients prescribed antibiotics/injections % prescribed medicines on Essential Medicines List % medicines prescribed by generic name (INN) SF 8 Availability of Standard Treatment Guidelines Availability of Essential Medicines List SF 9 % tracer cases treated according to recommended treatment
protocol/guide
10
10
10
10
10
10
30
30
30
50
50
50
Private pharmacies/drug outlets SF 10 Affordability of treatment for adults and children
under 5 years of age SF 11 Availability of key medicines (% medicines expired) SF 12 Price of key medicines
10
10
10
10
10
10
30
30
30
50
50
50 Central/regional/district warehouses supplying the public sector SF 13 Availability of key medicines (% medicines expired) SF 14 Average stockout duration Adequate record keeping SF 15 Adequate conservation conditions and handling of medicines
10
10
10
10
10
10
5 5 5
25
25
25
* Note each data collector should be provided with one copy of each survey form for use during training and another copy of each form for use during the field test
** Copies of survey forms for the actual survey should not be completed until after the country-specific items have been introduced
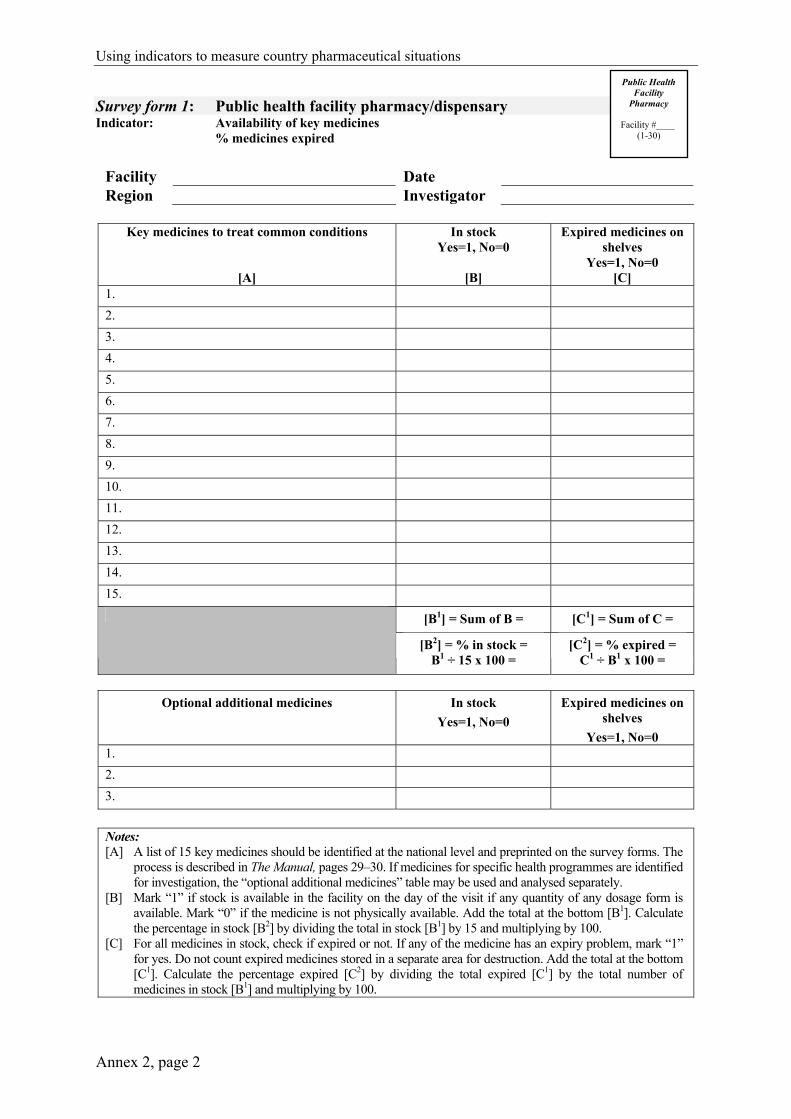
Using indicators to measure country pharmaceutical situations
Annex 2, page 2
Survey form 1: Public health facility pharmacy/dispensary Indicator: Availability of key medicines
% medicines expired
Facility Date Region Investigator
Key medicines to treat common conditions
[A]
In stock Yes=1, No=0
[B]
Expired medicines on shelves
Yes=1, No=0 [C]
1. 2. 3. 4. 5. 6. 7. 8. 9. 10. 11. 12. 13. 14. 15.
[B1] = Sum of B = [C1] = Sum of C =
[B2] = % in stock = B1 ÷ 15 x 100 =
[C2] = % expired = C1 ÷ B1 x 100 =
Optional additional medicines In stock
Yes=1, No=0 Expired medicines on
shelves Yes=1, No=0
1. 2. 3.
Notes: [A] A list of 15 key medicines should be identified at the national level and preprinted on the survey forms. The
process is described in The Manual, pages 29–30. If medicines for specific health programmes are identified for investigation, the “optional additional medicines” table may be used and analysed separately.
[B] Mark “1” if stock is available in the facility on the day of the visit if any quantity of any dosage form is available. Mark “0” if the medicine is not physically available. Add the total at the bottom [B1]. Calculate the percentage in stock [B2] by dividing the total in stock [B1] by 15 and multiplying by 100.
[C] For all medicines in stock, check if expired or not. If any of the medicine has an expiry problem, mark “1” for yes. Do not count expired medicines stored in a separate area for destruction. Add the total at the bottom [C1]. Calculate the percentage expired [C2] by dividing the total expired [C1] by the total number of medicines in stock [B1] and multiplying by 100.
Public Health Facility
Pharmacy Facility #____
(1-30)

Annexes
Annex 2, page 3
Survey form 2: Public health facility pharmacy/dispensary Indicator: Price of key medicines
UNDER DEVELOPMENT
Facility Date Region Investigator
Key medicines to treat common
conditions
[A]
Preparation and unit (strength and dosage form, e.g. for amoxicillin: 25 mg/ml suspension
in100 ml bottle) [B]
Lowest price paid by facility
[C]
Lowest price paid by patient
[D]
1. 2. 3. 4. 5. 6. 7. 8. 9. 10. 11. 12. 13. 14. 15.
Optional additional medicines
Preparation and unit
Lowest price
paid by facility
Lowest price paid by patient
1. 2. 3.
Notes: [A] The list of 15 key medicines and optional additional medicines identified for Survey Form 1 should also be
preprinted on this form. [B] At the national level, identify a commonly dispensed preparation and unit for each key medicine and
preprint these on the survey form, include syringe, needle and water for injection and other essential components of administering the medicine if applicable. If a flat rate is charged for a treatment course, then identify treatment course rather than unit.
[C] For each available medicine, determine the lowest price in the local currency paid by the facility for the identified preparation and unit. The lowest priced branded or generic equivalent medicine should be used. If facilities generally receive the medicine for free from the Ministry of Health, record the price paid when the medicine is purchased elsewhere if facilities are permitted to occasionally procure medicines from other sources. If data is not available, mark N/A.
[D] For each available medicine, determine the lowest price in the local currency paid out-of-pocket by a patient for the identified preparation and unit. The lowest priced branded or generic equivalent medicine should be used. If patients pay flat charges for each medicine, this amount should be recorded as the price of the medicine. Indicate a “0” if medicines are given free.
Public Health Facility
Pharmacy Facility #____
(1-30)

Using indicators to measure country pharmaceutical situations
Annex 2, page 4
9a.
Survey form 3: Public health facility pharmacy/dispensary Indicator: Average stockout duration Adequate record keeping
Facility Date Region Investigator
Only collect data for medicines with records covering at least 6 months within the past 12 months
Key medicines to treat common conditions
[A]
Records cover at least 6 months within the past 12 months
Yes=1, No=0
[B]
Number of days out of stock
[C]
Number of days covered by the
review (at least 6 months)
[D]
Equivalent number of days per year [E] = C x 365 ÷ D
[E]
1. 2. 3. 4. 5. 6. 7. 8. 9. 10. 11. 12. 13. 14. 15.
[B1] = Sum of B = [E1] = Sum of E =
[B2] = % adequate records = B1 ÷ 15 x 100 =
[F] = Average number of stockout days = E1 ÷ B1 =
Only collect data for medicines with records covering at least 6 months in the past 12 months
Optional additional medicines
Records cover at least 6 months within
the past 12 months Yes=1, No=0
Number of days out of stock
Number of days covered by the
review
Equivalent number of days per year
[E] = C x 365 ÷ D 1. 2. 3.
Notes: [A] The list of 15 key medicines and optional additional medicines identified for Survey Form 1 should also be preprinted on this form. [B] Go through the stock cards and indicate which medicines have records covering at least 6 months within the previous 12 months. Add the total
at the bottom [B1]. Calculate the percentage of medicines with adequate records [B2] by dividing the number of medicines with records covering at least 6 months [B1] by 15 and multiplying by 100.
[C] The review should cover 6-12 months. Go through the stock cards covering the review period. Indicate the number of days each medicine was not available or marked “0” on the card. A medicine is considered in stock if any quantity of it is available in generic or branded form.
[D] Indicate the number of days actually reviewed for each medicine. [E] Compute the equivalent number of stockout days per year for each medicine by multiplying the number of days out of stock [C] by 365 and
dividing by the number of days covered by the review [D]. Add the total number of stockout days [E1]. [F] Calculate the average number of stockout days by dividing the total number of stockout days [E1] by the total number of medicines reviewed [B1].
Example: Only collect data for medicines with records covering at least 6 months in the
past 12 months Key medicines to
treat common conditions
[A]
Records cover at least 6 months within
the past 12 months Yes=1, No=0
[B]
Number of days out of stock
[C]
Number of days covered by the review
[D]
Equivalent number of days per year
[E] = C x 365 ÷ D [E]
Cotrimoxazole 1 90 180 182.5 Paracetamol 1 30 365 30 amoxicillin 0
[B1] = Sum of B = 2 [B2] = % adequate records
= B1 ÷ 3 x 100 = 66.7
[E1] = Sum of E =212.5
[F] = Average number of stockout days = E1 ÷ B1 = 106.25
Public Health Facility
Pharmacy Facility #____
(1-30)
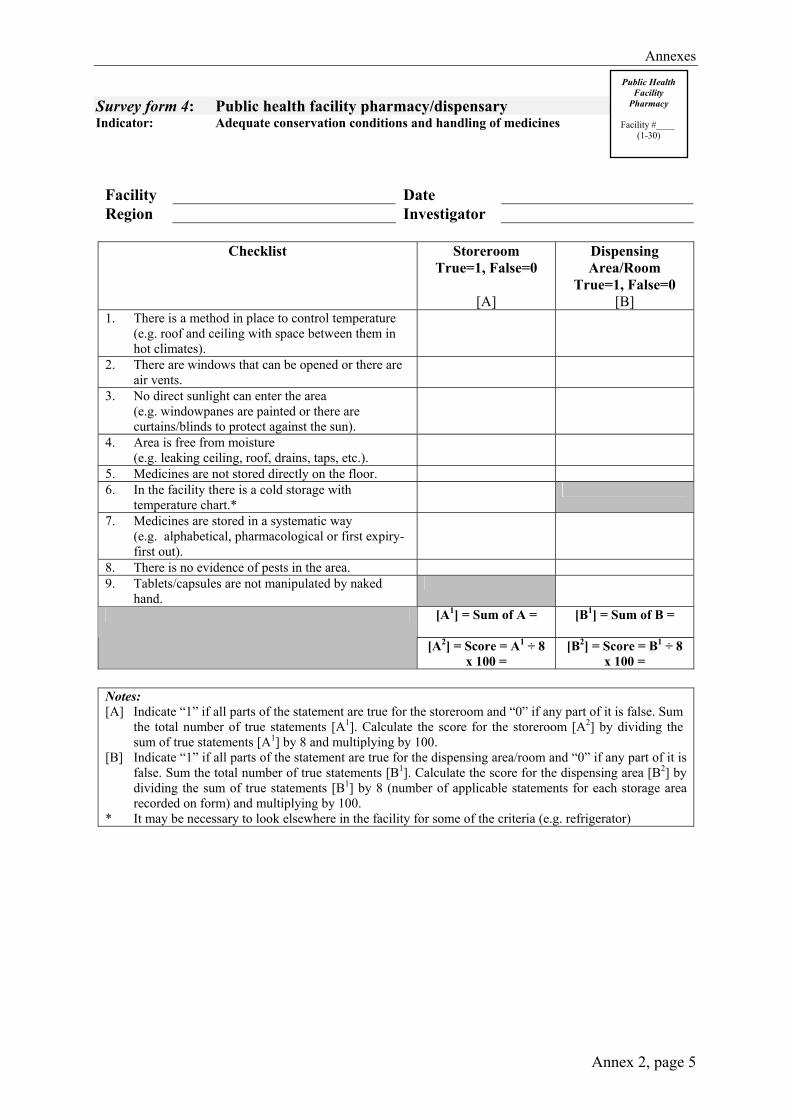
Annexes
Annex 2, page 5
Survey form 4: Public health facility pharmacy/dispensary Indicator: Adequate conservation conditions and handling of medicines
Facility Date Region Investigator
Checklist Storeroom
True=1, False=0
[A]
Dispensing Area/Room
True=1, False=0 [B]
1. There is a method in place to control temperature (e.g. roof and ceiling with space between them in hot climates).
2. There are windows that can be opened or there are air vents.
3. No direct sunlight can enter the area (e.g. windowpanes are painted or there are curtains/blinds to protect against the sun).
4. Area is free from moisture (e.g. leaking ceiling, roof, drains, taps, etc.).
5. Medicines are not stored directly on the floor. 6. In the facility there is a cold storage with
temperature chart.*
7. Medicines are stored in a systematic way (e.g. alphabetical, pharmacological or first expiry-first out).
8. There is no evidence of pests in the area. 9. Tablets/capsules are not manipulated by naked
hand.
[A1] = Sum of A = [B1] = Sum of B =
[A2] = Score = A1 ÷ 8 x 100 =
[B2] = Score = B1 ÷ 8 x 100 =
Notes: [A] Indicate “1” if all parts of the statement are true for the storeroom and “0” if any part of it is false. Sum
the total number of true statements [A1]. Calculate the score for the storeroom [A2] by dividing the sum of true statements [A1] by 8 and multiplying by 100.
[B] Indicate “1” if all parts of the statement are true for the dispensing area/room and “0” if any part of it is false. Sum the total number of true statements [B1]. Calculate the score for the dispensing area [B2] by dividing the sum of true statements [B1] by 8 (number of applicable statements for each storage area recorded on form) and multiplying by 100.
* It may be necessary to look elsewhere in the facility for some of the criteria (e.g. refrigerator)
Public Health Facility
Pharmacy Facility #____
(1-30)

Using indicators to measure country pharmaceutical situations
Annex 2, page 6
Survey form 5: Public health facility pharmacy/dispensary Indicator: Affordability of treatment for adults
and children under 5 years of age
Medicine/INN and Preparation
[A]
Number of units needed to complete treatment
[B]
Unit price (one vial, tablet, or capsule)
[C]
Total cost of treatment
[D] = B x C
[D]
Equivalent number of days wages [G] = D ÷ E
[G]
Ratio of cost of treatment and
optional measure
[H] = D ÷ F [H]
Moderate pneumonia (without hospitalization): Adult treatment of choice:
[G1] = [H1] =
Child <5 treatment of choice:
[G2] = [H2] =
Other condition: (without hospitalization): Adult treatment of choice:
[G3] = [H3] =
Child <5 treatment of choice:
[G4] = [H4] =
[E] = Lowest daily government salary (divide weekly salary by 7 or monthly salary by 30) = [F] = Optional standard of measure: __________________________ =
Notes: [A] Using standard treatment guidelines, identify at the national level and preprint on the form the treatment of choice and the
recommended preparation for moderate pneumonia and another important disease (e.g. malaria in African countries) in adults and children. Do not include symptomatic medicines, e.g. for fever or cough.
[B] The number of units of each medicine needed for the duration of treatment (based on standard treatment guidelines) should be identified at the national level and preprinted on the survey forms.
[C] Indicate in local currency the unit price or the price the facility charges patients for each medicine. The lowest priced branded or generic equivalent medicine should be used. If there are flat charges paid for each medicine given to patients, this amount should be recorded as the price of the medicine. Indicate “0” if medicines are given free. Add cost of syringe to unit price, if applicable.
[D] Calculate total cost of treatment [D] by multiplying the number of units needed [B] by unit price [C]. Only one medicine (antibiotic) should be used to calculate cost of treatment and not a combination of medicines. If patients are charged a flat fee for treatment course, record this as total cost of treatment.
[E] At the national level identify and preprint on the form the lowest daily government salary. If the weekly salary is known, divide this by 7 to obtain the daily salary. If the monthly salary is known, divide this by 30 to obtain the daily salary.
[F] At the national level, a second standard, such as poverty line, food basket, or other relevant figure may be identified and preprinted on the form.
[G] Calculate the number of days wages needed to pay for treatment by dividing the cost of treatment [D] by the lowest daily government salary [E].
[H] Calculate the ratio of cost of treatment and the optional standard of measure by dividing the cost of treatment [D] by the optional standard.
Example: Medicine/INN and Preparation
[A]
Number of units needed to complete treatment
[B]
Unit price (one vial, tablet, or capsule)
[C]
Total cost of
treatment [D] = B x C
[D]
Equivalent number of days wages [G] = D ÷ E
[G]
Ratio of cost of treatment and
optional measure
[H] = D ÷ F [H]
Moderate pneumonia (without hospitalization): Adult treatment of choice: Procaine penicillin: 1g 1 mill IU 3 injections 280 (injection
plus syringe) 840 11.2 17
Child <5 treatment of choice: Amoxicillin: 25 mg/ml suspension in 100 ml bottle 1 bottle 220 per bottle 220 2.93 4.5
[E] = Lowest daily government salary (divide weekly salary by 7 or monthly salary by 30) = 75 [F] = Optional standard of measure: Poverty line (annual income of 18000) ÷ 365 = 18000 ÷ 365 = 49.3
Facility Date Region Investigator
Public Health Facility
Pharmacy Facility #____
(1-30)

Annexes
Annex 2, page 7
Survey form 6: Public health facility pharmacy/dispensary:Patient care form
Indicators: Average number of medicines per prescription % patients know how to take medicines % medicines dispensed or administered Average cost of medicines and related fees % medicines adequately labelled
Facility Date Region Investigator
Patient sex M/F
[A]
Number of medicines prescribed
[B]
Number of medicines
dispensed or administered
[C]
Number of medicines adequately
labelled [D]
Patient knows how to take medicines
Yes=1, No=0 [E]
Amount patient paid
for purchased medicines
[F]
Amount patient paid in
other fees
[G] 1. 2. 3. 4. 5. 6. 7. 8. 9. 10. 11. 12. 13. 14. 15. 16. 17. 18. 19. 20. 21. 22. 23. 24.
[A1] = Sum cases =
[B1] = Sum of B =
[C1] = Sum of C =
[D1] = Sum of D =
[E1] = Sum of E =
[F1] = Sum of F =
[G1] = Sum of G =
[A2] = Sum females =
[A3] = % females = A2
÷ A1 x 100 =
[B2] = Average
number of medicines =
B1 ÷ A1 =
[C2] = % dispensed =
C1 ÷ B1 x 100 =
[D2] = % adequately
labelled = D1 ÷ C1 x 100 =
[E2] = % know how to
take medicines =
E1 ÷ A1 x 100 =
[H] = Average cost = (F1 + G1) ÷ A1 =
Notes: [A] Interview 30 patients leaving the dispensing area/pharmacy. Record the number of cases [A1] and the number of females [A2].
Calculate the percentage of females by dividing the total number of females [A2] by the total number of cases [A1] and multiplying by 100.
[B] Record the number of medicines (chemical entity, INN, generic) prescribed for each patient. Combination medicines in one dosage form count as one medicine. Sum the number of medicines prescribed for all patients [B1]. Calculate average number of medicines prescribed [B2] by dividing number of medicines prescribed [B1] by number of cases [A1].
[C] Record the number of medicines dispensed or administered to each patient. Sum the total number [C1]. Calculate the percentage of medicines dispensed [C2] by dividing the number of medicines given to all patients [C1] by the total number of medicines prescribed [B1] and multiplying by 100.
[D] Record the number of medicines labelled with at least the name of the medicine and how to take it. Count only medicines meeting at least both criteria. Total the number [D1]. Calculate the percentage of medicines adequately labelled [D2] by dividing the total number of adequately labelled medicines [D1] by the total number of medicines dispensed [C1] and multiplying by 100.
[E] Determine if patient knows how to take all medicines dispensed. Mark “1” only if patient can correctly state how ALL medicines should be taken and “0” otherwise. Sum the total [E1]. Calculate the percentage of patients who know how to take all medicines [E2] by dividing the total number who know how to take all medicines [E1] by the total number interviewed [A1] and multiplying by 100.
[F] Record the amount each patient paid out-of-pocket for the medicines received at the facility. Check with a receipt if possible. Sum the total amount [F1].
[G] Record the amount of other non-diagnostic fees paid by the patient, such as visit or injection fees but not lab or x-ray fees. Sum the total amount [G1].
[H] Calculate the average amount cost by adding the amounts paid for medicines [F1] and fees [G1] and dividing by the total number interviewed [A1].
Public Health Facility
Pharmacy Facility #____
(1-30)

Using indicators to measure country pharmaceutical situations
Annex 2, page 8
9b.
Survey form 7: Public health facility: Rational medicine use Prescribing indicator form
Indicators: Average number of medicines per prescription % prescribed medicines on EML % patients prescribed antibiotics/injections % medicines prescribed by generic name
Facility Date Region Investigator
Type R/P
[A]
Patient sex M/F
[B]
Number of medicines prescribed
[C]
Antibiotic prescribed
Yes=1, No=0
[D]
Injection prescribed
Yes=1, No=0
[E]
Number of prescribed
medicines on Essential
Medicines List (EML)
[F]
Number of medicines
prescribed by generic name
(INN)
[G] 1. 2. 3. 4. 5. 6. 7. 8. 9. 10. 11. 12. 13. 14. 15. 16. 17. 18. 19. 20. 21. 22. 23. 24. 25.
[B1] = Sum cases =
[C1] = Sum of C =
[D1] = Sum of D =
[E1] = Sum of E =
[F1] = Sum of F =
[G1] = Sum of G =
[B2] = Sum females =
[B3] = % females = B2
÷ B1 x 100 =
[C2] = Average number of
medicines = C1 ÷ B1 =
[D2] = % receiving
antibiotics = D1 ÷ B1 x 100 =
[E2] = % receiving
injections = E1
÷ B1 x 100 =
[F2] = % EML = F1 ÷ C1 x 100
=
[G2] = % INN = G1 ÷ C1 x
100 =
Notes: [A] From outpatient treatment records, select 30 patients seen within the last 12 months (R = retrospective sampling). If records are not available,
select 30 patients currently being treated (P = prospective sampling). Sample can combine R and P. The process is described on page 27–28 of The Manual. Mark “R” if patient was selected retrospectively and “P” if patient was selected prospectively.
[B] Record the number of cases [B1] and the number of females [B2]. Calculate the percentage of females by dividing the total number of females [B2] by the total number of cases [B1] and multiplying by 100.
[C] Record number of medicines (chemical entity, INN, generic) prescribed. Combination medicines in one dosage form count as one medicine. Total the number of medicines prescribed [C1]. Calculate average number of medicines prescribed [C2] by dividing number of medicines prescribed [C1] by number of cases [B1].
[D] Record “1” if patient was prescribed any antibiotics and “0” otherwise. Total the cases receiving antibiotics [D1]. Calculate percentage of cases with antibiotics [D2] by dividing number of cases with antibiotics [D1] by number of cases [B1] and multiplying by 100.
[E] Record “1” if patient was prescribed any injections and “0” otherwise. Total the cases receiving injections [E1]. Calculate percentage of cases receiving injections [E2] by dividing number of cases with injections [E1] by number of cases [B1] and multiplying by 100.
[F] Record number of prescribed medicines on the national Essential Medicines List (EML). Total the number of prescribed medicines on the EML [F1]. Calculate the percentage of prescribed medicines on the EML [F2] by dividing the number of medicines on the EML [F1] by the number of medicines prescribed [C1] and multiplying by 100.
[G] Record number of medicines prescribed by INN. Total the number of medicines prescribed by INN [G1]. Calculate percentage of medicines prescribed by INN [G2] by dividing number of medicines prescribed by INN [G1] by number of medicines prescribed [C1] and multiplying by 100.
Public Health Facility
Pharmacy Facility #____
(1-30)

Annexes
Annex 2, page 9
Survey form 8: Public health facility: Essential medicine information Indicators: Availability of Standard Treatment Guidelines (STG) Availability of Essential Medicines List (EML) Facility Date Region Investigator
Standard Treatment Guidelines (STG) available Yes=1, No=0 [A]
STG for pneumonia (as part of combined STG publication or disease specific STG document)
STG for ___________________( as part of combined STG publication or disease specific STG document)
[A1] =Both STGs are present =
Essential Medicines List (EML) updated within last 5 years available Yes=1, No=0 [B]
National EML Provincial/District EML Facility-specific EML Other EML (describe):
[B1] =At least one current EML is present =
Notes: [A] Identify at the national level and preprint on the form the second required STG. This should be for an
important disease in the region, e.g. malaria in Africa. Check to see if there is a copy of each of the STGs either as part of combined STG publication or disease specific STG document. Record “1” if the facility is able to present a copy of the document and “0” if the facility is unable to present the document. If both STGs are present record “1” in [A1] otherwise record “0”.
[B] Record “1” next to each type of EML that is both physically present in the facility and updated within the past five years. If the facility is unable to present the document or it has been more than 5 years since it was last updated, record “0”. If any current EML is available, mark “1”in [B1], otherwise record “0”.
Public Health Facility
Pharmacy Facility #____
(1-30)

Using indicators to measure country pharmaceutical situations
Annex 2, page 10
9c.
Survey form 9: Public health facility Indicator: % of tracer cases treated according to recommended treatment protocol/guide
Facility Date Region Investigator
Use of medicines by case
Yes=1, No=0 [B]
Tracer conditions and medicines prescribed
[A] 1 2 3 4 5 6 7 8 9 10
Total number of cases
[C]
Number of cases
prescribed medicine
[D]
% of cases prescribed medicine
[E] = D ÷ C x 100 [E]
Non-bacterial diarrhoea in children under age 5 ORS Antibiotic Antidiarrhoeal and/or antispasmodic
Mild/moderate (outpatient) pneumonia in children under age 5 [A1] 1st line antibiotic(s) in national STG: _________________________ Any 1st line antibiotic Prescribed >1 antibiotic Non-pneumonia acute respiratory tract infection (ARI) in patients of any age Any antibiotic [A2] Optional tracer condition 1: [A2] Optional tracer condition 2:
Notes: [A] At the national level, identify and preprint on the form the first-line antibiotic(s) mentioned in the
national STG for pneumonia [A1]. If data on treatment of other conditions is desired, preprint on the form the optional tracer conditions [A2] and the medicines that will be used to measure recommended or non-recommended practices.
[B] From general adult or pediatric outpatient records, select 10 patient encounters with each target condition. If possible, choose only single diagnosis encounters. Write “1” or “0” for each case selected to indicate whether or not each target medicine was prescribed.
[C] Sum the total number of cases in each row. [D] Sum the total number of cases in each row that were prescribed the target medicine. [E] For each row, calculate the percentage of patients receiving each medicine [E] by dividing the total
number of cases that were prescribed each medicine [D] by the total number of cases [C] and multiplying by 100.
Public Health Facility
Facility #____
(1-30)
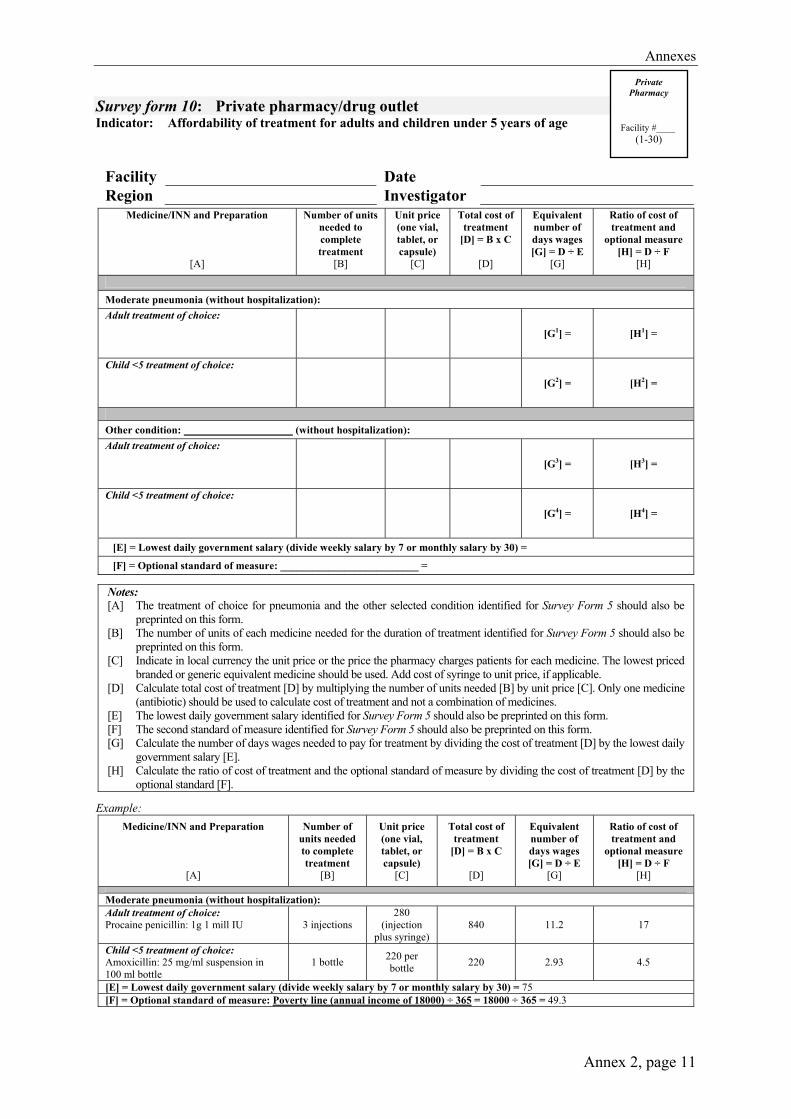
Annexes
Annex 2, page 11
Survey form 10: Private pharmacy/drug outlet Indicator: Affordability of treatment for adults and children under 5 years of age
Facility Date Region Investigator
Medicine/INN and Preparation
[A]
Number of units needed to complete treatment
[B]
Unit price (one vial, tablet, or capsule)
[C]
Total cost of treatment
[D] = B x C
[D]
Equivalent number of days wages [G] = D ÷ E
[G]
Ratio of cost of treatment and
optional measure [H] = D ÷ F
[H]
Moderate pneumonia (without hospitalization): Adult treatment of choice:
[G1] = [H1] =
Child <5 treatment of choice:
[G2] = [H2] =
Other condition: (without hospitalization): Adult treatment of choice:
[G3] = [H3] =
Child <5 treatment of choice:
[G4] = [H4] =
[E] = Lowest daily government salary (divide weekly salary by 7 or monthly salary by 30) =
[F] = Optional standard of measure: __________________________ =
Notes: [A] The treatment of choice for pneumonia and the other selected condition identified for Survey Form 5 should also be
preprinted on this form. [B] The number of units of each medicine needed for the duration of treatment identified for Survey Form 5 should also be
preprinted on this form. [C] Indicate in local currency the unit price or the price the pharmacy charges patients for each medicine. The lowest priced
branded or generic equivalent medicine should be used. Add cost of syringe to unit price, if applicable. [D] Calculate total cost of treatment [D] by multiplying the number of units needed [B] by unit price [C]. Only one medicine
(antibiotic) should be used to calculate cost of treatment and not a combination of medicines. [E] The lowest daily government salary identified for Survey Form 5 should also be preprinted on this form. [F] The second standard of measure identified for Survey Form 5 should also be preprinted on this form. [G] Calculate the number of days wages needed to pay for treatment by dividing the cost of treatment [D] by the lowest daily
government salary [E]. [H] Calculate the ratio of cost of treatment and the optional standard of measure by dividing the cost of treatment [D] by the
optional standard [F]. Example:
Medicine/INN and Preparation
[A]
Number of units needed to complete treatment
[B]
Unit price (one vial, tablet, or capsule)
[C]
Total cost of treatment
[D] = B x C
[D]
Equivalent number of days wages [G] = D ÷ E
[G]
Ratio of cost of treatment and
optional measure [H] = D ÷ F
[H]
Moderate pneumonia (without hospitalization): Adult treatment of choice: Procaine penicillin: 1g 1 mill IU 3 injections
280 (injection
plus syringe) 840 11.2 17
Child <5 treatment of choice: Amoxicillin: 25 mg/ml suspension in 100 ml bottle
1 bottle 220 per bottle 220 2.93 4.5
[E] = Lowest daily government salary (divide weekly salary by 7 or monthly salary by 30) = 75 [F] = Optional standard of measure: Poverty line (annual income of 18000) ÷ 365 = 18000 ÷ 365 = 49.3
Private Pharmacy
Facility #____
(1-30)

Using indicators to measure country pharmaceutical situations
Annex 2, page 12
Survey form 11: Private pharmacy/drug outlet Indicator: Availability of key medicines
% medicines expired
Facility Date Region Investigator
Key medicines to treat common conditions
[A]
In stock Yes=1, No=0
[B]
Expired medicines on shelves
Yes=1, No=0 [C]
1. 2. 3. 4. 5. 6. 7. 8. 9. 10. 11. 12. 13. 14. 15.
[B1] = Sum of B = [C1] = Sum of C =
[B2] = % in stock = B1 ÷ 15 x 100 =
[C2] = % expired = C1 ÷ B1 x 100 =
Optional additional medicines
In stock
Yes=1, No=0 Expired medicines on
shelves Yes=1, No=0
1.
2.
3.
Notes: [A] The list of 15 key medicines and optional additional medicines identified for Survey Form 1 should also be preprinted on
this form. [B] Mark “1” if stock is available in the pharmacy on the day of the visit if any quantity of any dosage form is available.
Mark “0” if the medicine is not physically available. Add the total at the bottom [B1]. Calculate the percentage in stock [B2] by dividing the total in stock [B1] by 15 and multiplying by 100.
[C] For all medicines in stock, check if expired or not. If any of the medicine has an expiry problem, mark “1” for yes. Do not count expired medicines stored in separate area for destruction. Add the total at the bottom [C1]. Calculate the percentage expired [C2] by dividing the total expired [C1] by the total number of medicines in stock [B1] and multiplying by 100.
Private Pharmacy
Facility #____
(1-30)
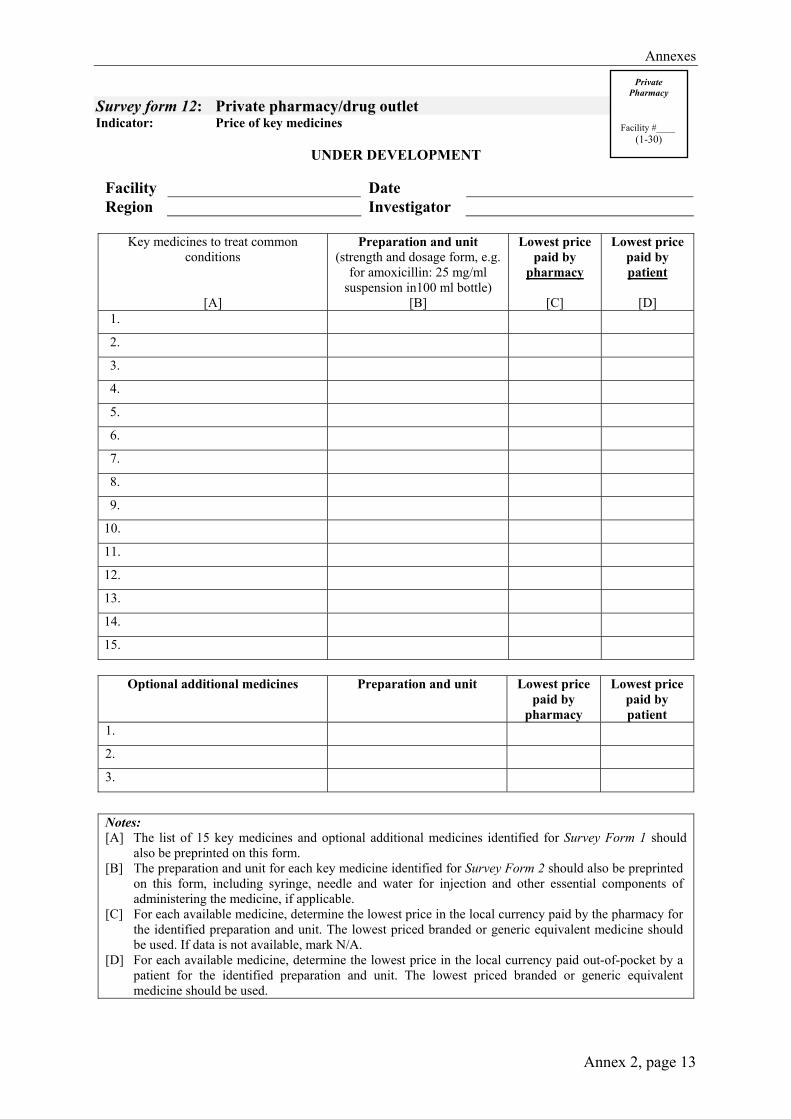
Annexes
Annex 2, page 13
Survey form 12: Private pharmacy/drug outlet Indicator: Price of key medicines
UNDER DEVELOPMENT
Facility Date Region Investigator
Key medicines to treat common
conditions
[A]
Preparation and unit (strength and dosage form, e.g.
for amoxicillin: 25 mg/ml suspension in100 ml bottle)
[B]
Lowest price paid by
pharmacy
[C]
Lowest price paid by patient
[D]
1.
2.
3.
4.
5.
6.
7.
8.
9.
10.
11.
12.
13.
14.
15.
Optional additional medicines
Preparation and unit
Lowest price
paid by pharmacy
Lowest price paid by patient
1.
2.
3.
Notes: [A] The list of 15 key medicines and optional additional medicines identified for Survey Form 1 should
also be preprinted on this form. [B] The preparation and unit for each key medicine identified for Survey Form 2 should also be preprinted
on this form, including syringe, needle and water for injection and other essential components of administering the medicine, if applicable.
[C] For each available medicine, determine the lowest price in the local currency paid by the pharmacy for the identified preparation and unit. The lowest priced branded or generic equivalent medicine should be used. If data is not available, mark N/A.
[D] For each available medicine, determine the lowest price in the local currency paid out-of-pocket by a patient for the identified preparation and unit. The lowest priced branded or generic equivalent medicine should be used.
Private Pharmacy
Facility #____
(1-30)
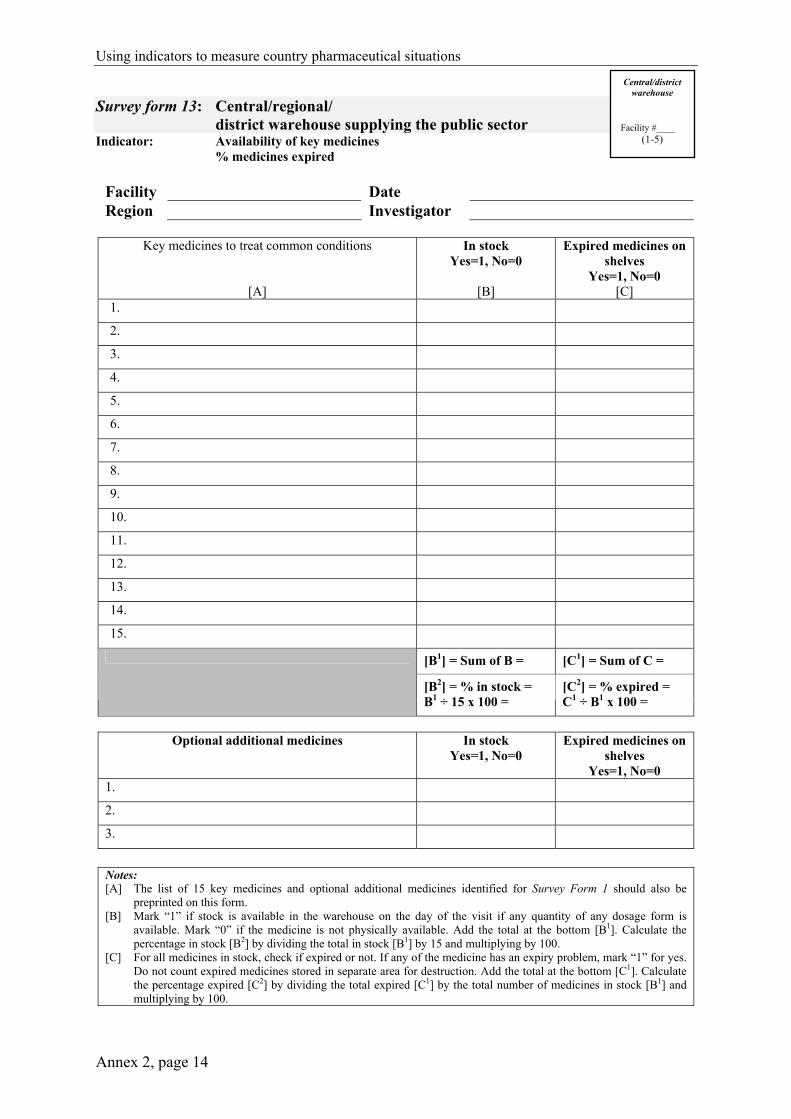
Using indicators to measure country pharmaceutical situations
Annex 2, page 14
Survey form 13: Central/regional/ district warehouse supplying the public sector
Indicator: Availability of key medicines % medicines expired
Facility Date Region Investigator
Key medicines to treat common conditions
[A]
In stock Yes=1, No=0
[B]
Expired medicines on shelves
Yes=1, No=0 [C]
1.
2.
3.
4.
5.
6.
7.
8.
9.
10.
11.
12.
13.
14.
15.
[B1] = Sum of B = [C1] = Sum of C =
[B2] = % in stock = B1 ÷ 15 x 100 =
[C2] = % expired = C1 ÷ B1 x 100 =
Optional additional medicines
In stock
Yes=1, No=0 Expired medicines on
shelves Yes=1, No=0
1.
2.
3.
Notes: [A] The list of 15 key medicines and optional additional medicines identified for Survey Form 1 should also be
preprinted on this form. [B] Mark “1” if stock is available in the warehouse on the day of the visit if any quantity of any dosage form is
available. Mark “0” if the medicine is not physically available. Add the total at the bottom [B1]. Calculate the percentage in stock [B2] by dividing the total in stock [B1] by 15 and multiplying by 100.
[C] For all medicines in stock, check if expired or not. If any of the medicine has an expiry problem, mark “1” for yes. Do not count expired medicines stored in separate area for destruction. Add the total at the bottom [C1]. Calculate the percentage expired [C2] by dividing the total expired [C1] by the total number of medicines in stock [B1] and multiplying by 100.
Central/district warehouse
Facility #____
(1-5)
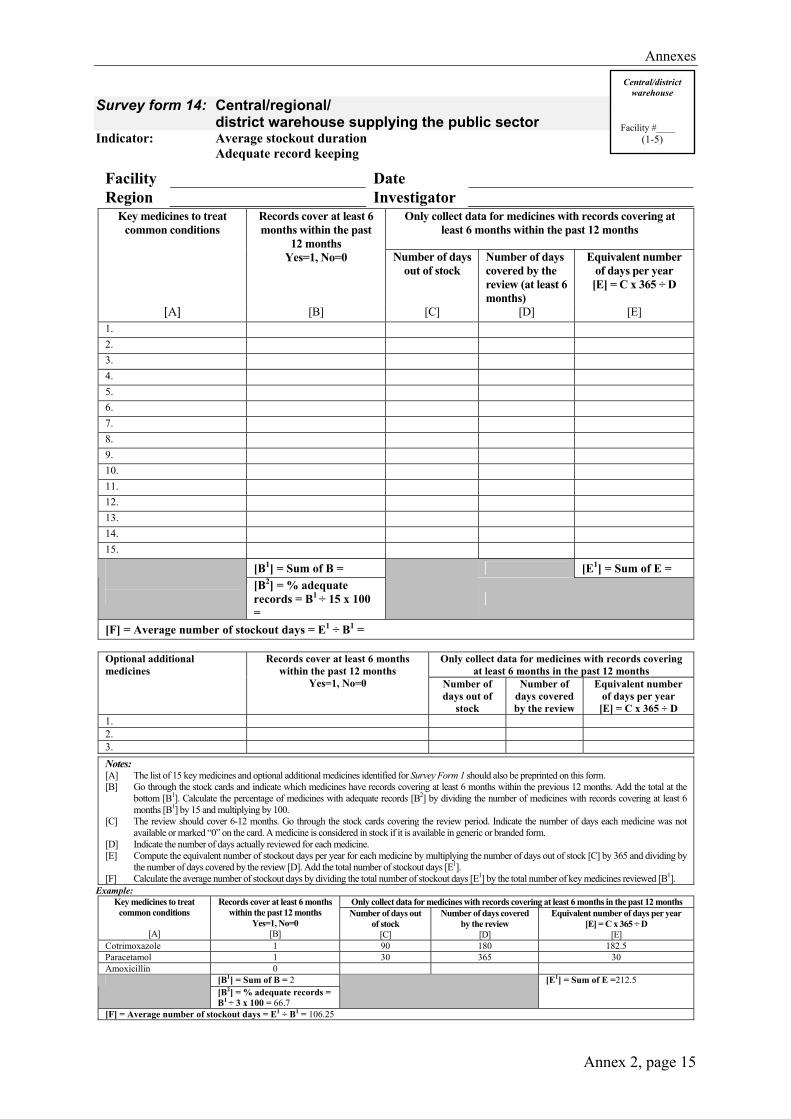
Annexes
Annex 2, page 15
Survey form 14: Central/regional/ district warehouse supplying the public sector Indicator: Average stockout duration Adequate record keeping
Facility Date Region Investigator
Only collect data for medicines with records covering at least 6 months within the past 12 months
Key medicines to treat common conditions
Records cover at least 6 months within the past
12 months Yes=1, No=0
Number of days
out of stock
Number of days covered by the review (at least 6 months)
Equivalent number of days per year
[E] = C x 365 ÷ D
[A] [B] [C] [D] [E] 1. 2. 3. 4. 5. 6. 7. 8. 9. 10. 11. 12. 13. 14. 15.
[B1] = Sum of B = [E1] = Sum of E =
[B2] = % adequate records = B1 ÷ 15 x 100 =
[F] = Average number of stockout days = E1 ÷ B1 =
Only collect data for medicines with records covering at least 6 months in the past 12 months
Optional additional medicines
Records cover at least 6 months within the past 12 months
Yes=1, No=0
Number of days out of
stock
Number of days covered by the review
Equivalent number of days per year
[E] = C x 365 ÷ D 1. 2. 3.
Notes: [A] The list of 15 key medicines and optional additional medicines identified for Survey Form 1 should also be preprinted on this form. [B] Go through the stock cards and indicate which medicines have records covering at least 6 months within the previous 12 months. Add the total at the
bottom [B1]. Calculate the percentage of medicines with adequate records [B2] by dividing the number of medicines with records covering at least 6 months [B1] by 15 and multiplying by 100.
[C] The review should cover 6-12 months. Go through the stock cards covering the review period. Indicate the number of days each medicine was not available or marked “0” on the card. A medicine is considered in stock if it is available in generic or branded form.
[D] Indicate the number of days actually reviewed for each medicine. [E] Compute the equivalent number of stockout days per year for each medicine by multiplying the number of days out of stock [C] by 365 and dividing by
the number of days covered by the review [D]. Add the total number of stockout days [E1]. [F] Calculate the average number of stockout days by dividing the total number of stockout days [E1] by the total number of key medicines reviewed [B1].
Example: Only collect data for medicines with records covering at least 6 months in the past 12 months Key medicines to treat
common conditions
[A]
Records cover at least 6 months within the past 12 months
Yes=1, No=0 [B]
Number of days out of stock
[C]
Number of days covered by the review
[D]
Equivalent number of days per year [E] = C x 365 ÷ D
[E] Cotrimoxazole 1 90 180 182.5 Paracetamol 1 30 365 30 Amoxicillin 0
[B1] = Sum of B = 2 [B2] = % adequate records = B1 ÷ 3 x 100 = 66.7
[E1] = Sum of E =212.5
[F] = Average number of stockout days = E1 ÷ B1 = 106.25
Central/district warehouse
Facility #____
(1-5)

Using indicators to measure country pharmaceutical situations
Annex 2, page 16
Survey form 15: Central/regional/ district warehouse supplying the public sector Indicator: Adequate conservation conditions and handling of medicines
Facility Date Region Investigator
Checklist Storeroom
True=1, False=0 [A]
1. There is a method in place to control temperature (e.g. roof and ceiling with space between them in hot climates).
2. There are windows that can be opened or there are air vents.
3. No direct sunlight can enter the area (e.g. window panes are painted or there are curtains/blinds to protect against the sun).
4. Area is free from moisture (e.g. no leaking ceiling, roof, drains, taps, etc.).
5. Medicines are not stored directly on the floor.
6. In the facility there is a cold storage with temperature chart.
7. Medicines are stored in a systematic way (e.g. alphabetical, pharmacological or first expiry-first out).
8. There is no evidence of pests in the area. [A1] = Sum of A = [A2] = Score = A1 ÷ 8 x 100 =
Notes: [A] Indicate “1” if all parts of the statement are true for the storeroom and “0” if any part of it is false.
Sum the total number of true statements [A1]. Calculate the score for the storeroom [A2] by dividing the sum of true statements [A1] by 8 and multiplying by 100.
Central/district warehouse
Facility #____ (1-5)

Annexes
Annex 3, page 1
ANNEX 3 Description of Level II indicators reported in this Fact Book
Selecting the basket of key medicines A list of 15 key medicines used to treat common health problems must be selected to measure availability, presence of expired medicines, medicine price and stock-out duration. These are basic requirements of key medicines in all levels of health care: They are included on the national essential medicines list. They are the most important therapeutically and based on national treatment guidelines
or at least on the consensus of experts. They are the most widely used of the medicines meeting the above criteria. They are expected to be available at all primary health care facilities at all times.
Drugs known to be problematic are not be included in the basket of drugs as this would reduce the value of this indicator. Instead, such drugs can be monitored separately as “optional additional drugs”. Likewise, other drugs that may be of interest, but do not meet all the above requirements could be included on the optional list.
Storage and handling The storage conditions and handling of medicines affect their quality. A checklist was used to rate the conservation conditions and handling of medicines. Scores were determined from the total number of “true” responses to items on the checklist.
Affordability of treatment for adults and children Affordability is expressed as the ratio of the cost of treating moderate pneumonia (standard treatment and no hospitalization) in adults and in children to the lowest daily government wage.
Adequacy of labelling of medicines at public health facility dispensaries An adequate label includes the name of the medicine, the amount to be taken and the frequency of administration. In some situations, countries may adjust these minimum requirements.
Patients’ knowledge of how to take medicines The patient should have adequate knowledge of the appropriate dosage and duration of the course of treatment with each medicine (i.e. how much, how often and for how long he or she should take each medicine). Countries may adjust these criteria.
Availability of standard treatment guidelines and essential medicines list The surveyor will ask to see a copy of the relevant STGs. A facility is only recorded as having a particular STG if the facility is able to produce the document upon request.

Using indicators to measure country pharmaceutical situations
Annex 3, page 2
Annexes
Annex 4, 5, 6, page 1
Annex 4 Level I data from 2003, by country (alphabetically by
country name and income-level indicators); organized by sections in Level I survey and this final report.*
Annex 5 Level II data by country (alphabetically by country
name and income-level indicators); organized by Access (6 indicators), Quality (2 indicators), and Rational Use of Medicines indicators (10 indicators).*
Annex 6 Level I data from 1999, by country on variables used
for comparisons between 1999 and 2003.*
* Available on CD-ROM. Requests should be addressed to
the Department of Technical Cooperation for Essential Drugs and Traditional Medicine,
World Health Organization, 1211 Geneva 27, Switzerland. Fax: + 41 22 791 4167, e-mail: [email protected]
Using indicators to measure country pharmaceutical situations
Annex 4, 5, 6, page 2

Annexes
Annex 7, page 1
Annex 7 Country income level (CIL)
Country income levels (CIL) are based on the World Bank’s country economies classifications for 2004.1 We compared the classifications listed in The World medicines situation2 from the year 2000 to the 2004 World Bank classifications. We also used 2004 World Bank classifications for countries for which no income level was given in the WMS report and for those for which CIL changed between 2000 and 2004 (Bahrain, China, Equatorial Guinea, Honduras, Indonesia, Papua New Guinea and the Republic of Korea). Two territories of New Zealand, Cook Islands and Niue, were missing CIL in 2000 and were not listed in 2004. Based on their 2004 GDP per capita listed in the World fact book3 both were categorized as middle-income countries. The Democratic Republic of the Congo was also not listed in 2004, but was categorized as low-income in 2000, and that categorization was used.
Table: Country income level by WHO Region
Africa America Eastern
Mediterranean EuropeSouth-East Asia
Western Pacific
Total (percentage)
Low- Income 37 1 3 4 6 6 57
40.7% Middle- Income 7 25 7 11 4 11 65
46.4% High-
Income 0 1 2 11 0 4 18 12.9%
Total 44 27 12 26 10 21 140 100.0%
1 Country classification. Classification of economies. The World Bank Group, 2004.
Available at: http://www.worldbank.org/data/countryclass/countryclass.html 2 The world medicines situation. Geneva, World Health Organization, 2004. 3 World fact book 2004. Central Intelligence Agency, 2003 edition.
Available at: http://www.cia.gov/cia/publications/factbook/index.html