who's crossing the border: new data on undocumented...
TRANSCRIPT

POPULATION, SPACE AND PLACE Popul. Space Place (2009) Published online in Wiley InterScience (www.interscience.wiley.com) DOI: 10.1002/psp.563
Who’s Crossing the Border: New Data on Undocumented Immigrants to the United States John R. Weeks,* Justin Stoler and Piotr Jankowski International Population Center, Department of Geography, San Diego State University, San Diego, CA 92182-4493, USA
ABSTRACT
The majority of undocumented immigrants to the United States enter through the southern border and most are from Mexico. Researchers in the US have been able to create estimates of how many unauthorised immigrants come from each country, but there has been little research on the geographical origins of immigrants from within Mexico. In this research we make use of a unique unduplicated file of people detained at or near the border by the US Border Patrol during the years 1999 to 2006. By focusing especially on the population aged 20–34, we are able to create a migration propensity index, which is the ratio of detainees from each state in Mexico to the population aged 20–34 in that state. The analysis of this index confirms the few other sources of information suggesting that migration from Mexico to the US is increasingly occurring from the more southern, indigenous states. A multiple regression analysis of the migration propensity index and state-level variables finds that the death rate from accidents and violence among men aged 20–34 is the single most important predictor of a state’s migration propensity index. This is related to a variety of factors indicating that migrants come from states with the poorest economic infrastructure. We discuss the implications of these shifts for both receiving and sending communities. Copyright ” 2009 John Wiley & Sons, Ltd.
* Correspondence to: John R. Weeks, International Population Center, Department of Geography, San Diego State University, San Diego, CA 92182-4493 USA. E-mail: [email protected]
Received 25 November 2008; revised 26 February 2009; accepted 16 March 2009
Keywords: undocumented immigrants; US–Mexico border; migration propensity
INTRODUCTION
An important and well-known consequence of the prevailing low fertility in the richest areas of the world, especially
Europe, East Asia and North America, is that the economies are quite literally demanding more workers than the native population has been supplying, thereby seeming to encourage migration from other countries to fill in the gaps. This would be a simple case of supply meeting demand were it not for the fact that human societies tend to be xenophobic, albeit in varying degrees, ranging from extremely restrictive policies in Japan to Canada’s ‘active and expansive immigration policy’ (Castles and Miller, 2003: 91). The United States takes in the greatest number of immigrants in absolute terms of any country in the world, but as is well known, many of these immigrants are entering without authorisation. This is because the demand for immigrants exceeds the legal limits, due especially to the fact that the legal migration system favours relatives of current legal residents, whether or not they are workers, whereas the economy is looking specifically for workers.
Much of what is known about the numbers and origins of undocumented immigrants in the US is derived by Passel and his colleagues at the Pew Hispanic Center (Passel, 2006). They generate their data from estimates that compare the foreign-born respondents interviewed in the annual March Supplement to the Current
Copyright © 2009 John Wiley & Sons, Ltd.
J. R. Weeks, J. Stoler and P. Jankowski
Population Survey (CPS) with the immigrants admitted legally to the US during a given reference period, such as the ten years prior to the survey. The difference between estimates of the actual number of recent immigrants based on the large data-set of the CPS surveys and the known number of legally admitted immigrants produces a residual estimate of undocumented immigrants (Passel, 2006). The US Department of Homeland Security has begun to make its own estimates, using similar methods, but using the data on the foreign-born population collected in the American Community Service (ACS), rather than the CPS (Hoefer et al., 2008).
Both sets of estimates suggest that there were about 12 million undocumented immigrants living in the US as of 2008. These are estimates of the stock, of course, not strictly the flow, although changes from year to year are indicative of the net flow, and suggest that about 500,000 unauthorised immigrants are added to the US population each year. The undocumented immigrant population represents almost one of three (30%) of the foreign-born persons in the US, and nearly two out of three (60%) of the unauthorised immigrants are from Mexico. Nearly four in five unauthorised immigrants living in the US are estimated to be more generally from Latin America and the Caribbean.
The causes of the high level of immigration from Mexico to the US are found in the ‘demographic fit’ between the two countries (Weeks and Weeks, in press). The US has an ageing population, due to its declining birth rate (until recently), but a huge economy that has needed more labour than the native population could supply. That supply has been next door in Mexico, where high birth rates (until recently) produced more young people than the Mexican economy could absorb. The result has been a sustained influx of Mexicans to work in the US. However, most of these workers have been forced to enter without documentation because of the limited number of visas legally issued to workers (Massey et al., 2002).
In response to this contradictory situation of needing workers but refusing to grant most of them legal entry, the US–Mexico border has become a contested region, since it is the line across which almost all Mexican migrants pass in order to enter the US to find work. To cope with this, the US has thousands of Border Patrol
officers patrolling the region, and over the past few years they have apprehended approximately one million persons each year trying to cross into the US without authorisation.
The majority of undocumented immigrants to the US enter through the southern border. The remainder tend to be visa-overstayers – people who entered the country legally and with inspection, but then remained past the expirationdate of their visa (Pew Hispanic Center, 2006). There is both a qualitative and quantitative difference between people entering by these different methods. Quantitatively, the visa-overstayers tend to be better educated and thus have higher occupational credentials than those who cross the border without authorisation (Marks, 2002). Qualitatively, those characteristics are apt to lead to a perception on the part of the public that visaoverstayers are less of a problem than border-crossers, who enter the country without permission and inspection. Furthermore, in the wake of 11 September 2001, the US State Department has made it more difficult for residents of manycountries, including several in South America, to obtain a visa to enter the country, forcing would-be documented immigrants to cross the border without inspection instead of entering legally and overstaying their visa.
Public demands in the US for immigrationcontrol have routinely cited borders that aredeemed to be out of control, but virtually never is there an inference that visa-overstayers are running amok. This is reflected by the fact that most people apprehended by the Department of Homeland Security are caught in the act of crossing the border, rather than being tracked down in the interior of the country. The policy emphasis is clearly on preventing people from entering the country, although there have been somevery high-profile raids on businesses that employ undocumented immigrants. Overall, people crossing the border without inspection represent the politically more sensitive subset of the undocumented population, and they represent the group that we are able to analyse using data from the Border Patrol. These data provide a small, but important, window into the geographical origins within Mexico of the migrants, from which we can attempt to draw some inferences about the demographic fit not just between Mexico and the US, but between the US and particular places in Mexico.
Copyright © 2009 John Wiley & Sons, Ltd. Popul. Space Place (2009) DOI: 10.1002/psp

Undocumented Immigrants to the US
Our objectives in this paper are first to describe the kinds of people who are apprehended at the border (focusing on the southern border), including age, sex, number of times apprehended, how many people were in the group when apprehended, country of origin and, for people from Mexico (who represent the vast majority of unauthorised apprehended migrants), the state in Mexico from which they came. We then describe the changes in these characteristics over the eight-year period from 1999 to 2006 for which we have data. Finally, we compare the results from this data-set with other estimates of the characteristics and origins of undocumented immigrants to the US, and discuss the implications of our findings.
WHAT DIFFERENCE DOES IT MAKE WHERE PEOPLE COME FROM?
Because of the geographical proximity of Mexico to the largest economy in the world, there is a constant pull of migrants from Mexico, and that pull is periodically accelerated by changes in the demand for workers in the US (Durand and Massey, 2004). Yet, if the wage gap were the only factor at work, Mexico might well be emptied of all young people, especially since data from the Mexican Migration Project (MMP) and other research have demonstrated that large social networks now exist to ease the entry of people across the border and into the US labour force while, at the same time, efforts to thwart unauthorised entry into the US from Mexico have been largely ineffective (Massey et al., 2002; Cornelius, 2007). Clearly, the pull factor of a large and persistent wage gap is not a sufficient explanation of undocumented migration to the US.
We are left to speculate that the observed changes over time in the flow of migrants from Mexico reflect changes taking place in Mexico itself, rather than simply those occurring in the US or with respect to border enforcement. Massey and his colleagues have long been aware that the relative importance of push factors in Mexico should draw our attention to the places from which migrants come in Mexico, yet ‘[D]espite these large numbers, researchers know surprisingly little about the regional, demographic, and socioeconomic origins of Mexican immigrants, mainly because of a lack of representative data’ (Durand et al., 2001: 108). They attempted to
remedy this situation a few years ago by assembling all the available data-sets that met three criteria: (1) they were large data-sets; (2) they were national in scope; and (3) they directly measured migrants and their characteristics.
Their conclusion was that more than half of all migrants have come from the ‘historic heartland’ (with respect to migration) of western Mexico, especially the states of Jalisco, Michoacán, Guanajuato and Zacatecas (the top four sending states in every data-set they examined), along with Aguascalientes, Colima, Durango, Nayarit and San Luis Potosí. These states are ‘historic’ from the perspective of migration because, according to Durand et al. (2001), they are the first states that were connected to the US by the rail lines built early in the twentieth century, largely with US financing. Since the border region was sparsely populated, labour recruiters followed the railroad to these populous Mexican states, and the regional pattern of migration was thus born. Furthermore, an analysis of data over time from the MMP has suggested that ‘migrants do not come from the poorest regions of the country; they come from communities that are dynamic and rapidly developing’ (Durand and Massey, 2004: 13).
More recent regional patterns of migration from Mexico have been described by Marcelli and Cornelius (2001). Using data from surveys conducted in Los Angeles and San Diego Counties in the late 1990s, supplemented with data from Mexican surveys, they found ‘a gradually declining proportion of Mexican immigrants originating from the historic region and a rapid decline in the proportion of migrants from the border region . . . [and] an increasingly important role is being played by Mexico’s southern region (especially the states of Guerrero, Oaxaca, and Chiapas) and by the Mexico City metropolitan area’ (Marcelli and Cornelius, 2001: 119–20). Newer research by Cornelius and his colleagues suggests that migrants are now coming from as far away as Yucatán, a state with little experience as a sending region to the US (Cornelius et al., 2008b).
The fact that Mexican migrants to the US are not likely to be a random sample of the Mexican population makes a difference for both the US and Mexico. The regional and individual-level selectivity of migrants means that some communities of migrants in the US may be considerably
Copyright © 2009 John Wiley & Sons, Ltd. Popul. Space Place (2009) DOI: 10.1002/psp
J. R. Weeks, J. Stoler and P. Jankowski
different from others, depending upon the source of the migrants. This will have potential policy consequences in terms of the kinds of responses that a community will make to the presence of the migrants. With respect to Mexico, it means that some parts of the country will be affected more than other areas. The more positive impact, at least in the short run, is that associated with remittances sent back home by migrants. The more negative impact, at least in the short run, is that associated with the emptying-out of rural villages – the ‘empty house’ phenomenon associated with an apparent increase in permanent migration that has occurred in reaction to the greater level of border enforcement activity in the wake of 9/11 (Cornelius, 2007).
The Mexican Migration Project has reinforced the social network theory of migration, which suggests that people in Mexico who have connections in the US are more likely to move than those without such connections. ‘Over time the process of network expansion becomes self-perpetuating because each act of migration creates socialinfrastructure to promote additional movement’ (Massey et al., 2002: 22). In the terminology of the rational choice model, this informationnetwork can dramatically reduce the costs of migrating through the diffusion of knowledge about how to make the trip, and can increase the benefit of migrating by improving the chances of a well-paying job at the other end. To the extent that this factor is important in explaining regional differences in sending migrants, it would suggest that the ‘traditional’ sending states – which became that as part of a set of historical circumstances (Durand et al., 2001) – would consistently remain the most important sending states, no matter what was happening in Mexico. We have data that will help us to test these ideas, essentially answering the quintessentially spatial question: in a line-up of Mexican states, which are most likely to be sending migrants to the US, and why?
DATA AND METHODS
A key innovation in this research is our ability, through a formalised working agreement with the Department of Homeland Security, to access the ENFORCE database of the US Border Patrol for the fiscal years 1999 to 2006 to obtain data about the state of origin of Mexican migrants to
the US. Every person detained by the US Border Patrol anywhere in the US who is determined by the detaining agent to be an unauthorised immigrant is asked a series of questions, the answers to which are entered digitally into hand-held data-recording devices which each Border Patrol agent carries. The data collected include the time and place of detainment, the person’s name, age, sex, country of citizenship, and place of birth (country and locality within the country). Of particular importance is the fact that everybody who is 18 years of age or older is fingerprinted, and the fingerprint is converted to a digital number, which we have been able to use to eliminate duplicate persons. The existence of duplicates in the data collected by the Border Patrol has been a major limitation in the use of their published data, and so the elimination of duplicates avoids that issue. There are, of course, many other limitations to the data which we will highlight at appropriate places in the analysis, but we believe that the uniqueness of the data-set warrants our serious attention.
We have been provided with annual ‘snapshots’ of records of people apprehended by the US Border Patrol for the calendar years 1999 to 2006 and recorded in the Enforcement Case Tracking System (ENFORCE) database. It is only a misdemeanour, not a felony, to enter the US without inspection, and the usual penalty is voluntary removal from the country. Since the vast majority of people detained are from Mexico, most detainees voluntarily return to Mexico from where, of course, they make additional attempts to cross until they are successful. Most people are ultimately successful (Cornelius et al., 2008a), and anecdotal data suggest that the average successful crossing requires three attempts (Castañeda, 2007). Thus, it seems reasonable to suggest that apprehensions are a good representation of the demographics of people entering the country without inspection. The only caveat would be whether or not those who are never apprehended are different in important ways from those who are apprehended. We discuss this issue below and conclude that there is no evidence of significant differences between them.
Because the data are collected by the Border Patrol for administrative purposes, not for research, a considerable amount of processing was required in order prepare them for analysis. All variables were checked for internal consistency
Copyright © 2009 John Wiley & Sons, Ltd. Popul. Space Place (2009) DOI: 10.1002/psp

Undocumented Immigrants to the US
and missing values. Obvious errors were corrected, while errors that were indeterminate in origin led to the assignment of a missing value. Many of the questions asked of each detainee are entered by means of drop-down menus within the software utilised by the Border Patrol. However, place of birth is entered manually, and that created some inconsistencies in spelling that had to be resolved by matching database entries with the gazetteer of place names compiled by the US National Geospatial-Intelligence Agency (http://earth-info.nga.mil/gns/html). The one difficulty that we were not able to overcome was that we could not properly distinguish between Baja California Norte and Baja California Sur, so we were forced to aggregate the data into a single category of Baja California.
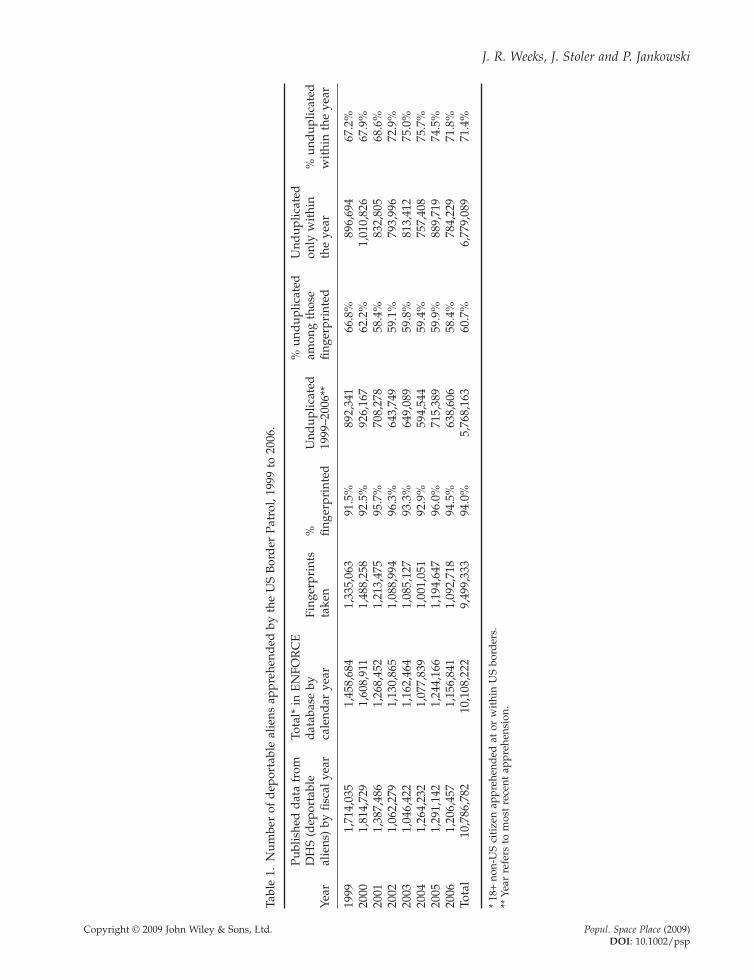
Table 1 summarises the data available to us. Each year between 1999 and 2006 there were more than one million apprehensions at or within the borders of the US by the US Border Patrol, of adults (18 and older) who were not US citizens and were not authorised to be in the US. Our numbers are for calendar years, whereas those published by the Department of Homeland Security are for the federal fiscal year (1 October to 30 September), so our figures are similar to the published numbers, although not identical, as can be seen in Table 1. Our data, like the published information, refer to people who were 18 or older at the time of apprehension. Juveniles are also apprehended, but they are typically not fingerprinted, and they are not reported in the official statistics. For our purposes, the most important element was whether or not a person was fingerprinted. If they were, then we can determine whether or not they were apprehended more than once, thus giving us an unduplicated data-set.
It can be seen in Table 1 that an average of 94% of all persons apprehended are fingerprinted, with annual percentages varying from a low of 91.5% in 1999 to a high of 96.3% in 2002 – almost certainly not coincidentally in the year following the 9/11 attacks. Among those who were fingerprinted, we have examined duplicates over the entire eight-year study period, and also on an annual basis. In 1999, of course, there were no prior data, so the unduplicated count refers to the single year. After two years, however, the percentage of unduplicated cases settles into a remarkably consistent pattern of about 60% of all
apprehensions representing unique individuals. Since the number of people fingerprinted is also quite stable, these data suggest that in any given recent year, the number of unduplicated persons apprehended by the US Border Patrol will be about 56% of the total published number (i.e. 0.94 × 0.60).
We have also calculated the percentage of apprehensions that are unduplicated within a given calendar year, without regard to whether a person might have been apprehended in prior years. This gives us an indirect measure of the annual efficiency of would-be immigrants and/ or the US Border Patrol. In particular, it is noteworthy that prior to 9/11 there were more duplicate apprehensions than there were after that event. Since there was an increased emphasis on border surveillance after 9/11, one might have anticipated more repeat apprehensions, rather than fewer, since it was more difficult to cross the border. However, the rise – albeit modest – in the percentage of unduplicated cases suggests that border-crossers were responding either by making fewer attempts and/or by being more efficient at eluding apprehension. This is consistent with research in sending communities by Cornelius (2007); Cornelius et al. (2008a) and by Massey et al. (2002) that: (a) migrants are now less likely to circulate – once in the US they are likely to stay in the US; and (b) migrants tend to stay ahead of policy-makers when it comes to figuring out how to get to the jobs they are seeking.
Although the questions asked of detainees are quite limited, an important piece of information obtained relates to the state of birth within Mexico. By relating the state of origin of migrants to data for the states from which they came, we are able to measure the propensity of people to migrate from one state or another, and then to evaluate the possible predictors of variation in the propensity. By relating the state of birth of migrants detained at the border to the characteristics of the states from which they came, we are able to draw some inferences about the migrants’ geographical roots as well as about the differing contexts of the states from which they came as possible predictors of their northward journey. This assumes that the state of birth is also the state from which the migrant was coming at the time of apprehension, or at the very least that the conditions in that state were the factors associated with migration. This assumption seems
Copyright © 2009 John Wiley & Sons, Ltd. Popul. Space Place (2009) DOI: 10.1002/psp
J. R. Weeks, J. Stoler and P. Jankowski
Copyright © 2009 John Wiley & Sons, Ltd. Popul. Space Place (2009) DOI: 10.1002/psp
Tabl
e 1.
Num
ber
of d
epor
tabl
e al
iens
app
rehe
nded
by
the
US
Bor
der
Pat
rol,
1999
to
2006
.
Publ
ishe
d d
ata
from
To
tal*
in E
NFO
RC
E
% u
ndup
licat
ed
Und
uplic
ated
DH
S (d
epor
tabl
e d
atab
ase
by
Fing
erpr
ints
%
U
ndup
licat
ed
amon
g th
ose
only
wit
hin
% u
ndup
licat
edYe
ar
alie
ns)
by fi
scal
yea
r ca
lend
ar y
ear
take
n fi n
gerp
rint
ed
1999
–200
6**
fi nge
rpri
nted
th
e ye
ar
wit
hin
the
year
1999
1,
714,
035
1,45
8,68
4 1,
335,
063
91.5
%
892,
341
66.8
%
896,
694
67.2
%
2000
1,
814,
729
1,60
8,91
1 1,
488,
258
92.5
%
926,
167
62.2
%
1,01
0,82
6 67
.9%
20
01
1,38
7,48
6 1,
268,
452
1,21
3,47
5 95
.7%
70
8,27
8 58
.4%
83
2,80
5 68
.6%
20
02
1,06
2,27
9 1,
130,
865
1,08
8,99
4 96
.3%
64
3,74
9 59
.1%
79
3,99
6 72
.9%
20
03
1,04
6,42
2 1,
162,
464
1,08
5,12
7 93
.3%
64
9,08
9 59
.8%
81
3,41
2 75
.0%
20
04
1,26
4,23
2 1,
077,
839
1,00
1,05
1 92
.9%
59
4,54
4 59
.4%
75
7,40
8 75
.7%
20
05
1,29
1,14
2 1,
244,
166
1,19
4,64
7 96
.0%
71
5,38
9 59
.9%
88
9,71
9 74
.5%
20
06
1,20
6,45
7 1,
156,
841
1,09
2,71
8 94
.5%
63
8,60
6 58
.4%
78
4,22
9 71
.8%
To
tal
10,7
86,7
82
10,1
08,2
22
9,49
9,33
3 94
.0%
5,
768,
163
60.7
%
6,77
9,08
9 71
.4%
*18
+no
n-U
S ci
tize
n ap
preh
end
ed a
t or
wit
hin
US
bord
ers.
** Y
ear
refe
rs t
o m
ost
rece
nt a
ppre
hens
ion.

Di /∑DiMPI =
Pi /∑Pi
Undocumented Immigrants to the US
reasonable in light of the evidence that less than 2% of the population migrated between states in the 2000–2005 interval, and that the trend in interstate migration in Mexico has been declining, not increasing (Partida Bush and AngelMartinez Herrera, 2006).
Combining the ENFORCE data with census data allows us to create our dependent variable which we call the Migration Propensity Index (MPI). It is calculated using logic identical to the location quotient (e.g. see Burt and Barber, 1996). We calculate the MPI as the ratio of the percentage of all detained Mexicans (D) aged 20–34 who are from a given state in Mexico (i) to the percentage of all Mexicans aged 20–34 (P) that resides in Mexican state i:
We focus our attention in this study on the age group 20–34, which we chose because two-thirds of all detainees fall within this range, and having an exact age range among detainees provides a consistent numerator against which to compare state-level demographic data. The state-level data did not provide an age breakdown specific to ages 18 and 19, so we were not able to separate them out to go into the denominator, and thus we did not include them in the numerator either.
An important advantage of the MPI is that it controls for the variability from year to year in the number of people detained at the border. It measures the relative distribution of people detained to the relative distribution in the state of origin, rather than relying on absolute numbers. It also has the advantage of a straightforward interpretation. An MPI of 1 means that the proportion of detainees from a given state is exactly proportionate to what we would expect if migration from each state were simply proportionate to its population aged 20–34. An MPI greater than 1 indicates that the state is sending more migrants than expected, and an MPI less than 1 indicates that the state is sending fewer migrants than expected. In order to assess trends over time, we calculate the MPI separately for each year. The detainee data (the numerator) represent the numbers derived from the ENFORCE database for each of the available years, whereas the population data (the denominator) are interpolated/extrapolated for each year using data from
the 2000 Census of Mexico and the 2005 Conteo of Mexico (the mid-decade census).
The predictor variables represent all available indicators of the economic, social and political situation in each state that might serve to influence the decision to migrate. They are drawn from two sources: (1) the Instituto Nacional de Estadística, Geografía e Informática (INEGI), from which we obtained data from the 2000 Censo de Poblacion and the 2005 Conteo, the 1999 and 2004 Censos Economicos, vital statistics on violent deaths and total fertility rates for the years 1999 to 2005, and the amount of foreign direct investment (FDI) for each state from 1999 to 2006; and (2) the Instituto Federal Electoral, from which we obtained data on the votes in the past two presidential elections (2000 and 2006). For all but the election results, we employed a straight-line interpolation for years that fell between censuses and surveys, and straight-line extrapolations (forwards or backwards) for years that were before or beyond available censuses and surveys.
In selecting variables that might influence migration, we draw upon the theoretical perspectives especially of Massey and his associates (Massey et al., 1993, 1994; Massey and Espinosa, 1997; Massey et al., 2002), which combine the ideas embodied in neoclassical economic theory (that the supply of labour in developing nations meets the demand for labour in richer countries), the new household economics (that migration decisions are made by household members, not autonomous individuals), the dual labour-market theory (that the demand for labour is segmented within the labour markets of the richer countries), world systems theory (that local labour markets in sending countries are disrupted by the process of globalisation), network theory (that established flows of migrants encourage migration), institutional theory (that once started, migration is perpetuated by a variety of institutional stakeholders), and cumulative causation (that migration is incredibly complex, and so all of the above factors can have simultaneous influences).
These perspectives emphasise the role played by economic factors. We assume the attractiveness of the economy in the US, even given the probable recognition by potential migrants from Mexico that they will be funnelled into the less attractive secondary labour market. Our variables focus on the economic push factors that
Copyright © 2009 John Wiley & Sons, Ltd. Popul. Space Place (2009) DOI: 10.1002/psp

J. R. Weeks, J. Stoler and P. Jankowski
may vary regionally within Mexico, including: (1) the percentage of males aged 20–34 who are currently employed, as an indicator of the employment redundancy in the state – low employment rates are expected to be associated with a higher propensity to migrate, based on both neoclassical and new household economic theoretical perspectives; (2) the number of businesses (firms) per the number of males aged 20–34, as an indicator of the employment options available per young adult male – a lower ratio is expected to be associated with a higher propensity to migrate, based on both neoclassical and new household economic perspectives; (3) the number of employees per firm, as an indicator of the robustness of the economy – a lower number is expected to be associated with a higher propensity to migrate, again based on both neoclassical and new household economic perspectives; (4) the average wages per employee, as an indicator of the economic well-being in the state – a lower average wage is expected to be associated with a higher propensity to migrate, based on both neoclassical and new household economic perspectives; (5) the gross product (GP) per firm, as an additional indicator of economic robustness – a lower GP per firm is expected to be associated with a higher propensity to migrate, based on both neoclassical and new household economic perspectives; and (6) foreign direct investment (FDI) per males aged 20–34, as an indicator of the processes of globalisation within the state – a higher FDI per male is expected to be associated with a higher propensity to migrate, based on world systems theory.
The literature recognises that there may well be a range of non-economic factors that will encourage people to leave an area, given the knowledge of a reasonable destination (in this case the US). The social and political indicators that we have available for analysis include the following:
(1) the percentage of the population aged 5 and older that speaks an indigenous language, as an index of the disadvantaged minority status of the state’s population – a high percentage is expected to be associated with a lower propensity to migrate because it is those who are relatively better off in an area who are most likely to migrate, not those who are most disadvantaged (Velasco Ortiz, 2007);
(2) the percentage of the population aged 20– 29 that is illiterate, as an index of the level of social capital in a state – a high level is expected to be associated with a slightly lower propensity to migrate, once again based on the expectation that the poorest areas of a nation are least likely to send migrants;
(3) the percentage of homes with piped water inside the home, as an index of the state’s overall well-being – low levels are expected to be associated with a higher propensity to migrate, all other things being equal, because households may see remittances from family members as the only hope for improvement in a state that is otherwise very poor;
(4) the percentage of homes connected to a public sewer or having a septic tank, as an additional index of the state’s overall level of wellbeing – low levels are expected to be associated with a higher propensity to migrate, for the same reason as noted above;
(5) the percentage of homes with access to electricity, as an additional index of the state’s overall level of well-being – low levels are expected to be associated with a higher propensity to migrate;
(6) the number of accidental and violent deaths per thousand males aged 20–34, as an index of the state’s overall level of social and political stability – a high rate is expected to be associated with a higher propensity to migrate, especially in the presence of migration networks that offer viable alternatives to young men;
(7) the total fertility rate as an index of the demographic pressure on a state’s resources – a high rate is expected to be associated with a higher propensity to migrate because of the pressure that will exist within a family if a youth bulge in a community leads to higher unemployment rates;
(8) the percentage of the population that voted for the presidential candidate of the Partido Acción Nacional (PAN) in the elections of 2000 and 2006 (these variables are introduced into the models only for those two years), as an index of the political atmosphere in a state – a low percentage is expected to be associated with a loosening of ‘traditional’ political values, which is expected to be associated with a higher propensity to migrate.
Copyright © 2009 John Wiley & Sons, Ltd. Popul. Space Place (2009) DOI: 10.1002/psp
Undocumented Immigrants to the US
A classic gravity model approach to migration might suggest that distance from a place in Mexico to the border would be an important predictor of the propensity to migrate. The diffi culty with such a measure is that the complex terrain throughout Mexico, the complex terrain along the very lengthy (3200 km) border, and the fact that most of the Mexican population is not close to the US–Mexico border, makes such a set of calculations very difficult to undertake and interpret.
An important limitation of the ENFORCE data is that we are not able to determine anything about a detainee’s educational background or work history, since those data are not collected. Our interpretation of findings is therefore limited to the factors in the source region that are associated with the propensity of people from that region to migrate north to the US. Thus, despite starting out with individual-level data from the ENFORCE database, our unit of analysis is aggregated to the state of birth of those who are apprehended.
Although Massey and his associates suggested that migrants from Mexico come from the more dynamic communities of Mexico, the migration literature in general suggests that the worse a region is in comparison with its neighbours, the greater the propensity will be for people to move from there to somewhere else where opportunities are more plentiful. The literature is much less precise in terms of exactly which factors might be most predictive of the kinds of stress that may induce migration. For this reason, we did not privilege any of the potential predictor variables, preferring to let the data speak for themselves. We did this by employing a stepwise ordinary least-squares regression model. This approach has the advantage of allowing us to find the most parsimonious model that takes into account the likely high levels of interaction among many of the predictor variables.
WHO ARE THE PERSONS BEING APPREHENDED?
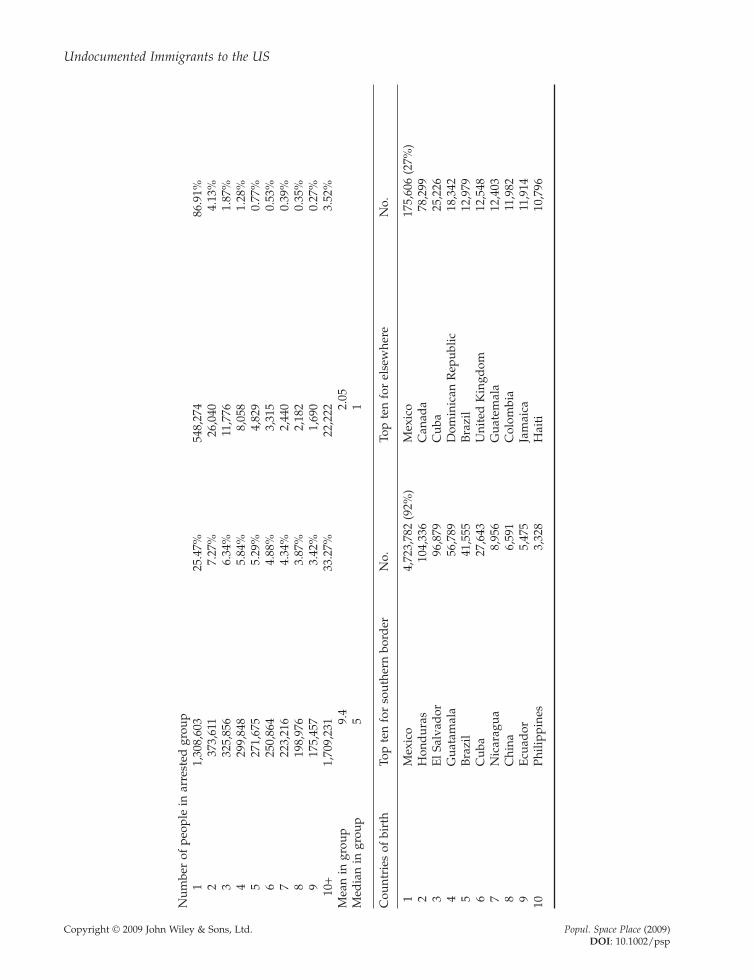
Of the people apprehended by the US Border Patrol, 89% were apprehended at or near the southern border, as can be seen in Table 2. Furthermore, there are significant differences between people apprehended at the southern border and those apprehended elsewhere. The former are
younger, more likely to be male, more likely to have been previously apprehended, more likely to have been arrested in a group, and much more likely to be from Mexico. In particular, 92% of apprehensions along the southern border are people of Mexican origin, and four of the other top ten countries are Mexico’s immediate southern neighbours – Guatemala, El Salvador, Honduras and Nicaragua. They, along with Mexico, account for 97% of all persons apprehended along the southern border. Focusing attention on the southern border apprehensions, it can be seen that the median age is 26, indicating a very young age structure. Indeed, as noted above, two-thirds of migrants are between the ages of 20–34 and 80% are in the 18–34 age group. Keep in mind that the age refers to the most recent apprehension for those with more than one apprehension, so the age data are biased slightly towards an older age.
Gender Differences
Women increased over time as a percentage of all unduplicated migrants apprehended. In 1999 they represented 13% of apprehensions, increasing to 16% in 2000, 18% in 2003, and 20% by 2006. This increase over time seems most likely to be explained by the fact that the greater security along the US–Mexico border has made it more difficult for undocumented male migrants to cross the border and so they are staying longer in the US, rather than regularly returning home. This probably motivates a woman to join her husband in the US, whereas in the past she may have been less apt to do so because he would return more often (Donato and Patterson, 2004; Valdez-Suiter et al., 2007). Despite the increase of women among the migrants, the vast majority of migrants (80%) are males. Furthermore, to the extent that the increase in the female proportion is due to family reunification, it is the pattern of male migration that is influencing the pattern of female migration. For these reasons, we focus our attention in this paper on the males.
Are These Persons Representative of all Undocumented Immigrants?
As noted above, we make the assumption that people detained by the Border Patrol are representative of all undocumented immigrants from
Copyright © 2009 John Wiley & Sons, Ltd. Popul. Space Place (2009) DOI: 10.1002/psp

J. R. Weeks, J. Stoler and P. Jankowski
Copyright © 2009 John Wiley & Sons, Ltd. Popul. Space Place (2009) DOI: 10.1002/psp
Tabl
e 2.
Cha
ract
eris
tics
of
und
uplic
ated
per
sons
app
rehe
nded
bet
wee
n 19
99 a
nd 2
006,
acc
ord
ing
to p
lace
of
app r
ehen
sion
.
App
rehe
nded
alo
ng s
outh
ern
bord
er
App
rehe
nded
at
anot
her
bord
er o
r th
e in
teri
or o
f co
untr
y
No.
%
No.
%
Age
gro
up18
–19
772,
222
15.0
3%
29,2
82
4.64
%
20–2
4 1,
456,
100
28.3
4%
113,
583
18.0
1%
25–2
9 1,
145,
960
22.3
1%
120,
782
19.1
5%
30–3
4 73
2,93
2 14
.27%
10
2,66
7 16
.28%
35
–39
455,
150
8.86
%
81,6
62
12.9
5%
40–4
4 27
6,95
6 5.
39%
62
,703
9.
94%
45
–49
152,
788
2.97
%
44,6
19
7.07
%
50–5
4 77
,343
1.
51%
29
,961
4.
75%
55
–59
36,7
82
0.72
%
20,2
48
3.21
%
60–6
4 16
,511
0.
32%
11
,892
1.
89%
65
+14
,593
0.
28%
13
,427
2.
13%
To
tal
5,13
7,33
7 63
0,82
6 M
edia
n ag
e 26
32
%
fem
ale
19.0
7%
22.7
7%
Num
ber
of t
imes
det
aine
d1
3,35
9,00
5 65
.38%
55
9,31
9 88
.66%
2
981,
442
19.1
0%
52,3
50
8.30
%
3 39
8,69
6 7.
76%
11
,944
1.
89%
4
179,
753
3.50
%
4,04
7 0.
64%
5
88,4
73
1.72
%
1,61
1 0.
26%
6
46,6
01
0.91
%
741
0.12
%
7 26
,345
0.
51%
35
2 0.
06%
8
16,1
42
0.31
%
167
0.03
%
9 10
,515
0.
20%
96
0.
02%
10
+30
,365
0.
59%
19
9 0.
03%
M
ean
tim
es d
etai
ned
1.
31
1.04
Undocumented Immigrants to the US
Copyright © 2009 John Wiley & Sons, Ltd. Popul. Space Place (2009) DOI: 10.1002/psp
Num
ber
of p
eopl
e in
arr
este
d g
roup
1 1,
308,
603
25.4
7%
548,
274
86.9
1%
2 37
3,61
1 7.
27%
26
,040
4.
13%
3
325,
856
6.34
%
11,7
76
1.87
%
4 29
9,84
8 5.
84%
8,
058
1.28
%
5 27
1,67
5 5.
29%
4,
829
0.77
%
6 25
0,86
4 4.
88%
3,
315
0.53
%
7 22
3,21
6 4.
34%
2,
440
0.39
%
8 19
8,97
6 3.
87%
2,
182
0.35
%
9 17
5,45
7 3.
42%
1,
690
0.27
%
10+
1,70
9,23
1 33
.27%
22
,222
3.
52%
M
ean
in g
roup
9.
4 2.
05
Med
ian
in g
roup
5
1
Cou
ntri
es o
f bi
rth
Top
ten
for
sout
hern
bor
der
N
o.
Top
ten
for
else
whe
re
No.
1 M
exic
o 4,
723,
782
(92%
) M
exic
o 17
5,60
6 (2
7%)
2 H
ond
uras
10
4,33
6 C
anad
a 78
,299
3
El S
alva
dor
96
,879
C
uba
25,2
26
4 G
uata
mal
a 56
,789
D
omin
ican
Rep
ublic
18
,342
5
Bra
zil
41,5
55
Bra
zil
12,9
79
6 C
uba
27,6
43
Uni
ted
Kin
gdom
12
,548
7
Nic
arag
ua
8,95
6 G
uate
mal
a 12
,403
8
Chi
na
6,59
1 C
olom
bia
11,9
82
9 E
cuad
or
5,47
5 Ja
mai
ca
11,9
14
10
Phili
ppin
es
3,32
8 H
aiti
10
,796

J. R. Weeks, J. Stoler and P. Jankowski
Mexico. We can think of no way to prove the correctness of this assumption, so instead we have searched the literature to find any evidence that it might not be true. The major, if not the only, source of relevant information is the Mexican Migration Project (MMP), which is a collaborative research project based at Princeton University and the University of Guadalajara (mmp.opr. princeton.edu). We downloaded the MMP114 data-set for migrants and looked at all migrants in the sample who had attempted to cross into the US illegally at least once during the 1999–2006 period, coinciding with our study period. There were 388 such persons interviewed in the Mexican Migration Project, of whom 126 (32%) had been detained at least once while trying to cross the border. We compared these individuals with those who were not detained while attempting to cross the border on the following background characteristics of the individuals in the sample: age, sex, marital status, education, and occupation. These individuals do not exhibit any statistically significant differences in comparison with the people who were never detained while attempting to enter the US. Our interpretation is limited by the fact that people were interviewed after their return to Mexico, and the data refer to characteristics at the time of the interview, not to the time of crossing the border, but those same limitations apply to all persons in the sample, and so the lack of any statistically significant difference on these characteristics seems meaningful. In order to take all variables into account simultaneously, we ran a logistic regression analysis using these characteristics to predict whether a person had ever been detained while crossing the border. None of the variables was a statistically significant predictor. The only variable that came close (P value of 0.08) was education – higher education is associated with a slightly lower risk of being detained at the border.
Because of the relatively small number of people in the Mexican Migration Project who had attempted to cross the border during our study period, we extended the criterion back to the year 1990. The MMP has a total of 1492 persons who had attempted at least once to cross the border illegally between 1990 and 2006. Of these individuals, 32% had been detained at least once while crossing – the same percentage as for the smaller sample of only the more recent border crossers. Among the comparison variables, only
education emerged as being statistically signifi cant among those detained or not detained. In the logistic regression analysis for this sample, itemerged as the only significant predictor of being caught, but the substantive impact was verysmall, with a log-odds ratio of only 0.95, with higher education being predictive of a slightly lower chance of being detained at the border. Thus, there is a difference, but not a large enough one to suggest that detained persons are substantively different from those not detained.
RESULTS
Absolute Numbers of Migrants by State
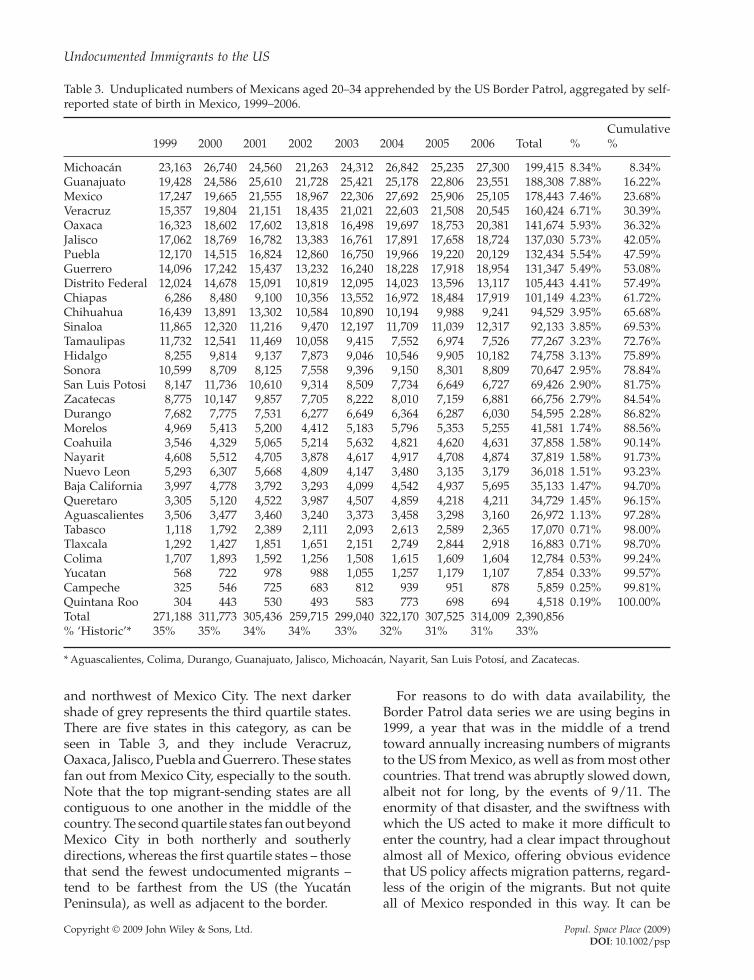
We begin the analysis by looking at the numerator data – which states in Mexico are sending the greatest number of undocumented migrants? As can be seen in Table 3, the Border Patrol detainee data suggest that the ‘Historic region’ of Mexico (the states of Aguascalientes, Colima, Durango, Guanajuato, Jalisco, Michoacán, Nayarit, San Luis Potosí and Zacatecas) now accounts for only slightly more than 30% of migrants, rather than 50% as estimated for earlier periods from the MMP by Durand et al. (2001). The third ranked sender of migrants to the border, according to the data in Table 3, is the Estado de Mexico, which is adjacent to the Distrito Federal (which includes Mexico City), and is part of the Mexico City Metropolitan Zone (Zona Metropolitana de la Ciudad de México). These migrants are likely to be suburban residents of Mexico City. Indeed, the Distrito Federal itself is now one of the top ten senders of migrants, according to Table 3. Another important shift over time has been the increase in migration from the heavily indigenous areas of southern Mexico. Oaxaca and Chiapas are both among the top ten senders of migrants to the border, and both are in the top three (along with Yucatán) with respect to the percentage of the population that speaks an indigenous language.
The data for all years (1999–2006) by state are mapped in Fig. 1. The darkest shading represents those states that account for the top 25% (fourth quartile) of all migrants, drawn from the cumulative percentage column in Table 3. There are three states in this category: Michoacán, Guanajuato, and Estado de Mexico. All three of these states are in the geographical centre of Mexico, surrounding Mexico City and directly to the west
Copyright © 2009 John Wiley & Sons, Ltd. Popul. Space Place (2009) DOI: 10.1002/psp
Undocumented Immigrants to the US
Table 3. Unduplicated numbers of Mexicans aged 20–34 apprehended by the US Border Patrol, aggregated by self-reported state of birth in Mexico, 1999–2006.
1999 2000 2001 2002 2003 2004 2005 2006 Total % Cumulative %
Michoacán Guanajuato Mexico Veracruz Oaxaca Jalisco Puebla Guerrero Distrito Federal Chiapas Chihuahua Sinaloa Tamaulipas Hidalgo Sonora San Luis Potosi Zacatecas Durango Morelos Coahuila Nayarit Nuevo Leon Baja California Queretaro Aguascalientes Tabasco Tlaxcala Colima Yucatan Campeche Quintana Roo Total % ‘Historic’*
23,163 26,740 24,560 21,263 24,312 26,842 25,235 27,300 199,415 8.34% 19,428 24,586 25,610 21,728 25,421 25,178 22,806 23,551 188,308 7.88% 17,247 19,665 21,555 18,967 22,306 27,692 25,906 25,105 178,443 7.46% 15,357 19,804 21,151 18,435 21,021 22,603 21,508 20,545 160,424 6.71% 16,323 18,602 17,602 13,818 16,498 19,697 18,753 20,381 141,674 5.93% 17,062 18,769 16,782 13,383 16,761 17,891 17,658 18,724 137,030 5.73% 12,170 14,515 16,824 12,860 16,750 19,966 19,220 20,129 132,434 5.54% 14,096 17,242 15,437 13,232 16,240 18,228 17,918 18,954 131,347 5.49% 12,024 14,678 15,091 10,819 12,095 14,023 13,596 13,117 105,443 4.41% 6,286 8,480 9,100 10,356 13,552 16,972 18,484 17,919 101,149 4.23%
16,439 13,891 13,302 10,584 10,890 10,194 9,988 9,241 94,529 3.95% 11,865 12,320 11,216 9,470 12,197 11,709 11,039 12,317 92,133 3.85% 11,732 12,541 11,469 10,058 9,415 7,552 6,974 7,526 77,267 3.23% 8,255 9,814 9,137 7,873 9,046 10,546 9,905 10,182 74,758 3.13%
10,599 8,709 8,125 7,558 9,396 9,150 8,301 8,809 70,647 2.95% 8,147 11,736 10,610 9,314 8,509 7,734 6,649 6,727 69,426 2.90% 8,775 10,147 9,857 7,705 8,222 8,010 7,159 6,881 66,756 2.79% 7,682 7,775 7,531 6,277 6,649 6,364 6,287 6,030 54,595 2.28% 4,969 5,413 5,200 4,412 5,183 5,796 5,353 5,255 41,581 1.74% 3,546 4,329 5,065 5,214 5,632 4,821 4,620 4,631 37,858 1.58% 4,608 5,512 4,705 3,878 4,617 4,917 4,708 4,874 37,819 1.58% 5,293 6,307 5,668 4,809 4,147 3,480 3,135 3,179 36,018 1.51% 3,997 4,778 3,792 3,293 4,099 4,542 4,937 5,695 35,133 1.47% 3,305 5,120 4,522 3,987 4,507 4,859 4,218 4,211 34,729 1.45% 3,506 3,477 3,460 3,240 3,373 3,458 3,298 3,160 26,972 1.13% 1,118 1,792 2,389 2,111 2,093 2,613 2,589 2,365 17,070 0.71% 1,292 1,427 1,851 1,651 2,151 2,749 2,844 2,918 16,883 0.71% 1,707 1,893 1,592 1,256 1,508 1,615 1,609 1,604 12,784 0.53%
568 722 978 988 1,055 1,257 1,179 1,107 7,854 0.33% 325 546 725 683 812 939 951 878 5,859 0.25% 304 443 530 493 583 773 698 694 4,518 0.19%
271,188 311,773 305,436 259,715 299,040 322,170 307,525 314,009 2,390,856 35% 35% 34% 34% 33% 32% 31% 31% 33%
8.34% 16.22% 23.68% 30.39% 36.32% 42.05% 47.59% 53.08% 57.49% 61.72% 65.68% 69.53% 72.76% 75.89% 78.84% 81.75% 84.54% 86.82% 88.56% 90.14% 91.73% 93.23% 94.70% 96.15% 97.28% 98.00% 98.70% 99.24% 99.57% 99.81%
100.00%
* Aguascalientes, Colima, Durango, Guanajuato, Jalisco, Michoacán, Nayarit, San Luis Potosí, and Zacatecas.
and northwest of Mexico City. The next darker shade of grey represents the third quartile states. There are five states in this category, as can be seen in Table 3, and they include Veracruz, Oaxaca, Jalisco, Puebla and Guerrero. These states fan out from Mexico City, especially to the south. Note that the top migrant-sending states are all contiguous to one another in the middle of the country. The second quartile states fan out beyond Mexico City in both northerly and southerly directions, whereas the first quartile states – those that send the fewest undocumented migrants – tend to be farthest from the US (the Yucatán Peninsula), as well as adjacent to the border.
For reasons to do with data availability, the Border Patrol data series we are using begins in 1999, a year that was in the middle of a trend toward annually increasing numbers of migrants to the US from Mexico, as well as from most other countries. That trend was abruptly slowed down, albeit not for long, by the events of 9/11. The enormity of that disaster, and the swiftness with which the US acted to make it more difficult to enter the country, had a clear impact throughout almost all of Mexico, offering obvious evidence that US policy affects migration patterns, regardless of the origin of the migrants. But not quite all of Mexico responded in this way. It can be
Copyright © 2009 John Wiley & Sons, Ltd. Popul. Space Place (2009) DOI: 10.1002/psp

J. R. Weeks, J. Stoler and P. Jankowski
Figure 1. Absolute number of migrants aged 20–34 from each state of Mexico, 1999–2006.
seen in Table 4 that three states bucked the trend of fewer migrants in 2002 (the year after 9/11) than in 2001 (essentially the year before 9/11), and several other states showed only the most modest of responses.
Table 4 rank orders each state on several comparisons that provide a qualitative assessment of the changes over time by state. For example, in the period between 1999 and 2001, there was a 13% increase overall in the number of migrants aged 20–34 detained at the border. But the highest rates of increase were clearly from the south of Mexico. The top five ranked states are the southernmost states of Mexico: Campeche, Tabasco, Quintana Roo, Yucatán and Chiapas. These states are also amongst the least likely to have slowed down the pace of migration as a result of 9/11. Furthermore, they are among the states recovering most quickly from 9/11, and they are the top states in terms of an increase in the number of migrants over the entire 1999–2006 period.
Overall, it can be seen that there was a 16% increase between 1999 and 2006 in the number of migrants aged 20–34 detained at the border, even taking into account the slowdown right after 9/11. But Chiapas and Campeche were sending nearly three times as many, while Quintana Roo, Tlaxcala, Tabasco and Yucatán were sending more than twice as many in 2006 as they had in 1999. Clearly the patterns over the past few years have been shifting.
Migration Propensity Index by State
The data in Tables 3 and 4 and Fig. 1 tell us where migrants come from, but provide no indication about differential propensities of people from each state to migrate. Table 4 offers some inferences about the changing pattern of migration from individual states, but as discussed above, our migration propensity index (detainees aged 20–34 by state/state population aged 20–34) is
Copyright © 2009 John Wiley & Sons, Ltd. Popul. Space Place (2009) DOI: 10.1002/psp

Undocumented Immigrants to the US
Table 4. States rank-ordered according to the pattern of migration between specified years.
State 2001/1999 State 2002/2001 State 2006/2001 State 2006/1999
Campeche Tabasco Quintana Roo Yucatan Chiapas Tlaxcala Coahuila Puebla Veracruz Queretaro Guanajuato San Luis Potosi Distrito Federal Mexico Zacatecas Hidalgo Guerrero Oaxaca Nuevo Leon Michoacan Morelos Nayarit Aguascalientes Jalisco Durango Tamaulipas Baja California Sinaloa Colima Chihuahua Sonora Total
2.23 2.14 1.74 1.72 1.45 1.43 1.43 1.38 1.38 1.37 1.32 1.30 1.26 1.25 1.12 1.11 1.10 1.08 1.07 1.06 1.05 1.02 0.99 0.98 0.98 0.98 0.95 0.95 0.93 0.81 0.77 1.13
Chiapas Coahuila Yucatan Campeche Aguascalientes Sonora Quintana Roo Tlaxcala Tabasco Queretaro Mexico San Luis Potosi Tamaulipas Veracruz Baja California Michoacan Hidalgo Guerrero Morelos Nuevo Leon Guanajuato Sinaloa Durango Nayarit Jalisco Chihuahua Colima Oaxaca Zacatecas Puebla Distrito Federal
1.14 1.03 1.01 0.94 0.94 0.93 0.93 0.89 0.88 0.88 0.88 0.88 0.88 0.87 0.87 0.87 0.86 0.86 0.85 0.85 0.85 0.84 0.83 0.82 0.80 0.80 0.79 0.79 0.78 0.76 0.72 0.85
Chiapas Tlaxcala Baja California Quintana Roo Guerrero Campeche Puebla Mexico Oaxaca Yucatan Jalisco Hidalgo Michoacan Sinaloa Sonora Nayarit Morelos Colima Tabasco Veracruz Queretaro Guanajuato Coahuila Aguascalientes Distrito Federal Durango Zacatecas Chihuahua Tamaulipas San Luis Potosi Nuevo Leon
1.97 1.58 1.50 1.31 1.23 1.21 1.20 1.16 1.16 1.13 1.12 1.11 1.11 1.10 1.08 1.04 1.01 1.01 0.99 0.97 0.93 0.92 0.91 0.91 0.87 0.80 0.70 0.69 0.66 0.63 0.56 1.03
Chiapas Campeche Quintana Roo Tlaxcala Tabasco Yucatan Puebla Mexico Baja California Guerrero Veracruz Coahuila Queretaro Oaxaca Hidalgo Guanajuato Michoacan Jalisco Distrito Federal Nayarit Morelos Sinaloa Colima Aguascalientes Sonora San Luis Potosi Durango Zacatecas Tamaulipas Nuevo Leon Chihuahua
2.85 2.70 2.28 2.26 2.12 1.95 1.65 1.46 1.42 1.34 1.34 1.31 1.27 1.25 1.23 1.21 1.18 1.10 1.09 1.06 1.06 1.04 0.94 0.90 0.83 0.83 0.78 0.78 0.64 0.60 0.56 1.16
designed specifically to provide that information, and these data are summarised in Table 5. Michoacán leads this list, just as it leads the list of absolute number of migrants, but there are substantial differences in the two lists, nonetheless. There are four states – Michoacán, Zacatecas, Guerrero and Oaxaca – that have consistently sent at least twice as many migrants to the border as would be expected given the state’s population of people aged 20–34 over the period from 1999 to 2006. The first two are part of the migration ‘historic heartland’, but the other two are not.
Also noteworthy is that the Estado de Mexico and Distrito Federal both consistently send only about half as many migrants north as would be expected on the basis of population alone, despite
the fact that both states send a considerable number of migrants. It is also of some interest to note that the border states are themselves not consistent with respect to migration propensity. Both Sonora and Chihuahua send more migrants than expected, but Baja California, Coahuila and Nuevo Leon send fewer than expected, while Tamaulipas sends an almost exactly proportional number.
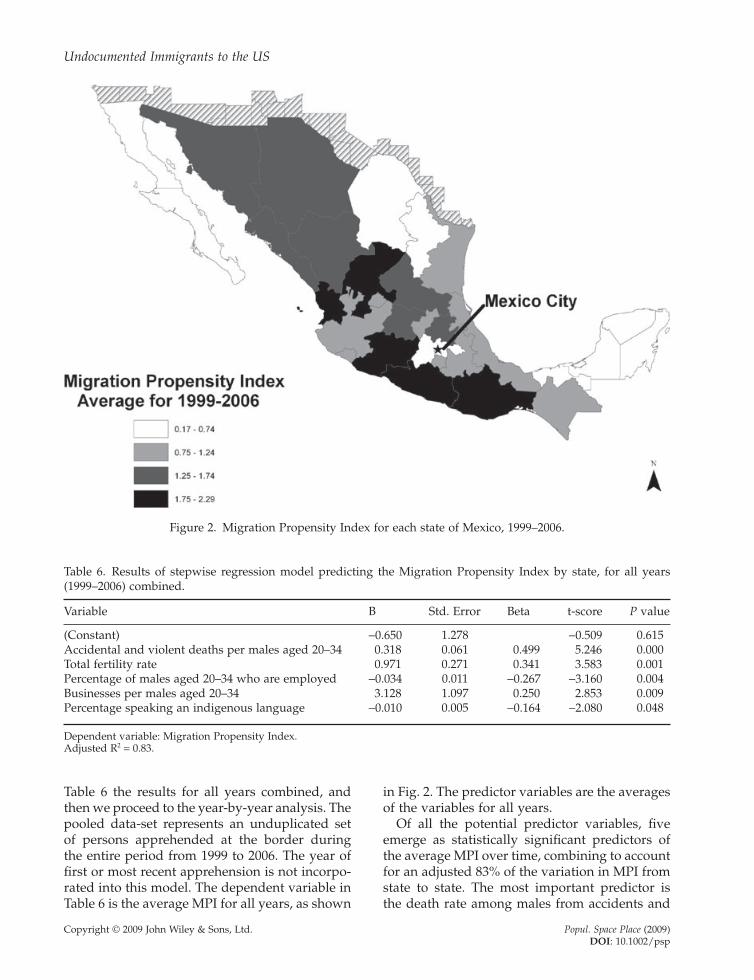
It is evident from Table 5 that there is considerable regional diversity within Mexico in the propensity to generate undocumented migrants to the US. This finding is reinforced visually in Fig. 2, where it can be clearly seen that there is a distinct spatial pattern to the migration propensity index by state, based on the average for all
Copyright © 2009 John Wiley & Sons, Ltd. Popul. Space Place (2009) DOI: 10.1002/psp

J. R. Weeks, J. Stoler and P. Jankowski
Table 5. Migration Propensity Index based on unduplicated numbers of Mexicans aged 20–34 apprehended by the US Border Patrol, aggregated by self-reported state of birth in Mexico, relative to the population aged 20–34 in each state, 1999–2006.
State
MPI
1999
MPI
2000
MPI
2001
MPI
2002
MPI
2003
MPI
2004
MPI
2005
MPI
2006
MPI
average
Michoacan Zacatecas Guerrero Oaxaca Nayarit Guanajuato Durango Sinaloa Hidalgo San Luis Potosi Sonora Chihuahua Morelos Aguascalientes Puebla Chiapas Tamaulipas Veracruz Colima Queretaro Jalisco Tlaxcala Coahuila Mexico Distrito Federal Baja California Tabasco Nuevo Leon Campeche Yucatan Quintana Roo
2.27 2.50 1.89 1.98 1.91 1.55 2.01 1.66 1.42 1.39 1.64 1.84 1.20 1.35 0.94 0.64 1.41 0.84 1.19 0.84 0.98 0.48 0.52 0.46 0.44 0.47 0.21 0.44 0.17 0.13 0.11
2.30 2.53 2.02 1.96 2.00 1.70 1.77 1.51 1.46 1.74 1.18 1.37 1.14 1.15 0.96 0.74 1.31 0.95 1.14 1.11 0.93 0.45 0.56 0.45 0.48 0.48 0.29 0.46 0.25 0.14 0.13
2.18 2.53 1.86 1.90 1.74 1.81 1.76 1.42 1.39 1.60 1.12 1.35 1.12 1.15 1.13 0.80 1.22 1.04 0.97 0.98 0.85 0.59 0.66 0.50 0.51 0.38 0.39 0.42 0.33 0.19 0.16
2.24 2.35 1.89 1.75 1.70 1.80 1.73 1.43 1.40 1.65 1.23 1.27 1.13 1.25 1.00 1.05 1.26 1.08 0.89 1.00 0.79 0.61 0.80 0.52 0.44 0.38 0.41 0.42 0.36 0.22 0.17
2.24 2.19 2.02 1.82 1.76 1.83 1.60 1.62 1.39 1.31 1.34 1.15 1.15 1.12 1.12 1.18 1.02 1.07 0.92 0.97 0.86 0.68 0.75 0.53 0.43 0.41 0.35 0.31 0.36 0.20 0.17
2.32 2.00 2.12 2.02 1.74 1.68 1.42 1.46 1.51 1.10 1.21 1.01 1.20 1.05 1.23 1.35 0.76 1.08 0.91 0.95 0.85 0.80 0.60 0.61 0.47 0.41 0.40 0.24 0.38 0.22 0.21
2.30 1.88 2.20 2.02 1.75 1.59 1.47 1.46 1.48 0.99 1.16 1.05 1.17 1.04 1.23 1.52 0.74 1.08 0.94 0.85 0.88 0.86 0.60 0.59 0.49 0.46 0.41 0.23 0.40 0.21 0.19
2.46 1.79 2.29 2.15 1.78 1.61 1.39 1.62 1.48 0.98 1.20 0.96 1.13 0.96 1.25 1.42 0.78 1.02 0.91 0.82 0.91 0.85 0.59 0.56 0.47 0.52 0.37 0.23 0.36 0.19 0.19
2.29 2.22 2.03 1.95 1.80 1.70 1.64 1.52 1.44 1.35 1.26 1.25 1.16 1.13 1.11 1.09 1.06 1.02 0.98 0.94 0.88 0.67 0.64 0.53 0.47 0.44 0.35 0.34 0.33 0.18 0.17
years. The Moran’s I global statistic of spatial autocorrelation is statistically significant at every distance over 500 km (which is slightly greater than the average distance between the geographical centres of each state). There is a cluster of three states in the southwest of Mexico that is especially likely to send more migrants than expected. There is a pattern for the ‘spine’ through Mexico from north to south – but skipping around Greater Mexico City – to have an MPI greater than 1, whereas Mexico’s ‘extremities’ on the east, west, and in the Yucatan Peninsula, have values less than 1. Nonetheless, as the data in Table 5 show clearly, there are several states,
especially the southern ones, in which the MPI, while still low, increased noticeably over time.
Predictors of the MPI by State
We turn now to a consideration of which factors might help to explain why some states are more likely than others to send undocumented migrants to the border, and also to see whether those explanatory factors change over time. We employ fixed-effects stepwise regression, with the MPI for each state in each year as the dependent variable, influenced by the set of explanatory variables listed previously. We begin by presenting in
Copyright © 2009 John Wiley & Sons, Ltd. Popul. Space Place (2009) DOI: 10.1002/psp
Undocumented Immigrants to the US
Figure 2. Migration Propensity Index for each state of Mexico, 1999–2006.
Table 6. Results of stepwise regression model predicting the Migration Propensity Index by state, for all years (1999–2006) combined.
Variable B Std. Error Beta t-score P value
(Constant) −0.650 1.278 −0.509 0.615 Accidental and violent deaths per males aged 20–34 0.318 0.061 0.499 5.246 0.000 Total fertility rate 0.971 0.271 0.341 3.583 0.001 Percentage of males aged 20–34 who are employed −0.034 0.011 −0.267 −3.160 0.004 Businesses per males aged 20–34 3.128 1.097 0.250 2.853 0.009 Percentage speaking an indigenous language −0.010 0.005 −0.164 −2.080 0.048
Dependent variable: Migration Propensity Index. Adjusted R2 = 0.83.
Table 6 the results for all years combined, and then we proceed to the year-by-year analysis. The pooled data-set represents an unduplicated set of persons apprehended at the border during the entire period from 1999 to 2006. The year of first or most recent apprehension is not incorporated into this model. The dependent variable in Table 6 is the average MPI for all years, as shown
in Fig. 2. The predictor variables are the averages of the variables for all years.
Of all the potential predictor variables, five emerge as statistically significant predictors ofthe average MPI over time, combining to account for an adjusted 83% of the variation in MPI from state to state. The most important predictor isthe death rate among males from accidents and
Copyright © 2009 John Wiley & Sons, Ltd. Popul. Space Place (2009) DOI: 10.1002/psp

J. R. Weeks, J. Stoler and P. Jankowski
violence: the higher the death rate, the higher the migration propensity. Obviously, there is unlikely to be any direct connection between death rates and migration in Mexico, but the death rate from accidental and violent causes clearly is indicative of problems in a state that may influence the decision to leave. To understand this better, we conducted a principal components analysis to see which of the variables are grouped statistically with the violent death rate. The results suggest a veritable laundry list of problems associated with states with a higher than average death rate from accidents and violence, including: lower than average percentage of homes with sewer, water and electricity connections, a higher than average illiteracy rate, low wages per firm, low numbers of employees per firm, and low levels of foreign direct investment. This suggests that it is not simply the lack of jobs that push people to move; it is a wider complex of issues, consistent with Massey’s concept of cumulative causation.
One of the issues may be that the relationship between violence and migration could be in some way related to the drug trade. There is very little discussion in the academic literature about drug trafficking in Mexico, partly because, as McDonald (2005) pointed out, it is a very dangerous area of research. A UNESCO-sponsored assessment in the late 1990s concluded that ‘[t]oday, the states of Chihuahua, Guerrero, Durango, Jalisco, Michoacán, Nayarit, Oaxaca, Sinaloa, Sonora and Veracruz, produce 99% of drugs in Mexico’ (Astorga, 1999: 15). Of these ten states, seven are among the top ten in terms of violence, with Jalisco, Sonora and Veracruz being the exceptions. A more recent report named Guerrero, Durango, Sinaloa, Michoacán, Baja California, Chihuahua, Nuevo León and Tamaulipas as the Mexican states with the greatest amount of drug trafficking (Mendoza Aguilar, 2007). The border states are obvious choices, but Guerrero, Durango, Sinaloa and Michoacán, as noted above, are among the top ten states in terms of violence, suggesting that there may well be a relationship to drug trafficking.
The importance of Michoacán is underscored by the fact that President Calderón sent 24,000 troops and police into that state in December 2006 in order to battle drug traffickers (Levitch, 2007). To the extent that drug trafficking creates instability at the local level, it is reasonable to suppose that it might encourage people to leave.
At the same time, the fact that Michoacán, in particular, has such a long history of sending migrants to the US could increase the probability that drug traffickers would themselves have origins there. However, we have no data to go beyond such speculations, and the relationship with migration, while interesting, could be spurious.
The second most important factor influencing migration is the total fertility rate. As expected, higher birth rates are associated with higher propensities to migrate, and this effect goes beyond the fact that high birth rates are typically associated with lower levels of economic development. It is in line with Kingsley Davis’s classical theory of demographic change and response (Davis, 1963), which reminds us that as families grow beyond the size that the parents and local community can sustain, the only reasonable option available to young people is to move elsewhere. In general, those states in Mexico with higherthan-replacement fertility rates are also likely to have higher than average out-migration rates.
The third most important predictor of the MPI is the one that is most often referenced as being important: the employment rate among young adult men. A lower employment rate is associated with a higher propensity to migrate, even independently of the other factors related to low levels of economic development that were indexed by the other variables in the model. This relationship would seem to contradict the idea that undocumented migrants are more likely to come from the dynamic areas of Mexico.
The fourth variable that is statistically signifi cant as a predictor of migration propensity at the state level is the number of businesses per males aged 20–34. This is counter to our expectations and, indeed, at first blush it seems counter-intuitive that this relationship should be positive: that more businesses per male is associated with a higher migration propensity. But, a closer look at the data reveals that there is a negative association between the number of businesses per male and the number of employees per firm. That number, in turn, is associated with higher wages per employee. Thus, the greater number of businesses per male is really a signal that the economy has a larger than average number of small companies paying low wages, and this is reasonably associated with a higher than average propensity to migrate. Related to this is the
Copyright © 2009 John Wiley & Sons, Ltd. Popul. Space Place (2009) DOI: 10.1002/psp

Undocumented Immigrants to the US
suggestion put forth by Papail (2003) that the remittances from migrants working in the US may be used to create ‘micro-companies’ that are managed by the migrant’s wife, or by the migrant when he returns from the US. These are not businesses, however, that are likely to create jobs for local young adults.
The final variable that is a statistically signifi cant predictor is the percentage of the population aged 5 and older that speaks an indigenous language. This is a negative relationship, indicating that the higher is this percentage, the lower is the migration propensity. This reflects the fact that overall the southern states of Mexico, which is where the indigenous population is concentrated, have only recently begun to participate in the migration flow towards the border.
We obtained a very high, but still less than perfect, R2 in our model and we examined the residuals for additional clues. There was no sign of spatial dependence or heteroscedasticity in the residuals, but there was one state, Tamaulipas, that has a standardised residual of greater than two. Our model predicted an MPI of only 0.50, whereas the value observed for the state was just above 1.00. Thus, although Tamaulipas does not send a disproportionate share of migrants to the border, it sends more than would be expected, given our set of predictor variables. Tamaulipas shares a border with the southern part of Texas that is heavily Latino and which shares a long history with Mexico, and this probably produces a somewhat different pattern of migration across the border than might exist with other states.
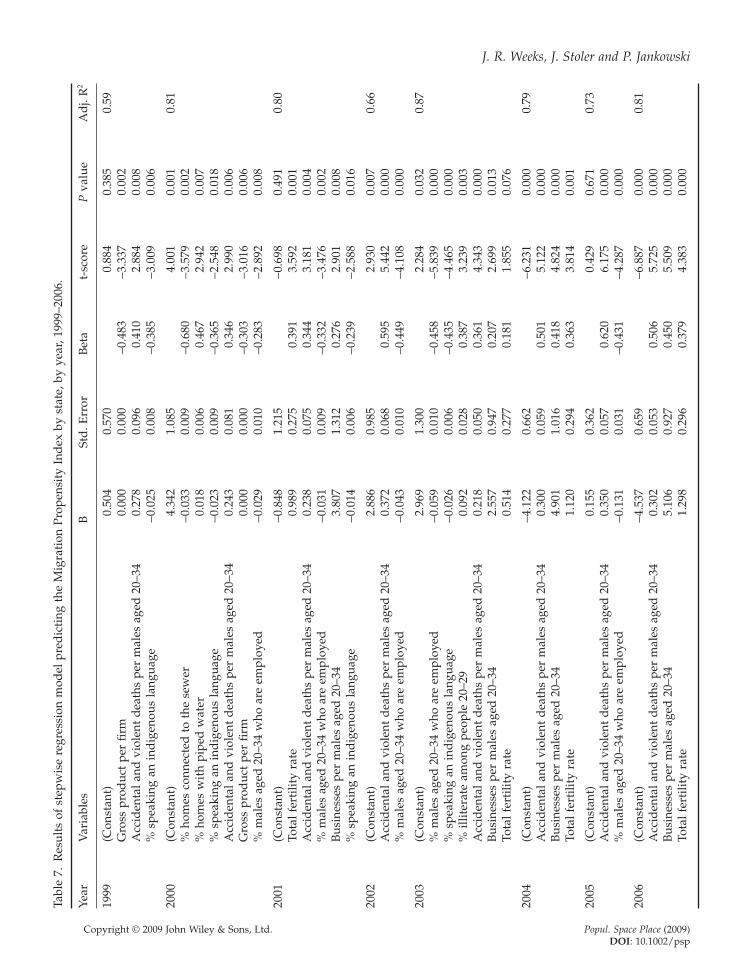
Next, we turn to the year-by-year analysis to see if there if there is temporal consistency in the factors influencing the migration propensity index. The results are shown in the several panels of Table 7. In 1999, for example, three variables emerged as statistically significant predictors of the MPI for that year. These include the gross product per firm (the higher this was, the lower was migration), the death rate from violence and accidents (the higher the rate, the higher the MPI), and the percentage of the population speaking an indigenous language (the higher the percentage, the lower the MPI). Together, these variables accounted for 59% of the variance in the MPI. This is a high percentage, yet it is the lowest R2 of any year.
The special importance of the death rate from violence and accidents can be seen in the fact that
it is the only variable that emerges as statistically significant in all eight years for which we have data. By comparison, the gross product per firm shows up in only two years, and the most recent year was 2000. The percentage of the population speaking an indigenous language shows up four times, but most recently in 2003. Several variables emerge as important in one year, including three variables that are otherwise associated with the death rate from violence: the percentage of the population with homes attached to a sewer or septic tank (the higher this value, the lower the MPI), the percentage of home connected to a water source (the higher this value, the lower the MPI), and the percentage of the population that is illiterate (the higher this value, the higher the MPI).
In the post 9/11 period a pattern can be seen in Table 7 for three variables to be quite consistently associated with the MPI, and all three emerged as significant in the averaged data shown in Table 5. These variables are the death rate from violence, the number of businesses per male, and the total fertility rate. The other recurring variable of importance, the employment rate among males aged 20–34, was also important in the averaged data. Even in 2002, right after 9/11, when migration dropped and when the R2 dropped from 0.80 in the previous two years to a value of 0.66, the death rate variable and the male employment variable were the significant predictors. Thus, in every year, the factors influencing the propensity to migrate appear to represent a combination of social context and economic context. The political context, indexed by voting patterns, did not emerge as statistically significant.
A shortcoming of the data in Table 7 is that they do not permit us to see the way in which the change in the MPI may be influenced by the characteristics at the place of origin. A straightforward way of examining the trend over time is to calculate the ratio of the MPI in 2006 to the MPI in 1999, using the data shown above in Table 5. This provides an index of the rate of change in the migration propensity over the period of time for which we have data. The calculations are shown in Table 8, rank-ordered by state from highest increase to lowest. The results show very clearly that in the past few years there has been a rapid acceleration of migration out of the southernmost states of Mexico. Chiapas has seen the greatest change, but the top states in this category
Copyright © 2009 John Wiley & Sons, Ltd. Popul. Space Place (2009) DOI: 10.1002/psp
Tabl
e 7.
Res
ults
of
step
wis
e re
gres
sion
mod
el p
red
icti
ng t
he M
igra
tion
Pro
pens
ity
Ind
ex b
y st
ate,
by
year
, 199
9–20
06.
Year
V
aria
bles
B
St
d. E
rror
B
eta
t-sc
ore
P v
alue
A
dj.
R2
1999
(C
onst
ant)
0.
504
0.57
0 0.
884
0.38
5 0.
59
Gro
ss p
rod
uct
per
fi rm
0.
000
0.00
0 −0
.483
−3
.337
0.
002
Acc
iden
tal a
nd v
iole
nt d
eath
s pe
r m
ales
age
d 2
0–34
0.
278
0.09
6 0.
410
2.88
4 0.
008
% s
peak
ing
an in
dig
enou
s la
ngua
ge
−0.0
25
0.00
8 −0
.385
−3
.009
0.
006
2000
(C
onst
ant)
4.
342
1.08
5 4.
001
0.00
1 0.
81
% h
omes
con
nect
ed t
o th
e se
wer
−0
.033
0.
009
−0.6
80
−3.5
79
0.00
2 %
hom
es w
ith
pipe
d w
ater
0.
018
0.00
6 0.
467
2.94
2 0.
007
% s
peak
ing
an in
dig
enou
s la
ngua
ge
−0.0
23
0.00
9 −0
.365
−2
.548
0.
018
Acc
iden
tal a
nd v
iole
nt d
eath
s pe
r m
ales
age
d 2
0−34
0.
243
0.08
1 0.
346
2.99
0 0.
006
Gro
ss p
rod
uct
per
fi rm
0.
000
0.00
0 −0
.303
−3
.016
0.
006
% m
ales
age
d 2
0–34
who
are
em
ploy
ed
−0.0
29
0.01
0 −0
.283
−2
.892
0.
008
2001
(C
onst
ant)
−0
.848
1.
215
−0.6
98
0.49
1 0.
80
Tota
l fer
tilit
y ra
te
0.98
9 0.
275
0.39
1 3.
592
0.00
1 A
ccid
enta
l and
vio
lent
dea
ths
per
mal
es a
ged
20–
34
0.23
8 0.
075
0.34
4 3.
181
0.00
4 %
mal
es a
ged
20–
34 w
ho a
re e
mpl
oyed
−0
.031
0.
009
−0.3
32
−3.4
76
0.00
2 B
usin
esse
s pe
r m
ales
age
d 2
0–34
3.
807
1.31
2 0.
276
2.90
1 0.
008
% s
peak
ing
an in
dig
enou
s la
ngua
ge
−0.0
14
0.00
6 −0
.239
−2
.588
0.
016
2002
(C
onst
ant)
2.
886
0.98
5 2.
930
0.00
7 0.
66
Acc
iden
tal a
nd v
iole
nt d
eath
s pe
r m
ales
age
d 2
0–34
0.
372
0.06
8 0.
595
5.44
2 0.
000
% m
ales
age
d 2
0–34
who
are
em
ploy
ed
−0.0
43
0.01
0 −0
.449
−4
.108
0.
000
2003
(C
onst
ant)
2.
969
1.30
0 2.
284
0.03
2 0.
87
% m
ales
age
d 2
0–34
who
are
em
ploy
ed
−0.0
59
0.01
0 −0
.458
−5
.839
0.
000
% s
peak
ing
an in
dig
enou
s la
ngua
ge
−0.0
26
0.00
6 −0
.435
−4
.465
0.
000
% il
liter
ate
amon
g pe
ople
20–
29
0.09
2 0.
028
0.38
7 3.
239
0.00
3 A
ccid
enta
l and
vio
lent
dea
ths
per
mal
es a
ged
20–
34
0.21
8 0.
050
0.36
1 4.
343
0.00
0 B
usin
esse
s pe
r m
ales
age
d 2
0–34
2.
557
0.94
7 0.
207
2.69
9 0.
013
Tota
l fer
tilit
y ra
te
0.51
4 0.
277
0.18
1 1.
855
0.07
6
2004
(C
onst
ant)
−4
.122
0.
662
−6.2
31
0.00
0 0.
79
Acc
iden
tal a
nd v
iole
nt d
eath
s pe
r m
ales
age
d 2
0–34
0.
300
0.05
9 0.
501
5.12
2 0.
000
Bus
ines
ses
per
mal
es a
ged
20–
34
4.90
1 1.
016
0.41
8 4.
824
0.00
0 To
tal f
erti
lity
rate
1.
120
0.29
4 0.
363
3.81
4 0.
001
2005
(C
onst
ant)
0.
155
0.36
2 0.
429
0.67
1 0.
73
Acc
iden
tal a
nd v
iole
nt d
eath
s pe
r m
ales
age
d 2
0–34
0.
350
0.05
7 0.
620
6.17
5 0.
000
% m
ales
age
d 2
0–34
who
are
em
ploy
ed
−0.1
31
0.03
1 −0
.431
−4
.287
0.
000
2006
(C
onst
ant)
−4
.537
0.
659
−6.8
87
0.00
0 0.
81
Acc
iden
tal a
nd v
iole
nt d
eath
s pe
r m
ales
age
d 2
0–34
0.
302
0.05
3 0.
506
5.72
5 0.
000
Bus
ines
ses
per
mal
es a
ged
20–
34
5.10
6 0.
927
0.45
0 5.
509
0.00
0 To
tal f
erti
lity
rate
1.
298
0.29
6 0.
379
4.38
3 0.
000
J. R. Weeks, J. Stoler and P. Jankowski
Copyright © 2009 John Wiley & Sons, Ltd. Popul. Space Place (2009) DOI: 10.1002/psp
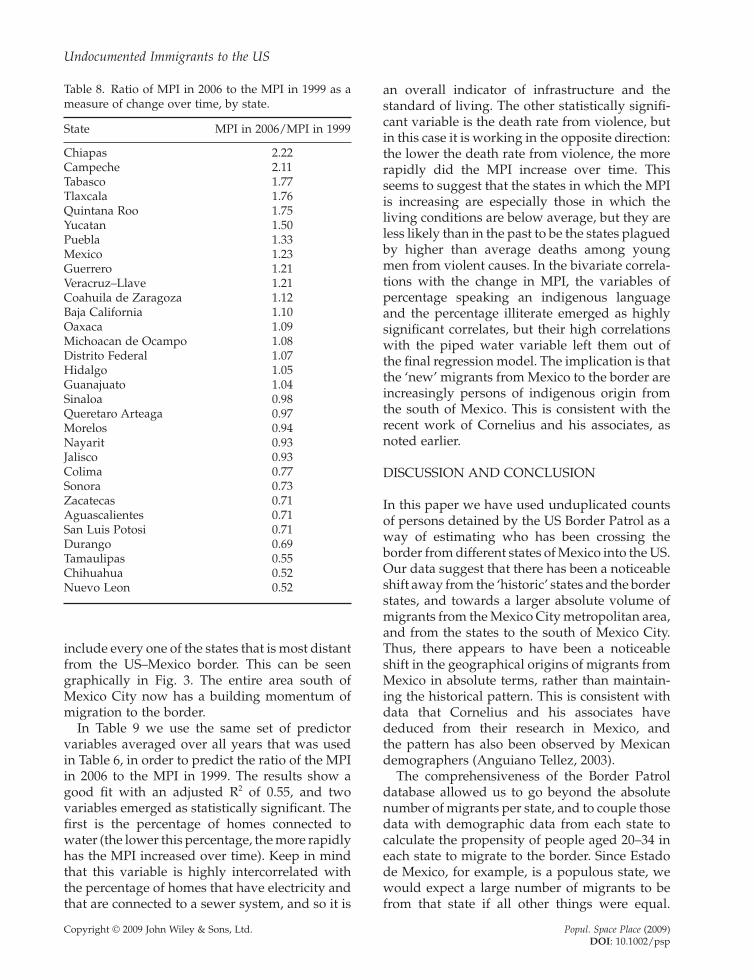
Undocumented Immigrants to the US
Table 8. Ratio of MPI in 2006 to the MPI in 1999 as a measure of change over time, by state.
State MPI in 2006/MPI in 1999
Chiapas Campeche Tabasco Tlaxcala Quintana Roo Yucatan Puebla Mexico Guerrero Veracruz–Llave Coahuila de Zaragoza Baja California Oaxaca Michoacan de Ocampo Distrito Federal Hidalgo Guanajuato Sinaloa Queretaro Arteaga Morelos Nayarit Jalisco Colima Sonora Zacatecas Aguascalientes San Luis Potosi Durango Tamaulipas Chihuahua Nuevo Leon
2.22 2.11 1.77 1.76 1.75 1.50 1.33 1.23 1.21 1.21 1.12 1.10 1.09 1.08 1.07 1.05 1.04 0.98 0.97 0.94 0.93 0.93 0.77 0.73 0.71 0.71 0.71 0.69 0.55 0.52 0.52
include every one of the states that is most distant from the US–Mexico border. This can be seen graphically in Fig. 3. The entire area south of Mexico City now has a building momentum of migration to the border.
In Table 9 we use the same set of predictor variables averaged over all years that was used in Table 6, in order to predict the ratio of the MPI in 2006 to the MPI in 1999. The results show a good fit with an adjusted R2 of 0.55, and two variables emerged as statistically significant. The first is the percentage of homes connected to water (the lower this percentage, the more rapidly has the MPI increased over time). Keep in mind that this variable is highly intercorrelated with the percentage of homes that have electricity and that are connected to a sewer system, and so it is
an overall indicator of infrastructure and the standard of living. The other statistically signifi cant variable is the death rate from violence, but in this case it is working in the opposite direction: the lower the death rate from violence, the more rapidly did the MPI increase over time. This seems to suggest that the states in which the MPI is increasing are especially those in which the living conditions are below average, but they are less likely than in the past to be the states plagued by higher than average deaths among young men from violent causes. In the bivariate correlations with the change in MPI, the variables of percentage speaking an indigenous language and the percentage illiterate emerged as highly significant correlates, but their high correlations with the piped water variable left them out of the final regression model. The implication is that the ‘new’ migrants from Mexico to the border are increasingly persons of indigenous origin from the south of Mexico. This is consistent with the recent work of Cornelius and his associates, as noted earlier.
DISCUSSION AND CONCLUSION
In this paper we have used unduplicated counts of persons detained by the US Border Patrol as a way of estimating who has been crossing the border from different states of Mexico into the US. Our data suggest that there has been a noticeable shift away from the ‘historic’ states and the border states, and towards a larger absolute volume of migrants from the Mexico City metropolitan area, and from the states to the south of Mexico City. Thus, there appears to have been a noticeable shift in the geographical origins of migrants from Mexico in absolute terms, rather than maintaining the historical pattern. This is consistent with data that Cornelius and his associates have deduced from their research in Mexico, and the pattern has also been observed by Mexican demographers (Anguiano Tellez, 2003).
The comprehensiveness of the Border Patrol database allowed us to go beyond the absolute number of migrants per state, and to couple those data with demographic data from each state to calculate the propensity of people aged 20–34 in each state to migrate to the border. Since Estado de Mexico, for example, is a populous state, we would expect a large number of migrants to be from that state if all other things were equal.
Copyright © 2009 John Wiley & Sons, Ltd. Popul. Space Place (2009) DOI: 10.1002/psp

J. R. Weeks, J. Stoler and P. Jankowski
Figure 3. Change in Migration Propensity Index for each state of Mexico from 1999–2006.
Table 9. Results of stepwise regression model predicting the ratio of the Migration Propensity Index in 2006 to the MPI in 1999, by state.
Variable B Std. Error Beta t–score P value
(Constant) 2.008 0.625 3.216 0.003 % homes with piped water −0.028 0.005 −1.103 −5.482 0.000 Accidental and violent deaths −0.148 0.062 −0.318 −2.239 0.024
per males aged 20–34 % homes connected to the sewer 0.018 0.008 0.464 2.251 0.033
Dependent variable: Migration Propensity Index. Adjusted R2 = 0.55.
Michoacán, on the other hand, is only the tenth-ranked state in terms of its population aged 20– 34, and so its persistence as the leader in sending migrants suggests that people are leaving that state in disproportionate numbers. One explanation is clearly that historically it was, for a variety of reasons that may no longer matter, an early source of migrants and, following the models of network theory and cumulative causation, it has remained that way. Our Migration Propensity
Index showed that there were a number of states, including Michoacán and the other states highlighted by the MMP, that have been sending more migrants than would be expected on the basis of how many young adults they have.
The National Population Council of Mexico (CONAPO) has created its own index of migration ‘intensity’ for each state of Mexico, based on data collected in the sample portion of the 2000 Mexican census regarding family members who
Copyright © 2009 John Wiley & Sons, Ltd. Popul. Space Place (2009) DOI: 10.1002/psp
Undocumented Immigrants to the US
have migrated. The comparison with our data, collected by the US government directly from would-be migrants, is instructive. The CONAPO study calculated the proportion of households in each state that: (a) received remittances from a family member residing in the US; (b) had at least one household member who migrated to the US during the five years prior to the census and were still there at the time of the 2000 census; (c) had at least one household member who migrated to the US during the five years prior to the census and returned home to Mexico during that same time period; and (d) had at least one household member who had lived in the US in 1995, but had returned to Mexico by the time of the 2000 census. These four variables were highly intercorrelated and so a principal components analysis was conducted to reduce them to a single score, which they called the Index of Migration Intensity.
The Pearson correlation coefficient between our Migration Propensity Index averaged over the entire 1999–2006 period and the CONAPO Index of Migration Intensity was 0.76, suggesting that the state patterns we are observing are robust. An even better indication of the robustness is that the correlation is highest between the CONAPO index (which is based on the 2000 census) and our index based on 2000 detainees: 0.81. The coefficients drop monotonically over time, and the lowest correlation was with our 2006 detainee data (0.63), which is indicative of the changing nature of the migration flow from Mexico to the US. One of those changes, of course, is the fact that migrants are less likely to return to Mexico than in the past, and two of the four variables in the CONAPO index relate to return migration. If we look only at the percentage of households who sent a migrant to the US during the five years prior to the census, the correlation with our index is even higher: 0.81 overall, and 0.85 for the year 2000, with no outliers among the states.
In examining the state-level factors that were most associated with our Migration Propensity Index, we found that the most consistent predictor among those state-level variables available to us was the death rate from violence and accidents among men aged 20–34. The states with a higher propensity to violence also have a higher propensity for migration, although as we noted this is beginning to change. This is related statistically to several indicators of lower than average
economic development. Not surprisingly, given the high correlation between our index and that of CONAPO, the latter’s index of migration intensity was also most powerfully explained by the death rate from violence and accidents among men aged 20–34.
Our analysis of the state-level factors associated with the migration propensity index suggests the importance of the combination of demography and political economy. Lower levels of economic development and all of the problems that are associated with it are factors that contribute to migration, while high fertility plays a role in encouraging migration, probably because it creates a situation of too many young people chasing after too few local jobs. Although demographers are well aware of the push created by a redundant young population produced by high birth rates, this factor has not lately been at the centre of attention of migration analyses, so its emergence here as an important predictor is significant. At the same time, a lower than average employment rate among young men, even when taking the fertility effect into account, along with a generally unfavourable economic environment in a state, are also statistically significant predictors of migration to the border. All of these factors suggest that people are leaving places where the situation is relatively bad, rather than migrating from places where the situation is better than average.
Particularly noteworthy is the finding that the most rapid increase in the propensity to migrate is occurring in those southern states of Mexico dominated demographically by indigenous populations, and experiencing lower levels of infrastructure improvement than other states in Mexico. The state of Oaxaca seems to be leading edge of this wedge. Although the roots of migration from Oaxaca to the US go back at least to the 1930s, household surveys from Oaxaca suggest that there was a clear upsurge in the 1990s (Cohen, 2005). These southern states do not yet command the migration stream, but they represent an increasing fraction of all migrants. In the US, the impact on local communities is that migrants may soon be less well educated, and less literate even in Spanish, than earlier migrants, reversing a trend towards gradually higher educational levels among migrants (see Marcelli and Cornelius, 2001), and thus potentially complicating local efforts to cope with their arrival. The
Copyright © 2009 John Wiley & Sons, Ltd. Popul. Space Place (2009) DOI: 10.1002/psp

J. R. Weeks, J. Stoler and P. Jankowski
evidence thus far suggests that indigenous Mexican migrants are most likely to seek jobs either in the service industry of the Los Angeles metropolitan area, or in the agricultural sector of California’s Central Valley, but there is anecdotal evidence of indigenous-language groups in Illinois, New York and Florida (Fox and Rivera-Salgado, 2004). It has been suggested that this process ‘will require rethinking Mexican migration in terms of the diversity of different ethnic, gender, and regional experiences . . . this recognition of diversity is crucial for broadening and deepening coalitions with social actors, both in the United States and in Mexico’ (Fox and Rivera-Salgado, 2004: 45–6).
Until recently, the indigenous population had moved mainly within Mexico, especially towards urban areas, rather than undertaking the trek across the US–Mexico border. Within Mexico, the trend towards a movement of people out of the south toward the US could potentially create labour shortages in a part of the country that paradoxically already relies in part on immigrant labour (including undocumented immigrants) from Guatemala.
A major limitation of the data we have relied upon in this research is that the only information we have about the individual migrants is their age, sex, and place of birth. Thus, our inferences about the factors that might have prompted their own migration are based on state-level aggregations, and we do not wish to fall into the potential trap of an ecological fallacy. However, we can conclude that states that send disproportionate shares of migrants tend to be those with below average social and economic infrastructures. This is especially true of the states from which we see the most rapid recent increase in the propensity to send migrants to the US. The relevance of the state-of-birth data also depends upon the extent to which they reflect the place from which migrants actually came. As noted previously, however, the level of interstate migration is quite low in Mexico, so we do not believe that this is an issue.
Overall, the origins of migrants detained by the US Border Patrol offer a picture of significant changes taking place that will have potentially far-reaching effects in both Mexico and the US. New areas of Mexico are being opened up to the diffusion of wealth and ideas spreading from migrants back to their places of origin in Mexico.
At the same time, the task of integrating immigrants from new places in Mexico puts a burden on communities in the US, in which Mexican migrants from different places, with different Spanish and English abilities, and potentially different cultural values, must negotiate life together (since they tend to be lumped together by people living in the communities to which they migrate), and together they must negotiate life in the US. The persons attempting to cross the border without documentation are almost all young adults, and a large number of them will wind up having children who are born in the US who will automatically be US citizens. These are the ‘anchor babies’ who, when they reach the age of 21, can apply for legal status for their parents and other relatives. Indeed, the relatives of US citizens represent the majority of legal migrants to the US which, as we noted in the introduction, is one of the reasons why there is such a demand for workers who are shut out of the legal process.
Although the migration from Mexico to the US has elements of uniqueness, given the physical contiguity of the two nations, other rich low-fertility areas of the world are experiencing similar issues of how to integrate migrants, both legal and undocumented, from ‘non-traditional’ sending areas. Japan has dealt with this largely by shutting out migrants as best it can. The offi cial government policy is one of maintaining ‘ethnic homogeneity’ (Castles and Miller, 2003: 164), and the low level of legal migration and naturalisation has tended to create local enclaves of disadvantaged migrant workers.
European nations, by contrast, have been more open to migration, but for most of the post-Second World War period migrants have come from former colonies. More recently, the low fertility and, until 2009, the economic growth throughout Europe, has generated demand beyond these traditional sending regions. In some cases, such as Spain, Italy and Ireland, the nations changed from labour-exporters to labour-importers, with attendant issues of integrating new and culturally different immigrants. Integration is officially an issue only with reference to legal immigrants, however. The European Immigration and Asylum Pact, approved by the European Council in 2008, promotes the deportation of undocumented immigrants from Europe, discourages the ‘regularisation’ of those who entered the EU without
Copyright © 2009 John Wiley & Sons, Ltd. Popul. Space Place (2009) DOI: 10.1002/psp
Undocumented Immigrants to the US
papers, and encourages a strong effort to prevent their entry into Europe.
Bledsoe et al. (2007: 386), in discussing the plight of undocumented Gambians in Spain, noted that:
‘most Gambians who come to Spain are unskilled workers whose home country offers far less economic opportunity than Mexico. If, however, the case of African migrants in Spain mirrors that of Mexico/US borderland efforts to restrict immigrant numbers by making entry more difficult, the residence question increasingly hinges more on what is to lose by leaving Spain rather than on what is to gain by coming. The result in Spain, as in the US, may actually be an increase in the size of the immigrant population by lowering the rate of out-migration.’
If this should be the result of the European Union’s approach to migration, it will also increase the existence of permanent settlements of undocumented immigrants in Europe, perhaps especially in Spain and Italy, which will create new challenges with respect to integration into society. These challenges will, of course, be layered on top of those that already exist in a Europe that is undergoing a major ethnic transition as a result of immigration (Coleman, 2006; Bundeskanzleramt, 2006).
ACKNOWLEDGEMENTS
This research was supported by grant numberNCC13-00002 from the National Aeronauticsand Space Administration (Douglas A. Stow,Principal Investigator). The authors wish to thank Cristiando Giovando, Dimitris Polis, GreggVerutes and Steven Warmerdam for their assistance with various aspects of the research, andthey wish to acknowledge the assistance of theSan Diego Sector of the US Border Patrol. Gregory B. Weeks provided important feedback on anearlier version of this paper.
REFERENCES
Anguiano Tellez ME. 2003. Emigrantes Indocumentados y Deportados Residentes en el Estado de Mexico. Papeles de Poblacion 36: 133–161.
Astorga L. 1999. Drug Trafficking in Mexico: A First General Assessment. UNESCO, 1999 [cited 2007].
Available from http://www.unesco.org/most/ astorga.htm.
Bledsoe C, Houle R, Sow P. 2007. High fertility Gambians in low fertility Spain: the dynamics of child accumulation across transnational space. Demographic Research 16: 375–412.
Bundeskanzleramt. 2006. On integrating immigrants in Germany. Population and Development Review 32: 597–599.
Burt JE, Barber GM. 1996. Elementary Statistics for Geographers (2nd edn). Guilford Press: New York.
Castañeda J. 2007. Ex Mex: From Migrants to Immigrants. New Press: New York.
Castles S, Miller MJ. 2003. The Age of Migration (3rd edn). Guilford Press: New York.
Cohen J. 2005. The Culture of Migration in Southern Mexico. University of Texas Press: Austin, Texas.
Coleman D. 2006. Immigration and ethnic change in low-fertility countries: a third demographic transition. Population and Development Review 32: 401–446.
Cornelius WA. 2007. Introduction: does border enforcement deter unauthorized immigration? In Impacts of Border Enforcement on Mexican Migration: The View from Sending Communities, Cornelius WA, Lewis JM (eds). Center for Comparative Immigration Studies, UCSD: La Jolla, CA; 1–15.
Cornelius W, Borger S, Sawyer A, Keyes D, Appleby C, Parks K, Lozada G, Hicken J. 2008a. Controlling Unauthorized Immigration From Mexico: The Failure of ‘Prevention through Deterrence’ and the Need for Comprehensive Reform. UCSD Center for Comparative Immigration Studies: San Diego, CA.
Cornelius W, Fitzgerald D, Fischer PL (eds). 2008b. Mayan Journeys: The New Migration from Yucatán to the United States. Lynne Rienner Publishers: Boulder, CO.
Davis K. 1963. The theory of change and response in modern demographic history. Population Index 29: 345–366.
Donato KM, Patterson E. 2004. Women and men on the move: undocumented border crossing. In Crossing the Border: Research from the Mexican Migration Project, Durand J, Massey D (eds). Russell Sage Foundation: New York; 111–130.
Durand J, Massey DS, Zenteno RM. 2001. Mexican immigration to the United States: continuities and changes. Latin American Research Review 36: 107– 127.
Durand J, Massey DS. 2004. What we learned from the Mexican Migration Project. In Crossing the Border: Research from the Mexican Migration Project, Durand J, Massey D (eds). Russell Sage Foundation: New York; 1–16.
Fox J, Rivera-Salgado G. 2004. Building civil society among indigenous migrants. In Indigenous Mexican Migrants in the United States, Fox J, Rivera-Salgado
Copyright © 2009 John Wiley & Sons, Ltd. Popul. Space Place (2009) DOI: 10.1002/psp

G (eds). UCSD Center for US–Mexican Studies and UCSD Center for Comparative Immigration Studies: La Jolla, CA; 1–25.
Hoefer M, Rytina N, Baker BC. 2008. Estimates of the unauthorized immigrant population residing in the United States: January 2007. Population Estimates of the Department of Homeland Security. Available at http://www.dhs.gov/xlibrary/assets/statistics/ publications/ois_ill_pe_2007.pdf.
Levitch M. 2007. Cartels Lash Out at Mexican Crackdown on Drug Trafficking. Christian Science Monitor, May 16. Available at http://www.csmonitor.com/ 2007/0516/p99s01-duts.htm.
Marcelli EA, Cornelius WA. 2001. The changing profile of Mexican migrants to the United States: new evidence from California and Mexico. Latin American Research Review 36(3): 105–131.
Marks A. 2002. A harder look at visa overstayers. Christian Science Monitor, February 5.
Massey D. 1994. An evaluation of international migration theory: the North American case. Population and Development Review 20: 699–752.
Massey D, Arango J, Hugo G, Kouaouci A, Pellegrino A, Taylor JE. 1993. Theories of international migration: a review and appraisal. Population and Development Review 19: 431–466.
Massey D, Espinosa K. 1997. What’s driving Mexico– U.S. migration? A theoretical, empirical, and policy analysis. American Journal of Sociology 102: 939–999.
Massey DS, Durand J, Malone NJ. 2002. Beyond Smoke and Mirrors: Mexican Immigration in an Era of Economic Integration. Russell Sage Foundation: New York.
J. R. Weeks, J. Stoler and P. Jankowski
McDonald JH. 2005. The narcoeconomy and small-town, rural Mexico. Human Organization 64: 115– 125.
Mendoza Aguilar G. 2007. The ‘Cockroach Effect’: Narco-Violence Spreads in Mexico. New America Media 2007. Available at http://news.newamericamedia.org/ news/view_article.html.
Papail J. 2003. Migraciones Internacionales y Familias en Areas Urbanas del Centro Occidente de Mexico. Papeles de Poblacion 36: 109–131.
Partida Bush V, Angel Martinez Herrera M. 2006. Migracion interna. In La Situacion Demografica de Mexico 2006, C.N.d. Poblacion (ed.). CONAPO: Mexico City; 167–190.
Passel JS. 2006. Size and Characteristics of the Unauthorized Migrant Population in the U.S.: Estimates Based on the March 2005 Current Population Survey 2006 [cited 2008]. Available at http://pewhispanic.org/ reports/report.php?ReportID=61.
Pew Hispanic Center. 2006. Modes of Entry for the Unauthorized Migrant Population. Pew Hispanic Center: Washington, DC.
Valdez-Suiter E, Rosas-Lopez N, Pagaza N. 2007. Gender differences. In Impacts of Border Enforcement on Mexican Migration, Cornelius W, Lewis JM (eds). UCSD Center for Comparative Immigration Studies: La Jolla, CA; 97–115.
Velasco Ortiz L. 2007. Indigenous migrations to the cities of Mexico and Tijuana. Papeles de Poblacion 13: 166–190.
Weeks GB, Weeks JR. In press. Irresistible Forces: Latin American Migration to the United States. University of New Mexico Press: Albuquerque, NM.
Copyright © 2009 John Wiley & Sons, Ltd. Popul. Space Place (2009) DOI: 10.1002/psp