whole grain, fiber, and health david jacobs, phd professor of epidemiology, school of public health,...
TRANSCRIPT

Whole grain, fiber, and Whole grain, fiber, and healthhealth
David Jacobs, PhDDavid Jacobs, PhDProfessor of Epidemiology, School of Professor of Epidemiology, School of Public Health, University of MinnesotaPublic Health, University of Minnesota
Guest Professor, Department of Guest Professor, Department of Nutrition, University of OsloNutrition, University of Oslo
University of Class lecture September University of Class lecture September 23, 200523, 2005
University of Oslo, NorwayUniversity of Oslo, Norway

What is a whole cereal What is a whole cereal grain?grain?
Go to Fulcher slide showGo to Fulcher slide show

Fiber amounts in different Fiber amounts in different whole cereal grainswhole cereal grains
Fiber per 100 g of grain wheat 12 goats 10.6 grye 14.6 gcorn 7.3 gbrown rice 3.5 grefined wheat <2 gwhite rice <2 g

How can we tell whether How can we tell whether whole grain consumption is whole grain consumption is
good for health?good for health?
1.1. EpidemiologyEpidemiology1.1. Cross-sectionCross-section
2.2. Case-controlCase-control
3.3. ProspectiveProspective
4.4. Long term clinical trialLong term clinical trial
2.2. Feeding studyFeeding study

Overview of Study Design, Overview of Study Design, 11
• Cross-sectionCross-section– Everyone sampled at one timeEveryone sampled at one time– Can’t define whether exposure or Can’t define whether exposure or
disease comes first (temporality)disease comes first (temporality)– Any disease has already Any disease has already
happened, so disease can cause happened, so disease can cause changes in exposurechanges in exposure
– Effect measures: risk difference, Effect measures: risk difference, relative prevalencerelative prevalence
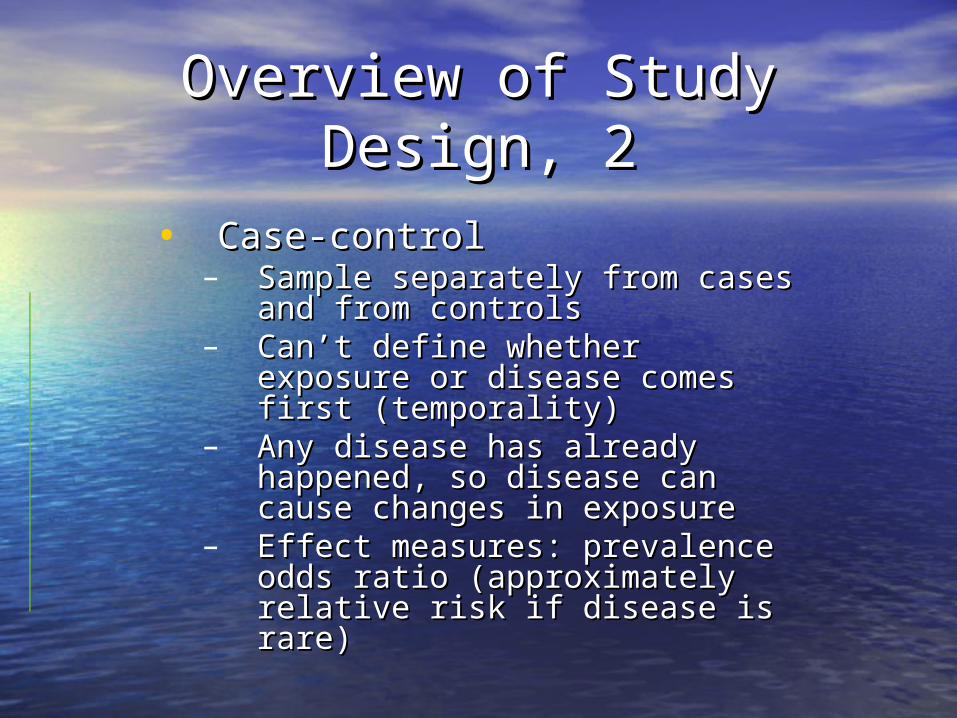
Overview of Study Design, Overview of Study Design, 22
• Case-controlCase-control– Sample separately from cases Sample separately from cases
and from controlsand from controls– Can’t define whether exposure or Can’t define whether exposure or
disease comes first (temporality)disease comes first (temporality)– Any disease has already Any disease has already
happened, so disease can cause happened, so disease can cause changes in exposurechanges in exposure
– Effect measures: prevalence odds Effect measures: prevalence odds ratio (approximately relative risk ratio (approximately relative risk if disease is rare)if disease is rare)

Overview of Study Design, Overview of Study Design, 33
• ProspectiveProspective– Cross-sectional sample excluding Cross-sectional sample excluding
prevalent diseaseprevalent disease– Exposure stated before disease is Exposure stated before disease is
known (temporality well-defined)known (temporality well-defined)– Disease has not happened, so it Disease has not happened, so it
can not cause changes in can not cause changes in exposureexposure
– As in cross-section and case-As in cross-section and case-control, level of nutritional control, level of nutritional exposure is naturally occurring exposure is naturally occurring and correlated with and correlated with demographics and other demographics and other behaviors behaviors
– Effect measures: risk difference Effect measures: risk difference or relative risk or relative hazard or relative risk or relative hazard (if time to event is considered)(if time to event is considered)

Overview of Study Design, Overview of Study Design, 44
• Long term clinical trialLong term clinical trial– Cross-sectional sample excluding Cross-sectional sample excluding
prevalent disease, randomly prevalent disease, randomly assigned to different nutritional assigned to different nutritional exposuresexposures
– Temporality well-definedTemporality well-defined– Assigned nutrition exposure Assigned nutrition exposure
uncorrelated with other factors, uncorrelated with other factors, but other nutrition exposures are but other nutrition exposures are naturally occurring and correlated naturally occurring and correlated with demographics and other with demographics and other behaviors behaviors
– Effect measures: risk difference Effect measures: risk difference or relative risk or relative hazard or relative risk or relative hazard (if time to event is considered)(if time to event is considered)

Overview of Study Design, Overview of Study Design, 55
• Long term clinical trial Long term clinical trial (continued)(continued)
– Very difficult to carry out Very difficult to carry out over yearsover years
– Successful examples include Successful examples include Lyon Diet Heart Study and Lyon Diet Heart Study and PREDIMED (in recruitment PREDIMED (in recruitment phase)phase)

Overview of Study Design, Overview of Study Design, 66
• Feeding studyFeeding study– Short term (hours, days or Short term (hours, days or
weeks)weeks)– Exposure assigned randomlyExposure assigned randomly– All food provided or All food provided or
supplemental food only supplemental food only providedprovided
– Excellent for study short Excellent for study short term effects such as changes term effects such as changes in body weight or plasma in body weight or plasma insulin (disease insulin (disease intermediaries)intermediaries)

How do we know what people How do we know what people are eating?are eating?
• EpidemiologyEpidemiology– Ask questions about dietAsk questions about diet
• Short term recall (detailed, not Short term recall (detailed, not representative of long term)representative of long term)
• Long term frequency (intuitive, Long term frequency (intuitive, less detailed, representative, less detailed, representative, guess work)guess work)
• Study what people actually eatStudy what people actually eat
• FeedingFeeding– Provide all or some foodProvide all or some food– Study what the researcher is Study what the researcher is
interested ininterested in

Common epidemiologic Common epidemiologic representations of whole representations of whole
graingrain
• Dark breadDark bread• Brown breadBrown bread• Whole wheat breadWhole wheat bread• Brown riceBrown rice• Usual breakfast cerealUsual breakfast cereal• Hot cerealHot cereal• Must ask about food in terms Must ask about food in terms
the participant understands, so the participant understands, so if whole grain is not if whole grain is not understood, the participant understood, the participant can’t tell you about itcan’t tell you about it

Norwegian example using Norwegian example using breadbread
(1) how many slices of bread do you usually eat per day? (<2 slices per day; 2 ± 4; 5 ± 6; 7 ± 8; 9 ± 12; 13+)
(2) what kind of bread do you eat most often? (store bought; home-baked)
(3) If you buy, what type most often? (white bread, fine or light bread, whole grain or dark bread)
(4) If you bake at home, what proportion of the flour is whole grain (dark)? (don't use whole grain flour; <1/4 whole grain flour; 1/4- 1/2 whole grain flour; more than 1/2 whole grain flour).
Based on a 24 hour recall, store bought whole grain bread was overestimated and used a recipe with less whole grain
Whole grain bread score: the number of slices of bread eaten per day times the proportion of whole grain flour.
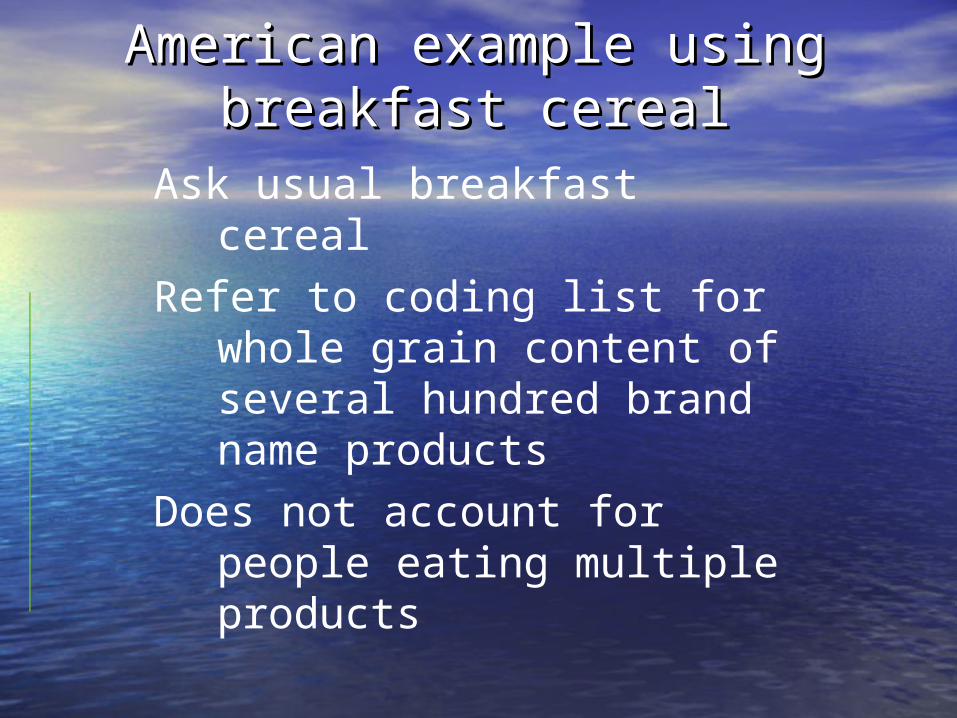
American example using American example using breakfast cerealbreakfast cereal
Ask usual breakfast cerealRefer to coding list for whole
grain content of several hundred brand name products
Does not account for people eating multiple products

American example using American example using breadbread
The term whole grain bread is not well known and is confused with organic (which is irrelevant) and multigrain (which be all refined)
Dark bread in US and brown bread in UK identify most whole grain breads, but misclassifies breads containing dark color, such as molasses

Whole grain and cancer: case-Whole grain and cancer: case-control experiencecontrol experience
Chatenoud L, Tavani A, La Vecchia C, Jacobs DR Jr, Negri E, Levi F, Franceschi S.
Whole grain food intake and Whole grain food intake and cancer risk. Int J Cancer. 1998 cancer risk. Int J Cancer. 1998 Jul 3;77(1):24-8. Jul 3;77(1):24-8.
Jacobs DR Jr, Marquart L, Slavin J, Kushi LH.
Whole-grain intake and Whole-grain intake and cancer: an expanded review cancer: an expanded review and meta-analysis. Nutr and meta-analysis. Nutr Cancer. 1998;30(2):85-96. Cancer. 1998;30(2):85-96. Review. Review.

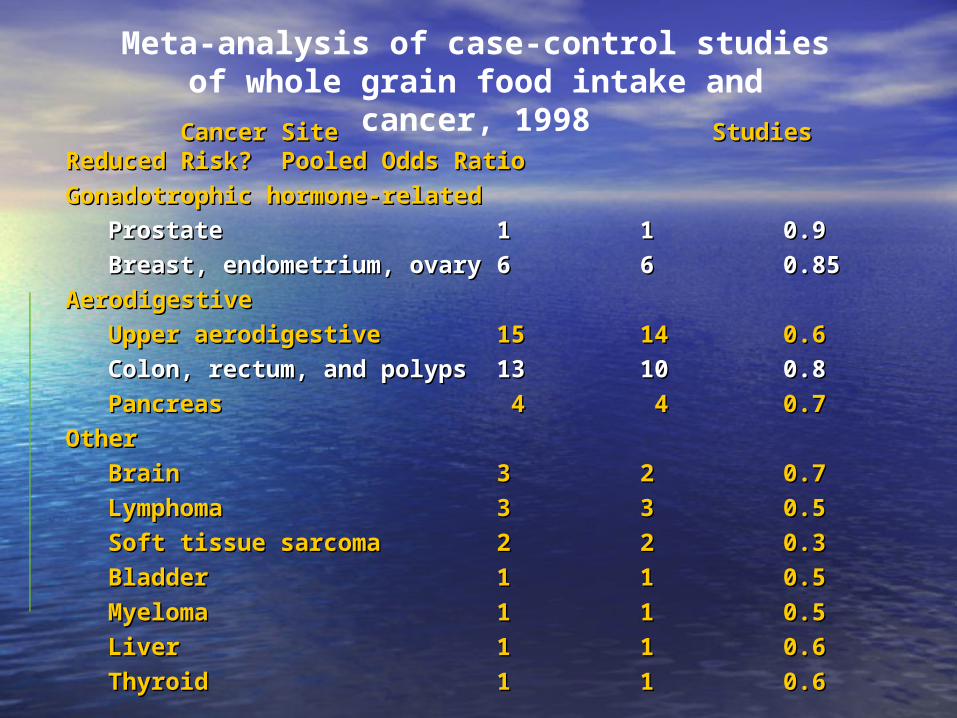
Cancer Site Studies Reduced Risk? Pooled Odds Cancer Site Studies Reduced Risk? Pooled Odds RatioRatio
Gonadotrophic hormone-relatedGonadotrophic hormone-related
ProstateProstate 11 11 0.90.9
Breast, endometrium, ovaryBreast, endometrium, ovary 66 66 0.850.85
AerodigestiveAerodigestive
Upper aerodigestiveUpper aerodigestive 1515 1414 0.60.6
Colon, rectum, and polypsColon, rectum, and polyps 1313 1010 0.80.8
PancreasPancreas 4 4 4 4 0.70.7
OtherOther
BrainBrain 33 22 0.70.7
LymphomaLymphoma 33 33 0.50.5
Soft tissue sarcomaSoft tissue sarcoma 22 22 0.30.3
BladderBladder 11 11 0.50.5
MyelomaMyeloma 11 11 0.50.5
LiverLiver 11 11 0.60.6
ThyroidThyroid 11 11 0.60.6
Meta-analysis of case-control studies of whole grain food intake and cancer, 1998

Whole grain and heart Whole grain and heart disease/type 2 diabetes: disease/type 2 diabetes:
prospective study experienceprospective study experience
Jacobs DR Jr, Gallaher DD. Whole grain intake and Whole grain intake and cardiovascular disease: a cardiovascular disease: a review. Curr Atheroscler review. Curr Atheroscler Rep. 2004 Nov;6(6):415-Rep. 2004 Nov;6(6):415-23. Review. 23. Review.
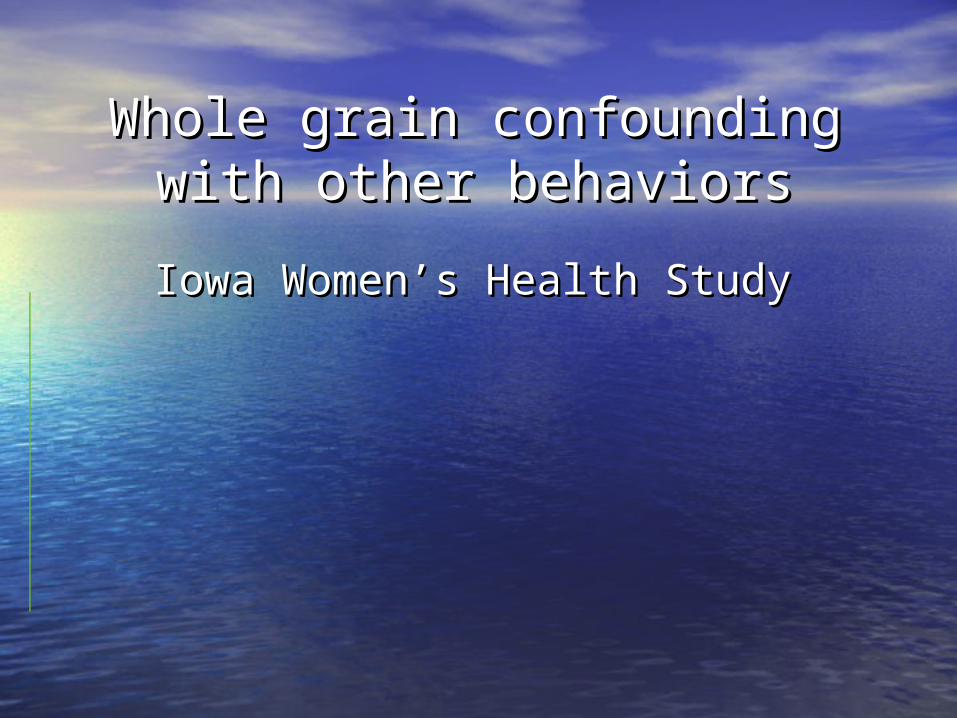
Whole grain confounding with Whole grain confounding with other behaviorsother behaviors
Iowa Women’s Health StudyIowa Women’s Health Study

34,492 postmenopausal Iowa women, 1986; levels adjusted for age and energy intake
Whole grain intake Refined grain intake Quintile Quintile Quintile Quintile 1 5 1 5
Health BehaviorsCurrent smoker, % 24.7 12.1 16.0 17.1Vitamin supplement use, % 53.7 68.7 70.9 54.4Physical activity
% engaging in regular activity 30.3 45.5 49.5 30.0Hormone replacement therapy
% ever 34.0 42.6 40.4 34.7

34,492 postmenopausal Iowa women, 1986; levels adjusted for age and energy intake
Whole Grain Refined Grain Quintile Quintile Quintile Quintile
1 5 1 5 Other Aspects of DietFruits and vegetables, no juice
mean, servings/week 34.1 39.9 45.5 28.6Red meat, mean, servings/week 6.6 5.1 6.0 5.4
Keys score, mean, mg/dl 45.7 38.9 42.8 41.0Sucrose, mean, g/day 42.2 38.8 37.6 47.3
Constituent NutrientsDietary fiber, mean, g/day 16.3 22.3 21.7 17.1
Vitamin E, mean, IU/day 8.9 10.1 10.2 9.0
Folate, mean, µg/day 270.7 332.3 342.1 264.7

Whole grain and cancer – Whole grain and cancer – Norwegian and Iowa Norwegian and Iowa prospective studiesprospective studies
Unpublished talk give in Montreal, American Association of Cereal Chemists, 2002
Findings much less clear than in case-control studies
Same questions and design as for heart disease and diabetes

Iowa Women’s Health Study:Iowa Women’s Health Study:Fiber in 2 groups with similar total Fiber in 2 groups with similar total grain fibergrain fiber
71% grain fiber from whole
grain
3.6 - 6 g / 2000 kcal whole fiber
<3.6 g / 2000 kcal refined fiber
77% grain fiber from refined
grain
<3.6 g / 2000 kcal whole fiber
3.6 g / 2000 kcal refined fiber
Sample size 7481 3559
Whole grain fiber 4.7 ± 0.7 1.3 ± 1.0
Refined grain
fiber
1.9 ± 0.8 4.5 ± 0.9
Total grain fiber 6.6 ± 1.0 5.8 ± 1.2
Total dietary
fiber
23.3 ± 5.3 19.2 ± 4.5
Jacobs DR, Pereira MA, Meyer KA, Kushi LH. J Amer Col Nutr Jacobs DR, Pereira MA, Meyer KA, Kushi LH. J Amer Col Nutr 20002000

Hazard Rate Ratio (95% CI) in 71% whole grain fiber
eaters relative to 77% refined grain fiber eaters
Total mortality 0.83 (0.73, 0.94)
Coronary heart disease 0.89 (0.66,1.20)
All cancer 0.92 (0.75,1.12)
All other mortality 0.83 (0.71, 0.97)
Iowa Women’s Health Study:Iowa Women’s Health Study:11-year relative risk of mortality in 11040 11-year relative risk of mortality in 11040 women: cereal fiber in itself does not women: cereal fiber in itself does not predict deathpredict death

Which direction from here? Which direction from here? Problems with whole grain Problems with whole grain
theory, 1theory, 1
• Supported by selected Supported by selected feeding and supplement feeding and supplement studiesstudies
• ReliabilityReliability• ValidityValidity• Residual confoundingResidual confounding• A synergy model is A synergy model is
consistent with the consistent with the complexity of biologycomplexity of biology
• In vitro studies also In vitro studies also suggest synergysuggest synergy

Which direction from here? Which direction from here? Problems with whole grain Problems with whole grain
theory, 2theory, 2• Fiber not the whole answerFiber not the whole answer• Myriad phytochemicals coexist with Myriad phytochemicals coexist with
fiber in all plant foodsfiber in all plant foods• These include enzymes, pesticides, These include enzymes, pesticides,
antioxidant defense, signal antioxidant defense, signal transducers transducers
• Though the nutrient model has Though the nutrient model has some value, it seems more helpful some value, it seems more helpful to think of foods and food to think of foods and food combinations than of nutrients.combinations than of nutrients.
• Other plant foods are broadly Other plant foods are broadly similar – fruit, vegetables, nut, similar – fruit, vegetables, nut, legumes, spiceslegumes, spices
• Plant-based food patterns are more Plant-based food patterns are more reliably ascertained reliably ascertained epidemiologically and less prone to epidemiologically and less prone to dietary confounding, inverse to dietary confounding, inverse to many chronic diseasesmany chronic diseases

Nutrients vs FoodsNutrients vs Foods
Fiber is probably not as active as Fiber is probably not as active as its accompanying its accompanying phytochemicalsphytochemicals
The value of carbohydrate The value of carbohydrate depends on whether it is fiber depends on whether it is fiber rich (with accompanying rich (with accompanying phytochemicals) or fiber poorphytochemicals) or fiber poor
The value of fat depends on The value of fat depends on saturation and location of the saturation and location of the double bond if unsaturateddouble bond if unsaturated

Some single nutrient Some single nutrient conditionsconditions•A single nutrient deficiency disease would be A single nutrient deficiency disease would be alleviated by introduction of an isolated alleviated by introduction of an isolated nutrient in the form of a supplementnutrient in the form of a supplement
– Scurvy and vitamin CScurvy and vitamin C– Pellagra, beri-beri and B-vitaminsPellagra, beri-beri and B-vitamins– Rickets and vitamin DRickets and vitamin D– Neural tube defects and folateNeural tube defects and folate– Trans fatty acids, increased cholesterol and Trans fatty acids, increased cholesterol and
coronary heart diseasecoronary heart disease– Hypertension and saltHypertension and salt

Nutrition in the etiology of Nutrition in the etiology of diseasedisease•Focus on food and the synergy of its Focus on food and the synergy of its components may be a method for better components may be a method for better understanding nutrition and disease etiologyunderstanding nutrition and disease etiology
– Reductionism looks for simple, biochemically-based Reductionism looks for simple, biochemically-based associationsassociations
– Some diseases are the result of deficiency or excess Some diseases are the result of deficiency or excess of single nutrientsof single nutrients
– Food synergy is defined as additive or more than Food synergy is defined as additive or more than additive influences of foods and food constituents additive influences of foods and food constituents on healthon health
– Chronic diseases such as atherosclerosis, ischemic Chronic diseases such as atherosclerosis, ischemic heart disease, and cancers, are complex with heart disease, and cancers, are complex with multiple etiologies and not simple deficienciesmultiple etiologies and not simple deficiencies

The food synergy The food synergy approachapproachA hierarchical structure of dietary patterns, foods, and nutrients for
study of food synergy. “Top down” research begins with the higher levels, searching for combinations of foods and their constituents that influence health“Bottom up” research begins at the lowest level, searching for individual constituents that influence health.
Food synergy levelFood synergy levelExamples of dietary component at each synergy levelExamples of dietary component at each synergy level
Level 5: Dietary Level 5: Dietary patternpattern
‘‘Prudent diet’, ‘Western diet’, other combinations of Prudent diet’, ‘Western diet’, other combinations of food groupsfood groups
Level 4: Food Level 4: Food groupsgroups
Whole grain, dairy, fruit, vegetables, meatWhole grain, dairy, fruit, vegetables, meat
Level 3: Whole Level 3: Whole graingrain
Whole wheat, brown rice, rolled oatsWhole wheat, brown rice, rolled oats
Level 2: Whole Level 2: Whole wheatwheat
Bran, germ, endosperm; extract of fat soluble portionBran, germ, endosperm; extract of fat soluble portion
Level 1: Bran or a Level 1: Bran or a single phytochemicalsingle phytochemical
Specific nutrients or phytochemicalsSpecific nutrients or phytochemicals

Maximize nutritional value per Maximize nutritional value per bitebite
• We are increasingly We are increasingly inactiveinactive
– We are getting fat from We are getting fat from positive energy balancepositive energy balance
– Even so, energy intake is Even so, energy intake is less than it used to beless than it used to be
– We cannot afford to waste We cannot afford to waste bites eaten food with low bites eaten food with low nutritional value, such as nutritional value, such as nutrient-poor carbohydratenutrient-poor carbohydrate
– Eat a varied diet rich in plant Eat a varied diet rich in plant foodsfoods