whole-body plethysmography - bcrt.cabcrt.ca/wp-content/uploads/2010/09/bodypleth.pdf · the...
TRANSCRIPT
CHAPTER 2
Whole-body plethysmography
M.D. Goldman*, H.J. Smith#, W.T. Ulmer}
*David Geffen School of Medicine, University of California, Los Angeles, USA. #Research in RespiratoryDiagnostics, Berlin, Germany. }Research in Lung Function, Bochum, Germany.
Correspondence: M.D. Goldman, David Geffen School of Medicine, University of California, Los Angeles,USA.
The word plethysmograph is derived from the Greek plethusmos (enlargement), and isrelated closely to plethus (fullness) and plethora (fullness). Indeed, the fundamentalfunction of a whole-body plethysmograph is the measurement of intrathoracic gasvolume (TGV) and volume change. Whole-body plethysmographs have been used tomeasure changes in lung volume over a range of volumes, from the scale of millilitres tolitres. Early reports of whole-body plethysmography to determine thoracic gas volume(TGV) [1] and airway resistance (Raw) [2] measured volume changes of the order ofmillilitres, in terms of associated changes in plethysmograph and alveolar pressures (Pa),using the constant-volume variable-pressure plethysmograph. Changes in lung volumeduring compression and decompression of thoracic gas were measured while the subjectbreathed entirely within the plethysmograph.
An alternative volume-displacement whole-body plethysmograph measured volumechanges of the thorax directly, including both changes in volume of gas flowing into andout of the lung and simultaneous changes in compression and decompression of thoracicgas [3]. In contrast to the constant-volume plethysmograph of DuBois et al. [1], subjectsbreathed in and out across the wall of the volume-displacement plethysmographdeveloped by Mead [3]. The volume-displacement plethysmograph provided more readyassessment of changes in TGV during extended manoeuvres such as the vital capacity(VC). During such forced manoeuvres, lung volume changes due to compression ofthoracic gas were measured, in addition to those associated with gas flow out of the lung.
Subsequent technological developments permitted a combination of the twoapproaches by using a pressure-compensated volume-displacement or integrated-flow,plethysmograph, described by the groups of Mead and van de Woestijne [4–7], andreviewed by Peslin [8] and Coates et al. [9]. In the combination plethysmograph, thesubjects breathe either across the wall of the plethysmograph to the outside to measuretotal thoracic displacements or within the plethysmograph to measure compressionvolumes only, excluding air flow into or out of the lung. In this combinationplethysmograph, both pressure change in the plethysmograph and the volume displacedthrough the plethysmograph wall are combined to provide a measure of the volumedisplacements of the thorax. This approach provides the advantageous frequencyresponse of the pressure plethysmograph with the ability to measure volumedisplacements over a very wide range of volumes. This approach is now commonlyreferred to as a "transmural" plethysmograph.
Current technological improvements in whole-body plethysmography providemeasurable variables that are less dependent on patient cooperation than in initialimplementations [1, 2]. Recent advances in the understanding of chronic obstructivepulmonary disease (COPD) have led to renewed interest in the evaluation of compression
Eur Respir Mon, 2005, 31, 15–43. Printed in UK - all rights reserved. Copyright ERS Journals Ltd 2005.
15

of TGV as an aid to better understanding of dynamic events during the respiratory cycle.Therefore, applications of plethysmographic techniques that include thoracic volumedisplacements are reviewed as well in this Chapter. However, this Chapter focusesprimarily on the use of the variable-pressure constant-volume plethysmograph, as thisinstrument has been in use most commonly in clinical pulmonary function testing. Theclinical measurements of Raw and functional residual capacity (FRC) determined bywhole-body plethysmography (FRCpleth) are most extensively discussed herein.
Principles of whole-body plethysmography
The whole-body plethysmograph consists of a rigid chamber, of comparable size andshape to an enclosed telephone booth, in which the subject sits while breathing through apneumotachograph. Pressure transducers of different sensitivity are arranged to measurethe pressure across the pneumotachograph (flow), the pressure difference across the wallof the plethysmograph and pressure at the airway opening. The fundamental principle ofthe variable-pressure plethysmograph is that changes in PA may be inferred fromchanges in plethysmograph pressure. This is achieved by the process describedimmediately below.
A shutter mechanism is positioned close to the mouth in the plethysmograph. Thisshutter may be closed to provide transient airway occlusion. Voluntary respiratoryefforts are performed against the closed shutter, during which the change in PA (DPA), isestimated by recording the change in mouth pressure (DPm). Pm (PA) is plotted againstsimultaneous plethysmographic pressure changes during respiratory efforts against aclosed shutter to measure absolute TGV. The same relationship between alveolar andplethysmographic pressure measured during respiratory efforts against a closed shutter isthen extended to dynamic events during free breathing to measure Raw, wherein airflow isrelated to PA.
Types of plethysmograph
Three different types of whole-body plethysmograph may be used to measure changes inthoracic volume. These depend on whether the aim is to measure the large volume changesassociated with respiratory manoeuvres, such as the VC, or just those which accompanycompression and decompression of the gas in the lungs exclusive of changes in volume dueto gas flow in and out of the lungs. Suitable changes in transducer sensitivities andmechanical arrangement are incorporated into the different types of plethysmograph.
The constant-volume or variable-pressure plethysmograph is used to measure smallvolume changes due to compression and decompression of gas within the lungs.
The constant-pressure or volume-displacement plethysmograph is used to measurelarge changes in lung volume associated with gas flow into and out of the lungs.
The pressure-corrected variable-volume plethysmograph combines the advantages ofboth the plethysmographs described above. The sensitivity and rapid frequency responseof variable-pressure constant-volume plethysmography is provided along with the abilityto measure large slow volume changes in the lungs during breathing.
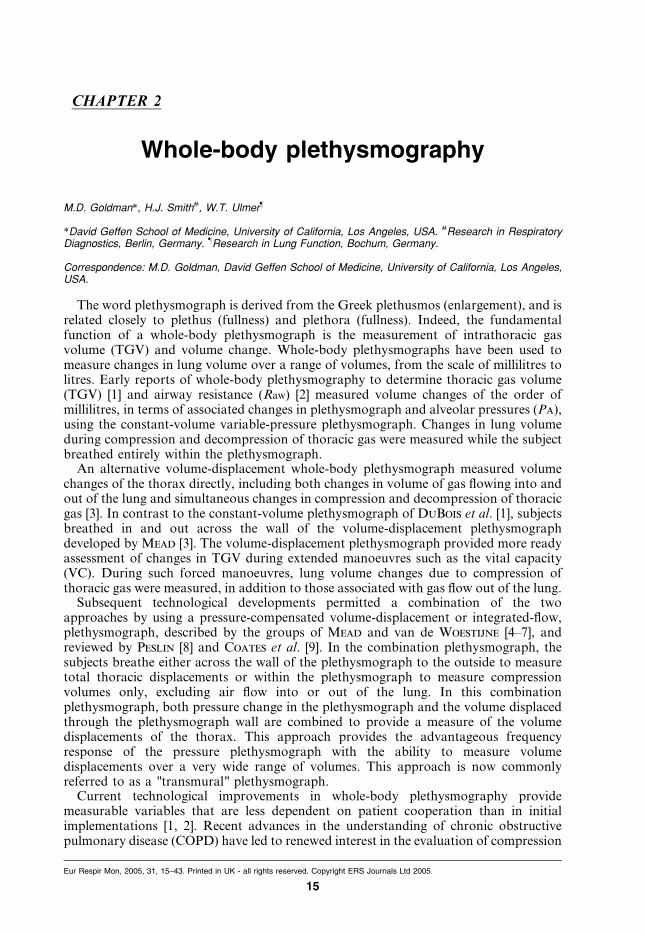
Variable-pressure plethysmograph. The advantage of the variable pressure plethys-mograph is simplicity of hardware components and accuracy of the measurement. Thesmall changes in plethysmographic pressure associated with compression/decompressionof TGV are recorded using a very sensitive pressure transducer, as shown schematically infigure 1.
M.D. GOLDMAN ET AL.
16
The plethysmograph is open to the atmosphere via a small leak with a mechanical timeconstant of 5–25 s, with most current instruments using a value v10 s. This controlledleak minimises slowly occurring pressure changes that are not related to respiratorymanoeuvres, such as thermal drift (heating) caused by the presence of a subject breathingwithin the chamber.
The large volume of the plethysmograph chamber (600–1,000 L) undergoes very smallpressure changes during compression and decompression of TGV. Accordingly, theplethysmographic pressure transducer must be very sensitive and stable. It is stabilisedagainst changes in room air pressure during such events as opening or closing of a doorby connection of the other side of the plethysmographic pressure transducer to areference chamber with comparable time-constant to that of the plethysmograph.
In practice, the plethysmographic pressure transducer is calibrated in terms of changesin TGV. This is done by quickly introducing and withdrawing 30–50 mL air into theplethysmograph using a motor-driven syringe, to simulate the changes in TGV that occurduring decompression and compression of thoracic gas. After such calibration, themeasured changes in plethysmographic gas pressure reflect the change in TGV due tocompression and decompression of thoracic gas. Changes in calibrated plethysmographicgas pressure are recorded in terms of volume change (DV), and known as shift volume.Shift volume is the change in TGV due only to compression or decompression, exclusiveof changes due to airflow into and out of the lung, both during occluded respiratoryefforts and during breathing within the plethysmograph. Since calibration of theplethysmograph is normally carried out without a subject in the plethysmograph, thiscalibration must be corrected for the subject’s body volume. Therefore, the body weightof the subject is entered prior to any testing of the subject and is used in the calculation ofthe final calibration coefficient.
Volume-displacement plethysmograph. A volume-displacement plethysmographmeasures volume changes of the thorax directly. Subjects breathe in and out across
Fig. 1. – Schematic representation of a variable-pressure constant-volume plethysmograph, illustrating thecontrolled mechanical leak to room air and reference chamber. The subject breathes through a pneumotachy-graph, entirely within the chamber. Recording of the volume displacements of the thorax is limited to thoserelated to compression and decompression of thoracic gas. Calibration of plethysmographic pressure is done viaa motorised syringe inserting and withdrawing 30–50 mL of air into the plethysmograph chamber at a frequencyof approximately 1 Hz. PA: alveolar pressure; Pm: mouth pressure; VL: lung volume; Raw: airway resistance;TGV: thoracic gas volume; DV: change in volume; DP: change in pressure. See text for discussion.
WHOLE-BODY PLETHYSMOGRAPHY
17
the wall of the plethysmograph to room air. The increase in lung volume that occursduring inspiration includes the volume of gas inspired plus the additional volumeassociated with decompression of TGV resulting from the fall in intrathoracic pressurenecessary to provide a gradient for inspiratory airflow.
The advantage of the volume-displacement plethysmograph is the ability to measurerespiratory manoeuvres such as the slow or forced vital capacity (FVC). Integratedairflow at the mouth can be compared to thoracic volume displacements during forcedexpiration to provide more physiological information in subjects with hyperinflation orairway obstruction.
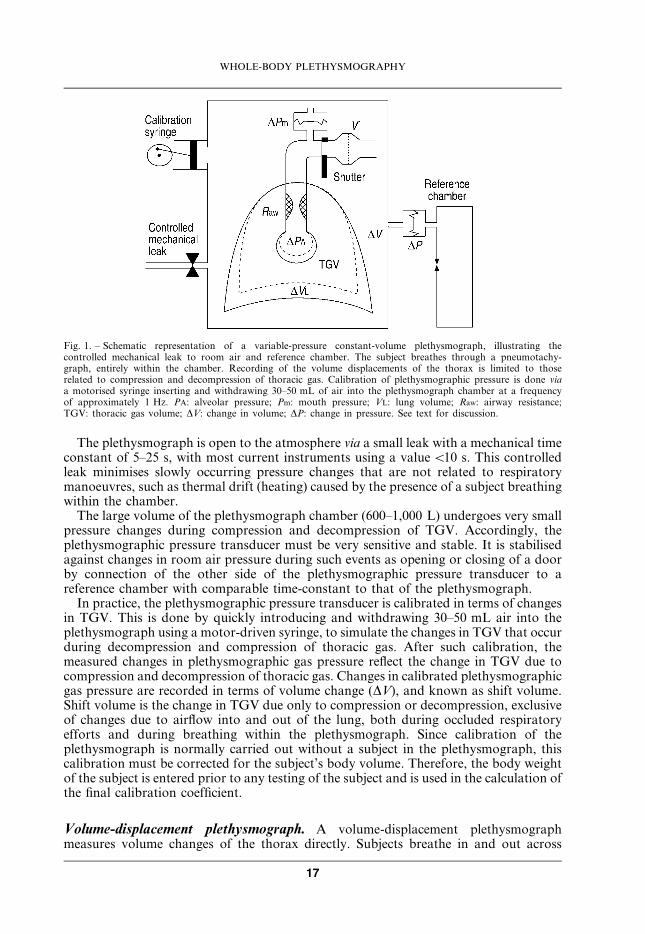
Measurement of total thoracic volume displacement is useful, but the original plethys-mograph describedby Mead [3] requireda verysensitive and criticallydampeddirect-readingspirometer, which was technically very demanding to build. Therefore, this construction hasbeen supplanted by the pressure-corrected integrated-flow plethysmograph [6–9].
Flow plethysmograph. Comroe et al. [10] pointed out that use of a spirometer connectedto a volume-displacement plethysmograph chamber made it difficult to obtain adequatespeed of response. Frequency response was improved by adding a signal proportional toplethysmograph pressure to the volume-displacement signal and, subsequently,substituting a pneumotachograph in the wall of the plethysmograph for thespirometer bell [4–6]. Such a pressure-corrected plethysmograph which integrates flowthrough the plethysmograph wall permits accurate measurement of changes in TGVduring forced expiration manoeuvres. Loss of sensitivity with small thoracic volumedisplacements and possible zero-flow integrator drift are limitations of this approachwhen measuring TGV; but occlusion of the pneumotachograph in the wall of theplethysmograph converts the flow plethysmograph back into a variable-pressureplethysmograph, allowing more sensitive measurements of TGV. The flow plethys-mograph is shown schematically in figure 2.
Some pressure change in plethysmograph air is required to cause movement of air in
Fig. 2. – Schematic representation of a pressure-corrected integrated-flow plethysmograph, illustrating the path ofthe subject’s breathing through the wall of the plethysmograph to room air. Recording of the volumedisplacements of the thorax includes those due to airflow into and out from the lung, as well as those due tocompression and decompression. Volume displacements of the thorax drive plethysmograph air through apneumotachygraph in the wall of the plethysmograph, and are recorded by integration of the flow through theplethysmograph wall. PA: alveolar pressure; Pm: mouth pressure; VL: lung volume; Raw: airway resistance; TGV:thoracic gas volume; DV: change in volume; DP: change in pressure. See text for further discussion.
M.D. GOLDMAN ET AL.
18
and out of the plethysmograph chamber. This pressure change occurs in the large volumeof compressible gas within the plethysmograph chamber. Thus, part of the volumedisplacement is temporarily "lost" in compression or decompression of plethysmographicair and does not reach its equilibrium value until plethysmographic air pressure hasreturned to atmospheric, as noted by Mead [3]. This volume displacement is "found"within the pressure change of plethysmographic air itself. Thus, as the subject breathesroom air through a tube across the wall of the plethysmograph, changes in TGV expandor compress plethysmographic air, and simultaneously displace some air in or out of theplethysmograph across the flow meter in its wall. The volume displaced by compressionor decompression of plethysmograpic air is recovered by adding an electrical signalproportional to plethysmographic pressure to the measured volume displaced across theplethysmograph wall in the "pressure-corrected" body plethysmograph [4–7]. Becausethis volume displacement is most commonly recorded by integrating flow through a flowmeter in the plethysmograph wall, this type of plethysmograph is often described as apressure-corrected integrated-flow plethysmograph. It should be emphasised that in thisuse, the integrated flow is the flow in and out across the wall of the plethysmographchamber, in contrast to the integrated airflow in and out of the mouth described for thepressure plethysmograph [2].
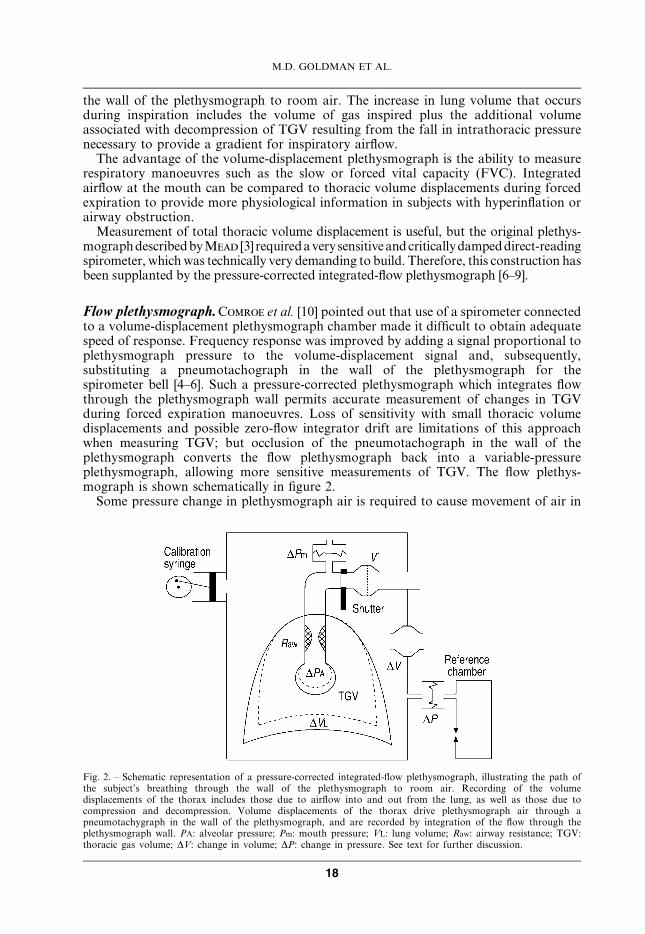
The measurement of a rapid volume change, such as that encountered during a briefcough or the initial part of a forced expiratory VC utilises the "pressure-correction"shown schematically in figure 3 which is modified from Leith and Mead [7]. Figure 3shows schematically the initial rapid decrease in TGV during a forced expiration. Thetrace labelled a) represents an idealised trace of the true volume change for the initialrapid decrease in lung volume, shown as the onset of a square wave. At the onset of thisabrupt decrease in TGV, plethysmographic pressure falls rapidly with compression ofthoracic lung volume and expansion of plethysmographic air by expiratory muscle effort,then exponentially returns to its initial value, after the volume event is complete (e.g. abrief cough). This pressure change is shown in trace b). The signal from a linearflowmeter in the wall of the plethysmograph is identical in shape to trace b). Integrationof this flow signal is shown in trace c). Integrated flow across the plethysmograph wall
�
��
��
��
��
������ ������
��
����
�����������
������
������� ������
�����
������
�
�Fig. 3. – Schematic representation of the basis of "pressure-correction" to account for phase lag between volumedisplacements of the thorax and those of plethysmograph air through the pneumotachygraph in theplethysmograph wall. Ppleth: pressure in the plethysmograph chamber; V9pleth: flow across wall of chamber. Seetext for discussion.
WHOLE-BODY PLETHYSMOGRAPHY
19
eventually reaches the same level as the true decrease in TGV, but the volume changerecorded by integrated flow across the plethysmograph wall is slower because of thetemporary "loss" of volume during the initial decrease in plethysmographic air pressure.To recover this contribution, an electrical signal proportional to trace b) is added to theintegrated plethysmograph flow in trace c). The sum of these contributions recovers theinitial true volume event represented by the solid trace d).
Pressure-corrected integrated-flow plethysmographs provide sensitive recordings ofpressure and volume events over a wide range of volume displacements. They permitaccurate recording of maximal expiratory flow-volume curves in addition to measure-ment of TGV, specific airway resistance (sRaw) and Raw with the same instrument. Thus,this approach provides the advantageous frequency response and sensitivity of thevariable-pressure plethysmograph with additional lung volume displacement recordingsover a wide range of volumes, and has been used for measures of true TGV change(including that due to compression of thoracic gas) during either tidal breathing [11] ormeasurement of the FVC [12]. This combined approach is now commonly referred to as a"transmural" plethysmograph. It permits evaluation of the differences between thoracicgas compression and airway closure, the so-called "trapped gas" [13].
Measurement notes
Applications of whole-body plethysmography include physiological evaluation ofrespiratory mechanical limitations and diagnostic clinical testing. Special applicationsinclude paediatric and infant diagnostic testing, which have been extensively discussed byothers [9, 14]. The present chapter is restricted to plethysmographic measurements inlarger children and adults. While spirometry is the most commonly used pulmonaryfunctional diagnostic test, body plethysmography provides essential additionaldiagnostic information [15, 16], and usefully includes measurement of both slow andforced vital capacities done in the plethysmograph.
After the subject has entered the plethysmograph, the door is closed with an airtightseal. Approximately 2 min are required for plethysmograph cabin pressure to equilibratewhile air in the cabin is warmed and humidified by the subject breathing at rest. Duringthis initial period, the plethysmograph cabin is vented periodically to room air via asolenoid-operated valve. After about 2 min, pressure drift with the valve closed is muchdecreased and does not interfere with the measurement of sRaw. At this time the subject isasked to close his/her lips tightly around the mouthpiece and breathe normally throughthe pneumotachygraph. The patient sits erect with head and neck in a neutral posture. Anose-clip is applied to close the nares. The subject is allowed to adapt to the measurementconditions and breathe regularly through the flowmeter for about 30 s before testing isinitiated.
A complete whole-body plethysmography, measurement is commonly divided intothree standardised measuring sequences whose order may be defined by diagnosticrequirements. sRaw is usually measured first, followed by measurement of TGV andconcluding with measurement of the entire range of lung volumes, both slow and forcedspirometry. Individual measurement phases can be skipped or repeated, depending onthe diagnostic information required and/or the patient’s ability to cooperate. The initialreport of whole-body plethysmography first described its application to measure TGV [1]and the description that follows below begins with determination of TGV. Themeasurement of lung volumes by plethysmography is extensively reviewed by Coates
et al. [9] along with detailed discussions of physiological assumptions and technicaldemands of measuring instruments.
M.D. GOLDMAN ET AL.
20

Determination of thoracic gas volume and functional residual capacity
As befits the etymology of body plethysmography, its primary use to measure TGVis considered first. It is noted that while this order corresponds didactically to thehistorical development of plethysmography and previous literature, in practice, currentcomputer-assisted plethysmographic techniques commonly measure specific resistancefirst.
Measurement of TGV is done in the variable-pressure constant-volume plethysmo-graph by making use of Boyle-Mariotte’s law which relates pressure and volume changesto each other under isothermal conditions. Thus, during compression of thoracic gas, itspressure rises and, at constant temperature, the product of pressure and volume remainsconstant. In the plethysmograph, voluntary respiratory efforts are used to producechanges in alveolar dry gas pressure, DPA, which are associated with reciprocal changesin TGV, DV. Alveolar dry gas pressure (PA) itself is the difference between ambientbarometric pressure (Pbar) and saturated water vapour pressure at body temperature(PH2O,sat), when the glottis is open with no airflow. A shutter mechanism positioned closeto the mouth provides for transient controlled airway occlusion, which is utilised inmaking voluntary respiratory efforts to determine the relationship between plethysmo-graphic pressure and Pm. During these respiratory efforts against the closed shutter,TGV is decompressed and compressed respectively. Because the total amount of gas inthe plethysmograph–lung system is constant, DV causes corresponding changes inplethysmographic gas pressure during compression and decompression of thoracic gas.The change in plethysmographic pressure is then measured in terms of the change inTGV, DV, and denoted shift volume.
With the glottis maintained open, the change in PA during respiratory efforts against aclosed shutter may be measured by recording the change in Pm. In normal subjects, thechange in Pm closely approximates that in PA during panting efforts [1]. However, theassumption that change in PA can be measured accurately by Pm during panting effortsagainst a closed shutter in patients with airflow obstruction has been questioned. Severalgroups have reported significant differences between changes in oesophageal pressureand Pm during panting efforts against a closed shutter in subjects with airflowobstruction [17–22]. This is discussed more extensively in the sections below:Pathophysiological manifestations and Measurement of thoracic gas volume.
When only slow (1 Hz) panting efforts against a closed shutter are utilised [17–22], it ispossible to measure changes in PA from Pm. Pm (PA) pressure is plotted againstsimultaneous plethysmographic pressure changes (measured as the shift volume) duringrespiratory efforts against a closed shutter to measure absolute TGV.
The measurement of TGV is summarised by the following equations, for small changesin pressure and volume.
Boyle~Mariotte0s Law : P:V~constant under isothermal conditions ð1ÞDuring airway occlusion, usually at resting end-expiration, the following equationsdescribe TGV and PA. The inspiratory or expiratory effort against the closed shutterwill decrease or increase PA by DPA, and increase or decrease TGV by a small volumechange, DV.
PA:TGV~(PA{DPA)(TGVzDV ) ð2ÞExpanding and rearranging equation (2).
TGV~(DV=DPA):(PA{DPA) ð3ÞSince DPA is very small compared to PA (v2%) it is usually omitted in the differential
WHOLE-BODY PLETHYSMOGRAPHY
21

term.TGV*(DV=DPA):PA with PA~Pbar{PH2O,sat ð4Þ
TGV*(DV=DPA):(Pbar{PH2O,sat) ð5ÞAs noted above, during the respiratory efforts against the closed shutter, the changein PA i.e. DPA, is recorded as DPm. DV, the shift volume, is measured by thecalibrated plethysmographic gas pressure transducer.
In whole-body plethysmographs, where sRaw is measured during shallow panting,TGV is determined at a lung volume that is the most comfortable for the patient. Thisvolume is usually greater than resting FRC, because of comfort factors for normalsubjects and because of flow limitation in patients with obstructive lung disease [23, 24].Accordingly, this volume increment above resting FRC must be subtracted to provideFRCpleth [9].
The measured TGV additionally includes any apparatus dead spaces (Vd,app) as well asany volume inspired above resting end-expiratory lung volume at the moment ofocclusion (Vt,occ). Hence FRCpleth can be derived from TGV by subtraction of these twovolume components.
FRCpleth~TGV{Vd,app{V t,occ ð6ÞIn contrast to gas dilution measurements of FRC (FRCdil), FRCpleth includes allTGV even if some may not be in communication with the airway opening. Thus, thevalue of FRCpleth serves as the methodological anchor for determination of absoluteTGV both at residual volume (RV) and total lung capacity (TLC). The measurementprocedure for determining FRCpleth is more complicated than the recording of sRaw
which is described in the next section, because the subject must respond with normalbreathing efforts while ventilation is interrupted by the closed shutter. Therefore, thismanoeuvre requires more subject cooperation, and FRC may vary from test to test.In contrast, RV and TLC are more fixed and may be determined immediately aftermeasurement of FRC by slow exhalation to RV followed by inhalation to TLC.
During tidal breathing, the shutter mechanism is activated by the operator usingcomputer control, and closes at the end of the following tidal expiration. Most plethys-mographs program shutter reopening at a predetermined maximal occlusion time or afterthe subject has generated predetermined cumulative inspiratory and expiratory Pm changesagainst the shutter or a number of zero-pressure crossings. These different criteria wereintroduced to create reliable test results with optimal comfort for the subject. Subjectsshould always be informed to remove the mouthpiece from their mouth in the event theshutter does not open or if the subject senses substantial difficulty breathing.
During the occlusion phase the subject is asked to continue normal breathing effortsagainst the closed shutter. To optimise measurement quality, shutter closure settings areselected to allow recording of at least one positive and one negative Pm change when theshutter is closed. Plethysmographic shift volume and the corresponding Pm changes aredisplayed on an X–Y graph as shown in figure 4.
As in all pulmonary function evaluations, it is recommended that three replicates ofthe measurement of TGV are recorded and saved. Quality of the measurement isreflected, in part, by the variability of replicate trials. Quanjer et al. [25] suggests amaximal deviation of 5% between the individual trials.
Determination of specific resistance
During assessment of sRaw, it is emphasised that the relationship between airflow andshift volume, initially described by DuBois et al. [2] does not define Raw. Raw is defined
M.D. GOLDMAN ET AL.
22
only by combining the measurement of sRaw and the TGV measurement during occludedrespiratory efforts [1, 2].
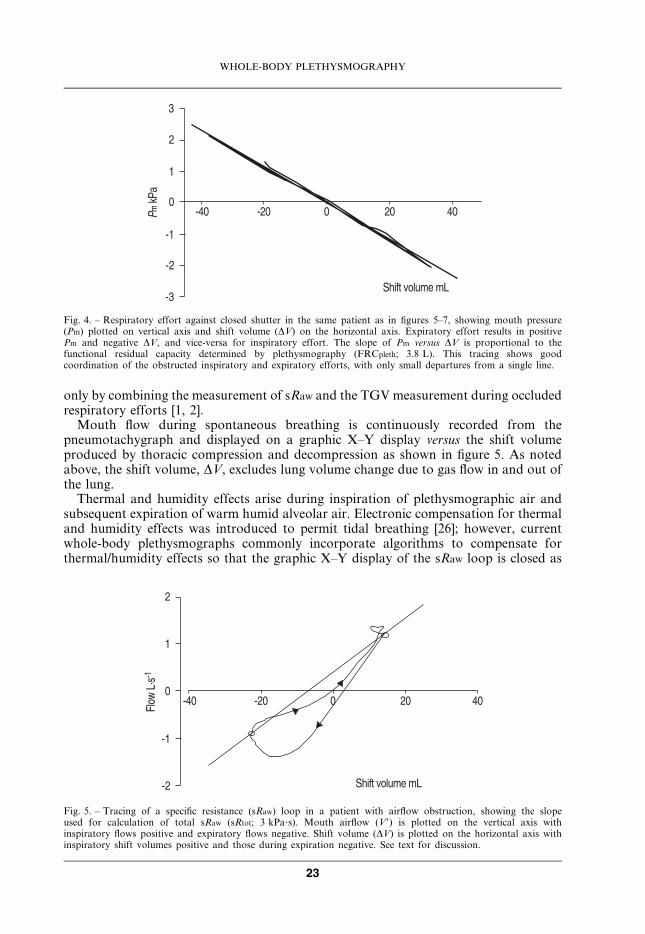
Mouth flow during spontaneous breathing is continuously recorded from thepneumotachygraph and displayed on a graphic X–Y display versus the shift volumeproduced by thoracic compression and decompression as shown in figure 5. As notedabove, the shift volume, DV, excludes lung volume change due to gas flow in and out ofthe lung.
Thermal and humidity effects arise during inspiration of plethysmographic air andsubsequent expiration of warm humid alveolar air. Electronic compensation for thermaland humidity effects was introduced to permit tidal breathing [26]; however, currentwhole-body plethysmographs commonly incorporate algorithms to compensate forthermal/humidity effects so that the graphic X–Y display of the sRaw loop is closed as
�
�
�
�
��
��
��
� ���
�
�����������
��!����� � "
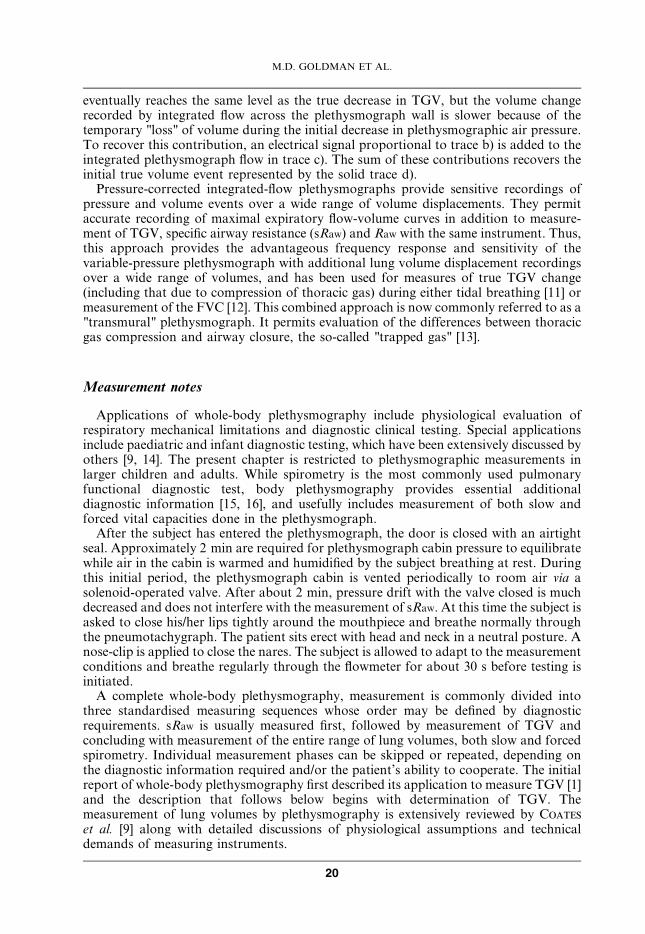
Fig. 4. – Respiratory effort against closed shutter in the same patient as in figures 5–7, showing mouth pressure(Pm) plotted on vertical axis and shift volume (DV) on the horizontal axis. Expiratory effort results in positivePm and negative DV, and vice-versa for inspiratory effort. The slope of Pm versus DV is proportional to thefunctional residual capacity determined by plethysmography (FRCpleth; 3.8 L). This tracing shows goodcoordination of the obstructed inspiratory and expiratory efforts, with only small departures from a single line.
�����������
��!����� � "
�
�
�
��
��
#��$�"%&��
Fig. 5. – Tracing of a specific resistance (sRaw) loop in a patient with airflow obstruction, showing the slopeused for calculation of total sRaw (sRtot; 3 kPa?s). Mouth airflow (V9) is plotted on the vertical axis withinspiratory flows positive and expiratory flows negative. Shift volume (DV) is plotted on the horizontal axis withinspiratory shift volumes positive and those during expiration negative. See text for discussion.
WHOLE-BODY PLETHYSMOGRAPHY
23
completely as possible during inspiration, during tidal breathing, without the need forrapid shallow respirations.
Equation 7 summarises the relationship between mouth flow, V9, measured by the flowmeter and simultaneously measured plethysmograph pressure, calibrated in terms of shiftvolume, DV, to derive sRaw.
sRaw~(DV=V 0):(Pbar{PH2O,sat) ð7ÞsRaw is thus determined as the product of dry gas Pbar and the ratio of shift volume tomouth flow.
It must be emphasised that the commonly utilised slope of the X–Y display of the sRaw
loops in this measuring step does not directly represent Raw (i.e. pressure–flow loops) asoften assumed, but is instead, sRaw. Thus, the slope does not yield a value for Raw, butrequires knowledge of TGV prior to calculation Raw. The sRaw loop is influenced by Raw
and TGV and its inclination rotates clockwise if either Raw or TGV or both are increased.Acquisition of sRaw data in a whole-body plethysmographic measurement requires
little cooperation from the subject, as this is commonly done in current plethysmographsduring tidal breathing, rather than using the voluntary rapid shallow panting methodoriginally reported by DuBois et al. [2].
As in all plethysmographic applications, subjects should sit upright and avoid neckflexion or rotation. After adapting to the measuring conditions during tidal breathingthrough the pneumotachygraph, it is recommended that at least 5–10 sRaw loops shouldbe recorded as one trial. Normally, three replicate trials are recorded and saved. Optimalquality of the recording is achieved when sRaw loops are regular and reproducible withthe loop nearly entirely closed, although patients with significant airflow obstructionmanifest open loops during expiration.
Numerical parameters calculated from the specific resistance loop. The content of thesRaw loop is often quite complex and is not a simple narrow linear oval loop, especially inthe presence of peripheral airway disease, as initially described by DuBois et al. [2]. Sincethe sRaw loop includes varying flows throughout the tidal breathing respiratory cycle,different investigators have utilised different portions of the loop to approximate a"representative" value for the entire cycle.
The total specific resistance (sRtot) [27] and effective specific resistance (sReff) [23] havebeen well established and both are utilised in clinical laboratories. These approaches,along with use of the linear portion of the sRaw loop between inspiratory and expiratoryflow rates of 0.5 L?s-1 [28, 29] are designed to provide a linear approximation of sRaw.Such linear approximations are generally comparable in patients with normal respiratorymechanics, but all of these approaches manifest interpretative compromises in advancedobstructive lung disease. The specific characteristics of these different approaches arediscussed in a subsequent section with physiological interpretation.
Total specific resistance. The sRtot, as described by Islam and Ulmer [27], is determinedby a straight line between maximal inspiratory and maximal expiratory shift volumepoints as shown in figure 5.
The outstanding characteristic of sRtot is its sensitivity to partial obstruction ofperipheral airways. The potential disadvantage of sRtot would appear to be a greatervariability from test to test, as a consequence of using only two points at the extremes ofinspiratory and expiratory shift volume.
Effective specific resistance. sReff, as introduced by Matthys and Orth [23], extendedthe dimensional analysis applied by Jaeger and Otis [30] to integrate effects of variable
M.D. GOLDMAN ET AL.
24
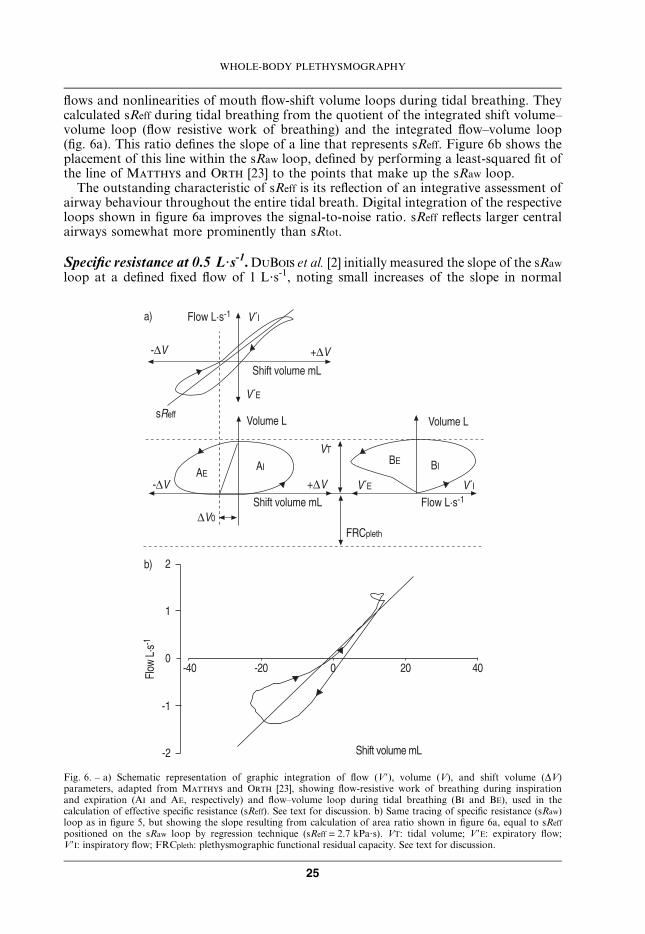
flows and nonlinearities of mouth flow-shift volume loops during tidal breathing. Theycalculated sReff during tidal breathing from the quotient of the integrated shift volume–volume loop (flow resistive work of breathing) and the integrated flow–volume loop(fig. 6a). This ratio defines the slope of a line that represents sReff. Figure 6b shows theplacement of this line within the sRaw loop, defined by performing a least-squared fit ofthe line of Matthys and Orth [23] to the points that make up the sRaw loop.
The outstanding characteristic of sReff is its reflection of an integrative assessment ofairway behaviour throughout the entire tidal breath. Digital integration of the respectiveloops shown in figure 6a improves the signal-to-noise ratio. sReff reflects larger centralairways somewhat more prominently than sRtot.
Specific resistance at 0.5 L?s-1. DuBois et al. [2] initially measured the slope of the sRaw
loop at a defined fixed flow of 1 L?s-1, noting small increases of the slope in normal
#��$�"%&�� ��'
��� ���
��!����� � "
��(
���� �"&�!!
��� ���)( )'
��� ��!����� � "
��
��(
���� �"
*( *'
��'#��$�"%&��
#+,����
�
�
�
��
��
#��$�"%&��
�����������
��!����� � "
��
��
Fig. 6. – a) Schematic representation of graphic integration of flow (V9), volume (V), and shift volume (DV)parameters, adapted from Matthys and Orth [23], showing flow-resistive work of breathing during inspirationand expiration (AI and AE, respectively) and flow–volume loop during tidal breathing (BI and BE), used in thecalculation of effective specific resistance (sReff). See text for discussion. b) Same tracing of specific resistance (sRaw)loop as in figure 5, but showing the slope resulting from calculation of area ratio shown in figure 6a, equal to sReff
positioned on the sRaw loop by regression technique (sReff = 2.7 kPa?s). VT: tidal volume; V9E: expiratory flow;V9I: inspiratory flow; FRCpleth: plethysmographic functional residual capacity. See text for discussion.
WHOLE-BODY PLETHYSMOGRAPHY
25

subjects at 0.75 and 0.5 L?s-1. Subsequently, the flow range has commonly been limited tothe relatively linear portion of the sRaw loop between inspiratory and expiratory flow ratesof 0.5 L?s-1 [28, 29] for definition of sR0.5, as shown in figure 7.
The potential advantage of sR0.5 is that it standardises the flow at which resistance ismeasured. In normal subjects, but particularly in patients with airflow obstruction,resistance is dependent upon flow rate, so this approach offers less inter-individualvariability. The parameter sR0.5 reflects primarily the behaviour of larger, more proximalairways, with much less sensitivity to peripheral airway abnormalities.
Specific conductance. The reciprocal of sRaw is denoted specific conductance (sGaw).
sGaw~1=sRaw ð8ÞWhen calculating sGaw, it must be defined with respect to which calculation of sRaw isperformed, according to the definitions listed in the sections above. The conversion ofsRaw to sGaw is not simply a mathematical procedure, but is based on the originalobservations of Briscoe and DuBois [31] that the major determinant of Raw in normalsubjects is lung volume and, accordingly, that the relationship between lung volumeand conductance is linear within and between individuals. Thus, sGaw is a "volume-normalised" expression for airway conductance.
Calculation of airway resistance and conductance
Finally, the commonly used clinical parameters of body plethysmography, Raw andGaw, are calculated using sRaw and corresponding TGV, as defined below:
Raw~sRaw=TGV ðÞOr corrected for the average lung volume during tidal breathing, where VT representstidal breathing.
Raw~sRaw=(FRCplethzVT=2) Gaw~1=Raw ð9ÞIn practice, the measurements of TGV are conveniently performed immediately afterthe sRaw breathing loops; and three replicates are recommended. Quality of themeasurement is reflected in part by the variability of replicate trials and, in part, by
�
�
�
��
��
#��$�"%&��
�����������
��!����� � "
��-.�"%&��
��-.�"%&��
Fig. 7. – Same tracing of specific resistance loop as in figure 5, showing the slope used for calculation of specificresistance 0.5 (sR0.5; 2.5 kPa?s). See text for discussion.
M.D. GOLDMAN ET AL.
26

how closely the Pm – plethysmograph pressure tracing approximates a straight line.A good quality tracing is shown in figure 4, where departures from the computerregression line are very small over a wide range of Pm.
By definition, inaccuracy in the determination of TGV or FRCpleth will cause aproportional error in the estimation of Raw and Gaw. For this reason, and because it istechnically more demanding for patients with airflow obstruction to make respiratoryefforts against a closed shutter than for tidal breathing, some clinicians restrict their mostcareful attention to sRaw and sGaw [23, 27, 30, 32]. Additionally, in many patients withCOPD, Raw appears to be nearly within normal limits, due to manifest compensatorylung hyperinflation, especially when measured between 0.5 L?s-1 inspiratory andexpiratory flow. In these cases, sRaw and sGaw still show abnormality, because of theincreased TGV maintained during tidal breathing. In a subsequent section, an alternativeapproach to estimation of TGV during tidal breathing only is described, avoidingvoluntary respiratory efforts against a closed shutter [24].
Spirometric measurement
It is often convenient to complete a body plethysmographic measurement withspirometric measurements. Commonly this is done immediately after TGV has beendetermined, using a slow exhalation below resting FRC to minimal lung volume, i.e.performance of an expiratory reserve volume (ERV) effort. This is followed by aninspiratory vital capacity effort (IVC) to TLC, followed by a maximal forced expirationfor determination of forced expiratory volume in one second (FEV1) and FVC.
In this way, all the primary pulmonary subdivisions can be recorded as absolute gasvolumes. These include TLC, FRCpleth and RV. RV may be calculated by subtractingERV from FRCpleth.
RV~FRCpleth{ERV ð10ÞTLC is determined by adding the maximal VC recorded, usually IVC, to RV.
TLC~RVzIVC ð11ÞInspiratory capacity (IC) is the difference between TLC and FRCpleth.
IC~TLC{FRCpleth ð12ÞThe spirometric data described above are conveniently recorded from the flow meterin the whole-body plethysmograph. Issues relevant to spirometry are reviewed anddiscussed in another chapter of this Monograph. However, it is relevant to note herethat, using the "transmural" pressure-compensated integrated-flow plethysmographit is possible to view the maximal expiratory flow–volume (MEFV) curve with respectto volume displacements of the thorax, including those due to compression, duringforced expiration [12]. This is a more reliable method of assessing for the presence ofexpiratory-flow limitation during resting breathing compared with maximal forcedexpiration, than spirometry using only integrated mouth flow as the volume axis.Using such a transmural plethysmograph, it is immediately evident that the VCmeasured from thoracic wall displacements is greater than that measured fromintegrated flow, because of compression of thoracic gas trapped behind closed smallairways at low lung volumes. While this is not important in making clinical decisions,the clinical value of thoracic wall displacements during tidal breathing is a significantissue in patients with chronic airflow obstruction and is discussed below (sectionClinical utility of whole-body plethysmography).
WHOLE-BODY PLETHYSMOGRAPHY
27

Pulmonary function using whole-body plethysmography
Initial interpretation of body plethysmographic parameters usually considersmeasured values in comparison to established normative data. However, it is oftenpreferable to use the patient as his own control, by assessing the trend of measurementsover time or to repeat measurements after therapeutic challenge. Additionally,plethysmography may be repeated after bronchial challenge to assess airway reactivity.
Predicted and limit values for airway resistance
Relatively few studies have established predicted values of Raw in adults. Agedifferences have relatively unimportant effects, as first noted by Briscoe and DuBois
[31]. Ulmer and coworkers [33, 34] reported an average Rtot for healthy adults of0.22 kPa?s?L-1 and defined an upper limit of normal Rtot as 0.35 kPa?s?L-1. Matthys etal. [35] introduced normative equations for sRtot and sReff, and reported an average¡sd
value for Reff of 0.2¡0.0967 kPa?s?L-1.Recently Van der Velden et al. [36] compared Rtot, Reff and R0.5 in 78 healthy adults
with average¡sd values for Rtot of 0.19¡0.07 kPa?s?L-1, for Reff of 0.15¡0.06 kPa?s?L-1
and R0.5 of 0.13¡0.05 kPa?s?L-1. These comparative values are useful for currentguidance. Quanjer [37] tabulated data in 1983, including a large 1970 study of Raw
during tidal breathing, in both males and females. He selected an upper limit of normal of0.3 kPa?s?L-1 for both males and females. However, the age of these data argue for thevalue of undertaking new studies of normative values for Raw, sGaw and, possibly,absolute lung volumes using modern plethysmographs with thermal/humidity effectscompensated by numerical algorithms.
In younger children, Klug and Bisgaard [38] have measured sRaw with the childaccompanied by an adult within the plethysmograph. As expected with growth andincrease in lung size, Raw decreases with age in children. Predicted values for childrenhave been reported by Zapletal et al. [39].
Predicted value for thoracic gas volumes
Body size and lung size in adults may vary according to ethnic origin and somenormative values have been reported by different authors to correspond to populationsserved in their communities. Quanjer et al. [25] reported standardised values for FRC,RV and TLC with spirometry in adults and Ulmer et al. [34] reported standardisedvalues for TGV and FRCpleth in adults. Zapletal et al. [39] reported plethysmographicvolumes for children.
Assessment of bronchial reactivity
Measurement of sRaw (sGaw) has been used clinically for assessment of bronchialresponsivity. Because sRaw and sGaw are commonly measured during tidal breath-ing, they are influenced both by Raw as well as changes in resting lung volumes (FRC).Since both resistance and resting end-expiratory lung volume may change duringbronchial or therapeutic challenge, sRaw and sGaw provide useful practical assessments ofairway responsivity, even in the absence of a determination of absolute TGV. In adultsor children unable to perform the measurement of TGV, sRaw or sGaw provides usefulclinical guidance, although American Thoracic Society and European RespiratorySociety guidelines suggest separate documentation of Raw and changes in FRC. Such
M.D. GOLDMAN ET AL.
28
measures of airway response during tidal breathing are often considered preferable tospirometric assessments [40]. The commonly used limit for bronchoprovocation is a 15 or20% decrease in FEV1 relative to control baseline FEV1. The comparable limit forsRtot is 100%, for Rtot 50% increase and for sGtot 40% decrease from baseline,respectively [40].
Therapeutic challenge may be similarly compared to baseline sRaw and judged by thedegree of reversibility, whether limited in magnitude (partial reversibility) or morecomplete, such that sRaw values reach the normal range. Reversibility, whether partial orcomplete, can be assessed as the improvement quantified as per cent of the predictedvalue.
Interpretations of whole-body plethysmography
Pathophysiological manifestations
While the numerical values of sRaw and sGaw, Raw, Gaw, and TGV may be comparedwith normative data where they are available, and for assessment of bronchial andtherapeutic challenge, the linear approximations used to derive numerical values providea limited capacity for the understanding of pathophysiology. Further physiologicalinterpretative information is available from the shape of the sRaw loops. The additionalvalue of these graphic displays is analogous to the additional value of the flow–volumecurve, relative to simple numerical values of FEV1 and FVC.
The infrastructure of physiological interpretation of sRaw loops is the relationshipbetween airflow measured at the mouth and shift volume (V9 versus DV). Shift volumerepresents the volume changes in TGV that occur during compression and decompres-sion of thoracic gas, not including the volume changes due to airflow in and out of thelung, and this shift volume is related to airflow resistance. When airflow resistance is thedominant contribution to shift volume, changes in PA and shift volume usually manifesta linear relationship to airflow at the mouth. This is made use of in estimates of sRaw
between the limits of 0.5 L?s-1 inspiratory and expiratory flows. However, even in normalsubjects when airflow rate is substantially larger than 0.5 L?s-1 it is common to observeslight alinearity of sRaw, as noted in original report of DuBois et al. [2].
Mild obstructive lung disease may manifest as only minimal nonlinearity of sRaw
loops. However, in advanced obstructive lung disease, it is now well known that dynamiccompression of intrathoracic airways is associated with disproportionate increases inintrathoracic pressure relative to airflow. Stanescu et al. [18] and Rodenstein et al. [19]used oesophageal pressure to estimate pleural pressure during respiratory efforts againsta closed shutter in patients with airflow obstruction These studies demonstrated that, inthe presence of increased airflow resistance, mouth occlusion pressure changesunderestimate those of oesophageal (and alveolar) pressure during panting at frequenciesw1 Hz. Other investigators confirmed the inaccuracy of TGV measured during pantingagainst a closed shutter at frequencies w1 Hz, and suggested that their results wereconsistent with nonhomogeneous mechanical properties of airways and lung tissue timeconstants [17, 22]. Furthermore, in patients with severe airflow obstruction, there may beareas of the lungs that do not communicate with central airways, and, therefore, do notventilate during tidal breathing, as evidenced by measures of "closing volume" that occurat lung volumes that may exceed FRC [41, 42].
Islam and Ulmer [27] provided a comprehensive evaluation of effects of airwayclosure using plethysmographic measures of the altered relationship between changes inintrathoracic pressure relative to airflow. They reasoned that the marked narrowing or
WHOLE-BODY PLETHYSMOGRAPHY
29
closure of small airways that occurred at low lung volumes, defined as closing volume[41, 42], should cause an abrupt decrease in plethysmographic gas pressure. They plottedapparent Rtot as a function of lung volume, and showed a dramatic increase in apparentRtot in patients with airflow obstruction at low lung volumes, manifest to a lesser degreein normal subjects [27]. In normal subjects, they determined closing volume at lungvolumes below FRC (i.e., within the ERV), which they associated with a significantincrease in apparent Rtot. In patients with chronic airflow obstruction, they were unableto determine a closing volume because of technical limitations; however, they measured asubstantial increase in apparent Rtot within the IC. These authors utilised changes inapparent Rtot as a reflection of compression of gas in nonventilated airspaces. Theclinical implication of such changes is discussed below (section Extending the clinicalutility of whole-body plethysmography).
Shortly after the report of Islam and Ulmer [27], Matthys and Orth [23] describedthe contribution of these pathophysiological disturbances to a dissociation betweenmaximal shift volume and maximal flow. They extended the dimensional analysis appliedby Jaeger and Otis [30] to integrate these contributions to an "effective resistance" thatincluded the effects of the entire range of variable flows during tidal breathing andnonlinearities in the sRaw loop. They measured the areas of graphic plots of shift volumeversus volume and of flow versus volume during tidal breathing, determinedplanimetrically during playback of plethysmographic signals recorded on magnetictape (fig. 6a). They divided the integrated shift volume–volume loop (the flow resistivework of breathing, A in fig 6a) by the flow–volume loop (B in fig 6a) to derive sReff. Theycalculated effective resistance from the quotient of sReff and mean ventilated lung volume(FRCpleth z VT/2).
Reff~½(A=B):(Pbar{PH2O,sat)�=(FRCplethzVT=2) ð13ÞMatthys and Orth [23] performed these calculations from analysis of signalsrecorded on magnetic tape; but this is now readily calculated by digital algorithms inmodern computer-assisted plethysmographs. Despite the obvious attraction of anintegrative approach, such as that of Matthys and Orth, the analysis andinterpretation of multiple graphic displays, including flow–volume loops, shiftvolume versus volume and shift volume versus flow loops, is not feasible in the clinicalpulmonary function laboratory. Accordingly, calculation of the numerical value ofsReff is done by computer algorithm, and the resulting slope is positioned within theconventional sRaw loop using regression techniques. In this way, sReff can becompared conveniently to sRtot and sR0.5 if desired [36].
Since the contributions of dynamic compression of intrathoracic airways andcompression of nonventilated lung areas make the sRaw loops highly nonlinear andcontribute to characteristic shapes of the shift volume versus mouth flow X–Y graphdisplayed in current body plethysmographs, these characteristic shapes are now discussedin detail.
Characteristic specific resistance loops
Characteristic sRaw loops are shown in figure 8. The tracing labelled a) in figure 8displays a schematic sRaw loop in a normal subject during tidal breathing, which is shownafter numerical software compensations to close the sRaw loop. Normal subjects manifesta steep linear loop during tidal breathing without hysteresis. In contrast, duringvoluntary panting efforts, the upper and lower end portions of the loop may becomeslightly curvilinear. The curvilinearity is in the form of a very slight "S" shape, analogousto that shown in tracing d), but much less exaggerated. In normal subjects during
M.D. GOLDMAN ET AL.
30
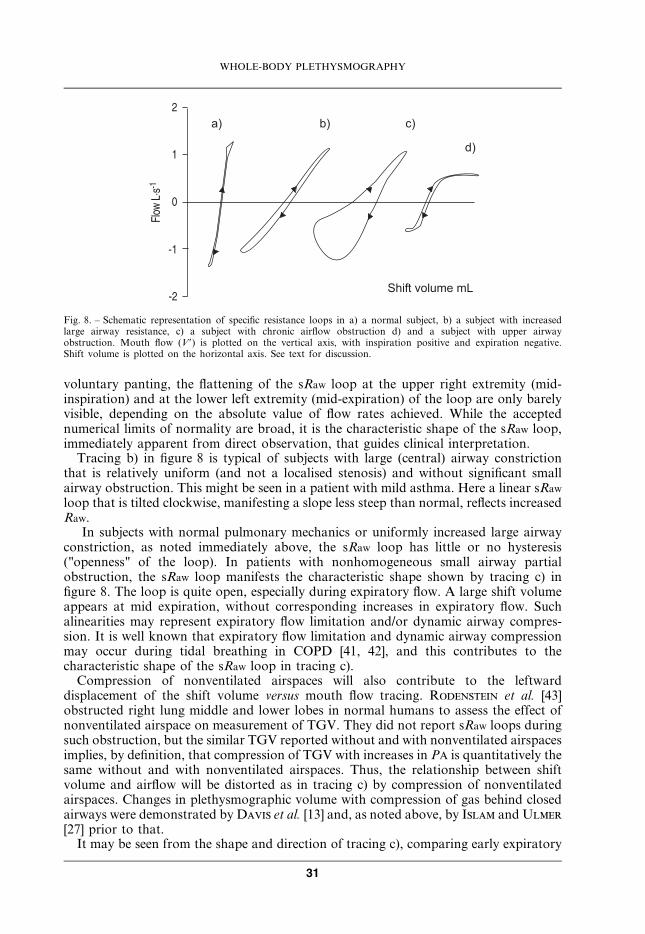
voluntary panting, the flattening of the sRaw loop at the upper right extremity (mid-inspiration) and at the lower left extremity (mid-expiration) of the loop are only barelyvisible, depending on the absolute value of flow rates achieved. While the acceptednumerical limits of normality are broad, it is the characteristic shape of the sRaw loop,immediately apparent from direct observation, that guides clinical interpretation.
Tracing b) in figure 8 is typical of subjects with large (central) airway constrictionthat is relatively uniform (and not a localised stenosis) and without significant smallairway obstruction. This might be seen in a patient with mild asthma. Here a linear sRaw
loop that is tilted clockwise, manifesting a slope less steep than normal, reflects increasedRaw.
In subjects with normal pulmonary mechanics or uniformly increased large airwayconstriction, as noted immediately above, the sRaw loop has little or no hysteresis("openness" of the loop). In patients with nonhomogeneous small airway partialobstruction, the sRaw loop manifests the characteristic shape shown by tracing c) infigure 8. The loop is quite open, especially during expiratory flow. A large shift volumeappears at mid expiration, without corresponding increases in expiratory flow. Suchalinearities may represent expiratory flow limitation and/or dynamic airway compres-sion. It is well known that expiratory flow limitation and dynamic airway compressionmay occur during tidal breathing in COPD [41, 42], and this contributes to thecharacteristic shape of the sRaw loop in tracing c).
Compression of nonventilated airspaces will also contribute to the leftwarddisplacement of the shift volume versus mouth flow tracing. Rodenstein et al. [43]obstructed right lung middle and lower lobes in normal humans to assess the effect ofnonventilated airspace on measurement of TGV. They did not report sRaw loops duringsuch obstruction, but the similar TGV reported without and with nonventilated airspacesimplies, by definition, that compression of TGV with increases in PA is quantitatively thesame without and with nonventilated airspaces. Thus, the relationship between shiftvolume and airflow will be distorted as in tracing c) by compression of nonventilatedairspaces. Changes in plethysmographic volume with compression of gas behind closedairways were demonstrated by Davis et al. [13] and, as noted above, by Islam and Ulmer
[27] prior to that.It may be seen from the shape and direction of tracing c), comparing early expiratory
�
�
�
��
��
#��$�"%&��
�� �� ��
��
����� �������
Fig. 8. – Schematic representation of specific resistance loops in a) a normal subject, b) a subject with increasedlarge airway resistance, c) a subject with chronic airflow obstruction d) and a subject with upper airwayobstruction. Mouth flow (V9) is plotted on the vertical axis, with inspiration positive and expiration negative.Shift volume is plotted on the horizontal axis. See text for discussion.
WHOLE-BODY PLETHYSMOGRAPHY
31
flow with late expiratory flow at the same value of mouth flow, that shift volume is lessearly in the expiration compared to late in expiration at the same flow. This hysteresisdefines a nonlinear relationship of shift volume to mouth flow that may includecontributions of dynamic airway compression and compression of nonventilatingairspaces to the overall TGV compression during expiration. The single lines drawn infigures 5–7 represent lines defined as sRtot, sReff and sR0.5. It is readily apparent that sucha single line drawn for sRtot reflects a single index that includes important nonlinearitiesoccurring during expiratory airflow. This single line is very different from a"representative" line that might be drawn during inspiratory airflow only or the linecorresponding to sR0.5 in tracing c). More important than any attempt to quantify thecomplex shape of the sRaw loop by a single index, the X–Y display itself reveals the highlyabnormal mechanical behaviour during expiratory airflow in tracing c). Theseabnormalities include contributions from nonlinear expiratory airflow resistance,dynamic airway compression and compression of nonventilated airspace. The lattertwo factors contribute to the increased shift volume late in expiration compared to earlyin expiration, even at an identical mouth flow.
Numerical analysis of tracings in patients similar to those in figure 8c, after dividing byTGV, may be compared with normative values listed above in the section Predicted andlimit values for airway resistance. It should be noted that calculation of measured valuesas per cent predicted may differ in plethysmographs available from differentmanufacturers. Such calculations should state whether "predicted" is the mean expectedvalue or the upper limit (for resistance) of accepted normal values. Equally importantly,extension of the study of Van der Velden et al. [36] should be undertaken with moderncommercially available plethysmographs to confirm their predicted values, including alarger normal population sample and to compare Rtot, Reff and R0.5 in patients withchronic airflow obstruction done at baseline and following therapeutic challenge. Thevalue of such extensions of plethysmography is discussed below in the section Extendingthe clinical utility of whole-body plethysmography.
Because of mechanical nonhomogenities in the lung and airways in obstructive lungdisease, it is not entirely satisfactory to attempt to summarise Raw by a single number.Future clinical investigations might usefully include discrimination between inspiratoryand expiratory Reff, to recognise the predominance of abnormality during expiratoryairflow. An alternative distinction can be made by looking at the parameter mostcommonly used in North America, Raw between inspiratory and expiratory flow rates of0.5 L?s-1. It can be seen in tracing c) that the line corresponding to sR0.5 would besubstantially steeper (less abnormal) than that for sRtot. This reflects, in part, the smallerflow rates, higher lung volume and lack of dynamic airway compression during lateinspiration/early expiration. It is fair to state that inspection of the shape of the sRaw loopdisplayed as the X–Y graph is equally useful diagnostically as any single or combinationof numerical values.
Tracing d) in figure 8 shows the influence of a fixed or functional stenosis ofthe upper airways, for example laryngeal abnormality, or paralysis of one vocal cord.This type of "orifice" constriction manifests flow limitation during inspiration, suchthat, at sufficiently high flows, further increases in driving pressure do not result in anyincrease in airflow. This reflects localised upper airway obstruction, analogous to thatwhich pertains in the maximal expiratory flow–volume curve. Thus, during forcedexpiration, when a critical driving pressure for expiratory airflow (intrapleural pressurefor forced expiration) is achieved, further increases in driving pressure do not causeany further increases in flow rate. A similar flow limitation may occur in theextrathoracic airway during inspiration, as shown in the upper right portion of tracing d)in figure 8.
M.D. GOLDMAN ET AL.
32
Clinical utility of whole-body plethysmography
The utility of whole-body plethysmography is discussed from the perspective of clinicalrespiratory medicine by Brusasco and Pellegrino [44] and physiological considerationsare presented in detail by Pride and Macklem [45].
Measurement of thoracic gas volume
The raison d’etre of whole-body plethysmography is the measurement of lung volumes.Accordingly, the first acknowledged clinical benefit of body plethysmography is thedefinition of restrictive lung disease [46]. Normative data for TGV and pulmonarysubdivisions allow definition of restrictive lung disease as distinct from obstructive, in thepresence of a reduced VC. Definition of abnormally increased lung volumes inobstructive lung disease is a further appropriate clinical use of whole-bodyplethysmography. While lung volumes can be measured by gas dilution techniques, itis well known that dilution techniques measure only the volume of ventilated airspaces.Accordingly, when whole-body plethysmography is combined with dilution measures oflung volumes, the volume of trapped gas is estimated by the difference between FRCpleth
and dilutional FRCHe. Because FRC varies to some degree from breath to breath, afurther comparison of calculated RV determined with dilution and plethysmographyprovides useful information concerning trapped gas.
The voluntary rapid shallow obstructed respiratory efforts described by DuBois et al.[1] appear to permit equilibration of intrathoracic gas and Pm, and, accordingly, arealistic estimate of changes in PA from Pm measurements in normal subjects. However,in the presence of intrathoracic airway obstruction, rapid obstructed panting effortsoverestimate TGV because the change in Pm underestimates the change in PA [18, 19].Stanescu et al. [18] and Rodenstein et al. [19] investigated normal and asthmaticsubjects. They compared changes in mouth pressure with those of oesophageal pressureduring obstructed panting efforts and showed that in normal subjects Pm andoesophageal pressures during panting efforts against a closed shutter were comparable.However, in the presence of airflow obstruction, changes in Pm significantlyunderestimated those in the oesophagus, taken to be equal to PA changes duringrespiratory efforts against a closed shutter. Airway obstructions were either diffuse, as inasthmatic subjects, or in the lower trachea, induced in normal subjects by inflating aballoon in the lower trachea. This group then bypassed the upper airways with a cuffedendotracheal tube and showed comparable occlusion pressure changes between theendotracheal tube opening and the oesophagus. They concluded that an increased degreeof airflow obstruction, increased compliance of the upper extrathoracic airways andincreased rate of panting all combine to cause the underestimation of PA change by Pm,and consequent overestimation of TGV. This work and that of others [17, 20–22] resultedin a recommendation of panting at 1 Hz to optimise the measurement of TGV.
Thus, the assumption implicit in the original work of DuBois et al. [1] by use ofchanges in Pm to represent changes in PA during panting efforts against a closed shutterhas been demonstrated to be unwarranted in patients with significant airflowobstruction, unless very slow panting efforts are performed. However, such slowpanting efforts require considerable coordination on the part of the patient, and, inpractice, tidal breathing is much more reliably assessed in current commercialplethysmographs with the aid of computer-assisted compensation for thermal andhumidity effects.
A second assumption is that the changes in body volume during panting efforts againsta closed shutter are essentially only those of TGV. This assumption has been reinforced
WHOLE-BODY PLETHYSMOGRAPHY
33
by Brown et al. [47], who investigated the effects of panting efforts at different volumeswithin the VC and with different amounts of abdominal air introduced into the stomachvia a nasogastric catheter. They reported that when panting efforts were performed nearRV and near TLC, discrepancies of 3–5% of true TLC could be related to abdominal gasvolume, but when panting efforts were performed at FRC the effect of abdominal gasvolume on measurement of TGV was negligible. The simplest form of Boyle-Mariotte’sLaw used in manual calculations of TGV [1] has been evaluated by Coates et al. [11] whoincluded calculation of TGV using the complete Boyle-Mariotte’s law equation(Equation 3, section Determination of thoracic gas volume and functional residualcapacity) and demonstrated errors in the order of¡3% during panting and¡2–9% duringa single inspiratory effort against a closed shutter as recommended for children [48].Although such discrepancies are not likely to influence clinical decisions, the authorsargued that they are easily avoided using modern computational methods in automatedwhole-body plethysmographs [49].
The foregoing analysis and review of efforts to optimise the measurement of FRCpleth
has emphasised the cooperation required of the patient, including panting efforts againsta closed shutter at a controlled low frequency in addition to maintenance of an openglottis during obstructed respiratory efforts. These constraints prompted Agrawal andAgrawal [24] to measure TGV during tidal breathing without obstructed respiratoryefforts. These authors reasoned that since sRaw is expressed numerically by the productof TGV and Raw, addition of a known resistance in the respiratory path would permitdetermination of TGV by subtraction. Thus:
sRaw1~Raw:TGV and ð14ÞsRaw2~(RawzRadd):TGV ð15Þ
Subtracting Equation 14 from Equation 15 yields:
sRaw2{sRaw1~Radd:TGV; and TGV~(sRaw2{sRaw1)=Radd ð16ÞIt is implicit in these equations that TGV must be constant between tidal breath-ing without and with the added resistance, airflow at which sRaw is measuredmust be the same without and with the added resistance; and that airway mechanicscan be modelled as a linear system. These authors measured sRaw manually froman oscilloscope screen at the onset of inspiration up to 0.5 L?s-1 inspiratory flowwithout and with added resistance. The added resistance was brought into therespiratory path by a shutter valve which permitted replicate measures of sRaw withand without added resistance in a constant-volume plethysmograph. Any change inFRC associated with switching of the shutter valve could be measured by integratedairflow; however, no changes in FRC were observed. Thus, the first two assumptionsare warranted. The assumption of linear behaviour without and with an addedresistance in front of the mouth may be questioned in patients with airflowobstruction and nonhomogeneities in lung mechanical properties. Accordingly, theauthors measured TGV during tidal breathing without and with the added resistance,and compared these results with TGV measured during panting at FRC. Goodagreement between the two methods was obtained in normal subjects and a limitednumber of asthmatic and COPD patients in whom baseline Raw ranged from 0.1–1.5 kPa?s?L-1 [24].
The advantage of estimating lung volume in this manner is that tidal breathing only isrequired. Agrawal and Agrawal [24] measured sRaw manually, and it remains to bedetermined whether modern computer-assisted plethysmographs will provide compar-able FRCpleth results during respiratory efforts against a closed shutter and during tidalbreathing without and with added resistance. It is the authors’ opinion that this approach
M.D. GOLDMAN ET AL.
34
is worthy of further investigation as it presents a convenient approach to the measure-ment of TGV that is likely to be more easily applicable to a wide variety of patients.
Measurement of airway resistance
Measures of Raw made in a whole-body plethysmograph demand the constraints andlinear approximations described in previous sections. Accordingly, a single numberdefining "resistance" is not entirely satisfactory in patients with substantial airflowobstruction. Nonhomogeneous lung mechanical properties, expiratory flow limitation andairway closure all contribute to the highly nonlinear shapes of the sRaw loops described inprevious sections. Limitations of interpretation imposed by the linear approximationsdescribed in sections Numerical parameters calculated from the specific resistance loop,Pathophysiological manifestations, and Characteristic specific resistance loops point to theclinical utility of direct visual inspection of the sRaw loops themselves. In addition tocalculating resistance by any of the alternative linear approximations, the shape of the sRaw
loop provides improved understanding of the patients’ pathophysiology.Plethysmographic sRaw can be measured both during rapid shallow breathing
(panting) and during tidal breathing. The initial description of sRaw [2] utilised rapidshallow breathing to minimise thermal effects. This had the added advantage of resultingin full opening of the vocal cords [50]. However, one disadvantage of panting respirationsis that they are almost invariably performed at lung volumes significantly larger thanresting FRC [23, 24], necessitating further corrections to optimise accuracy [9, 11].Furthermore, controlling panting frequency at a rate of 1 Hz [17–22], as well as requiringsubstantial coordination of the patient’s respiratory efforts, also increases the likelihoodof variable glottic opening [50]. Krell et al. [32] demonstrated that quiet breathing sRaw
was equivalent to that obtained during panting. Subsequently, with improved computer-assisted compensation algorithms [49], it was possible to program commercial whole-body plethysmographs to measure sRaw during tidal breathing, at normal resting FRC.
Pulmonary resistance, including Raw and tissue viscance, is also available during tidalbreathing from the measurement of oesophageal pressure, although this invasiveprocedure is both more time consuming and more uncomfortable for the patient.Respiratory resistance is available during tidal breathing using the method of forcedoscillation, and is described in another chapter in this monograph. Neither pulmonaryresistance nor forced oscillatory resistance has yet achieved the clinical acceptance ofwhole-body plethysmography. Interestingly, the forced oscillation technique was firstintroduced by DuBois et al. [51] in the same year that this group first published theplethysmographic measurement of Raw.
The clinical utility of plethysmographic measurements of Raw and sRaw is attested toby the fact that they have been considered the "gold standard" for decades for assessingairway function. In patients with significant airflow obstruction, sGaw is commonlyassessed. This permits lung hyperinflation to be taken into account. Normative values areavailable for Raw, sRaw, and their reciprocals, Gaw and sGaw [33–36].
The choice of which measure of resistance is clinically most useful varies amongdifferent investigators and in different countries. Some investigators emphasise theadvantage of Rtot because it includes the effects of multiple mechanical abnormalitiesassociated with advanced peripheral airway obstruction. Against this is the disadvantageof test-to-test variability, due to its derivation from only two points (maximal inspiratoryand expiratory shift volumes) of the sRaw loop. Other investigators prefer Reff, because itintegrates the entire ranges of flow, shift volume and lung volume of the complete tidalbreath, and may thus be expected to offer less within-individual variability. Others argueagainst the perceived advantages of both these approaches to approximate "resistance"
WHOLE-BODY PLETHYSMOGRAPHY
35
because of their sensitivity to nonflow-resistive mechanical effects due to compression ofnonventilating air spaces and also sensitivity to dynamic expiratory intrathoracic airwaycompression and expiratory flow limitation during tidal breathing. These mechanicalabnormalities, albeit related to pressure dissipation during airflow in patients withchronic airflow obstruction, are largely excluded from the calculation of R0.5. For thesereasons, most North American clinicians utilise R0.5, which is derived from astandardised flow range between late inspiration, z0.5 L?s-1, and early expiration,-0.5 L?s-1, on the sRaw loop (fig. 7). This calculation results in a lower resistance thaneither Reff or Rtot because it is minimally affected by dynamic airway compression orcompression of nonventilating airspace. As such, it reflects primarily the resistance inlarger central airways, is relatively insensitive to changes in peripheral airways andmanifests less test-to-test variability within an individual.
The effects of dynamic airway compression and compression of nonventilatingairspaces lead to a dependence of Rtot and Reff on breathing pattern itself, namely thedegree to which patients with chronic airflow obstruction "force" their expiratory effort.During resting tidal breathing in normal individuals, expiratory airflow is largely, if notentirely, produced by stored elastic energy in the chest wall. However, even in normalsubjects, Loring and Mead [52] have shown that resting breathing is associated with avariable degree of active abdominal muscle recruitment. This active expiratory musclerecruitment is much more marked in patients with chronic airflow obstruction. Suchpatients commonly utilise active expiratory muscle effort to aid expiratory airflow andmanifest expiratory flow limitation even during resting tidal breathing [53]. Dependingupon the patient’s unique individual sensation of their breathing, they may contract theirexpiratory muscles to a variable degree during resting tidal expiration, and this activeexpiration may change variably with therapeutic challenge. The degree of expiratorymuscle effort will directly influence calculated Reff and Rtot because greater efforts causegreater shift volumes without corresponding increases in expiratory airflow in thepresence of expiratory flow limitation.
It is clear that there are marked differences between "instantaneous" airflow resistanceduring inspiration and expiration in patients with chronic airflow obstruction. Thesedifferences may be appreciated graphically by direct visual inspection of the sRaw loop.They may be appreciated numerically by deriving separate inspiratory and expiratoryvalues of Reff, again using the integrated areas of shift volume–volume and flow–volumeloops, as denoted AI/AE and BI/BE for inspiration and expiration separately in figure 6a.Comparable numerical representation of the mechanical abnormalities that occur duringexpiration using R0.5 or Rtot is not possible due to the definition of these quantities basedon the sRaw loops. Instead, graphic display of the sRaw loop is required to appreciate theprominence of such abnormalities during the expiratory phase [2, 54–56].
However, current computer-assisted plethysmography makes it possible to calculate"instantaneous" values of airflow resistance, provided TGV is known. During breathingwithin the constant-volume plethysmograph, airflow resistance in the lung requires smallamounts of compression of thoracic gas during expiration and expansion of thoracic gasduring inspiration, resulting in the "shift volumes" measured by the pressure change inthe plethysmograph. Calculation of Raw requires measures of PA and airflow. Duringfree breathing, shift volume can be used to record an index of changes in PA, becauseshift volume is the product of TGV, and the change in alveolar pressure, DPA, divided byinitial PA. In other words, the fractional change in PA, [DPA]/(Pbar–PH2O,sat), integratedover TGV causes a change in TGV equal to shift volume, which, in turn, results inplethysmographic pressure change. In this way, shift volume provides an index of DPA
provided TGV is known. It must be emphasised, however, that plethysmographicpressure change during breathing is not equal to DPA. It is much smaller in magnitudethan DPA, and reflects the fractional DPA amplified by TGV.
M.D. GOLDMAN ET AL.
36
The instantaneous relationship between DV, TGV and PA may be written as:
DPA=(Pbar{PH2O,sat)~DV=TGV ð17ÞThis is a restatement of Boyle-Mariotte’s law that, under isothermal conditions, thefractional change in PA is equal to the fractional change in TGV. Equation 17 may berearranged as follows:
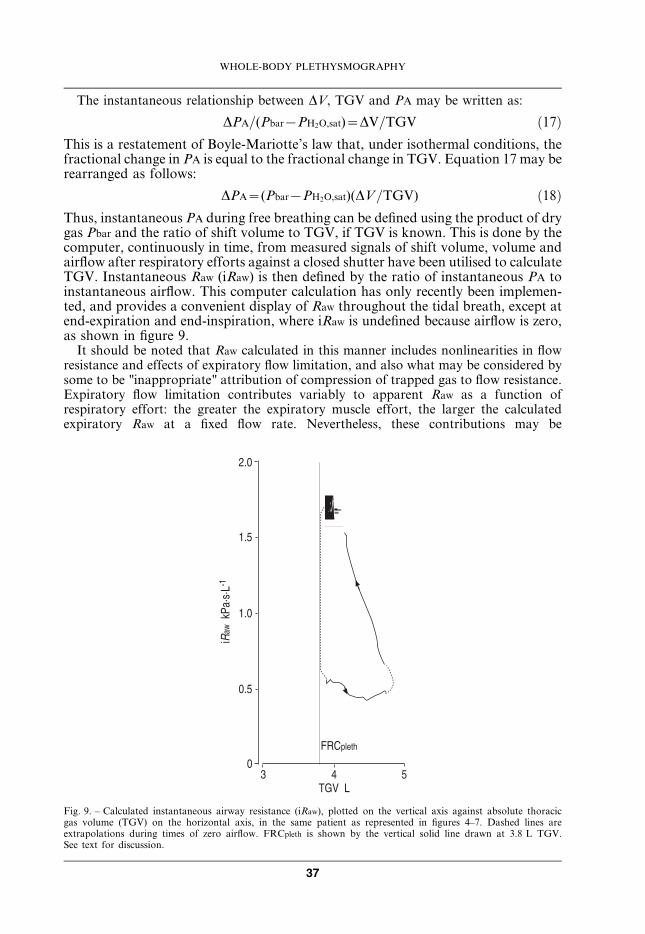
DPA~(Pbar{PH2O,sat)(DV=TGV) ð18ÞThus, instantaneous PA during free breathing can be defined using the product of drygas Pbar and the ratio of shift volume to TGV, if TGV is known. This is done by thecomputer, continuously in time, from measured signals of shift volume, volume andairflow after respiratory efforts against a closed shutter have been utilised to calculateTGV. Instantaneous Raw (iRaw) is then defined by the ratio of instantaneous PA toinstantaneous airflow. This computer calculation has only recently been implemen-ted, and provides a convenient display of Raw throughout the tidal breath, except atend-expiration and end-inspiration, where iRaw is undefined because airflow is zero,as shown in figure 9.
It should be noted that Raw calculated in this manner includes nonlinearities in flowresistance and effects of expiratory flow limitation, and also what may be considered bysome to be "inappropriate" attribution of compression of trapped gas to flow resistance.Expiratory flow limitation contributes variably to apparent Raw as a function ofrespiratory effort: the greater the expiratory muscle effort, the larger the calculatedexpiratory Raw at a fixed flow rate. Nevertheless, these contributions may be
� � .�/���"
�
�-.
�-�
�-.
�-�
���$�����%&%"��
#+,����
Fig. 9. – Calculated instantaneous airway resistance (iRaw), plotted on the vertical axis against absolute thoracicgas volume (TGV) on the horizontal axis, in the same patient as represented in figures 4–7. Dashed lines areextrapolations during times of zero airflow. FRCpleth is shown by the vertical solid line drawn at 3.8 L TGV.See text for discussion.
WHOLE-BODY PLETHYSMOGRAPHY
37
appropriately considered "resistive". Compression of trapped gas during expiration anddecompression during inspiration are not related to airflow per se, but, nevertheless,contribute to the total dynamic PA burden during breathing. More importantly, thedegree of trapped gas in patients with airflow obstruction is likely to be related muchmore prominently to small airway obstruction than to larger more central airways. Thus,this Raw will be more sensitive to small airway obstruction than R0.5 and Reff.
It may be seen in figure 9 that there is a progressive increase in calculated Raw
throughout expiration, consistent with the known effects of mechanical abnormalitiesduring expiratory air flow in patients with airflow obstruction. The envelope of values ofRaw in figure 9 includes wide variability of iRaw throughout the course of the tidal breathin patients with severe airflow obstruction. For comparison, it may be noted that R0.5 willbe approximately equal to the iRaw values just before end-inspiration, while Rtot and Reff
values will fall near the middle of the expiratory iRaw envelope. This representation mayserve as a useful extension of plethysmographic technique, as noted in the section below.
Extending the clinical utility of whole-body plethysmography
This review draws to its conclusion by extending the exploration of clinicalimplications of the complexity of the relationship between shift volume and airflow.As noted above, this complexity has resulted in three different numerical approximationsto measure resistance derived from different linear approximations of the shift volume–airflow relationship. The limitations of rapid shallow panting efforts have been describedand the resultant improvements offered by tidal breathing in the determination ofresistance in patients with airflow obstruction.
The potential for tidal breathing estimation of TGV by addition of a known resistancein front of the mouth has been introduced [24], and will await further investigation usingmodern computer-assisted plethysmographs that provide numerical compensation forthermal and humidity effects during tidal breathing. Investigations in patients withairflow obstruction should include baseline measures and the response to acutebronchodilation to fully utilise the scope of experimental conditions in which thisapproach might be applicable.
Further investigations that extend the work of Van der Velden et al. [36] in patientswith chronic airflow obstruction will provide useful comparisons of the differentnumerical approximations to measurement of resistance. Such investigations will usefullyinclude response to acute bronchodilation with b-agonists on the one hand and short-acting anticholinergics on the other, in the same patients. In this way, the relativesensitivity to primarily proximal or distal airway bronchodilation of Rtot, Reff and R0.5
can be assessed in patients with airflow obstruction, with bronchodilator effects inprimarily proximal or distal airways.
The relationship between calculated iRaw and lung volume during the tidal breath hasrecently been demonstrated (section above, Measurement of airway resistance). Exten-sion of these studies may prove to be a useful representation for clinicians, permitting agraphic impression of change in apparent iRaw within the tidal breath. Furtherinvestigations are necessary to define the relative sensitivity of iRaw and expiratory Reff tointerventions that affect primarily larger proximal or smaller peripheral airways.
The relationship between shift volume and lung volume itself is now considered. Asnoted in section Spirometric measurement, the VC measured plethysmographically fromthoracic wall displacements is larger than that measured from integrated airflow inpatients with chronic airflow obstruction [12]. Similarly, Islam and Ulmer [27] haveshown that the plethysmographic change in apparent Rtot that occurs with airway closurein patients with chronic airflow obstruction may become manifest in some cases at
M.D. GOLDMAN ET AL.
38

volumes greater than FRCpleth. Thus the tidal volume measured from thoracic walldisplacements must also be larger than that derived from integration of airflow in somepatients with chronic airflow obstruction.
This relates importantly to the work of O’Donnell and co-workers [57–59] who haveshown that a significant limitation to exercise in patients with chronic airflow obstructionrelates to the severe dyspnoea that occurs when end-tidal inspiration encroaches on TLC.This implies that thoracic muscle volume displacements are an important limiting factor.The work performed by thoracic respiratory muscles includes not only flow resistivework, but also that required to move the elastic structures of the thoracic wall itself. Thethoracic muscles move the thorax, and their volume displacements are those of thethoracic wall, including compression and decompression of trapped gas. The volumedisplacement of the thorax is systematically underestimated by integration of airflow inpatients with chronic airflow obstruction. It can be appreciated by a plethysmographicmeasure of thoracic volume displacements, such as is readily available from the pressure-compensated integrated-flow whole-body plethysmograph.
Thus, it would appear that respiratory limitation in patients with chronic airflowobstruction may be explored in the future by stimulated ventilation in an appropriatewhole-body plethysmograph. Efficacy of treatment interventions, whether pharmaceu-tical or rehabilitative, may be assessed by their effects on the ability of patients withchronic airflow obstruction to improve thoracic volume displacements. Alternatively,treatment efficacy may be assessed by changes in plethysmographic closing volumerelative to TLC in such patients.
Summary
The aim of this chapter has been to describe the unique and clinically relevantinformation provided by whole-body plethysmography. Primary among thisinformation is the measurement of absolute TGV. Plethysmographic TGV (FRCpleth)is considered the gold standard of absolute volume measurements and includes thenonventilated airspace. Because the whole-body plethysmograph provides a measureof true change in TGV, an increased use of the combination pressure-correctedintegrated-flow (transmural) plethysmograph is to be expected in the evaluation ofpatients with chronic airflow obstruction. The use of thoracic volume measurementsrather than integrated mouth flow has provided more precise characterisation ofpulmonary mechanical parameters as a function of lung volume.The clinical measurement of plethysmographic airflow resistance is also considered tobe the gold standard, and is more widely applied than either pulmonary resistancemeasured invasively via oesophageal balloon or forced oscillatory resistance measurednoninvasively. It is emphasised that the plethysmographic measurement of resistancerequires two separate measurements: first, that of sRaw, and secondly, the measurementof TGV itself. Both plethysmographic and forced oscillatory resistance are influencedby the subject’s spontaneous breathing pattern and both require further complemen-tary measurements to define more precisely the extent of pathophysiologicaldisturbances in patients with chronic airflow obstruction. Measurement of resistanceas a function of lung volume provides a useful extension of currently utilisedmethodology and more clearly delineates effects of small airway obstruction.Technological developments have now permitted incorporation of the transmuralfunction in commercially manufactured plethysmographs, thereby expanding theutility of whole-body plethysmography, and increasing its utility in distinguishing
WHOLE-BODY PLETHYSMOGRAPHY
39
between flow resistive and compression effects, both dynamic airway compression andairway closure (nonventilated airspaces). While this capability has hitherto beenutilised primarily in FVC efforts, increased interest in new treatments for COPD maystimulate use of this capability during tidal breathing. Whole-body plethysmographymay be further developed to include measurement of TGV during tidal breathingwithout panting efforts against a closed airway shutter, and measurement ofinstantaneous Raw during tidal breathing.The sensitivity of plethysmography imposes demands for vigilance on the operator,who must ensure stable body posture, attention to physical support of the oral cavityand cooperation of the subject during testing procedures. Cooperation may beimproved by careful instructions to the patient, careful attention to the patient duringtesting and informing the patient that they can remove the mouthpiece if breathingbecomes obstructed or too difficult. Posture must be supported to maintain subjectcomfort and the instrument mouthpiece must be brought to an appropriate level forthe subject to avoid unusual neck posture. The usual clinical testing procedure of atleast three replicate measures may be usefully augmented by increased testingreplicates in circumstances where acute response to intervention is desired.
Keywords: Airway resistance, shift-volume, thoracic gas volume.
Acknowledgement. This chapter is dedicated to the life of David William Goldman, MD,
whose courage in the face of fatal lung disease inspired his father Michael David Goldman to
commit his life to efforts to make lung function testing more accurate and easier to perform
for all patients with lung disease.
References
1. DuBois AB, Botelho Sy, Bedell GN, Marshall R, Comroe JH Jr. A rapid plethysmographic
method for measuring thoracic gas volume: a comparison with a nitrogen washout method for
measuring functional residual capacity in normal subjects. J Clin Invest 1956; 35: 322–326.
2. DuBois AB, Botelho SY, Comroe JH Jr. A new method for measuring airway resistance in man
using a body plethysmograph: values in normal subjects and in patients with respiratory disease.
J Clin Invest 1956; 35: 327–335.
3. Mead J. Volume displacement body plethysmograph for respiratory measurements in human
subjects. J Appl Physiol 1960; 15: 736–740.
4. Grimby G, Takishima T, Graham W, Macklem P, Mead J. Frequency dependence of flow
resistance in patients with obstructive lung disease. J Clin Invest 1968; 47: 1455–1465.
5. Clement J, Van De Woestijne KP. Pressure correction in volume and flow-displacement body
plethysmography. J Appl Physiol 1969; 27: 895–897.
6. Stanescu D, DeSutter P, Van De Woestijne K. Pressure-corrected flow body plethysmograph.
Am Rev Respir Dis 1972; 105: 304–305.
7. Leith D, Mead J. Principles of Body Plethysmography. Bethesda, MD, National Heart and Lung
Institute, Division of Lung Disease, 1974.
8. Peslin R. Body plethysmography. In: Techniques in the Life Sciences: Respiratory Physiology. 4th
Edn. County Clare, Ireland, Elsevier Scientific Publishers, 1984; pp 1–26.
9. Coates A, Peslin R, Rodenstein D, Stocks J. Measurement of lung volumes by plethysmography.
Eur Respir J 1997; 10: 1415–1427.
10. Comroe J, Botelho S, DuBois A. Design of a body plethysmograph for studying cardiopulmonary
physiology. J Appl Physiol 1959; 14: 439–444.
M.D. GOLDMAN ET AL.
40

11. Coates A, Desmond K, Demizio D. The simplified version of Boyle’s law leads to errors in the
measurement of thoracic gas volume. Am J Respir Crit Care Med 1995; 152: 942–946.
12. Coates A, Desmond K, Demizio D, Allen P, Beaudry P. Sources of error in flow-volume curves:
effect of expired volume measured at the mouth vs that measured in a body plethysmograph. Chest
1988; 94: 976–982.
13. Davis C, Campbell EJ, Openshaw P, Pride NB, Woodroof G. Importance of airway closure in
limiting maximal expiration in normal man. J Appl Physiol 1980; 48: 695–701.
14. Stocks J, Marchal F, Kraemer R, Gutkowski P, Bar-Yishay E, Godfrey S. Plethysmo-
graphic assessment of functional residual capacity and airway resistance. In: Stocks J, Sly P,
Tepper R, Morgan W, eds. Infant Respiratory Function Testing. New York, Wiley-Liss, 1996;
pp. 191–239.
15. Goldman M. Measurements of lung resistance: Body plethysmography to forced oscillation.
Mouthpiece - The Australia and New Zealand Society of Respiratory Science, Inc. February 2003;
7–9.
16. Smith HJ. Spirometry and airways resistance measurements – a comparison from the system
analytical point of view. Mouthpiece - The Australia and New Zealand Society of Respiratory
Science Inc. February 2003; 11–13.
17. Bohadana AB, Peslin R, Hannhart B, Teculescu D. Influence of panting frequency on
plethysmographic measurements of thoracic gas volume. J Appl Physiol 1982; 52: 739–747.
18. Stanescu D, Rodenstein D, Caugerghs M, Van De Woestijne K. Failure of body plethysmography
in bronchial asthma. J Appl Physiol: Respirat Environ Exercise Physiol 1982; 52: 939–948.
19. Rodenstein D, Stanescu D, Francis C. Demonstration of failure of body plethysmography in
airway obstruction. J Appl Physiol: Respirat Environ Exercies Physiol 1982; 52: 949–954.
20. Shore S, Huk O, Mannix S, Martin J. Effect of panting frequency on the plethysmographic
determination of thoracic gas volume in chronic obstructive pulmonary disease. Am Rev Respir Dis
1983; 128: 54–59.
21. Begin P, Peslin R. Influence of panting frequency on thoracic gas volume measurements in chronic
obstructive pulmonary disease. Am Rev Respir Dis 1984; 130: 121–123.
22. Brown R, Slutsky A. Frequency dependence of plethysmographic measurement of thoracic gas
volume. J Appl Physiol 1984; 57: 1865–1871.
23. Matthys H, Orth U. Comparative Measurements of Airway Resistance. Respiration 1975; 32: 121–
134.
24. Agrawal A, Agrawal KP. Body plethysmographic measurement of thoracic gas volume without
panting against a shutter. J Appl Physiol 1996; 81: 1007–1011.
25. Quanjer P, Tammeling G, Cotes J, Pedersen O, Peslin R, Yernault J. Standardized lung function
testing: Lung volumes and forced ventilatory flows. Eur Respir J 1993; 6: Suppl. 16, 5–40.
26. Buchheim FW, Krause W. Elektronische Feuchte- und Temperaturkompensation bei der
Ganzkorperplethysmographie [Electronic humidity- and temperature compensation in whole-
body plethysomography]. Biomedizinische Technik 1971; 16: 3.
27. Islam M, Ulmer W. Diagnostic value of ’closing volume’ in comparison to ’airway resistance/lung
volume plot’. Respiration 1974; 31: 449–458.
28. Lord P, Edwards J. Variation in airways resistance when defined over different ranges of airflows.
Thorax 1978; 33: 401–405.
29. Hantos Z, Galgoczy G, Daroczy B, Dombos K. Computation of the equivalent airway resistance:
a comparison with routine evaluations of plethysmographic measurements. Respiration 1978;
36: 64–72.
30. Jaeger M, Otis A. Measurement of airway resistance with a volume displacement body
plethysmograph. J Appl Physiol 1964; 19: 813–820.
31. Briscoe W, DuBois AB. The relationship between airway resistance, airway conductance and lung
volume in subjects of different age and body size. J Clin Invest 1958; 37: 1279–1285.
32. Krell W, Agrawal K, Hyatt R. Quiet breathing vs. panting methods for determination of specific
airway conductance. J Appl Physiol 1984; 57: 1917–1922.
WHOLE-BODY PLETHYSMOGRAPHY
41
33. Ulmer WT, Reichel G, Nolte D, Islam MS. Die Lungenfunktion. Physiologie, Pathophysiologie,
Methodik [Lung function. Physiology, pathophysiology, methodology]. Thieme 1991: 5.
34. Ulmer WT, Nolte D, Lecheler J, Schaefer T. Die Lungenfunktion. Methodik und klinische
anwendung [Lung function. Methodology and clinical application]. Thieme 2001; 6: 86–95.
35. Matthys H, Zaiss AW, Theissen JL, Virchow jr. JC, Werner P. Definitionen, soll- und messwerte
zur diagnose obstruktiver, restriktiver sowie gemischter ventilationsstorungen fur die klinische
lungenfunktionsdiagnostik [Definitions, predicted values and measures for diagnosis of
obstructive, restrictive as well as combined ventilatory disorders for clinical lung function
diagnostics]. Atemw-Lungenkrkh 1995; 21: 130–138.
36. Van der Velden K, Nietzman-Lammering K, Hoek R, Zanen P, Stam H. Comparison of airway
resistance measured with three different techniques. Eur Respir J 2003; 22: Suppl. 45, 576s.
Abstract 3621.
37. Quanjer P. Standardized lung function testing. Bull Europ Physiopath Resp 1983; 19: Suppl. 5, 33–
38.
38. Klug B, Bisgaard H. Measurement of the specific airway resistance by plethysmography in young
children accompanied by an adult. Eur Respir J 1997; 10: 1599–1605.
39. Zapletal M, Samanek T, Paul T. Lung Function in Children and Adolescents - Methods,
Reference Values. Basel, S. Karger AG, 1987.
40. Van Noord J, Clement J, Van de Woestijne K, Demedts M. Total respiratory resistance and
reactance as a measurement of response to bronchial challenge with histamine. Am Rev Respir Dis
1989; 139: 921–926.
41. McCarthy D, Spencer R, Greene R, Milic-Emili J. Measurement of "closing volume" as a simple
and sensitive test for early detection of small airway disease. Am J Med 1972; 52: 747–753.
42. Koulouris N, Valta P, Lavoie A, et al. A simple method to detect expiratory flow limitation during
spontaneous breathing. Eur Respir J 1995; 8: 306–313.
43. Rodenstein D, Francis C, Stanescu D. Airway closure in humans does not result in overestimation
of plethysmographic lung volume. J Appl Physiol: Respirat Environ Exercise Physiol 1983;
55: 1784–1789.
44. Brusasco V, Pellegrino R. Mechanics of ventilation. In: Gibson G, Geddes D, Costabel U, Sterk P,
Corrin B, eds. Respiratory Medicine. 3rd Edn. Vol. I. Edinburgh, Saunders, 2003; pp. 299–315.
45. Pride N, Macklem P. Lung mechanics in disease. In: Macklem P, Mead J, eds. Handbook of
Physiology. The Respiratory System. Mechanics of Breathing. Section 3, Vol. III, part 2. Bethesda,
MD, American Physiological Society, 1986; pp. 659–692.
46. American Thoracic Society. Lung function testing: selection of reference values and interpretative
strategies. Am Rev Respir Dis 1991; 144: 1202–1208.
47. Brown R, Hoppin F, Ingram R, Saunders N, McFadden E. Influence of abdominal gas on the
Boyle’s law determination of thoracic gas volume. J Appl Physsiol: Respirat Enrivon Exercise
Physiol 1978; 44: 469–473.
48. Desmond K, Demizio D, Allen P, Beaudry P, Coates A. An alternative method for the
determination of functional residual capacity in a plethysmograph. Am Rev Respir Dis 1988;
137: 273–276.
49. Peslin R, Gallina C, Rotger M. Methodological factors in the variability of lung volume and
specific airway resistance measured by body plethysmography. Bull Eur Physiopathol Respir 1987;
23: 323–327.
50. Jackson A, Gulesian P, Mead J. Glottic aperature during panting with voluntary limitation of tidal
volume. J Appl Physiol 1975; 39: 834–836.
51. DuBois AB, Brody A, Lewis D, Burgess B. Oscillation mechanics of lungs and chest in man. J Appl
Physiol 1956; 58: 587–594.
52. Loring S, Mead J. Abdominal muscle use during quiet breathing and hyperpnea in uninformed
subjects. J Appl Physiol 1982; 52: 700–704.
53. Pellegrino R, Wilson O, Jenouri G, Rodarte J. Lung mechanics during induced
bronchoconstriction. J Appl Physiol 1996; 81: 964–975.
M.D. GOLDMAN ET AL.
42
54. Jaeger M, Bouhuys A. Loop formation in pressure vs flow diagrams obtained by body
plethysmographic techniques. Body Plethymsmography. Prog Resp Res 1969; 4: 116–130.
55. Nitta K, Mochizuki M. Study of the time displacement between airflow and box pressure curves in
body plethysmography. Med Biol Engin 1967; 5: 481–487.
56. Ulmer W, Reif E, Weller W. Die obstruktiven Atemwegserkrankungen [Obstructive airway
disease]. Thieme 1969; Stuttgart.
57. O’Donnell D, Bertley J, Chau L, Webb K. Qualitative aspects of exertional breathlessness in
chronic airflow limitation: pathophysiologic mechanisms. Am J Respir Crit Care Med 1997;
155: 109–115.
58. O’Donnell D, Revill SM, Webb KA. Dynamic hyperinflation and exercise intolerance in chronic
obstructive pulmonary disease. Am J Respir Crit Care Med 2001; 164: 770–777.
59. O’Donnell D, Fluge T, Gerken F, et al. Effects of tiotropium on lung hyperinflation, dyspnoea and
exercise tolerance. Eur Respir J 2004; 23: 832–840.
WHOLE-BODY PLETHYSMOGRAPHY
43