who/bs/2011.2172 english only expert …whqlibdoc.who.int/hq/2011/who_bs_2011.2172_eng.pdfthis...
TRANSCRIPT
-
WHO/BS/2011.2172
ENGLISH ONLY
EXPERT COMMITTEE ON BIOLOGICAL STANDARDIZATION
Geneva, 17 to 21 October 2011
Collaborative Study to Evaluate the Proposed 1st WHO International
Standard for Epstein-Barr Virus (EBV) for Nucleic Acid Amplification
Technology (NAT)-Based Assays
Jacqueline F. Fryer
1,3, Alan B. Heath
2, Dianna E. Wilkinson
1, Philip D. Minor
1 and the
Collaborative Study Group *
1 Division of Virology and
2 Biostatistics
National Institute for Biological Standards and Control,
South Mimms, Potters Bar, Herts, EN6 3QG, UK
3 Study Coordinator; Tel +44 1707 641000, Fax +44 1707 641050,
E-mail [email protected]
* See Appendix 1
© World Health Organization 2011 All rights reserved. Publications of the World Health Organization are available on the WHO web site (www.who.int) or
can be purchased from WHO Press, World Health Organization, 20 Avenue Appia, 1211 Geneva 27, Switzerland (tel.:
+41 22 791 3264; fax: +41 22 791 4857; e-mail: [email protected]).
Requests for permission to reproduce or translate WHO publications – whether for sale or for noncommercial distribution
– should be addressed to WHO Press through the WHO web site
(http://www.who.int/about/licensing/copyright_form/en/index.html).
The designations employed and the presentation of the material in this publication do not imply the expression of any
opinion whatsoever on the part of the World Health Organization concerning the legal status of any country, territory, city
or area or of its authorities, or concerning the delimitation of its frontiers or boundaries. Dotted lines on maps represent
approximate border lines for which there may not yet be full agreement.
The mention of specific companies or of certain manufacturers’ products does not imply that they are endorsed or
recommended by the World Health Organization in preference to others of a similar nature that are not mentioned. Errors
and omissions excepted, the names of proprietary products are distinguished by initial capital letters.
All reasonable precautions have been taken by the World Health Organization to verify the information contained in this
publication. However, the published material is being distributed without warranty of any kind, either expressed or
implied. The responsibility for the interpretation and use of the material lies with the reader. In no event shall the World
Health Organization be liable for damages arising from its use. The named authors alone are responsible for the views
expressed in this publication.
WHO/BS/2011.2172
Page 2
Summary This report describes the development and worldwide collaborative study evaluation of the
candidate 1st WHO International Standard for Epstein-Barr virus (EBV) for use in the
standardization of nucleic acid amplification techniques (NAT). Proposals for the formulation of
the candidate standard were discussed at the Standardization of Genome Amplification
Techniques (SoGAT) Clinical Diagnostics meeting at NIBSC in June 2008. The candidate is a
whole virus preparation of the EBV B95-8 strain, formulated in a universal buffer comprising
Tris-HCl, human serum albumin, 0.1% trehalose, and freeze-dried for long-term stability.
Twenty-eight laboratories from 16 countries participated in a collaborative study to evaluate the
fitness for purpose and potency of the candidate standard using their routine NAT-based assays
for EBV. The freeze-dried candidate standard (Sample 1) was evaluated alongside the liquid bulk
of the candidate preparation (Sample 2), and preparations of Namalwa (Sample 3) and Raji
(Sample 4) cells. A wide range of extraction and amplification methodologies were used. The
majority of data sets returned were from commercial quantitative assays and all were based on
real-time PCR technology. The overall mean potency estimate for the candidate standard sample
1, across the different laboratory assays, was 5×10⁶ (6.7 log10) 'copies/mL'. The variability
between individual laboratory mean estimates for samples 1-4 was 2.5 log10. The agreement
between laboratories was markedly improved when the potency of the virus sample 2 was
expressed relative to the candidate standard (sample 1). The agreement for samples 3 and 4 was
also improved when the potency of these samples was expressed relative to the candidate
standard, however, the improvement was less marked than for sample 2. This suggests that the
whole virus reference might be most effective for standardizing assay results of clinical samples
comprising cell-free material. The utility of the candidate to standardize EBV measurements in
whole blood samples would benefit from further investigation. The overall data returned from
each laboratory indicated that there was minimal loss in potency upon freeze-drying. In addition,
the results obtained from accelerated thermal degradation studies at 4, 8 and 12 months indicate
that the candidate is extremely stable and suitable for long-term use.
The results of the study indicate the suitability of the candidate EBV B95-8 standard as the
proposed 1st WHO International Standard for EBV. It is therefore proposed that the candidate
standard (NIBSC code 09/260) be established as the 1st WHO International Standard for EBV for
NAT with an assigned potency of 5×10⁶ International Units (IU) when reconstituted in 1 mL of
nuclease-free water.
Introduction EBV is a ubiquitous herpesvirus with a high worldwide seroprevalence. Primary infection is
generally asymptomatic but occasionally leads to infectious mononucleosis (IM) in adolescents
and young adults. Following primary infection virus establishes life-long persistence in B cells.
EBV is associated with a range of malignancies, such as; Burkitt’s lymphoma, Hodgkin and non-
Hodgkin lymphoma, gastric and nasopharyngeal carcinoma (NPC), in immunocompetent
individuals. Immunocompromised individuals such as transplant recipients, AIDS patients, and
those with congenital immunodeficiencies, are at an increased risk of developing EBV-
associated lymphoproliferative diseases, associated with primary infection or reactivation. Post-
transplant lymphoproliferative disorder (PTLD) is a major complication among haematopoietic
stem cell (HSCT) and solid organ (SOT) transplant recipients, with primary EBV infection being
a major risk factor 1,2
.
The clinical utility of viral load measurements using NAT-based assays in the diagnosis and
management of EBV-associated infections has been described 1,2
. The monitoring of EBV DNA
in peripheral blood or plasma is widely applied in high-risk PTLD and NPC patients and is
critical for early intervention to prevent the development of disease and in monitoring the
WHO/BS/2011.2172
Page 3
response to therapy. However, there is no clear consensus on the timing or frequency of testing
or the best blood component to monitor. In the case of NPC, virus is principally measured in
plasma since EBV DNA is derived from the tumor cells and exists mainly as naked DNA.
Meanwhile in PTLD, EBV is both cell-associated and is released into the cell-free fraction of
blood. Although peripheral blood mononuclear cells, plasma and whole blood have all been used
successfully to detect EBV in transplant recipients, some studies suggest that whole blood is the
most appropriate sample to monitor as it captures both cell-free and cell-associated components
(reviewed in 1-3
).
The range of NAT assays used in the diagnosis and management of EBV-associated diseases
varies significantly. Laboratories use a range of DNA extraction and amplification
methodologies including commercial kits, or analyte-specific reagents (ASR), and laboratory-
developed assays which differ in the reagents (including primers and probes) and instrumentation
used. In addition, the quantification controls used to determine the concentration of viral DNA
present vary. These may comprise either a plasmid clone of the PCR target, quantified viral
DNA or virus particles, or cells containing specific copy numbers of the EBV genome, and may
or may not be included in the extraction step. Consequently, results may be reported as EBV
copies/mL, copies/µg, or copies/number of cells, depending on which control is used. Given the
heterogeneity of these NAT-based assay systems, and the lack of traceability to a standardized
reference system, it is difficult to compare viral load measurements between different
laboratories and to develop uniform therapeutic strategies. Indeed, variability in the performance
of different assays for EBV has been documented 4,5
. These studies have highlighted the need for
an internationally-accepted reference standard for EBV. In the absence of such a standard,
individual centres apply their own management algorithms and these vary between centres.
The WHO’s Expert Committee on Biological Standardization (ECBS) establishes reference
standards for biological substances used in the prevention, treatment or diagnosis of human
disease. WHO International Standards are recognized as the highest order of reference for
biological substances, and are arbitrarily assigned a potency in International Units (IU). Their
primary purpose is to calibrate secondary references used in routine laboratory assays, in terms
of the IU, thereby providing a uniform result reporting system, and traceability of measurements,
independent of the method used 6.
Proposals for the development of the 1st WHO International Standard for EBV were discussed at
the SoGAT Clinical Diagnostics meeting held at NIBSC in June 2008 7. Options for source
materials and formulation of the candidate standard were discussed 8. It was agreed that the
candidate standard would comprise a whole virus preparation of the prototype laboratory EBV
strain B95-8 9, and would be formulated in a universal buffer for further dilution in the sample
matrix appropriate to each assay. The use of whole virus would standardize the entire assay
including both extraction and DNA amplification steps. It was also agreed that the final
concentration would be in the order of 1×10⁷ ‘copies/mL’, and would be expressed in IU when
established. It was suggested that the candidate could be evaluated alongside preparations of
Namalwa 10
and Raji 11
cells, which contain 2 and 50-60 copies of the EBV genome respectively,
and which are present as episomes. These cells are sometimes used as secondary references for
the routine control of EBV NAT assays. The proposal was endorsed by the WHO ECBS in
October 2008.
The proposed standard is intended to be used in the in vitro diagnostics field and it relates to ISO
17511:2003 Section 5.5.
WHO/BS/2011.2172
Page 4
Aims of study The aim of this collaborative study is to determine the potency of the candidate standard using a
range of NAT-based assays for EBV, and to evaluate the suitability of the candidate for the
calibration of secondary reference materials and the standardization of EBV viral load
measurements.
Materials Candidate standard The proposed candidate standard comprises a cell-free live virus preparation of the prototype
laboratory EBV strain B95-8 9. This strain represents a well characterized EBV genome, and has
been fully sequenced (NCBI Reference Sequence: NC_007605.1 12
). The B95-8 strain is
classified as a Type 1 virus, based on the sequence of EBNA-2 and EBNA-3 genes. The B95-8
cells were sourced from the European Collection of Cell Cultures (ECACC). Given the wide
range of samples routinely tested for EBV, the candidate standard is formulated as EBV virions
in a universal buffer, comprising 10 mM Tris-HCl, human serum albumin (HSA) and 0.1%
trehalose (Tris-HSA-trehalose buffer), for further dilution in the appropriate sample matrix used
in each laboratory assay. This preparation has then been freeze-dried to ensure long-term
stability.
Preparation of bulk material A cell culture supernatant sample of EBV B95-8 strain was prepared by propagation of B95-8
cells incubated with 30 mg/mL 12-O-tetradecanoylphorbol-13-acetate (TPA) (adapted from JC
Lin 13
). The culture fluid was clarified by low speed centrifugation and virus pelleted by
ultracentrifugation. Virus pellets were resuspended to make a stock of virus in 200 mL 10 mM
Tris-HCl buffer (pH 7.4), containing 0.5% HSA (Tris-HSA buffer). The HSA used in the
production of the candidate standard and other study samples was derived from licensed products.
The plasma pools from which these products were derived were screened and tested negative for
anti-HIV-1, HBsAg, and HCV RNA.
The concentration of the EBV B95-8 stock was determined at NIBSC, using a laboratory-
developed real-time PCR assay (adapted from Kimura et al 14
). Briefly, 400 µL of sample
(1/1000 dilution of stock) was extracted using the QIAamp®
MinElute®
Virus Spin Kit
(QIAGEN, Hilden, Germany), on the QIAcube®
instrument. Five microlitres of purified nucleic
acid was then amplified by real-time PCR using the LightCycler®
480 Instrument (Roche
Applied Science, Mannheim, Germany). The target was quantified against serial dilutions of a
plasmid clone of the PCR target. The EBV DNA concentration was also assessed at NIBSC
using three commercial EBV assays (Roche LightCycler®
EBV Quant Kit, Nanogen EBV Q-
PCR Alert Kit and Argene EBV R-gene™ Quantification Kit), and in four clinical laboratories in
the UK using a range of laboratory-developed and commercial assays. The stock was diluted
1/8000 in Tris-HSA buffer and dispensed in 0.5 mL volumes prior to evaluation. The remainder
of the stock was stored at -80 °C until preparation of the final bulk. The geometric mean virus
concentration from all assays, in ‘copies/mL’, was used to determine a consensus EBV
concentration for the stock.
The bulk preparation was formulated to contain approximately 1×10⁷ EBV 'copies/mL' in a final
volume of 6.4 L Tris-HSA-trehalose buffer, and mixed for a total of 30 minutes using a magnetic
stirrer. Approximately 250 mL of the liquid bulk was dispensed in 1 mL aliquots into 2 mL
Sarstedt screw cap tubes and stored at -80 °C. The remaining bulk volume was immediately
processed for lyophilization in order to prepare the final product, NIBSC code 09/260.

WHO/BS/2011.2172
Page 5
Filling and lyophilization of candidate standard The filling and lyophilization of the bulk material was performed at NIBSC, and the production
summary is detailed in Table 1. The filling was performed in a Metall and Plastic
GmbH (Radolfzell, Germany) negative pressure isolator that contains the entire filling line and is
interfaced with the freeze dryer (CS150 12 m2, Serail, Arguenteil, France) through a ‘pizza door’
arrangement to maintain integrity of the operation. The bulk material was kept at 4 °C
throughout the filling process, and stirred constantly using a magnetic stirrer. The bulk was
dispensed into 5 mL screw cap glass vials in 1 mL volumes, using a Bausch & Strobel (Ilfshofen,
Germany) filling machine FVF5060. The homogeneity of the fill was determined by on-line
check-weighing of the wet weight, and vials outside the defined specification were discarded.
Filled vials were partially stoppered with halobutyl 14 mm diameter cruciform closures and
lyophilized in a CS150 freeze dryer. Vials were loaded onto the shelves at -50 °C and held at this
temperature for 4 hrs. A vacuum was applied to 270 µb over 1 hr, followed by ramping to 30 µb
over 1 hr. The temperature was then raised to -40 °C, and the vacuum maintained at this
temperature for 42.5 hrs. The shelves were ramped to 25 °C over 15 hrs before releasing the
vacuum and back-filling the vials with nitrogen. The vials were then stoppered in the dryer,
removed and capped in the isolator, and the isolator decontaminated with formaldehyde before
removal of the product. The sealed vials are stored at -20 °C at NIBSC under continuous
temperature monitoring for the lifetime of the product (NIBSC to act as custodian and worldwide
distributor).
Post-fill testing Assessments of residual moisture and oxygen content, as an indicator of vial integrity after
sealing, were determined for twelve vials of the freeze-dried product. Residual moisture was
determined by non-invasive near-infrared (NIR) spectroscopy (MCT 600P, Process Sensors,
Corby, UK). NIR results were then correlated to Karl Fischer (using calibration samples of the
same excipient, measured using both NIR and Karl Fischer methods) to give % w/w moisture
readings. Oxygen content was measured using a Lighthouse Infra-Red Analyzer (FMS-750,
Lighthouse Instruments, Charlottesville, USA).
Samples of the liquid bulk (n=24) and freeze-dried product (n=24) were tested by EBV real-time
PCR as described in the preparation of bulk material, in order to determine the homogeneity of
the product prior to dispatch for collaborative study.
Stability of the freeze-dried candidate Accelerated degradation studies are underway at NIBSC in order to predict the stability of
09/260 when stored at the recommended temperature of -20 °C. Vials of freeze-dried product are
being held at -70 °C, -20 °C, +4 °C, +20 °C, +37 °C, +45 °C. At specified time points during the
life of the product, three vials will be removed from storage at each temperature and EBV DNA
quantified by real-time PCR (as described above).
Study samples The freeze-dried candidate EBV B95-8 preparation was evaluated alongside the unprocessed
liquid bulk (used to prepare the freeze-dried candidate), and preparations of Namalwa and Raji
cells (both Type 1 strains). Namalwa and Raji cells were also sourced from the European
Collection of Cell Cultures (ECACC). Namalwa and Raji cells contain 2 and 50-60 episomal
copies of the EBV genome, respectively.
The Namalwa and Raji cells were propagated in RPMI-1640 medium containing 10% FCS,
supplemented with 2 mM L-glutamine, 100 IU/mL penicillin and 100 µg/mL streptomycin. The

WHO/BS/2011.2172
Page 6
cells were harvested from the culture medium and resuspended in PBS at a concentration of
1×10⁶ cells/mL. Cells were aliquotted in 1 mL volumes into 2 mL Sarstedt screw cap tubes and
stored at -80 °C. Aliquots of Namalwa (n=18) and Raji cells (n=18) were tested by EBV real-
time PCR (as described above), in order to determine the homogeneity of the samples prior to
dispatch for collaborative study. Study samples were stored at -20 °C (sample 1) and -80°C
(samples 2-4) prior to shipment to participants.
Study samples shipped to participants were coded as samples 1-4 and were as follows:
– Sample 1 (S1) - Lyophilized preparation 09/260 in a 5 mL screw cap glass vial.
– Sample 2 (S2) - 1 mL frozen liquid preparation of the EBV B95-8 bulk (used to prepare
freeze-dried candidate) in a 2 mL Sarstedt screw cap tube.
– Sample 3 (S3) - 1 mL frozen liquid preparation of Namalwa cells in a 2 mL Sarstedt screw
cap tube.
– Sample 4 (S4) - 1 mL frozen liquid preparation of Raji cells in a 2 mL Sarstedt screw cap tube.
Study design The aim of the collaborative study was to evaluate the suitability and potency of the candidate
EBV International Standard in a range of NAT based assays. Four vials each of study samples 1-
4 were sent to participating laboratories by courier on dry ice, with specific instructions for
storage and reconstitution.
Study protocol Participants were requested to test dilutions of each sample using their routine NAT-based assay
for EBV on four separate occasions, using a fresh vial of each sample in each independent assay.
In accordance with the study protocol (Appendix 2), the lyophilized sample 1 was to be
reconstituted with 1 mL of deionized, nuclease-free molecular-grade water and left for a
minimum of 20 minutes with occasional agitation before use. Meanwhile, study samples 2-4
were to be thawed and vortexed briefly before use.
Participants were requested to dilute samples 1-4 to within the quantitative range of the assay,
using the sample matrix specific to their individual assay, and to extract each dilution prior to
amplification. For quantitative assays, participants were requested to test a minimum of two
serial ten-fold dilutions within the linear range of the assay. For qualitative assays, participants
were requested to test ten-fold serial dilutions of each sample to determine the assay end-point,
and then a minimum of two half-log serial dilutions either side of the predetermined end-point,
for subsequent assays.
Participants were requested to report the viral load in ‘copies/mL’ (positive/negative for
qualitative assays) for each dilution of each sample and return results including details of
methodology used to NIBSC for analysis.
Participants Study samples were sent to 28 participants representing 16 countries (Appendix 1). Participants
were selected for their experience in EBV NAT and geographic distribution. They represented
mainly clinical laboratories, but also included manufacturers of in vitro diagnostic devices
(IVDs), reference and research laboratories. All participating laboratories are referred to by a
code number, allocated at random, and not representing the order of listing in Appendix 1.
Where a laboratory returned data using different assay methods, the results were analyzed
separately, as if from different laboratories, and are referred to as, for example, laboratory 1A,
1B etc.

WHO/BS/2011.2172
Page 7
Statistical methods Qualitative and quantitative assay results were evaluated separately. In the case of qualitative
assays, for each laboratory and assay method, data from all assays were pooled to give a number
positive out of number tested at each dilution step. A single ‘end-point’ for each dilution series
was calculated, to give an estimate of ‘NAT detectable units/mL’, as described previously 15
. It
should be noted that these estimates are not necessarily directly equivalent to a genuine genome
equivalent number/mL. In the case of quantitative assays, analysis was based on the results
supplied by the participants. Results were reported as ‘copies/mL’ although the relationship to
genuine genome equivalence numbers is unknown, with individual laboratories using different
methods and quantification controls to determine their copy number. For each assay run, a single
estimate of log10 ‘copies/mL’ was obtained for each sample, by taking the mean of the log10
estimates of ‘copies/mL’ across replicates, after correcting for any dilution factor. A single
estimate for the laboratory and assay method was then calculated as the mean of the log10
estimates of ‘copies/mL’ across assay runs.
Overall analysis was based on the log10 estimates of ‘copies/mL’ or ‘NAT detectable units/mL’.
Overall mean estimates were calculated as the means of all individual laboratories. Variation
between laboratories (inter-laboratory) was expressed as standard deviations (SD) of the log10
estimates and % geometric coefficient of variation (%GCV) 16
of the actual estimates. Potencies
relative to sample 1, the candidate International Standard, were calculated as the difference in
estimated log10 ‘units per mL’ (test sample – candidate standard) plus a candidate assigned value
in International Units/mL (IU/mL) for the candidate standard. So for example, if in an individual
assay, the test sample is 0.5 log10 higher than the candidate standard, and the candidate standard
is assigned 6.7 log10 IU/mL, the relative potency of the test sample for that assay is 7.2 log10
IU/mL. Potencies were also calculated relative to sample 3, in the same manner.
Variation within laboratories and between assays (intra-laboratory), was expressed as standard
deviations of the log10 estimates and %GCVs of the individual assay mean estimates. The
significance of the inter-laboratory variation relative to the intra-laboratory variation was
assessed by an analysis of variance. A component of variance analysis was used to assess the
relative magnitude of the inter-laboratory and intra-laboratory variability.
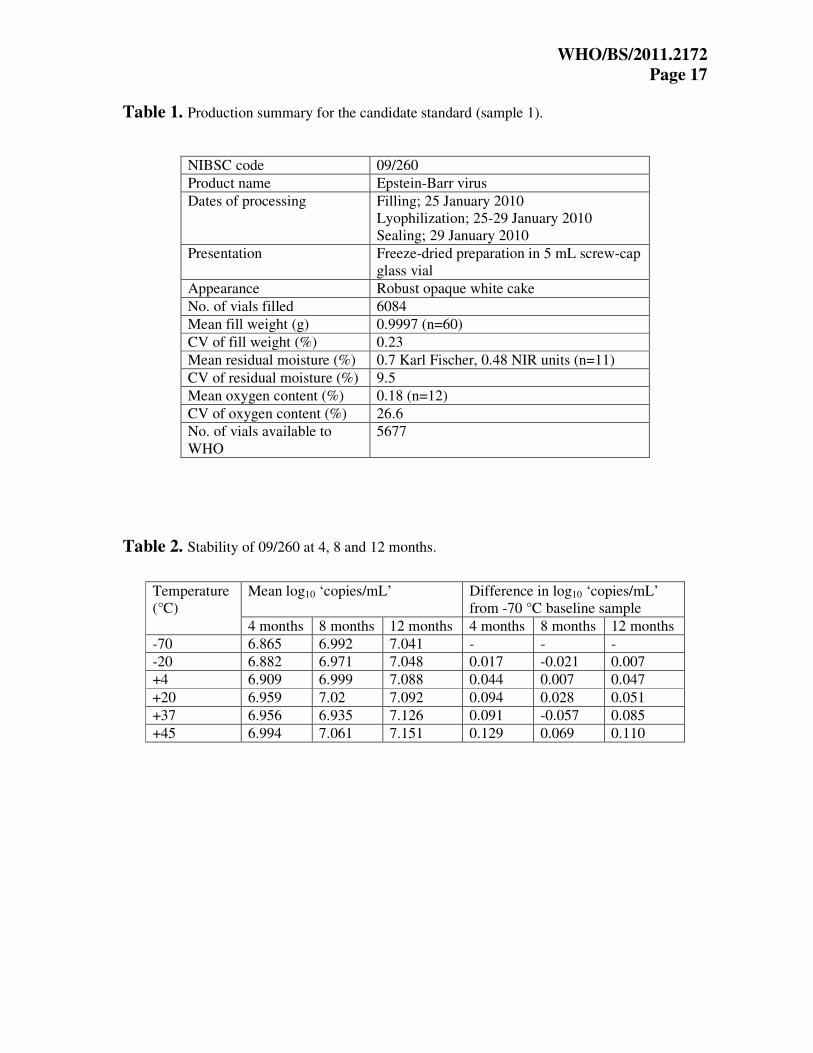
Results and data analysis Validation of study samples and stability assessment Production data for the candidate standard sample 1 showed that the CV of the fill mass and
mean residual moisture were within acceptable limits for a WHO International Standard (Table
1). Residual oxygen content was within the NIBSC working limit of 1.1%. Evaluation of
multiple aliquots of each study sample (n=24 each for study samples 1 and 2, n=18 each for
study samples 3 and 4) at NIBSC prior to dispatch indicated that the homogeneity of EBV
content was similar for all study samples (2SD less than 0.2 log10 ‘copies/mL’ for each sample).
Samples of the candidate standard 09/260 were stored at elevated temperatures, and assayed at
NIBSC concurrently with samples stored at -20 °C and -70 °C, after 4, 8 and 12 months of
storage, by EBV real-time PCR (as described in the preparation of bulk material). At each time
point, three vials of samples stored at each temperature were extracted and amplified in triplicate.
The mean estimated log10 ‘copies/mL’ and differences (log10 ‘copies/mL’) from the -70 °C
baseline sample are shown in Table 2. A negative value indicates a drop in potency relative to
the -70 °C baseline. 95% confidence intervals for the differences are ±0.10 log10 based on a
pooled estimate of the standard deviation between individual vial test results. Only the results at
+45 °C for 4 months and 12 months are outside these confidence limits and are statistically
WHO/BS/2011.2172
Page 8
significantly different from zero. There does appear to be a pattern of apparent increase in
potency with increasing temperature although there is no observable change in potency across
the course of the 12 month stability study at any temperature. The reason for this apparent
increase in potency at the higher temperatures is not clear, but it was also observed in the
stability studies for the recently established International Standard for human cytomegalovirus
(HCMV) 17
. As there is no observed drop in potency it is not possible to fit the usual Arrhenius
model for accelerated degradation studies, or obtain any predictions for the expected loss per
year with long-term storage at -20 °C. However, using the ‘rule of thumb’ that the decay rate will
approximately double with every 10 °C increase in temperature (personal communication: Dr. P
K Philips), and noting that there is no detectable drop in potency after 12 months at +20 °C, then
there should be no detectable difference after 96 months (8 years) at -20 °C. A similar argument
applied to the +37 °C data would imply no detectable loss after 30 years at -20 °C. However,
with the unexplained trend for an apparent increase in potency at the higher temperatures,
extrapolations based on the +37 °C data may not be reliable. In summary, there is no evidence of
degradation at any temperature after storage for 12 months. It is not possible to obtain precise
estimates of any degradation rates for long-term storage at -20 °C. All available data indicates
adequate stability. Subsequent testing will take place at 18 months, then at 2, 3, 4, and 5 years.
The stability of the material when reconstituted has not been specifically determined. Therefore,
it is recommended that, when established, the standard is for single use only.
Data received
Data were received from all 28 participating laboratories. Participants performed a variety of
different assay methods, with some laboratories performing more than one assay method. In total,
data sets were received from 36 quantitative assays, and 2 qualitative assays. Apart from the
cases noted below, there were no exclusions of data.
Qualitative Assays:
Laboratory 17 used 1.0 log10 dilutions for all assays.
Laboratory 20 had positive results for sample S1 for nearly all dilutions.
These factors will result in reduced precision for the relevant estimates. No data were excluded
however.
Quantitative Assays:
Laboratory 1 returned no data for S4 in assay 4, reporting an ‘empty vial’.
Laboratory 3 noted for S3 and S4 ‘after defrosting sample contained small particles’.
Laboratory 4 (A&B) had results, after correction for dilution factors, that were high at higher
dilutions (10-4
& 10-5
) compared to other dilutions. Also the results at neat were high compared
to those from the 10-1
to 10-3
dilutions. Only the results from the 10-1
, 10-2
and 10-3
dilutions
were used for subsequent analysis.
Laboratory 6 had no data for S4 from assay 4. They reported some estimates of S3 as 0 at the 10-
3 dilution. All data for S3 at 10
-3 were excluded.
Laboratory 7 reported one estimate for S3 from assay 2 at the 10-2
dilution as outside the range of
the assay. All estimates for S3 at this dilution for this assay were excluded.
Laboratory 9 continued their dilution range until they obtained ‘undetectable’ for their
quantitative assays. Only estimates > 100 copies/mL were used in subsequent calculations.
Laboratory 10 had variable estimates with the results for assay 1 for S1, S2 and S4 being
approximately 1.0 log lower than for subsequent assays. No data were excluded however.
Laboratory 14 had results that were ‘undetected’ or below the linear range of the assay at higher
dilutions. Only results from the first two dilution steps were used in subsequent analysis.
WHO/BS/2011.2172
Page 9
Laboratory 16 had very low estimates at higher dilutions. Only estimates > 50 copies/mL were
used in subsequent calculations.
Laboratory 18 had results for S3 at higher dilutions that were low relative to the neat sample.
They were also the lowest estimates for all samples. Only the estimates from the neat sample for
S3 were used, in case the higher dilutions were giving estimates outside the range of the assay.
Laboratory 20 had some results at 10-3.5
and 10-4
that appeared inconsistent with other dilutions.
Only the results from the 10-1
, 10-2
and 10-3
dilutions were used for subsequent analysis.
Laboratory 21 had ‘positive but non-quantifiable’ results for some replicates at the 10-3
dilution.
All data at the 10-3
dilution were excluded.
Summary of assay methodologies The majority of participants prepared dilutions of study samples 1-4 using either plasma or
whole blood, however, other diluents (PBS, DMEM, 10 mM Tris, and nuclease-free water) were
also used. The extent of the dilutions performed varied slightly between each laboratory.
Extractions were predominantly automated, and employed a range of instruments including;
QIAGEN’s QIAsymphony SP and RG Q, BioRobot, QIAcube, and EZ1 Advanced, bioMérieux
NucliSENS®
easyMag®
, Roche MagNA Pure LC and MagNA Pure Compact. Manual extraction
protocols included; Roche High Pure Viral Nucleic Acid Kit, Nanogen EXTRAgen®
,
EXTRAcell®
, and EXTRAblood®
, QIAGEN QIAamp (DNA Blood and DNA) Mini Kits,
QIAGEN QIAamp DSP Virus Kit, Cepheid affigene®
DNA Extraction Kit, bioMérieux
NucliSENS®
miniMAG®
, and heat treatment (60 °C for 2 hrs then 95 °C for 10 mins) in
‘Cracking buffer’.
All data sets reported the use of real-time PCR technology. Fourteen participants used
commercial assays and reagents (20 data sets), while 12 participants used laboratory-developed
assays (14 data sets). Two participants used both commercial and laboratory-developed assays (4
data sets). Commercial assays and reagents included; Nanogen EBV Q-PCR Alert, Argene EBV
R-gene™, QIAGEN artus®
EBV (LC and RG) PCR Kits, Roche LightCycler®
EBV Quant Kit,
Cepheid’s affigene®
EBV trender and SmartEBV™, ELITech/Epoch EBV ASR, and
Quantification of HHV4 PrimerDesign™ Ltd. The range of EBV PCR targets included; EBNA-1,
EBNA-2, BNRF1 p143, BXLF1, EBER1, BALF5 and BamHI-W. Amplification platforms
included; Roche LightCycler®
1.5, 2.0 and 480 systems, Applied Biosystems™ 7300, 7500,
7500 Fast, and 7900 HT Fast Real-Time PCR Systems, Agilent Mx3000P®
QPCR System,
QIAGEN Rotor-Gene™ Q, Rotor-Gene™ 3000, and Cepheid SmartCycler™ II. Given the range
of assay combinations and variables, and the fact that no two assays were alike (apart from two
laboratories using the Roche MagNA Pure LC instrument in combination with the QIAGEN
artus®
EBV LC PCR Kit), it was not possible to group methods and perform analysis according
to the method used.
Estimated potencies of study samples The laboratory mean estimates of ‘copies/mL’ (log10) from the quantitative assays and ‘NAT
detectable units/mL’ (log10) from the qualitative assays are shown in Tables 3 and 4 respectively.
The individual laboratory mean estimates are also shown in histogram form in Figures 1a-1d.
Each box represents the mean estimate from one laboratory, and the boxes are labeled with the
laboratory code number. The results from the qualitative assays are labeled Q.
From the figures it is clear that there is considerable variation between laboratories, for all
samples, with estimates differing by up to 2.5 log10. The estimates of ‘NAT detectable units/mL’
from the qualitative assay from laboratory 17 are low for all samples. The estimates from the
qualitative assay from laboratory 20 are closer to the estimates from the majority of quantitative
assays. However, the results from qualitative and quantitative assays are not directly comparable,
as ‘NAT detectable units/mL’ obtained from dilution series of qualitative assays are not

WHO/BS/2011.2172
Page 10
necessarily equivalent to the estimates of ‘copies/mL’ from quantitative assays. The method of
determining an estimate of ‘NAT-detectable units/mL’ is based on an end-point dilution series
(diluting until negative), makes no allowance for extraction efficiency, and is not calibrated
against any measure of genuine copy numbers.
The estimates of ‘copies/mL’ from laboratory 10 are lower than other laboratories for all samples.
The results from laboratory 16 are also generally low for S1, S2 and S4. The quantitative results
from laboratory 17 are low for S3 and S4 (cellular material) but not for S1 and S2. It is also
notable that laboratory 12 has estimates that are central or slightly lower compared to the
majority of other laboratories for samples S1 and S2, but estimates that are high compared to
other laboratories for the cellular materials S3 and S4. Individual laboratory results in Figures
1a-d are colour coded according to the diluent used in the assay (i.e. dark grey, whole blood;
light grey, plasma; white, other) and show no apparent relationship between matrix and estimate
of ‘copies/mL’.
Table 5 shows the overall mean estimates of log10 ‘copies/mL’ from the quantitative assays, and
log10 ‘NAT-detectable units/mL’ from the qualitative assays, along with the standard deviation
(of log10 estimates) and the %GCV (of actual estimates). Standard deviations and %GCVs were
not calculated for the qualitative assays, as there were only two laboratories performing
qualitative assays. The quantitative assays have SD’s around 0.6 log10, and %GCVs around 270 -
330%. These figures are consistent with the observed ranges of estimates of over 2.5 log10.
Comparison of overall mean estimates for the freeze-dried candidate sample 1 and liquid bulk
sample 2 indicates that there was a small decrease of 0.04 log10 in potency upon freeze-drying
(Table 5), which was marginally statistically significant (p=0.029).
Table 6 shows the overall mean estimates from all the quantitative assays again, along with
equivalent figures obtained by excluding the results from laboratories 10, 12, 16 and 17. These
laboratories were noted above as having either low estimates, or an apparent differential
efficiency for cellular material compared to the cell-free virus preparations (S3 & S4 compared
to S1 & S2), and did not share similarities in assay methodology. After excluding these
laboratories, the SD’s are around 0.5 log10, with %GCVs around 200%, which is similar to the
variability observed between laboratories in the recent collaborative study to establish an
International Standard for HCMV 17
. This comparison illustrates that the large variability
observed between results is not simply due to a few individual laboratories. There is no
justification for excluding these laboratories simply because of the results achieved, and the
comparisons are presented for illustration only.
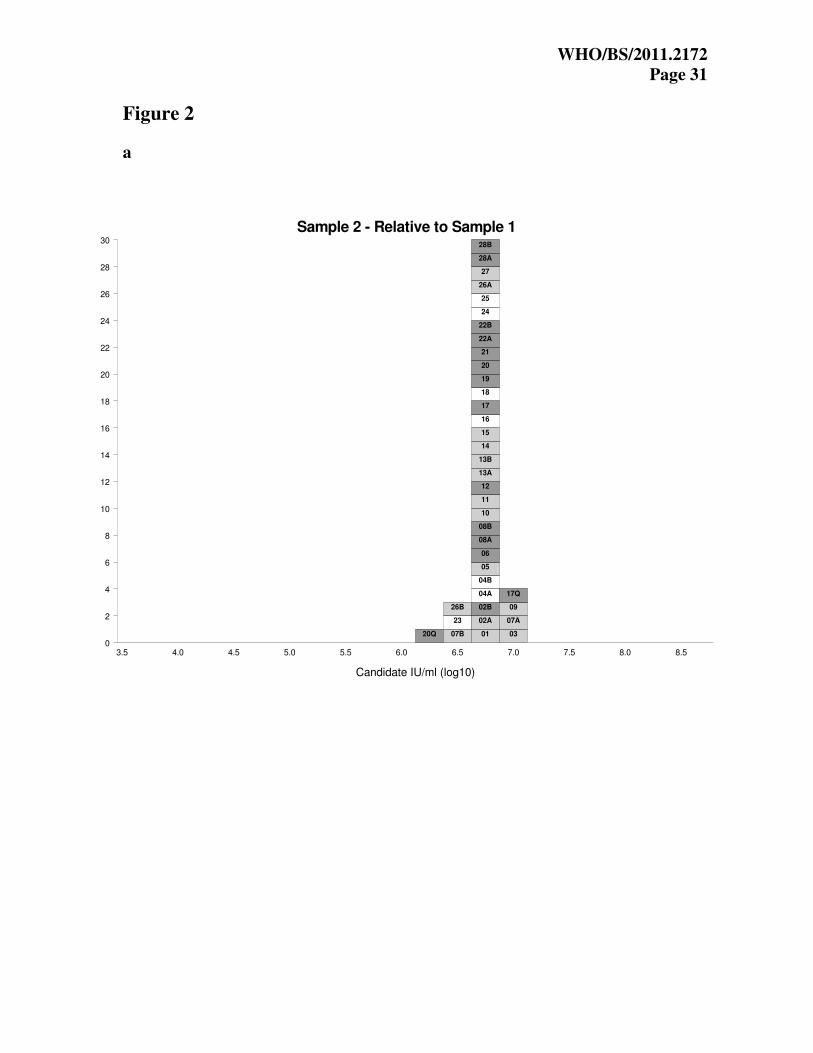
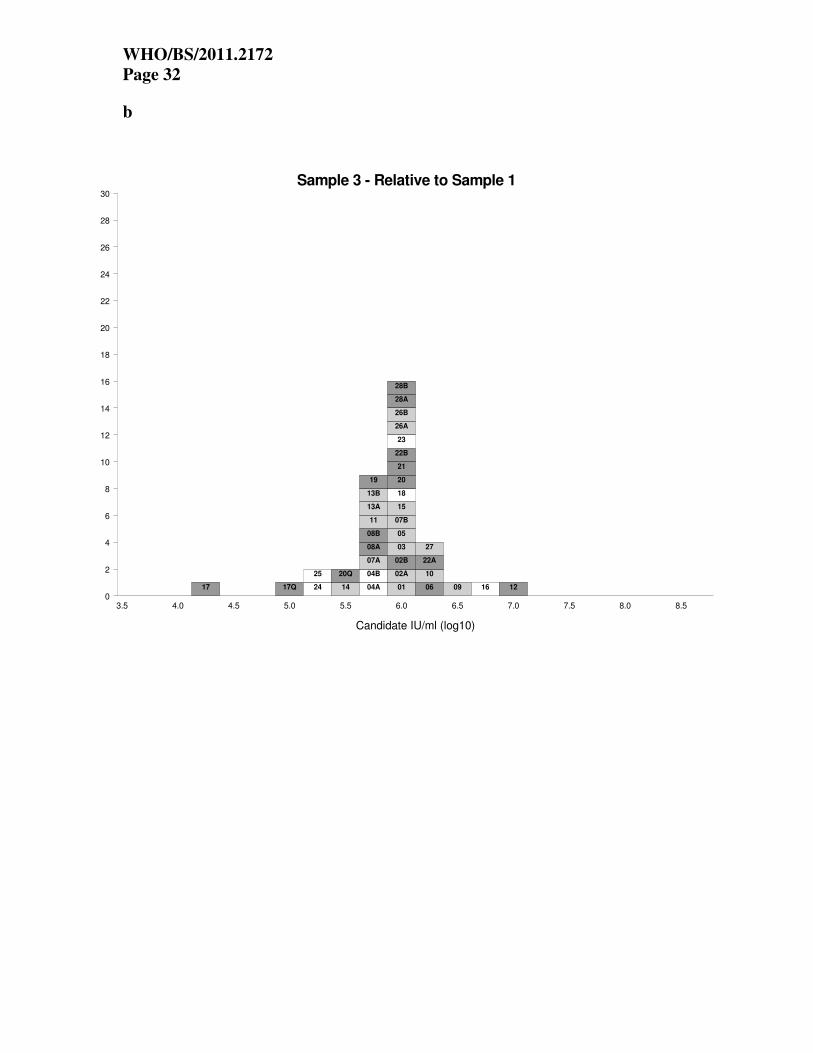
Potencies relative to sample 1 The expression of potency of samples 2-4 relative to sample 1 allows an assessment of the
suitability of the candidate standard for the standardization of EBV NAT assays.
The estimated concentrations of samples 2-4 were expressed as relative potencies in IU, by
comparison to the candidate standard sample 1, using a hypothetical unitage of 5x10⁶ IU/mL (6.7
log10 IU/mL) for sample 1, as described in the statistical methods section (in this case, the
hypothetical unitage is based on the overall mean laboratory estimate for sample 1). The
laboratory mean estimates are shown in Tables 7 and 8 for the quantitative and qualitative assays
and respectively. Units are candidate log10 IU/mL in both cases. The results are also shown in
histogram form in Figures 2a-2c.
From Figure 2a, it is clear that for sample 2 there is a big improvement in agreement between
laboratories, with the vast majority of laboratories obtaining estimates within 0.5 log10. For
samples 3 and 4 (Figures 2b and 2c), there is some improvement but there are still ranges of
estimates of up to 2.0 log10.
The overall mean estimates of samples S2, S3 and S4 relative to S1, in candidate IU/mL, are
shown in Table 9 for the qualitative and quantitative assays, along with the standard deviation
WHO/BS/2011.2172
Page 11
(of log10 estimates) and the %GCV (of actual estimates). For S2, the SD is reduced to 0.09 log10
from 0.57 log10, while the %GCV is reduced to 23% from 270%. For S3 and S4 there is a
reduction from an SD of around 0.6 log10 to 0.46 log10, and a reduction in %GCV from around
300% to 187%. The improvement from expressing results in IU relative to the candidate standard
S1 is therefore very marked for S2, the same unprocessed liquid bulk material used in the
preparation of S1, but less marked for the cellular materials S3 and S4.
Table 10 shows the overall mean estimates from all the quantitative assays again, along with
equivalent figures obtained by excluding the results from laboratories 10, 12, 16 and 17.
Exclusion of data from these four individual laboratories does improve the agreement between
the remaining laboratories for S3 and S4 expressed relative to S1, reducing the %GCV from
187% to 84% for S3 and 130% for S4. These figures are still much higher than the 23% for S2.
Looking at Figures 2b and 2c, it is clear that laboratory 17 (quantitative) produced very low
estimates for S3 & S4 relative to S1, while laboratory 12 produced high estimates relative to S1.
This is a result of the apparent differential sensitivity of the assays from these laboratories for the
cell preparations of S3 & S4, compared to their results with S1 & S2 (cell-free virus
preparations). Laboratory 17 produced lower results for cellular material compared to the cell-
free virus, while laboratory 12 is the other way round. In contrast, laboratory 10, which has low
results compared to other laboratories for all samples, has estimates for S2, S3 and S4 relative to
S1 that are consistent with the other laboratories.
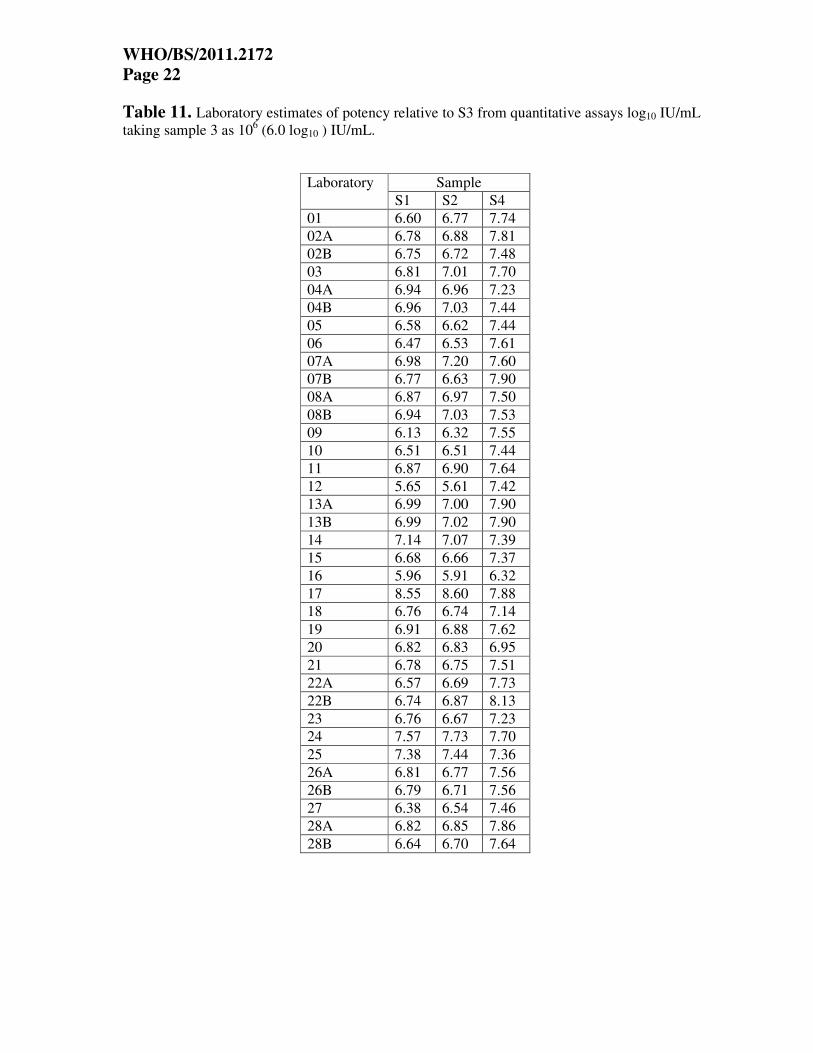
Potencies relative to sample 3 The estimated concentrations of samples S1, S2 and S4 were also expressed relative to sample
S3, using a hypothetical unitage of 106 IU/mL (6.0 log10 IU/mL) for sample 3 (in this case, the
hypothetical unitage is based on the overall mean laboratory estimate for sample 3). The
laboratory mean estimates are shown in Tables 11 and 12 for the quantitative and qualitative
assays respectively. Units are candidate log10 IU/mL in both cases. The results are also shown in
histogram form in Figures 3a-3c.
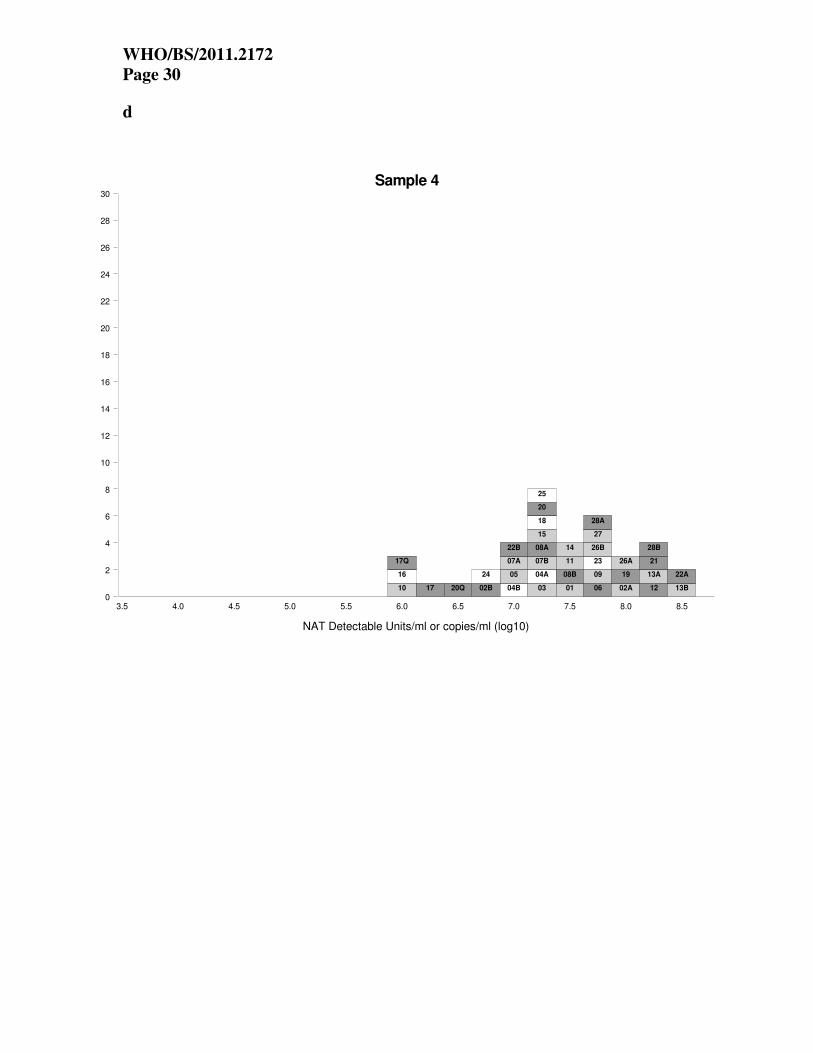
The overall mean estimates of samples S1, S2 and S4 relative to S3, in candidate IU/mL are
shown in Table 13 for the qualitative and quantitative assays, along with the standard deviation
(of log10 estimates) and the %GCV (of actual estimates).
From the figures and Table 13, there is some reduction in between-laboratory variability, with
the SD for quantitative assays for S1 and S2 reducing from 0.58/0.57 to 0.46/0.47, and %GCVs
reducing from 277%/270% to 187%/197%. The improvement is greatest for S4 relative to S3,
with SD reducing from 0.63 to 0.32, and %GCV reducing from 327% to 107%.
Table 14 shows the overall mean estimates from all the quantitative assays again, along with
equivalent figures obtained by excluding the results from laboratories 10, 12, 16 and 17.
Exclusion of data from these four individual laboratories does improve the agreement between
the remaining laboratories for S1, S2 and S4 expressed relative to S3, reducing the %GCV from
187% to 84% for S1, from 197% to 86% for S2, and from 107% to 76% for S4. Looking at
Figures 3a and 3b, laboratories 12 and 17 produced results for S1 and S2 relative to S3 that are
outside the range of other laboratories. Again, this is a result of the differential sensitivity of the
assays from these laboratories for the cell preparations (S3 & S4), compared to their results with
cell-free virus preparations (S1 & S2), noted above.
Inter and intra-laboratory variation Table 15 shows the intra-laboratory (between assay) standard deviations and %GCVs for the
quantitative assays for each laboratory. There are differences between the repeatability of
laboratory estimates across assays for all samples. The average standard deviation is 0.14/0.15

WHO/BS/2011.2172
Page 12
log10 for samples S1 and S2 (a %GCV of around 40%). For samples S3 and S4 the average SD is
higher at 0.26 log10 (a %GCV of 81%). This indicates that in general assays of the cell
preparations were less repeatable than for the cell-free virus samples. Some individual
laboratories have poor repeatability, for example laboratory 10 for all samples, or laboratory 7A
for samples S3 and S4 (7A used a separate cell-specific extraction method for S3 and S4).
Table 16 shows the results of a ‘Components of Variance’ analysis for the quantitative assays.
Briefly, this analysis breaks down the observed variability in results to a ‘between-laboratory’
component, and a ‘between-assay’ component, allowing for the fact that the observed laboratory
means are based on a mean of four assays in most cases. The analysis assumes that the between-
assay component is the same across laboratories. The results in Table 15 suggest that this is not
the case, so the results are very much an “average” component.
In all cases, the between-laboratory variation was statistically significant (p<0.0001), i.e. the
observed differences between laboratories was not accounted for by between-assay variability
alone. This was true for the results expressed relative to either sample S1 or sample S3 as well as
for the absolute estimates of ‘copies/mL’. Table 16 shows the variance components as both
standard deviations (of log10 estimates) and %GCVs. The equivalent results excluding
laboratories 10, 12, 16 & 17 are also shown in Table 17.
Looking at the %GCVs in Table 16, the components for estimates of absolute ‘copies/mL’
confirm that the within laboratory (between-assay) variability for S3 and S4 is double that for S1
and S2. The figures are equivalent to the pooled estimates in Table 15, with slight rounding
differences based on the methods of calculation. The between-laboratory component is much
greater at around 300%, compared to 40% between-assay for S1/S2 and 80% for S3/S4. The
between-laboratory component is reduced to around 200% if laboratories 10, 12, 16 and 17 are
excluded (Table 17), while the within-laboratory components are reduced to 30 or 70%. The
reduction in average within-laboratory (between-assay) variability when excluding these four
individual laboratories is because laboratory 10 in particular has a very high between-assay
variability (see Table 15).
When expressing results relative to sample S1, the between-assay components are similar for S3
and S4, and lower for S2. The between-laboratory components are reduced from around 300%,
greatly for S2 to 19%, and less so to a little below 200% for S3 and S4. When expressing results
relative to sample S3, the between-assay components are around 90% for all samples. The
between-laboratory components are around 200% for S1 & S2, and around 100% for S4.
In conclusion, the use of a relative potency can reduce the between-laboratory variation.
However, this is most effective when using a standard of a similar nature to the test sample. S1 is
the most effective for reducing variability in estimates for S2, while S3 is most effective for
reducing variability in estimates for S4. Expressing S2 relative to S1 gives extremely good
agreement between laboratories. However, since S1 and S2 are essentially the same material, this
is to be expected. The within-laboratory (between-assay) variability is greater for S3 & S4 than
S1 & S2. For all samples, there is significant between-laboratory variation in addition to the
between-assay variation.
Discussion and conclusions In this study, a range of NAT-based assays for EBV have been used to determine the potency
and evaluate the suitability of the candidate standard preparation as the 1st WHO International
Standard for EBV. The candidate comprises a whole virus preparation of the prototype
laboratory EBV strain B95-8. This strain was chosen because it is well characterized and widely
used to design NAT-based assays for EBV. It is also used as a secondary reference for routine
control of assays. The use of a whole virus preparation, allows the candidate to be extracted
alongside clinical samples thereby standardizing the entire EBV assay. In addition, because of
the range of patient samples routinely tested for EBV, the candidate has been formulated in a
WHO/BS/2011.2172
Page 13
universal buffer for further dilution in the sample matrix appropriate to each EBV assay. This
allows the matrix of the candidate standard to be as similar as possible to that of the test analyte.
The material was freeze-dried to ensure long-term stability, and the production data suggests that
the batch is homogeneous.
In the collaborative study, the freeze-dried candidate standard was evaluated alongside the liquid
bulk of the B95-8 strain and preparations of Namalwa and Raji cells. These cell preparations
were chosen as they are also sometimes used as secondary references for the routine control of
EBV NAT assays. The overall mean estimate for the candidate standard (S1) was 5×10⁶ (6.7
log10) 'copies/mL'. Individual laboratory mean estimates ranged from 5.03 to 7.56 log10
‘copies/mL’. The target concentration for the candidate standard was 1×10⁷ ‘copies/mL’, based
on preliminary testing of the B95-8 stock at NIBSC and in a selection of UK clinical laboratories.
The small difference between the overall mean estimate and the target concentration for the
candidate standard is likely to be a result of the selection of a small subset of laboratories for
preliminary testing, and the large inter-laboratory variation observed in assay results.
The overall range in laboratory mean estimates for all study samples was 2.5 log10. This
variability reflects the range and differences in diagnostic testing procedures between
laboratories and is similar to levels previously reported for EBV NAT assays 4. The agreement
between laboratories for virus sample 2 was markedly improved when the potency was
expressed relative to the candidate standard (S1), demonstrating the suitability of the candidate to
standardize assays of whole virus samples. The agreement between laboratories for cell samples
3 and 4 was also improved when the potencies were expressed relative to the candidate standard
(S1), however, the improvement was less marked than for sample 2. This may be due to greater
variability in the extraction efficiencies for cellular samples or possible heterogeneity of the cell
samples S3 and S4.
Inter-laboratory variability was significantly higher than intra-laboratory variability, as
determined for other studies 4,5
. Intra-laboratory variability was higher for cell-based samples S3
and S4 compared to virus samples S1 and S2. This finding was also reported by Preiksaitis et al 4,
illustrating the possible differences in and the need to validate extraction efficiencies between
cell-free and cell-based samples. The overall data returned from each laboratory indicates that
there was minimal loss in potency upon freeze-drying. The results obtained from accelerated
thermal degradation studies at 4, 8 and 12 months indicate that the candidate is stable and
suitable for long-term use.
It was noted that a PCR target based on the BamHI-W repeat fragment was used by two
participants (laboratories 10 and 15). This fragment is repeated approximately 6-20 times in
different EBV isolates, which can lead to over-quantification of EBV DNA in certain sample
types (e.g. plasma), especially when these contain fragmented DNA. Therefore, the use of this
sequence in EBV viral load measurement is generally not advised (personal communication: Prof.
J Middeldorp). However, in this evaluation laboratories 10 and 15 did not report higher EBV
concentrations for these study samples compared to other participants.
The matter of commutability of the candidate standard for clinical EBV samples has not been
specifically assessed in this study. Commutability is determined by a range of factors including
the matrix and molecular variants of the analyte (i.e. intracellular vs. extracellular or
encapsidated vs. naked nature of the DNA, and EBV strain variants), both of which can also be
affected by processing steps.

WHO/BS/2011.2172
Page 14
The differing pathology of EBV infections in the various disease states is such that a range of
types of patient samples (described in the introduction), particularly different blood components,
are routinely tested for EBV DNA. The idea behind preparing the candidate in a universal matrix
for subsequent dilution in the sample matrix appropriate to each assay was to control for some
matrix effects. Study results suggested that there was no apparent relationship between matrix
used as the diluent and the estimate of ‘copies/mL’. However, it is evident that cell-free virus
diluted in whole blood does not represent an EBV-positive whole blood from an
immunosuppressed individual, where virus is cell-associated at least in part. Indeed, the results
suggest that there was a difference in the ability of the candidate to reduce the variability of viral
load measurements of cell-free vs. cell-associated EBV preparations. This may again be due to
the different efficiencies in extracting different sample types, possible heterogeneity of the cell
samples S3 and S4, or to other matrix effects.
In addition, the nature of the EBV DNA present within each sample type differs depending on
the disease state and stage of infection. EBV DNA in the plasma of NPC patients is principally
naked and fragmented 18
. Meanwhile in PTLD, it is cell-associated although smaller amounts of
naked DNA and encapsidated virus (in primary infection) may also be present in plasma. In this
study, the candidate standard is derived from a crude cell-free preparation of EBV from cell
culture, which comprises both whole virus and naked EBV DNA (as determined by DNase
digestion experiments – data not shown). All assays used in the collaborative study evaluation
were able to detect the three EBV Type I strains represented in the study, suggesting that the
candidate International Standard would be suitable for the calibration of secondary references
comprising these viruses. It was not feasible to examine further EBV strains (such as Type II
strains) within the context of this collaborative study because of the work load required by the
participants. However, the majority of EBV NAT assays do not distinguish between EBV types.
The complexity of EBV pathology, in terms of the sample types and nature of virus examined in
the management of EBV infections, makes it difficult to produce a universal reference material
to be used as an International Standard. A further commutability study will be performed to
assess the commutability of this material with respect to EBV DNA forms present in different
clinical samples, and to determine whether a cell-associated EBV reference might be more
suitable for the standardization of assays used to monitor EBV in whole blood from transplant
recipients. It is likely that the preparation of such a freeze-dried reference would be difficult
because of the need to maintain cell structure during the freeze-drying process. Despite this, the
implementation and use of the candidate preparation evaluated in this study as an International
Standard for EBV will facilitate the characterization and standardization of the factors that
contribute to assay variability, and assist in the development of uniform management strategies
for EBV-associated diseases.
Proposal It is proposed that the candidate standard (NIBSC code 09/260) is established as the 1
st WHO
International Standard for EBV for use in NAT-based assays, with an assigned potency of 5×10⁶
International Units when reconstituted in 1 mL of nuclease-free water. This value is arbitrary but
represents the consensus estimate for the candidate across the wide range of qualitative and
quantitative laboratory assays used in this collaborative study. The uncertainty can be derived
from the variance of the fill and is 0.23%. The proposed standard is intended to be used by
clinical laboratories and IVD manufacturers to calibrate secondary references used in routine
NAT-based assays for EBV. Proposed Instructions for Use (IFU) for the product are included in
Appendix 3.
WHO/BS/2011.2172
Page 15
Comments from participants Ten of twenty-eight participants responded to the report. There were no disagreements with the
suitability of the candidate standard (NIBSC code 09/260) to serve as the 1st WHO International
Standard for EBV for NAT. The majority of comments suggested editorial changes and these
have been implemented where appropriate.
Acknowledgements We gratefully acknowledge the important contributions of the collaborative study participants.
We would also like to thank the selected UK clinical laboratories (Dr Melvyn Smith, London
South Specialist Virology Centre; Dr Martin Curran, Clinical Microbiology and Public Health
Laboratory, Addenbrookes Hospital , Cambridge ; Dr Mehmet Yavuz, STH
Microbiology/Virology, Northern General Hospital, Sheffield; Dr Pamela Molyneaux, Virology
Laboratory, Department of Medical Microbiology, Aberdeen Royal Infirmary) for performing
preliminary testing of the EBV B95-8 stock.
References 1. Kimura H, Ito Y, Suzuki R, Nishiyama Y. Measuring Epstein-Barr virus (EBV) load: the
significance and application for each EBV-associated disease. Rev Med Virol. 2008;18:305-
19.
2. Gärtner B, Preiksaitis JK. EBV viral load detection in clinical virology. J Clin Virol.
2010;48:82-90.
3. Gulley ML, Tang W. Using Epstein-Barr viral load assays to diagnose, monitor, and prevent
post-transplant lymphoproliferative disorder. Clin Micro Reviews. 2010;23:350-66.
4. Preiksaitis JK, Pang XL, Fox JD, Fenton JM, Caliendo AM, Miller GG; American Society
of Transplantation Infectious Diseases Community of Practice. Interlaboratory comparison
of epstein-barr virus viral load assays. Am J Transplant. 2009;9:269-79.
5. Hayden RT, Hokanson KM, Pounds SB, Bankowski MJ, Belzer SW, Carr J, Diorio D,
Forman MS, Joshi Y, Hillyard D, Hodinka RL, Nikiforova MN, Romain CA, Stevenson J,
Valsamakis A, Balfour HH Jr; U.S. EBV Working Group. Multicenter comparison of
different real-time PCR assays for quantitative detection of Epstein-Barr virus. J Clin
Microbiol. 2008;46:157-63.
6. Recommendations for the preparation, characterization and establishment of international
and other biological reference standards (revised 2004). WHO Technical Report Series 2007.
Geneva, Switzerland:WHO 2007;932,73-131.
7. Fryer JF, Minor PD. Standardisation of nucleic acid amplification assays used in clinical
diagnostics: a report of the first meeting of the SoGAT Clinical Diagnostics Working Group.
J Clin Virol. 2009;44:103-5.
8. SoGAT Clinical Diagnostics Meeting report;
www.nibsc.ac.uk/spotlight/sogat/clinical_diagnostics/past_meetings.aspx
9. Baer R, Bankier AT, Biggin MD, Deininger PL, Farrell PJ, Gibson TJ, Hatfull G, Hudson
GS, Satchwell SC, Séguin C, et al. DNA sequence and expression of the B95-8 Epstein-Barr
virus genome. Nature. 1984;310:207-11.
10. Henderson A, Ripley S, Heller M, Kieff E. Chromosome site for Epstein-Barr virus DNA in
a Burkitt tumor cell line and in lymphocytes growth-transformed in vitro. Proc Natl Acad
Sci U S A. 1983;80:1987-91.
11. Hatfull G, Bankier AT, Barrell BG, Farrell PJ. Sequence analysis of Raji Epstein-Barr virus
DNA. Virology. 1988;164:334-40.
12. http://www.ncbi.nlm.nih.gov/nuccore/NC_007605.1.

WHO/BS/2011.2172
Page 16
13. Jung-Chung Lin. Strategies for Evaluation of Antiviral Agents Against Epstein-Barr Virus in
Culture. Methods in Molecular Medicine, 1, Volume 24, Antiviral Methods and Protocols, II,
Pages 139-150.
14. Kimura H, Morita M, Yabuta Y, Kuzushima K, Kato K, Kojima S, Matsuyama T,
Morishima T. Quantitative analysis of Epstein-Barr virus load by using a real-time PCR
assay. J Clin Microbiol. 1999;37:132-6.
15. Saldanha J; Lelie N and Heath A B. Establishment of the First International Standard for
Nucleic Acid Amplification Technology (NAT) assays for HCV RNA. 1999. Vox Sanquinis.
76:149-158.
16. Kirkwood TBL. Geometric means and measures of dispersion. Biometrics 1979;35:908-9.
17. Fryer JF, Heath AB, Anderson R, Minor PD, and the Collaborative study Group.
Collaborative Study to Evaluate the Proposed 1st WHO International Standard for Human
Cytomegalovirus (HCMV) for Nucleic Acid Amplification (NAT)-Based Assays. WHO
ECBS Report 2010;WHO/BS/10.2138.
18. Chan KC, Zhang J, Chan AT, Lei KI, Leung SF, Chan LY, Chow KC, Lo YM. Molecular
characterization of circulating EBV DNA in the plasma of nasopharyngeal carcinoma and
lymphoma patients. Cancer Res. 2003;63:2028-32.
WHO/BS/2011.2172
Page 17
Table 1. Production summary for the candidate standard (sample 1).
NIBSC code 09/260
Product name Epstein-Barr virus
Dates of processing Filling; 25 January 2010
Lyophilization; 25-29 January 2010
Sealing; 29 January 2010
Presentation Freeze-dried preparation in 5 mL screw-cap
glass vial
Appearance Robust opaque white cake
No. of vials filled 6084
Mean fill weight (g) 0.9997 (n=60)
CV of fill weight (%) 0.23
Mean residual moisture (%) 0.7 Karl Fischer, 0.48 NIR units (n=11)
CV of residual moisture (%) 9.5
Mean oxygen content (%) 0.18 (n=12)
CV of oxygen content (%) 26.6
No. of vials available to
WHO
5677
Table 2. Stability of 09/260 at 4, 8 and 12 months.
Mean log10 ‘copies/mL’ Difference in log10 ‘copies/mL’
from -70 °C baseline sample
Temperature
(°C)
4 months 8 months 12 months 4 months 8 months 12 months
-70 6.865 6.992 7.041 - - -
-20 6.882 6.971 7.048 0.017 -0.021 0.007
+4 6.909 6.999 7.088 0.044 0.007 0.047
+20 6.959 7.02 7.092 0.094 0.028 0.051
+37 6.956 6.935 7.126 0.091 -0.057 0.085
+45 6.994 7.061 7.151 0.129 0.069 0.110

WHO/BS/2011.2172
Page 18
Table 3. Laboratory mean estimates from quantitative assays (log10 ‘copies/mL’).
Sample Laboratory
S1 S2 S3 S4
01 6.25 6.42 5.65 7.39
02A 7.03 7.13 6.25 8.07
02B 6.06 6.03 5.31 6.79
03 6.42 6.63 5.61 7.31
04A 6.95 6.97 6.01 7.24
04B 6.59 6.65 5.62 7.07
05 6.11 6.15 5.53 6.97
06 6.52 6.58 6.05 7.66
07A 6.35 6.56 5.37 6.97
07B 6.24 6.10 5.47 7.37
08A 6.73 6.82 5.86 7.36
08B 6.83 6.92 5.89 7.42
09 6.43 6.62 6.30 7.85
10 5.03 5.02 4.52 5.96
11 6.75 6.77 5.88 7.52
12 6.39 6.35 6.75 8.17
13A 7.32 7.33 6.33 8.23
13B 7.50 7.53 6.51 8.41
14 7.26 7.19 6.12 7.51
15 6.55 6.53 5.87 7.24
16 5.67 5.62 5.71 6.03
17 6.96 7.01 4.41 6.29
18 6.77 6.76 6.02 7.16
19 7.28 7.24 6.37 7.99
20 7.08 7.09 6.26 7.21
21 7.56 7.54 6.78 8.29
22A 7.40 7.51 6.82 8.56
22B 5.61 5.74 4.87 7.00
23 7.38 7.29 6.62 7.85
24 6.55 6.71 4.97 6.67
25 7.35 7.41 5.97 7.33
26A 7.33 7.30 6.53 8.08
26B 6.97 6.89 6.17 7.74
27 6.56 6.72 6.17 7.64
28A 6.70 6.73 5.88 7.74
28B 7.22 7.28 6.57 8.22

WHO/BS/2011.2172
Page 19
Table 4. Laboratory mean estimates from qualitative assays (log10 ‘NAT detectable units/mL’).
Sample Laboratory
S1 S2 S3 S4
17 5.49 5.74 3.83 5.96
20 6.59 6.20 5.46 6.45
Table 5. Overall mean estimates and inter-laboratory variation (log10 ‘copies/mL’ for
quantitative or ‘NAT-detectable units/mL’ for qualitative assays). - = not determined.
Sample Assay No. of
data sets Mean SD %GCV Min Max
Qualitative 2 6.04 - - 5.49 6.59 S1
Quantitative 36 6.71 0.58 277 5.03 7.56
Qualitative 2 5.97 - - 6.20 5.41 S2
Quantitative 36 6.75 0.57 270 5.02 7.54
Qualitative 2 4.64 - - 3.83 5.46 S3
Quantitative 36 5.92 0.60 294 4.41 6.82
Qualitative 2 6.20 - - 5.96 6.45 S4
Quantitative 36 7.45 0.63 327 5.96 8.56
Table 6. Overall mean estimates and inter-laboratory variation (log10 ‘copies/mL’) for
quantitative assays.
Sample No. of
data sets Mean SD %GCV Min Max
All Labs 36 6.71 0.58 277 5.03 7.56 S1
Excluding 10, 12, 16 & 17 32 6.80 0.48 205 5.61 7.56
All Labs 36 6.75 0.57 270 5.02 7.54 S2
Excluding 10, 12, 16 & 17 32 6.85 0.46 188 5.74 6.70
All Labs 36 5.92 0.60 294 4.41 6.82 S3
Excluding 10, 12, 16 & 17 32 5.99 0.48 205 4.87 6.82
All Labs 36 7.45 0.63 327 5.96 8.56 S4
Excluding 10, 12, 16 & 17 32 7.56 0.49 209 6.67 8.56

WHO/BS/2011.2172
Page 20
Table 7. Laboratory estimates of potency relative to S1 from quantitative assays log10 IU/mL
taking sample 1 as 5×10⁶ (6.7 log10 ) IU/mL.
Sample Laboratory
S2 S3 S4
01 6.87 6.10 7.84
02A 6.80 5.92 7.73
02B 6.67 5.95 7.43
03 6.90 5.89 7.59
04A 6.72 5.76 6.99
04B 6.77 5.74 7.18
05 6.74 6.12 7.56
06 6.75 6.23 7.84
07A 6.91 5.72 7.32
07B 6.56 5.93 7.83
08A 6.80 5.83 7.33
08B 6.80 5.76 7.29
09 6.89 6.57 8.12
10 6.69 6.19 7.63
11 6.73 5.83 7.47
12 6.66 7.05 8.48
13A 6.72 5.71 7.61
13B 6.72 5.71 7.60
14 6.63 5.56 6.95
15 6.69 6.02 7.39
16 6.65 6.74 7.06
17 6.75 4.15 6.03
18 6.68 5.94 7.09
19 6.67 5.79 7.41
20 6.71 5.88 6.83
21 6.67 5.92 7.43
22A 6.81 6.13 7.86
22B 6.83 5.96 8.09
23 6.61 5.94 7.16
24 6.86 5.13 6.83
25 6.76 5.32 6.68
26A 6.67 5.89 7.45
26B 6.62 5.91 7.47
27 6.86 6.32 7.78
28A 6.73 5.88 7.74
28B 6.76 6.06 7.70

WHO/BS/2011.2172
Page 21
Table 8. Laboratory estimates of potency relative to S1 from qualitative assays log10 IU/mL
taking sample 1 as 5×10⁶ (6.7 log10 ) IU/mL.
Sample Laboratory
S2 S3 S4
17 6.69 5.04 7.17
20 6.31 5.57 6.56
Table 9. Overall mean estimates and inter-laboratory variation for potency relative to sample 1
log10 IU/mL taking sample 1 as 5×10⁶ (6.7 log10 ) IU/mL. - = not determined.
Sample Assay No. of
data sets Mean SD %GCV Min Max
Qualitative 2 6.63 - - 6.31 6.96 S2
Quantitative 36 6.74 0.09 23 6.56 6.91
Qualitative 2 5.30 - - 5.04 5.57 S3
quantitative 36 5.90 0.46 187 4.15 7.05
Qualitative 2 6.86 - - 6.56 7.17 S4
Quantitative 36 7.43 0.46 187 6.03 8.48
Table 10. Overall mean estimates and inter-laboratory variation for potency relative to sample
1 quantitative assays log10 IU/mL taking sample 1 as 5x10⁶ (6.7 log10 ) IU/mL.
Sample No. of
data sets Mean SD %GCV Min Max
All Labs 36 6.74 0.09 23 6.56 6.91 S2
Excluding 10, 12, 16 & 17 32 6.75 0.09 23 6.56 6.91
All Labs 36 5.90 0.46 187 4.45 7.05 S3
Excluding 10, 12, 16 & 17 32 5.89 0.26 84 5.13 6.57
All Labs 36 7.43 0.46 187 6.03 8.48 S4
Excluding 10, 12, 16 & 17 32 7.46 0.36 130 6.68 8.12
WHO/BS/2011.2172
Page 22
Table 11. Laboratory estimates of potency relative to S3 from quantitative assays log10 IU/mL
taking sample 3 as 106 (6.0 log10 ) IU/mL.
Sample Laboratory
S1 S2 S4
01 6.60 6.77 7.74
02A 6.78 6.88 7.81
02B 6.75 6.72 7.48
03 6.81 7.01 7.70
04A 6.94 6.96 7.23
04B 6.96 7.03 7.44
05 6.58 6.62 7.44
06 6.47 6.53 7.61
07A 6.98 7.20 7.60
07B 6.77 6.63 7.90
08A 6.87 6.97 7.50
08B 6.94 7.03 7.53
09 6.13 6.32 7.55
10 6.51 6.51 7.44
11 6.87 6.90 7.64
12 5.65 5.61 7.42
13A 6.99 7.00 7.90
13B 6.99 7.02 7.90
14 7.14 7.07 7.39
15 6.68 6.66 7.37
16 5.96 5.91 6.32
17 8.55 8.60 7.88
18 6.76 6.74 7.14
19 6.91 6.88 7.62
20 6.82 6.83 6.95
21 6.78 6.75 7.51
22A 6.57 6.69 7.73
22B 6.74 6.87 8.13
23 6.76 6.67 7.23
24 7.57 7.73 7.70
25 7.38 7.44 7.36
26A 6.81 6.77 7.56
26B 6.79 6.71 7.56
27 6.38 6.54 7.46
28A 6.82 6.85 7.86
28B 6.64 6.70 7.64

WHO/BS/2011.2172
Page 23
Table 12. Laboratory estimates of potency relative to S3 from qualitative assays log10 IU/mL
taking sample 1 as 106 (6.0 log10 ) IU/mL.
Sample Laboratory
S1 S2 S4
17 7.66 7.92 8.13
20 7.13 6.74 6.99
Table 13. Overall mean estimates and inter-laboratory variation for potency relative to sample
3 log10 IU/mL taking sample 1 as 106 (6.0 log10 ) IU/mL. - = not determined.
Sample Assay No. of
data sets Mean SD %GCV Min Max
Qualitative 2 7.40 - - 7.13 7.66 S1
Quantitative 36 6.80 0.46 187 5.65 8.55
Qualitative 2 7.33 - - 6.74 7.92 S2
Quantitative 36 6.84 0.47 197 5.61 8.60
Qualitative 2 7.56 - - 6.99 8.13 S4
Quantitative 36 7.53 0.32 107 6.32 8.13
Table 14. Overall mean estimates and inter-laboratory variation for potency relative to sample
3 log10 IU/mL taking sample 1 as 106 (6.0 log10 ) IU/mL.
Sample No. of
data sets Mean SD %GCV Min Max
All Labs 36 6.80 0.46 187 5.65 8.55 S1
Excluding 10, 12, 16 & 17 32 6.81 0.26 84 6.13 7.57
All Labs 36 6.84 0.47 197 5.61 8.60 S2
Excluding 10, 12, 16 & 17 32 6.86 0.27 86 6.32 7.73
All Labs 36 7.53 0.32 107 6.32 8.13 S4
Excluding 10, 12, 16 & 17 32 7.57 0.25 76 6.95 8.13

WHO/BS/2011.2172
Page 24
Table 15. Intra-laboratory standard deviation of log10 ‘copies/mL’ and %GCV for quantitative
assays.
Sample
S1 S2 S3 S4
Laboratory
SD %GCV SD %GCV SD %GCV SD %GCV
01 0.11 29 0.11 29 0.12 32 0.28 90
02A 0.04 9 0.03 7 0.16 46 0.21 63
02B 0.15 41 0.14 38 0.14 39 0.21 64
03 0.08 20 0.08 19 0.41 157 0.29 96
04A 0.06 15 0.24 74 0.10 27 0.17 47
04B 0.08 21 0.21 61 0.16 44 0.12 33
05 0.05 13 0.04 9 0.21 64 0.29 96
06 0.08 20 0.09 22 0.13 36 0.23 71
07A 0.06 14 0.01 3 0.76 473 0.54 245
07B 0.17 47 0.18 51 0.28 92 0.23 69
08A 0.02 4 0.02 6 0.17 48 0.13 33
08B 0.04 10 0.04 9 0.14 38 0.09 24
09 0.11 29 0.12 32 0.19 55 0.18 53
10 0.49 206 0.54 251 0.29 94 0.49 210
11 0.04 10 0.05 13 0.06 15 0.19 54
12 0.20 58 0.10 27 0.54 245 0.38 141
13A 0.07 18 0.10 26 0.15 41 0.10 25
13B 0.07 18 0.06 15 0.06 15 0.07 19
14 0.17 48 0.13 35 0.05 13 0.05 11
15 0.15 41 0.14 39 0.23 69 0.27 88
16 0.04 9 0.03 6 0.19 53 0.34 121
17 0.09 23 0.08 21 0.52 230 0.33 114
18 0.10 26 0.05 12 0.20 58 0.13 34
19 0.24 73 0.31 106 0.12 33 0.23 71
20 0.10 26 0.16 43 0.45 182 0.19 56
21 0.04 11 0.06 14 0.19 54 0.37 134
22A 0.11 29 0.04 10 0.28 92 0.41 158
22B 0.23 70 0.12 32 0.14 37 0.16 43
23 0.22 64 0.20 60 0.18 51 0.37 133
24 0.08 19 0.08 19 0.04 11 0.02 5
25 0.06 14 0.06 14 0.12 32 0.07 19
26A 0.07 17 0.05 13 0.05 13 0.14 38
26B 0.17 47 0.23 68 0.12 33 0.09 24
27 0.13 34 0.13 35 0.06 16 0.34 116
28A 0.09 24 0.04 11 0.26 83 0.26 84
28B 0.07 18 0.05 11 0.18 51 0.21 63
Mean 0.14 38 0.15 42 0.26 81 0.26 81

WHO/BS/2011.2172
Page 25
Table 16. Components of variation, inter vs. intra contributions for all quantitative assays (36
data sets). CPM = copies per mL.
SD %GCV Component
Lab Assay Lab Assay
S1 0.57 0.14 273 38
S2 0.56 0.15 267 41
S3 0.60 0.26 293 81 Absolute CPM
S4 0.62 0.26 320 82
S1 - - - -
S2 0.07 0.10 19 24
S3 0.46 0.28 185 90
Potencies
Relative to S1
S4 0.44 0.25 177 79
S1 0.46 0.28 185 90
S2 0.47 0.27 196 87
S3 - - - -
Potencies
Relative to S3
S4 0.30 0.28 98 88
Table 17. Components of variation, inter vs. intra contributions for quantitative assays,
excluding laboratories 10, 12, 16 & 17 (32 data sets). CPM = copies per mL.
SD %GCV Component
Lab Assay Lab Assay
S1 0.48 0.11 203 30
S2 0.46 0.12 185 33
S3 0.48 0.23 200 71 Absolute CPM
S4 0.48 0.24 202 73
S1 - - - -
S2 0.08 0.09 19 24
S3 0.24 0.24 75 75
Potencies
Relative to S1
S4 0.34 0.24 120 72
S1 0.24 0.24 75 75
S2 0.25 0.24 78 75
S3 - - - -
Potencies
Relative to S3
S4 0.21 0.27 63 84

WHO/BS/2011.2172
Page 26
Figure legends
Figure 1. Individual laboratory mean estimates for study samples 1-4 obtained using
qualitative or quantitative NAT assays. Each box represents the mean estimate from each
laboratory assay and is labeled with the laboratory code number. The results from the qualitative
assays are labeled Q. The results are colour coded according to the diluent used in the assay
(dark grey, whole blood; light grey, plasma; white, other).
Figure 2. Relative potencies of samples 2-4 against sample 1, for each quantitative and
qualitative assay. Units are expressed as candidate log10 IU/mL in both cases. Each box
represents the relative potency for each laboratory assay and is labeled with the laboratory code
number. The results from the qualitative assays are labeled Q. The results are colour coded
according to the diluent used in the assay (dark grey, whole blood; light grey, plasma; white,
other).
Figure 3. Estimated concentrations of samples 1, 2 and 4 expressed in IU, relative to sample 3,
using a hypothetical unitage of 106 IU/mL for sample 3. Each box represents the relative potency
for each laboratory assay and is labeled with the laboratory code number. The results from the
qualitative assays are labeled Q. The results are colour coded according to the diluent used in the
assay (dark grey, whole blood; light grey, plasma; white, other).

WHO/BS/2011.2172
Page 27
Figure 1
a
Sample 1
0
2
4
6
8
10
12
14
16
18
20
22
24
26
28
30
NAT Detectable Units/ml or copies/ml (log10)
3.5 4.0 4.5 5.0 5.5 6.0 6.5 7.0 7.5 8.0 8.5
10 17Q
22B
16 02B
05
01
07A
07B
03
04B
06
09
12
15
20Q
24
27
08A
08B
11
18
28A
02A
04A
17
20
26B
13A
14
19
25
26A
28B
13B
21
22A
23

WHO/BS/2011.2172
Page 28
b
Sample 2
0
2
4
6
8
10
12
14
16
18
20
22
24
26
28
30
NAT Detectable Units/ml or copies/ml (log10)
3.5 4.0 4.5 5.0 5.5 6.0 6.5 7.0 7.5 8.0 8.5
10 16 17Q
22B
02B
07B
05
12
20Q
01
06
07A
09
15
03
04B
08A
11
18
24
27
28A
04A
08B
17
20
26B
02A
13A
14
19
23
26A
28B
13B
21
22A
25

WHO/BS/2011.2172
Page 29
c
Sample 3
0
2
4
6
8
10
12
14
16
18
20
22
24
26
28
30
NAT Detectable Units/ml or copies/ml (log10)
3.5 4.0 4.5 5.0 5.5 6.0 6.5 7.0 7.5 8.0 8.5
17Q 10
17
22B 24 02B
07A
03
04B
05
07B
20Q
01
08A
15
16
04A
06
08B
11
14
18
25
28A
02A
09
13A
19
20
26B
27
13B
23
26A
28B
12
21
22A
WHO/BS/2011.2172
Page 30
d
Sample 4
0
2
4
6
8
10
12
14
16
18
20
22
24
26
28
30
NAT Detectable Units/ml or copies/ml (log10)
3.5 4.0 4.5 5.0 5.5 6.0 6.5 7.0 7.5 8.0 8.5
10
16
17Q
17 20Q 02B
24
04B
05
07A
22B
03
04A
07B
08A
15
18
20
25
01
08B
11
14
06
09
23
26B
27
28A
02A
19
26A
12
13A
21
28B
13B
22A
WHO/BS/2011.2172
Page 31
Figure 2
a
Sample 2 - Relative to Sample 1
0
2
4
6
8
10
12
14
16
18
20
22
24
26
28
30
Candidate IU/ml (log10)
3.5 4.0 4.5 5.0 5.5 6.0 6.5 7.0 7.5 8.0 8.5
20Q 07B
23
26B
01
02A
02B
04A
04B
05
06
08A
08B
10
11
12
13A
13B
14
15
16
17
18
19
20
21
22A
22B
24
25
26A
27
28A
28B
03
07A
09
17Q
WHO/BS/2011.2172
Page 32
b
Sample 3 - Relative to Sample 1
0
2
4
6
8
10
12
14
16
18
20
22
24
26
28
30
Candidate IU/ml (log10)
3.5 4.0 4.5 5.0 5.5 6.0 6.5 7.0 7.5 8.0 8.5
17 17Q 24
25
14
20Q
04A
04B
07A
08A
08B
11
13A
13B
19
01
02A
02B
03
05
07B
15
18
20
21
22B
23
26A
26B
28A
28B
06
10
22A
27
09 16 12
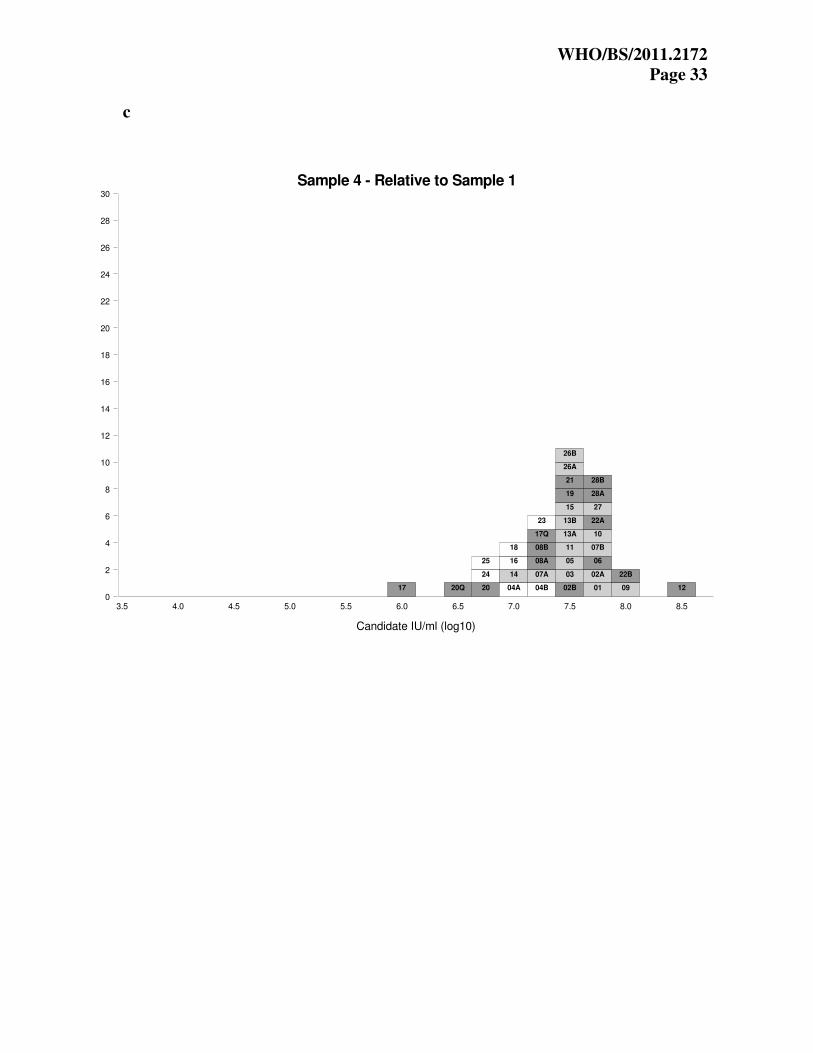
WHO/BS/2011.2172
Page 33
c
Sample 4 - Relative to Sample 1
0
2
4
6
8
10
12
14
16
18
20
22
24
26
28
30
Candidate IU/ml (log10)
3.5 4.0 4.5 5.0 5.5 6.0 6.5 7.0 7.5 8.0 8.5
17 20Q 20
24
25
04A
14
16
18
04B
07A
08A
08B
17Q
23
02B
03
05
11
13A
13B
15
19
21
26A
26B
01
02A
06
07B
10
22A
27
28A
28B
09
22B
12

WHO/BS/2011.2172
Page 34
Figure 3
a
Sample 1 - Relative to Sample 3
0
2
4
6
8
10
12
14
16
18
20
22
24
26
28
30
Candidate IU/ml (log10)
3.5 4.0 4.5 5.0 5.5 6.0 6.5 7.0 7.5 8.0 8.5
12 16 09 01
05
06
10
22A
27
02A
02B
03
07B
08A
11
15
18
20
21
22B
23
26A
26B
28A
28B
04A
04B
07A
08B
13A
13B
19
14
20Q
24
25
17Q 17

WHO/BS/2011.2172
Page 35
b
Sample 2 - Relative to Sample 3
0
2
4
6
8
10
12
14
16
18
20
22
24
26
28
30
Candidate IU/ml (log10)
3.5 4.0 4.5 5.0 5.5 6.0 6.5 7.0 7.5 8.0 8.5
12 16 09 05
06
10
27
01
02B
07B
15
18
20
20Q
21
22A
22B
23
26A
26B
28A
28B
02A
03
04A
04B
08A
08B
11
13A
13B
14
19
07A 25 24 17Q 17

WHO/BS/2011.2172
Page 36
c
Sample 4 - Relative to Sample 3
0
2
4
6
8
10
12
14
16
18
20
22
24
26
28
30
Candidate IU/ml (log10)
3.5 4.0 4.5 5.0 5.5 6.0 6.5 7.0 7.5 8.0 8.5
16 20
20Q
04A
15
18
23
25
02B
04B
05
06
07A
08A
08B
09
10
12
14
19
21
26A
26B
27
01
02A
03
11
22A
24
28A
28B
07B
13A
13B
17
17Q
22B
WHO/BS/2011.2172
Page 37
Appendix 1
Collaborative study participants (In alphabetical order by country)
Name Laboratory Country
Prof. Dr. Harald Kessler Mol. Diagnostics Lab / IHMEM / Medical Univ.
of Graz, Graz
Austria
Prof. William Rawlinson Virology Division, SEALS Microbiology,
Randwick
Australia
Dr. Jutta Preiksaitis
Dr. Xiao-Li Pang
Provincial Laboratory for Public Health /
University of Alberta, Alberta
Canada
Côme Barranger Argene SA, Verniolle France
Dr. Patrice Morand Laboratoire de Virologie, CHU Grenoble France
Dr. Céline Bressollette-Bodin Virology Laboratory, Nantes University Hospital,
Nantes
France
Dr. Thomas Grewing
Stephan Charpian
QIAGEN Hamburg GmbH, Hamburg Germany
Dr. Pantelis Constantoulakis Locus Medicus SA, Athens Greece
Prof. Dennis Lo
Dr. Allen Chan
Department of Chemical Pathology, The Chinese
University of Hong Kong
Hong Kong
Dr. Maria R Capobianchi
Dr. Isabella Abbate
Laboratory of Virology, National Institute for
Infectious Diseases "L. Spallanzani", Rome
Italy
Dr. Cristina Olivo Nanogen Advanced Diagnostics, Buttigliera Alta Italy
Dr. Tiziana Lazzarotto Operative Unit of Microbiology, Laboratory of
Virology, Bologna
Italy
Dr. Fausto Baldanti Molecular Virology Unit, Virology and
Microbiology, Fondazione IRCCS Policlinico San
Matteo, Pavia
Italy
Dr. Hiroshi Kimura Dept. of Virology, Nagoya Graduate School of
Medicine, Nagoya
Japan
Prof. Fredrik Müller Department of Microbiology, Oslo University
Hospital, Rikshospitalet,
Norway
Dr. Diana Hardie Diagnostic Virology Laboratory Groote Schuur
Hospital, Cape Town
South Africa
Dr. Won Seog Kim Advanced Genetic Testing Center, Samsung
Medical Center, Seoul
South Korea
Inger Bokliden
Karin Bergsten
Cepheid AB, Bromma Sweden
Dr. Rob Schuurman
Dr. Anton van Loon
University Medical Center Utrecht, Dept.
Virology, Utrecht
The Netherlands
Prof. Dr. HGM Niesters University Medical Center Groningen, Dept. of
Medical Microbiology, Groningen
The Netherlands
Prof. Dr. Jaap Middeldorp VU University Medical Center, Dept. Pathology,
Amsterdam
The Netherlands
Dr. Eithne MacMahon
Dr. Jon Bible
GSTS Pathology, London UK
Dr. David Hillyard ARUP Laboratories, Inc. (University of Utah
enterprise), Salt Lake City
USA
Dr. Richard Hodinka Clinical Virology Laboratory, Children’s Hospital
of Philadelphia, Philadelphia
USA
Jill Crouch
Dr. John Greg Howe
Molecular Diagnostics Laboratory, Yale New
Haven Hospital, New Haven
USA
Dr. Angela Caliendo Emory University Hospital, Altanta USA
Dr. Margaret Gulley University of North Carolina, Chapel Hill USA
Dr. Randall Hayden
Clinical and Molecular Microbiology, St. Jude
Children’s Research Hospital, Memphis
USA

WHO/BS/2011.2172
Page 38
Appendix 2
Study protocol

WHO/BS/2011.2172
Page 39

WHO/BS/2011.2172
Page 40

WHO/BS/2011.2172
Page 41
WHO/BS/2011.2172
Page 42
Appendix 3
Proposed instructions for use

WHO/BS/2011.2172
Page 43