who technical report series 1002apps.who.int/iris/bitstream/10665/254893/1/9789241210027-eng.pdf ·...
TRANSCRIPT

W H O T e c h n i c a l R e p o r t S e r i e s
Evaluation of certain contaminants in food
Eighty-third report of the Joint
FAO/WHO Expert Committee on
Food Additives
1002
The World Health Organization was established in 1948 as a specialized agency of the United Nations serving as the directing and coordinating authority for international health matters and public health. One of WHO’s constitutional functions is to provide objective and reliable information and advice in the field of human health, a responsibility that it fulfils in part through its extensive programme of publications. The Organization seeks through its publications to support national health strategies and address the most pressing public health concerns of populations around the world. To respond to the needs of Member States at all levels of development, WHO publishes practical manuals, handbooks and training material for specific categories of health workers; internationally applicable guidelines and standards; reviews and analyses of health policies, programmes and research; and state-of-the-art consensus reports that offer technical advice and recommendations for decision-makers. These books are closely tied to the Organization’s priority activities, encompassing disease prevention and control, the development of equitable health systems based on primary health care, and health promotion for individuals and communities. Progress towards better health for all also demands the global dissemination and exchange of information that draws on the knowledge and experience of all WHO’s Member countries and the collaboration of world leaders in public health and the biomedical sciences. To ensure the widest possible availability of authoritative information and guidance on health matters, WHO secures the broad international distribution of its publications and encourages their translation and adaptation. By helping to promote and protect health and prevent and control disease throughout the world, WHO’s books contribute to achieving the Organization’s principal objective – the attainment by all people of the highest possible level of health.
The WHO Technical Report Series makes available the findings of various international groups of experts that provide WHO with the latest scientific and technical advice on a broad range of medical and public health subjects. Members of such expert groups serve without remuneration in their personal capacities rather than as representatives of governments or other bodies; their views do not necessarily reflect the decisions or the stated policy of WHO. An annual subscription to this series, comprising about four to six such reports, costs CHF 150.00 / US$ 180.00 (CHF 105.00/US$ 126.00 in developing countries). For further information, please contact: WHO Press, World Health Organization, 20 Avenue Appia, 1211 Geneva 27, Switzerland (tel. +41 22 791 3264; fax: +41 22 791 4857; email: [email protected]; order online: http://www.who.int/bookorders).

W H O T e c h n i c a l R e p o r t S e r i e s1 0 0 2
Evaluation of certain contaminants in food
Eighty-third report of the Joint
FAO/WHO Expert Committee on
Food Additives
This report contains the collective views of an international group of experts and does not necessarily represent the decisions or the stated policy of the World Health Organization
Evaluation of certain contaminants in food: eighty-third report of the Joint FAO/WHO Expert Committee on Food Additives.
(WHO technical report series ; no. 1002)
Subject headings are available from WHO institutional repository
ISBN 978-92-4-121002-7
ISBN 978-92-4-069642-6 (PDF)
ISSN 0512-3054
© WHO and FAO 2017
All rights reserved. The World Health Organization (WHO) and the Food and Agriculture Organization of the United Nations (FAO) encourage the use, reproduction and dissemination of material in this information product. Except where otherwise indicated, material may be copied, downloaded and printed for private study, research and teaching purposes, provided that appropriate acknowledgement of WHO and FAO as the source and copyright holder is given and that WHO and FAO’s endorsement of users’ views, products or services is not implied in any way.
Publications of WHO are available on the WHO website (http://www.who.int) or can be purchased from WHO Press, World Health Organization, 20 Avenue Appia, 1211 Geneva 27, Switzerland (tel.: +41 22 791 3264; fax: +41 22 791 4857; email: [email protected]).
Requests for permission to reproduce or translate WHO publications – whether for sale or for non-commercial distribution – should be addressed to WHO Press through the WHO website (http://www.who.int/about/licensing/copyright_form/index.html).
The designations employed and the presentation of material in this publication do not imply the expression of any opinion whatsoever on the part of WHO or FAO concerning the legal status of any country, territory, city or area or of its authorities, or concerning the delimitation of its frontiers or boundaries. Dotted lines on maps represent approximate border lines for which there may not yet be full agreement.
The mention of specific companies or products of manufacturers, whether or not these have been patented, does not imply that these are or have been endorsed or recommended by WHO or FAO in preference to others of a similar nature that are not mentioned. Errors and omissions excepted, the names of proprietary products are distinguished by initial capital letters.
All reasonable precautions have been taken by WHO and FAO to verify the information contained in this publication. However, the published material is being distributed without warranty of any kind, either expressed or implied. The responsibility for the interpretation and use of the material lies with the reader. In no event shall WHO and FAO be liable for damages arising from its use.
This publication contains the collective views of an international group of experts and does not necessarily represent the decisions or the policies of WHO or FAO.
Design: Rania Spatha (http://www.raniaspatha.com)
Printed in Malta

iii
Contents
1. Introduction 1
1.1 Declarations of interests 11.2 Modification of the agenda 2
2. General considerations 3
2.1 Principles governing the toxicological evaluation of compounds on the agenda 32.1.1 Considerations for dose–response modelling 32.1.2 Handling non-detected or non-quantified analytical results for food chemicals 8
2.2 Update on activities relevant to JECFA 92.3 References 9
3. Contaminants 11
3.1 Aflatoxins 113.2 4,15-Diacetoxyscirpenol 403.3 Fumonisins 553.4 Glycidyl esters 743.5 3-MCPD esters and 3-MCPD 903.6 Sterigmatocystin 1063.7 Co-exposure of fumonisins with aflatoxins 122
4. Future work and recommendations 135
Acknowledgements 137
Annex 1 Reports and other documents resulting from previous meetings of the Joint FAO/WHO Expert Committee on Food Additives 139
Annex 2 Summary of toxicological and dietary exposure information 151
Annex 3 Meeting agenda 165
iv
List of participants
Eighty-third meeting of the Joint FAO/WHO Expert Committee on Food Additives1 Rome, 8–17 November 2016
MembersProfessor J. Alexander, Norwegian Institute of Public Health, Oslo, Norway
Dr S. Barlow, Brighton, East Sussex, United Kingdom
Dr D. Benford, Risk Assessment Unit, Food Standards Agency, London, United Kingdom (Vice-Chairperson)
Dr M. Bolger, Annapolis, Maryland, USA
Dr R. Cantrill, American Oil Chemists’ Society, Urbana, Illinois, USA (Chairperson)
Mr P. Cressey, Institute of Environmental Science and Research Ltd (ESR), Christchurch, New Zealand
Dr M. De Nijs, RIKILT Wageningen University & Research, Wageningen, the Netherlands (Co-Rapporteur)
Professor S. Edwards, Harper Adams University, Newport, Shropshire, United Kingdom
Mr M. Feeley, Bureau of Chemical Safety, Food Directorate, Health Canada, Ottawa, Ontario, Canada
Dr U. Mueller, Food Standards Australia New Zealand, Canberra, ACT, Australia (Co-Rapporteur)
Dr G.S. Shephard, Institute of Biomedical and Microbial Biotechnology, Cape Peninsula University of Technology, Bellville, South Africa
SecretariatProfessor G.O. Adegoke, Department of Food Technology, University of Ibadan, Ibadan,
Nigeria (FAO Expert)
Professor K.E. Aidoo, Department of Life Sciences, Glasgow Caledonian University, Glasgow, United Kingdom (FAO Expert)
1 Participants marked with an asterisk (*) did not attend the entire meeting.
v
Dr N. Arnich, French Agency for Food, Environmental and Occupational Health and Safety (Anses), Maisons-Alfort, France (WHO Expert)
Dr D. Bhatnagar, Agricultural Research Service, United States Department of Agriculture, New Orleans, Louisiana, USA (FAO Expert)
Dr P. Boon, Centre for Nutrition, Prevention and Health Services, National Institute for Public Health and the Environment (RIVM), Bilthoven, the Netherlands (FAO Expert)
Dr G. Brisco,* Joint FAO/WHO Food Standards Programme, Food and Agriculture Organization of the United Nations, Rome, Italy (Codex Secretariat)
Dr C. Carrington, Gaithersburg, Maryland, USA (WHO Expert)
Dr D.R. Doerge, National Center for Toxicological Research, United States Food and Drug Administration, Jefferson, Arkansas, USA (WHO Expert)
Dr L. Edler, German Cancer Research Center, Heidelberg, Germany (WHO Expert)
Ms B. Engeli, Federal Food Safety and Veterinary Office (FSVO), Bern, Switzerland (WHO Expert)
Dr V. Fattori, Agriculture and Consumer Protection Department, Food and Agriculture Organization of the United Nations, Rome, Italy (FAO Secretariat)
Ms Z. Gillespie, Bureau of Chemical Safety, Food Directorate, Health Canada, Ottawa, Ontario, Canada (WHO Expert)
Ms T. Hambridge, Food Data Analysis Section, Food Standards Australia New Zealand, Barton, ACT, Australia (FAO Expert)
Dr J.C. Leblanc, Food Safety and Quality Unit, Agriculture and Consumer Protection Department, Food and Agriculture Organization of the United Nations, Rome, Italy (FAO Secretariat)
Professor P. Li, Oil Crops Research Institute, Chinese Academy of Agricultural Sciences, Wuchang, Wuhan, Hubei Province, China (FAO Expert)
Dr M. Lipp, Agriculture and Consumer Protection Department, Food and Agriculture Organization of the United Nations, Rome, Italy (FAO Joint Secretary)
Professor H.A. Makun, Federal University of Technology, Minna, Nigeria (FAO Expert)
Dr D. Miller,* Department of Chemistry, Carleton University, Ottawa, Ontario, Canada (WHO Expert)
Dr N.J. Mitchell, Department of Food Science and Human Nutrition, Michigan State University, East Lansing, Michigan, USA (WHO Expert)
Dr T. Rawn, Food Research Division, Health Canada, Ottawa, Ontario, Canada (FAO Expert)
Dr R.T. Riley, Athens, Georgia, USA (WHO Expert)
Dr A.-C. Roudot, Université de Bretagne Occidentale, Brest, France (WHO Expert)

vi
Ms M. Sheffer, Orleans, Ontario, Canada (WHO Technical Editor)
Ms J.H. Spungen, Office of Analytics and Outreach, Center for Food Safety and Applied Nutrition, United States Food and Drug Administration, College Park, Maryland, USA (FAO Expert)
Dr A. Tritscher, Department of Food Safety and Zoonoses, World Health Organization, Geneva, Switzerland (WHO Joint Secretary)
Dr T. Umemura, Division of Pathology, Biological Safety Research Center, National Institute of Health Sciences, Tokyo, Japan (WHO Expert)
Dr M. Wheeler, Centers for Disease Control and Prevention, National Institute for Occupational Safety and Health, Cincinnati, Ohio, USA (WHO Expert)
Dr T. Yoshinari, Division of Microbiology, National Institute of Health Sciences, Tokyo, Japan (WHO Expert)
Dr Y. Zang, Office of Food Additive Safety, Center for Food Safety and Applied Nutrition, United States Food and Drug Administration, College Park, Maryland, USA (WHO Expert)
vii
List of abbreviations
ADI acceptable daily intakeAF aflatoxinAFB1 aflatoxin B1
AFB2 aflatoxin B2
AFG1 aflatoxin G1
AFG2 aflatoxin G2
AFL aflatoxinAFM1 aflatoxin M1
AFT total aflatoxinsalb albuminAOAC Association of Official Analytical ChemistsAOCS American Oil Chemists’ SocietyAUC area under the concentration–time curveBMD benchmark doseBMD10 benchmark dose for a 10% responseBMDL lower 95% confidence limit on the benchmark doseBMDL10 lower 95% confidence limit on the benchmark dose for a 10% responseBMDS Benchmark Dose Software (USEPA)BMR benchmark responsebw body weightCAS Chemical Abstracts ServiceCCCF Codex Committee on Contaminants in FoodsCIFOCOss Chronic Individual Food Consumption Database – Summary statisticsCmax maximum concentrationCpG 5′–C–phosphate–G–3′CSAF chemical-specific adjustment factorCYP cytochrome P4504,15-DAS 4,15-diacetoxyscirpenolDNA deoxyribonucleic acidED001 effective dose for a 0.1% responseEFSA European Food Safety AuthorityEHC Environmental Health CriteriaELISA enzyme-linked immunosorbent assayFAO Food and Agriculture Organization of the United NationsFB1 fumonisin B1
FB2 fumonisin B2
FB3 fumonisin B3

viii
FB4 fumonisin B4
GC gas chromatographyGEMS/Food Global Environment Monitoring System – Food Contamination Monitoring and Assessment Programme gpt guanine phosphoribosyltransferaseGST glutathione S-transferaseGST-P+ glutathione S-transferase placental form positiveHACCP hazard analysis and critical control pointHBsAg hepatitis B virus surface antigenHBV hepatitis B virusHCV hepatitis C virusHFB1 totally hydrolysed fumonisin B1
HPLC high-performance liquid chromatographyIAEA International Atomic Energy AgencyIARC International Agency for Research on CancerIGF insulin-like growth factorIGF1 insulin-like growth factor 1IGFBP3 insulin-like growth factor binding protein 3IPCS International Programme on Chemical SafetyISO International Organization for StandardizationIUPAC International Union of Pure and Applied ChemistryJECFA Joint FAO/WHO Expert Committee on Food AdditivesLB lower boundLC liquid chromatographyLD50 median lethal doseLOAEL lowest-observed-adverse-effect levelLOD limit of detectionLOEL lowest-observed-effect levelLOQ limit of quantification15-MAS 15-monoacetoxyscirpenol3-MCPD 3-monochloro-1,2-propanediolML maximum level MOE margin of exposureMS mass spectrometryMS/MS tandem mass spectrometryna not able to be calculatedNOAEL no-observed-adverse-effect levelNOEL no-observed-effect levelNTP National Toxicology Program (USA)OMSTC O-methyl sterigmatocystinP90 90th percentile

ix
Pig-A phosphatidylinositol glycan, Class APMTDI provisional maximum tolerable daily intakeqPCR quantitative polymerase chain reactionQTL quantitative trait locusRAP resistance-associated proteinRNA ribonucleic acidSCP scirpentriolSTC sterigmatocystinSULT sulfotransferaseTCA tricarballylic acidTLC thin-layer chromatographyTTC threshold of toxicological concernUAFM1 urinary aflatoxin M1
UB upper boundUFB1 urinary fumonisin B1
UGT uridine disphosphate-glucuronosyltransferaseUSA United States of AmericaUSEPA United States Environmental Protection AgencyUV ultravioletWHO World Health Organization

x
Monographs containing summaries of relevant data and toxicological and dietary exposure evaluations are available from WHO under the title:
Safety evaluation of certain contaminants in food. WHO Food Additives Series, No. 74 / FAO JECFA Monographs 20, 2017.

xi
Dedication
Professor Ron Walker University of Surrey, United Kingdom (emeritus)
It was with great sadness that the Committee noted the passing of Professor Ron Walker. Ron was active in JECFA every year from 1981 until 2011, and he played a vital role in establishing the procedures for safety assessment that are used by the Committee and around the world. Ron’s contribution to food safety risk assessment and in particular to the work of JECFA is without equal. He was instrumental in the development of Environmental Health Criteria (EHC) 70, which laid the global foundation for the safety assessment of food additives and contaminants, as well as in the update of this important guidance in EHC 240. Ron’s contribution to the work of JECFA over the decades is unique and was the foundation of solid, objective and consistent assessments. He served as Chair of the Committee on many occasions and navigated the Committee through many difficult agendas. Ron was the cornerstone of JECFA over many years and became its famous “institutional memory”. His warm personality, bright mind and great sense of humour will always be remembered.
Ron will be thoroughly missed by his peers and friends in the scientific community.
In recognition of his service, the Committee dedicates this report to the memory of Professor Ron Walker.


1
1. IntroductionThe eighty-third meeting of the Joint FAO/WHO Expert Committee on Food Additives (JECFA) was held in Rome from 8 to 17 November 2016. The meeting was opened by Dr Renata Clarke, Head of the Food Safety and Quality Unit of the Food and Agriculture Organization of the United Nations (FAO), who welcomed participants on behalf of the Directors-General of FAO and the World Health Organization (WHO). Dr Clarke thanked all participants for placing their valuable time and expertise at the disposal of the two organizations and commented that JECFA was one of the most successful joint undertakings of FAO and WHO, playing a critical role in the development of international food safety standards by the Codex Alimentarius Commission. It was noted that this year marks an important milestone: the 60th anniversary of JECFA. Much knowledge has been developed over this period and has served as the foundation for food safety decisions globally and nationally, with the excellence of JECFA always being a constant. The FAO/WHO Joint Secretariat has worked and continues to work to maintain this excellence, by updating procedures to ensure the soundness and integrity of the evaluations made and incorporating new approaches into the JECFA process, as science evolves. It was further noted that this meeting of the Committee, which is dedicated to contaminants, has a challenging agenda, with some new substances to evaluate and others, such as aflatoxins and fumonisins, to be re-evaluated, also looking at co-exposure. Dr Clarke reminded participants that they have been invited to this meeting as independent experts and not as representatives of their countries or organizations. The Committee was also reminded of the confidential nature of the JECFA meetings, which allows experts to freely express their opinions. Dr Clarke closed by expressing her sincere gratitude to participants for providing their time and expertise to this core component of both FAO and WHO work.
1.1 Declarations of interestsThe Secretariat informed the Committee that all experts participating in the eighty-third meeting had completed declaration of interest forms and that no conflicts of interest had been identified.

2
WH
O T
echn
ical
Rep
ort S
erie
s, N
o. 1
002,
201
7Joint FAO/WHO Expert Committee on Food Additives Eighty-third report
1.2 Modification of the agendaThe Committee made the following modifications to the agenda (see original agenda in Annex 3):
■ “Diacetoxyscirpenol” was renamed as “4,15-Diacetoxyscirpenol”. ■ “3-MCPD esters” was expanded to include free MCPD. ■ Co-exposure of fumonisins with aflatoxins was dealt with as a separate
agenda item from fumonisins. ■ The report on matters of interest arising from previous sessions of the
Codex Committee on Contaminants in Foods (CCCF) was removed from the agenda.
3
2. General considerationsAs a result of the recommendations of the first Joint FAO/WHO Conference on Food Additives, held in September 1955 (1), there have been 82 previous meetings of the Committee (Annex 1). The tasks before the present Committee were to:
■ elaborate further principles governing the evaluation of contaminants in food (section 2);
■ undertake toxicological evaluations and dietary exposure assessments for six contaminants or groups of contaminants in food (section 3 and Annex 2);
■ undertake toxicological evaluations and dietary exposure assessments in relation to co-exposure to two groups of contaminants in food (section 3 and Annex 2).
2.1 Principles governing the toxicological evaluation of compounds on the agenda
In making recommendations on the safety of contaminants in food, the Committee took into consideration the principles established and contained in the publication Principles and Methods for the Risk Assessment of Chemicals in Food (Environmental Health Criteria [EHC] 240), published in 2009 (2).
2.1.1 Considerations for dose–response modelling IntroductionThe present meeting used dose–response modelling to evaluate exposure-related effects and to derive a point of departure to establish a health-based guidance value or a margin of exposure (MOE) for risk assessment, referring to previous guidance and practices of JECFA (e.g. EHC 239 (3) and EHC 240 (2) as well as the report of the seventy-second meeting of JECFA [Annex 1, reference 199]). During the meeting, the Committee recognized several issues concerning the selection of models to be included in the set of models fitted to the dose–response data identified as pivotal for risk assessment.
Theoretical considerationsDose–response models are mathematical models that approximate a biological process in a range of observed data. When extrapolating below the lowest dose of the experimental data, it should not be assumed that any one model is an accurate representation of the true underlying dose–response. There are often several different models that describe the data adequately, and there is often
4
Joint FAO/WHO Expert Committee on Food Additives Eighty-third report W
HO
Tec
hnic
al R
epor
t Ser
ies,
No.
100
2, 2
017
considerable uncertainty in the form of the approximation of the dose–response relationship.
Benchmark dose methodology ideally avoids this problem by confining the modelling process to doses at which the relationship between dose and response is highly constrained by empirical data, so that the differences between the estimates generated by alternative models are slight (4). For example, when considering quantal data, a dose that results in a 10% increase in excess risk is typically used, because this is a size of effect that is typically bracketed by standard testing methodologies using experimental animals (Annex 1, reference 176). However, the data often do not conform to that ideal. Laboratory studies may be limited by the number of animals per dose or employ doses that are far apart from the dose at which the critical adverse health effects become evident for risk assessment. Epidemiological studies have a different set of theoretical problems (e.g. dose misclassification; Annex 1, reference 199).
Therefore, the Committee concluded that model estimates cannot rely solely on empirical guidance on performing dose–response analyses and stressed the need to use toxicological knowledge, weight of evidence and other information. Curve fitting, such as benchmark dose modelling, fulfils one key aspect of such an evaluation – it ensures that the dose is “associated” with an effect. As all models are approximations, fitting the data does not necessarily make the model’s estimate plausible. The curve-fitting process must be scrutinized with other criteria based upon biological considerations. These considerations come under the headings of plausibility and analogy (5):
■ Plausibility. Quantitative dose–response analysis is rooted in biochemistry. Although absorption, distribution, metabolism and excretion make toxicological interactions more complicated than biochemical interactions in vitro, the combination of such interactions in a living organism should still bear some resemblance to the first- and second-order kinetics suggested by biochemistry. As first-order interactions are approximately linear at low doses and second-order interactions are sublinear at low doses, it is reasonable to suppose that toxicological effects may exhibit dose–response relationships that are linear, highly sublinear (i.e. threshold-like) or anywhere in between. Mathematical models that demonstrate supralinearity at low doses are not toxicologically plausible and should be used with caution.
■ Analogy. Even if the shape of a dose–response relationship is not well characterized, experience should inform the modelling decisions. In particular, a reasonable approach would assume that it would be rare to observe a completely different dose–response relationship than previously observed, and caution should be taken when extrapolating

5
General considerations
risk from such models. This reasoning is by analogy: one uses past experience analogically to guide the decisions in a similar situation.
Supralinearity in benchmark dose estimationWhen dose–response curves are fitted to data, the benchmark dose (BMD) as well as its corresponding lower 95% confidence limit or lower bound (BMDL) are computed from these curves, which are based upon a prespecified excess risk value – the benchmark response (BMR). In many situations, the dose–response curve appears supralinear at the doses tested, and models that support supralinearity may describe the data better than models that do not support supralinear dose–response data. One reason is that the set of models available on modelling software allows for both sublinearity and supralinearity. The Committee agreed that these models should not be dismissed for statistical reasons but should be evaluated based upon biological plausibility; in many situations, these models can be used to estimate the BMD. For illustrative purposes, Fig. 1 describes such a situation. The fitted dose–response curve (solid line) and corresponding BMD appear reasonable; however, the dose–response curve that is used to calculate the BMDL (dashed line) is clearly unreasonable, as it is essentially vertical at doses corresponding to risk around the BMR (i.e. the slope is infinite at zero). In such a situation, the model should not be used.
It is sometimes the case that the estimate of the BMDL is unreasonable given other considerations; for example, the BMDL may imply that exposure to only a few molecules of a chemical could increase risk by 10%. A check for supralinearity is to estimate the BMD and the BMDL at BMRs above and below the BMR chosen a priori. If the resultant BMDs and BMDLs are approximately located in the linear or sublinear range along the levels tested, the values can be used without objection. If there is a strong pattern of supralinearity, the model may be dismissed as not biologically appropriate. Fig. 2 shows such a plot, where the left panel describes three BMDLs computed at BMRs of 5%, 10% and 20%, and the estimates appear to be on a line. The right panel describes the same circumstance, but there is a large deviation above the line, which indicates supralinearity. In this case, toxicological evidence for that estimate should be investigated, and the estimate should be dismissed if it is found to be biologically implausible.
General approaches for identifying a BMDLRestricted models onlyThis technique uses models with the default parameter constraints provided with the United States Environmental Protection Agency’s (USEPA) benchmark dose modelling software (BMDS). The lowest resulting BMDL is then typically selected

6
Joint FAO/WHO Expert Committee on Food Additives Eighty-third report W
HO
Tec
hnic
al R
epor
t Ser
ies,
No.
100
2, 2
017
Fig. 1Plot of a hypothetical dose–response curve (solid line) and its corresponding 95% upper bound, dashed line. The vertical lines represent the benchmark dose (BMD) and benchmark dose lower bound (BMDL). Here, the fitted dose–response curve appears reasonable, but the upper-bound curve, which defines the lower bound of the BMD (BMDL), is biologically unreasonable.
Fig. 2Comparison of the benchmark dose lower bound (BMDL) computed across different BMRs for a model that is linear (left panel) and supralinear (right panel)
0.20
0.15
0.10
0.05
Prob
abili
ty o
f res
pons
e
Dose
0.00
0.00
BMDL BMD
0.05 0.10 0.15 0.20
BMR
BMR
BMDL BMDL
0 0
5 5
10 10
15 15
20 20
25 25
0.00 0.00 0.04 0.080.10 0.20 0.30

7
General considerations
as the point of departure. This is the methodology used for past JECFA evaluations for acrylamide, arsenic (Annex 1, reference 199), fumonisins and cyanogenic glycosides (Annex 1, reference 205). This method avoids supralinearity, but can result in significantly poorer model fits for some data sets. Additionally, the statistical coverage of this method may be anti-conservative – that is, the BMDL is higher than the true BMD at a rate greater than the confidence limit specified (type I error).
Unrestricted models onlyThis technique uses models without constraints and also selects the lowest resulting BMDL for identifying a point of departure. This methodology was recently used by JECFA for deoxynivalenol (Annex 1, reference 205) and by the European Food Safety Authority (EFSA) (6) for 3-monochloro-1,2-propanediol (3-MCPD) and other compounds. Although this methodology may avoid the statistical pitfalls of constrained models, as it allows supralinear models, implausible BMDLs may result from its use.
Model averagingModel averaging is a method that averages constituent dose–response models. As shown by several authors (7–10), it often avoids all of the problems listed above. Such estimates are often less sensitive to supralinear effects (11, 12) and more reliable statistically. Although there is no current JECFA guidance regarding the use of model averaging, it is a useful adjunct to the other methods when computing the BMDL.
Approach taken at current meetingThe Committee used the restricted models to identify the point of departure and also applied the other two methods for comparative purposes.
RecommendationsReiterating the recommendations of the seventy-second meeting of JECFA (Annex 1, reference 199), the current Committee recommends that the JECFA Secretariat establish an expert working group to develop detailed guidance for the application of the methods most suitable to the work of the Committee. The working group should, inter alia, address the following aspects:
■ the use of constraints when fitting models that allow for restrictions on the slope and/or power parameters modelling (i.e. the use of restricted versus unrestricted models);
■ models to be used from the standard BMDS suite;

8
Joint FAO/WHO Expert Committee on Food Additives Eighty-third report W
HO
Tec
hnic
al R
epor
t Ser
ies,
No.
100
2, 2
017
■ the use of model averaging, including selection of weights; ■ the use of non-parametric methods as an alternative for dose–
response risk assessment; ■ the use of biological information for the selection and specification of
models for dose–response; ■ transparent presentation of modelling outcomes in JECFA
publications; ■ review of developments in the USEPA BMDS software.
2.1.2 Handling non-detected or non-quantified analytical results for food chemicals
At the current meeting, the Committee discussed two general issues in relation to non-detected or non-quantified analytical results: (1) the handling of a high percentage of left-censored occurrence data (i.e. those analytical results less than the limit of detection [LOD] or limit of quantification [LOQ]), and (2) dealing with different LODs or LOQs in the same data set for individual chemicals or for a group of chemicals (e.g. aflatoxins or fumonisins). The number of uncensored contaminant data points also needs to be considered. Combination of these parameters can lead to very different results, both in the mean occurrence values derived and in the estimates of dietary exposure. These results will then affect the assessment of risk in relation to the health-based guidance value (e.g. provisional maximum tolerable daily intake [PMTDI], acceptable daily intake [ADI]) or point of departure (e.g. no-observed-adverse-effect level [NOAEL], BMDL). Therefore, how to deal with all of these issues needs careful consideration and consistent approaches for risk assessment purposes, and updating of EHC 240 (2) as needed.
The issue of a high proportion of left-censored data was discussed at the meeting during the evaluations of two mycotoxins, 4,15-diacetoxyscirpenol (4,15-DAS) and sterigmatocystin, for which the percentages of left-censored data were over 90%. These discussions raised the need to review the current practices used by the Committee on handling left-censored data and to provide the Committee with clear recommendations on how to deal with such situations in its evaluations.
The Committee discussed a proposal but, owing to the importance of this topic, decided that further considerations were required. These discussions will be continued after the meeting through a working group.

9
General considerations
2.2 Update on activities relevant to JECFA The Committee was provided with an update of work in the WHO International Programme on Chemical Safety (IPCS). The chemical risk assessment network and its activities were described, including the work on a review of how chemical-specific adjustment factors (CSAFs) are being used in regulatory and non-regulatory risk assessments.
The recent EFSA/WHO report proposing a revised threshold of toxicological concern (TTC) decision-tree was presented to the Committee for future consideration when evaluating compounds with limited toxicological data and low estimated exposures (13).
The Secretariat informed the Committee that guidance on the interpretation and evaluation of genotoxicity studies will be developed and presented at a future meeting.
2.3 References
1. FAO/WHO. Joint FAO/WHO Conference on Food Additives. Rome: Food and Agriculture Organization of the United Nations; 1956 (FAO Nutrition Meetings Report Series, No. 11); and Geneva: World Health Organization; 1956 (WHO Technical Report Series, No. 107).
2. FAO/WHO. Principles and methods for the risk assessment of chemicals in food. Joint publication of the Food and Agriculture Organization of the United Nations and the World Health Organization. Geneva: World Health Organization; 2009 (Environmental Health Criteria, No. 240).
3. WHO. Principles for modelling dose–response for the risk assessment of chemicals. Geneva: World Health Organization; 2009 (Environmental Health Criteria, No. 239).
4. Crump KS. A new method for determining allowable daily intakes. Fundam Appl Toxicol. 1984;4:854–71.5. Hill AB. The environment and disease: association or causation? Proc R Soc Med. 1965;58:295–300. 6. European Food Safety Authority Panel on Contaminants in the Food Chain (CONTAM). Scientific opinion on the risks for
human health related to the presence of 3- and 2-monochloropropanediol (MCPD), and their fatty acid esters, and glycidyl fatty acid esters in food. EFSA J. 2016;14:159.
7. Wheeler MW, Bailer AJ. Properties of model‐averaged BMDLs: a study of model averaging in dichotomous response risk estimation. Risk Anal. 2007;27(3):659–70.
8. Namata H, Aerts M, Faes C, Teunis P. Model averaging in microbial risk assessment using fractional polynomials. Risk Anal. 2008;28(4):891–905.
9. Piegorsch WW, An L, Wickens AA, West RW, Peña EA, Wu W. Information‐theoretic model‐averaged benchmark dose analysis in environmental risk assessment. Environmetrics. 2013;24(3):143–57.
10. Shao K, Gift JS. Model uncertainty and Bayesian model averaged benchmark dose estimation for continuous data. Risk Anal. 2014;34(1):101–20.
11. Wheeler MW, Bailer AJ. An empirical comparison of low-dose extrapolation from points of departure (PoD) compared to extrapolations based upon methods that account for model uncertainty. Regul Toxicol Pharmacol. 2013;67(1):75–82.
12. Wheeler MW, Park RM, Bailer AJ, Whittaker C. Historical context and recent advances in exposure–response estimation for deriving occupational exposure limits. J Occup Environ Hyg. 2015;12(Suppl 1):S7–17.
13. EFSA, WHO. Review of the threshold of toxicological concern (TTC) approach and development of new TTC decision tree. EFSA Supporting Publications. 2016;13(3):EN-1006.


11
3. Contaminants2
3.1 AflatoxinsExplanationAspergillus flavus is a fungus that was first recognized to cause aflatoxicosis in domestic animals and is the most important aflatoxin-producing species in food on a global basis. It produces aflatoxin B1 (AFB1) and aflatoxin B2 (AFB2) and affects many commodities, but most human exposure comes from contaminated corn (also referred to as maize), peanuts (also referred to as groundnuts) and rice. Another important producer of aflatoxin, A. parasiticus, produces AFB1, AFB2, aflatoxin G1 (AFG1) and aflatoxin G2 (AFG2) and is primarily associated with peanuts in the Americas, but can also occur on corn, figs and pistachios (1). Of these four aflatoxins, AFB1 is most frequently present in contaminated samples; AFB2, AFG1 and AFG2 are generally not reported in the absence of AFB1. Aflatoxin M1 (AFM1) is the hydroxylated metabolite of AFB1; in areas of high aflatoxin exposure, humans are exposed to AFM1 more or less exclusively through milk and milk products, including breast milk (2) (Fig. 3).
Fig. 3 Chemical structures of key aflatoxins
2 Numbered references cited in the subsections of section 3 are provided at the end of each subsection.
Aflatoxin B1
Aflatoxin M1
Aflatoxin B2
Aflatoxin G1
Aflatoxin G2
OCH3
OCH3
OH
OCH3
OCH3
OCH3

12
Joint FAO/WHO Expert Committee on Food Additives Eighty-third report W
HO
Tec
hnic
al R
epor
t Ser
ies,
No.
100
2, 2
017
Most of the available toxicological data relate to AFB1. However, information regarding the relative potency of aflatoxin congeners is available from bacterial mutagenicity and hepatocarcinogenic effects in the rainbow trout and rats, in the order of AFB1 > (AFG1, AFM1) >> (AFB2, AFG2) (3, 4). The apparent order of mutagenic and carcinogenic activity is in accord with the presence (AFB1, AFM1 and AFG1) and absence (AFB2 and AFG2) of a chemically reactive double bond that can be converted metabolically to a DNA-reactive epoxide (5). Based on these biosynthetic, structural and toxicological properties, this evaluation focused primarily on the toxicity of AFB1 and the exposure to AFB1 and total aflatoxins (AFT).
Aflatoxins were previously evaluated by JECFA at its thirty-first, forty-sixth, forty-ninth, fifty-sixth and sixty-eighth meetings (Annex 1, references 77, 122, 131, 152 and 187). At the thirty-first meeting, the Committee considered aflatoxins to be a potential human carcinogen and urged that dietary exposure to aflatoxins be reduced to the lowest practicable levels, so as to reduce the potential risk as far as possible. At its forty-sixth meeting (1997, no monograph prepared), the Committee considered estimates of the carcinogenic potency of aflatoxins and the potential risk associated with their intake and recommended a detailed assessment. This detailed assessment was undertaken at the forty-ninth meeting (1999), when the Committee provided potency estimates for human liver cancer resulting from AFB1 exposure, taking hepatitis B virus surface antigen (HBsAg) status into account. The effects of applying hypothetical maximum levels (MLs) of AFT (10 and 20 µg/kg) for contamination in maize and groundnuts were also analysed, and the Committee concluded that reducing the ML from 20 to 10 µg/kg is unlikely to result in detectable differences in population cancer risks. For populations with a high prevalence of HBsAg+ individuals and high mean intake of aflatoxins, population health would benefit from reductions in aflatoxin intake. At its fifty-sixth meeting (2002), the Committee evaluated the impact of different MLs for AFM1 in milk, and at the sixty-eighth meeting (2007), the Committee evaluated the impact of different hypothetical MLs for tree nuts and dried figs. The Committee updated the aflatoxin risk assessment at the current meeting at the request of CCCF. The toxicological review made use of the literature in three International Agency for Research on Cancer (IARC) publications (6–8), a review by Eaton et al. (9), a review of the global burden for aflatoxin-induced liver cancer (10) and a recent IARC publication on aflatoxin and child health (11). Key references from these publications and the monograph from the forty-ninth meeting of JECFA were collected, and searches of the more recent literature (1999 to present) were conducted on PubMed, SciFinder (ACS-PubMed) and/or Web of Science (ISI). In addition, where needed and if possible, important raw data were solicited from the authors of key publications or unpublished reports. The

13
Contaminants
literature search on the occurrence of and dietary exposure to aflatoxins was run using three databases (Scopus, PubMed and Ovid) and a cut-off date of 2007.
Biochemical aspects The Committee at the forty-ninth meeting of JECFA (Annex 1, reference 131) considered that the carcinogenicity of aflatoxins was due to metabolic activation to a reactive epoxide and that species differences in metabolism were responsible for different susceptibilities of animals to the toxic effects of exposure to aflatoxins.
A substantial body of additional evidence from subsequent studies that was reviewed by the current Committee adds to the chemical and metabolic determinants for toxicity. The toxicity of aflatoxins stems from the presence of an oxidizable 8,9-double bond in AFB1 and AFG1. The action of many hepatic cytochrome P450 (CYP) isoforms on AFB1 produces the highly reactive metabolite AFB1-8,9-exo-epoxide, which reacts readily with critical biological nucleophiles, such as DNA and proteins, that can initiate toxic sequelae (9). The reaction of AFB1-8,9-exo-epoxide at the N7-position of guanine residues in DNA produces persistent lesions (12). Concomitantly, deactivation of AFB1-8,9-exo-epoxide can occur by other pathways, including hydrolysis, enzyme-mediated reactions with glutathione and conjugation with glucuronic acid and sulfate by uridine diphosphate-glucuronosyltransferases (UGTs) and sulfotransferases (SULTs), respectively, that enhance excretion (9). Some CYP isoforms directly detoxify AFB1 through oxidation reactions to produce metabolites, including aflatoxin Q1, AFM1, aflatoxin P1 and AFB1-8,9-endo-epoxide (13). Hydrolysis of either the exo- or endo-epoxide produces AFB-diol, which reacts with lysine residues on serum albumin to form adducts that have proven to be valuable biomarkers of exposure to AFB1 (5). AFB1 and its metabolites, with and without phase II conjugation, are eliminated from the body by excretion in the urine and faeces, and AFM1 is excreted via lactation (9).
Detoxification of AFB1-8,9-exo-epoxide by the glutathione S-transferase (GST) isoforms present in the liver appears central to the interspecies differences in susceptibility to AFB1 toxicity, in which mice are relatively resistant and rats and trout are highly susceptible. A constitutively expressed alpha-class GST with high activity for the detoxification of AFB1-8,9-exo-epoxide is present in mouse liver; in contrast, rats, trout and humans possess much lower hepatic GST activity towards AFB1-8,9-exo-epoxide, whereas monkeys are intermediate (9).
Measurements of levels of AFB1 bound to serum albumin, its metabolites in urine and faeces, and its DNA adducts provide a wealth of information related to the balance of activation and detoxification that best correlates AFB1 exposure with susceptibility to toxic effects. Interindividual variability in human subjects is apparently due to enzyme polymorphisms for the activation and detoxification

14
Joint FAO/WHO Expert Committee on Food Additives Eighty-third report W
HO
Tec
hnic
al R
epor
t Ser
ies,
No.
100
2, 2
017
of AFB1 catalysed by CYP isoforms and detoxification of AFB1-8,9-exo-epoxide catalysed by GST isoforms (9).
Toxicological studiesThe Committee at its forty-ninth meeting (Annex 1, reference 131) considered substantial evidence that aflatoxins caused liver damage and hepatocarcinogenicity in laboratory rodents. In particular, the high susceptibility of male F344 rats to the carcinogenic effect of AFB1 was noted.
A substantial body of additional toxicological evidence from subsequent studies was reviewed by the current Committee to update the risk assessment. The carcinogenic effects of AFB1 in male F344 rats were quantified through a lifetime dietary study in which concentrations as low as 1 µg/kg produced liver tumours (14). Similarly sensitive were rainbow trout, in which dietary administration of AFB1 at 0.8 µg/kg produced a hepatocarcinogenic effect after 20 months. Large-scale studies designed to test the ED001 response (effective dose for a 0.1% increase in tumour incidence) to AFB1 were conducted in trout using dietary concentrations of 0.05–110 µg/kg over a 4-week exposure period with 1-year termination (15). Trout tumorigenesis data showed no indication of deviation from a log-linear dose–tumorigenic response relationship. A log-linear low-dose relationship was also observed between AFB1 dose and formation of DNA adducts in the trout (16) and rat liver (17–19). This low-dose log-linearity of tumour responses is presumably a consequence of the very low constitutive hepatic GST activity towards AFB1 epoxide in these species (20, 21). The demonstration of such a relationship that includes doses approaching human exposure levels is rare, but important for a genotoxic carcinogen like AFB1, as it tends to validate the linear, no-threshold approach to AFB1 cancer risk assessment. The commonality of critical metabolic processes across mammalian species linked effects and potency in controlled dosing studies in experimental animals with those in humans and provided avenues for molecular epidemiological approaches to study the role of aflatoxin exposure in human liver cancer (9, 22). Formation of the AFB1–N7-guanine DNA adduct leads to the most common AFB1-associated mutation, the GC → AT transversion (12). The predominance of a specific mutational hotspot in human hepatocellular carcinoma was identified, even though animal models do not recapitulate this event (23).
As no new data on AFM1 carcinogenicity were available, the approximate potency for carcinogenicity of an order of magnitude lower relative to AFB1 (16), as estimated at the forty-ninth meeting of JECFA, was maintained.
15
Contaminants
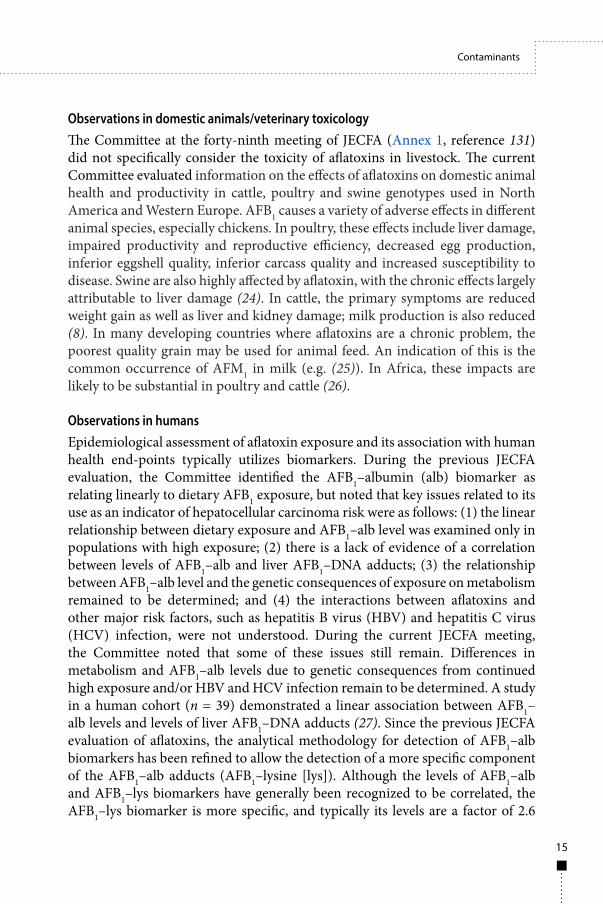
Observations in domestic animals/veterinary toxicologyThe Committee at the forty-ninth meeting of JECFA (Annex 1, reference 131) did not specifically consider the toxicity of aflatoxins in livestock. The current Committee evaluated information on the effects of aflatoxins on domestic animal health and productivity in cattle, poultry and swine genotypes used in North America and Western Europe. AFB1 causes a variety of adverse effects in different animal species, especially chickens. In poultry, these effects include liver damage, impaired productivity and reproductive efficiency, decreased egg production, inferior eggshell quality, inferior carcass quality and increased susceptibility to disease. Swine are also highly affected by aflatoxin, with the chronic effects largely attributable to liver damage (24). In cattle, the primary symptoms are reduced weight gain as well as liver and kidney damage; milk production is also reduced (8). In many developing countries where aflatoxins are a chronic problem, the poorest quality grain may be used for animal feed. An indication of this is the common occurrence of AFM1 in milk (e.g. (25)). In Africa, these impacts are likely to be substantial in poultry and cattle (26).
Observations in humansEpidemiological assessment of aflatoxin exposure and its association with human health end-points typically utilizes biomarkers. During the previous JECFA evaluation, the Committee identified the AFB1–albumin (alb) biomarker as relating linearly to dietary AFB1 exposure, but noted that key issues related to its use as an indicator of hepatocellular carcinoma risk were as follows: (1) the linear relationship between dietary exposure and AFB1–alb level was examined only in populations with high exposure; (2) there is a lack of evidence of a correlation between levels of AFB1–alb and liver AFB1–DNA adducts; (3) the relationship between AFB1–alb level and the genetic consequences of exposure on metabolism remained to be determined; and (4) the interactions between aflatoxins and other major risk factors, such as hepatitis B virus (HBV) and hepatitis C virus (HCV) infection, were not understood. During the current JECFA meeting, the Committee noted that some of these issues still remain. Differences in metabolism and AFB1–alb levels due to genetic consequences from continued high exposure and/or HBV and HCV infection remain to be determined. A study in a human cohort (n = 39) demonstrated a linear association between AFB1–alb levels and levels of liver AFB1–DNA adducts (27). Since the previous JECFA evaluation of aflatoxins, the analytical methodology for detection of AFB1–alb biomarkers has been refined to allow the detection of a more specific component of the AFB1–alb adducts (AFB1–lysine [lys]). Although the levels of AFB1–alb and AFB1–lys biomarkers have generally been recognized to be correlated, the AFB1–lys biomarker is more specific, and typically its levels are a factor of 2.6

16
Joint FAO/WHO Expert Committee on Food Additives Eighty-third report W
HO
Tec
hnic
al R
epor
t Ser
ies,
No.
100
2, 2
017
lower than those for the AFB1–alb biomarker (28, 29). The differences between these two adducts should be considered when comparing studies. The p53 249ser DNA mutation has been identified as a potential biomarker of effect for aflatoxin-induced hepatocellular carcinoma (30). Although the presence of a p53 249ser mutation in hepatocellular carcinoma is often associated with aflatoxin exposure, there is still no evidence for causality, and the presence of HBsAg appears to be an important aspect for development of this mutation (31). Whether AFB1 causes these mutations or whether AFB1 leads to differential promotion of cells that acquire the mutation in human populations remains unclear. The development of chronic aflatoxin exposure biomarkers and validated effect biomarkers would contribute to a better understanding of the global risk from exposure.
The Committee at the forty-ninth meeting of JECFA (Annex 1, reference 131) evaluated a large body of epidemiological literature on the incidence of primary liver cancer, especially in the developing world, noting that a major disease determinant was the co-exposure to hepatitis viruses, especially HBV, which can significantly enhance risks from aflatoxin exposures. Aflatoxin effects that had been observed in humans include acute aflatoxicosis, growth stunting, immunotoxicity and development of hepatocellular carcinoma.
Since the previous JECFA evaluation, there have been significant contributions made to the literature in the area of epidemiology and aflatoxin exposure. Historical outbreaks of acute liver failure (jaundice, lethargy, nausea, death), identified as aflatoxicosis, have been observed in human populations since the 1960s. Identification of aflatoxins in primary food staples (e.g. maize and peanuts) that were associated with onset of disease was documented in incidents from India and Kenya (32–35). The Committee noted that there were deaths attributed to aflatoxins in the United Republic of Tanzania during the summer of 2016 (36), but dietary exposure data were not available at the time of the meeting. Reports that evaluated past outbreaks of aflatoxicosis have estimated acutely toxic and potentially lethal AFB1 doses in humans to be between 20 and 120 μg/kg body weight (bw) per day when consumed over a period of 1–3 weeks (37, 38); the consumption of staple food containing aflatoxin concentrations of 1 mg/kg or higher has also been suspected to cause acute aflatoxicosis (e.g. (39)).
Growth suppression has historically been considered an important health end-point for aflatoxins in animal models, with prenatal and postnatal exposure potentially eliciting adverse effects. Growth suppression in humans in cross-sectional and prospective studies in sub-Saharan Africa has been observed, with significant associations between aflatoxin exposure and lower WHO-calculated z-scores (primarily height-for-age) (40–44). However, there were no associations found between aflatoxin exposure and child z-scores in populations from Nepal (45) and the United Republic of Tanzania (46). Prenatal studies indicated that

17
Contaminants
a decrease in a mother’s exposure biomarker (AFB1–alb) from 110 to 10 pg/mg albumin was associated with an increase of 2 cm in height and a weight increase of 800 g in infants at 52 weeks of age (44). A number of mechanisms have been proposed for the effect of aflatoxin on growth, including immune dysfunction leading to increased risk of infections and energy loss, changes in intestinal integrity leading to poor nutrient absorption, disruption of the microbiome and altered expression of the insulin-like growth factor (IGF) axis (11). Castelino et al. (47) indicated, in a child cohort from Kenya, an inverse relationship of both insulin-like growth factor 1 (IGF1) and IGF binding protein 3 (IGFBP3) with AFB1–alb levels. The decreased levels of IGF1 may occur from in utero exposure and DNA hypermethylation of CpG (5′–C–phosphate–G–3′) sites for the IGF1 gene (48).
The data from human studies suggest a negative effect of aflatoxins on child growth; however, causality has yet to be determined. Those populations most affected with child growth faltering and chronic aflatoxin exposure are exposed to a number of other etiological risk factors, such as low socioeconomic status, chronic diarrhoea, infectious disease and malnutrition. There are currently no epidemiological studies that factor all of these potential risk factors into their statistical analysis; thus, many of the studies may be overestimating the impact of aflatoxins on growth. The proposed modes of action would indicate that aflatoxin exposure could be the primary agent, because it could negatively affect the immune system and/or intestinal integrity, which in turn would influence the rates of diarrhoeal and infectious disease as well as nutrient uptake. The association between aflatoxin exposure and either impaired immune system function or intestinal integrity in human populations has yet to be determined. In fact, although a few studies have reported negative associations between aflatoxin exposure and certain measures of immunological function, other studies have failed to detect such negative associations (43, 48, 49).
The Committee at the forty-ninth meeting (Annex 1, reference 131) identified and described several important aflatoxin and hepatocellular carcinoma–related epidemiological studies, including the 1989 study by Yeh et al. (50). This prospective study, which was conducted in a large cohort (n = 7917) from China, collected dietary aflatoxin exposure data over a 6-year period and demonstrated a statistically significant, almost perfectly linear relationship between aflatoxin exposure and hepatocellular carcinoma mortality, independent of HBV infection (50). This study does have limitations, which were described by the Committee at the forty-ninth meeting, but was ultimately determined to be the most reliable data set with which to calculate aflatoxin potency estimates (Annex 1, reference 131). The majority of epidemiological studies that have been conducted since the last JECFA evaluation on aflatoxins have demonstrated a positive association
18
Joint FAO/WHO Expert Committee on Food Additives Eighty-third report W
HO
Tec
hnic
al R
epor
t Ser
ies,
No.
100
2, 2
017
between aflatoxin biomarkers and hepatocellular carcinoma; some studies indicate that aflatoxin exposure poses a significant risk only in the presence of other risk factors, such as HBV infection. Dietary changes in a historically hepatocellular carcinoma–endemic population led to decreases in aflatoxin exposure and were associated with a marked decrease in hepatocellular carcinoma incidence, independent of HBV (51). Worldwide population-attributable risk for aflatoxin-related hepatocellular carcinoma has been calculated by Liu & Wu (10), with aflatoxin alone (no HBV) playing a causative role in 4.6–28.2% of global hepatocellular carcinoma cases. The WHO report entitled Global Burden of Foodborne Disease estimated global foodborne aflatoxin disease incidence, mortality and disease burden; aflatoxin was associated with global disease (hepatocellular carcinoma) incidence (8967–56 776 cases per year) following adjustments to account for synergism between HBV and aflatoxin (52). The majority of uncontrolled aflatoxin exposure worldwide remains in those populations most at risk for chronic HBV prevalence.
Reports of case–control and cohort studies from China (including the Province of Taiwan) and Africa have reported relative risk values for aflatoxin-induced hepatocellular carcinoma in the range of 0.3–17.4 for aflatoxin exposure alone. These values are increased in the combined relative risk for HBV and aflatoxins to 1.57–70.0 (53–60). Meta-analysis of the available data indicated a multiplicative interaction of aflatoxins and HBV infection for the development of hepatocellular carcinoma (61).
The majority of epidemiological studies focused on evaluation of aflatoxin exposure and hepatocellular carcinoma incidence utilizing the AFB1–alb biomarker, which limits their usefulness in development of a dose–response relationship. The serum AFB1–alb biomarker has a relatively short half-life (~30 days), which creates some uncertainty in risk assessment of a lifetime health end-point, such as liver cancer. Additionally, the metabolism of this biomarker can be influenced by genetic differences (30, 62–65) and probably dietary exposure (22, 66), leading to high variation within populations. Thus, the association of chronic dietary exposure to aflatoxins with hepatocellular carcinoma is difficult to estimate using biomarkers, because short-term biomarkers are limited in their ability to establish a causal relationship in the etiology of diseases with extended latencies.
Analytical methods Aflatoxins are mycotoxins of major importance; therefore, techniques for their detection and analysis have been extensively researched to develop those that are highly specific, useful and practical. Many of the techniques that have been developed are applicable to different and specific situations, so a fit-for-purpose

19
Contaminants
approach needs to be considered in selecting the method for use in a particular instance. The natural or induced fluorescence of aflatoxins aids in their detection, such as in the original thin-layer chromatographic (TLC) method, which is still applicable when combined with scanner instrumentation. However, high-performance liquid chromatography (HPLC), in combination with fluorescence detection or, more recently, with mass spectrometry (MS), is the most widely applied technique for quantitative analysis. For field (non-laboratory) measurements, the method should be rapid, portable, reproducible and capable of being performed by non-scientific personnel (67). As Shephard (68) stated, “The need for analytical determination of aflatoxins has resulted in a plethora of methods to meet a range of analytical requirements by various analysts, from regulatory control in official laboratories (such as HPLC-MS) to rapid test kits for factories and grain silos (such as ELISA [enzyme-linked immunosorbent assay])”. The rapid methods generally involve the use of aflatoxin-specific antibodies, specific for AFB1 or for AFT (based on cross-reactivity of the antibody for all B and G aflatoxins). The analytical methods used for aflatoxins (reviewed in (69–71)) cover a wide spectrum of analytical science and can be generally divided into (1) quantitative methods (TLC combined with scanner; HPLC, HPLC-MS, liquid chromatography with MS or tandem MS [LC-MS or LC-MS/MS]; capillary electrophoresis); (2) semiquantitative methods (ELISA; lateral flow tests; direct fluorescence; fluorescence polarization immunoassay; biosensors); (3) indirect methods (spectroscopy); and (4) emerging technologies (hyperspectral imaging; electronic nose; aptamer-based biosensors; molecularly imprinted polymers). Numerous methods have been published in the scientific literature for specific purposes, but they may not be validated and therefore may not be applied in practice; these are not further discussed here. Trucksess & Zhang (72) argued that for analytical methods to be practical, they should meet the basic guideline of reproducibility in different laboratory settings. Several standard development organizations have issued stringent guidelines on accuracy, precision, selectivity, LOD, LOQ, linearity, range, uncertainty and ruggedness as criteria for acceptance of quantitative analytical methods. For screening methods or qualitative methods for mycotoxins, the most commonly applied acceptability criteria include (1) false-negative rates of less than 5% for analytical results at target level; (2) false-positive rates of less than 10–15% at target level; (3) a known threshold (cut-off) level for an intended matrix; and (4) a confirmation method for positive results (against a validated reference method) (72). There is a need to develop rapid, low-cost, low-technology, accurate detection methods for aflatoxins to improve surveillance and control in rural areas. Shephard (69) indicated that sampling remains a problem in many developing countries because subsistence farmers in these countries do not

20
Joint FAO/WHO Expert Committee on Food Additives Eighty-third report W
HO
Tec
hnic
al R
epor
t Ser
ies,
No.
100
2, 2
017
produce enough grain to spare the quantities needed for testing. However, organizations such as the Partnership for Aflatoxin Control in Africa and the World Food Programme are addressing these issues. For example, the World Food Programme has instituted the Purchase for Progress programme to ensure grain quality by creating the Blue Box, which contains test kits for grain quality, including aflatoxins (73, 74).
Sampling protocols The inherent non-homogeneous nature of aflatoxin (and other mycotoxin) contamination in raw agricultural commodities continues to present a major challenge to the obtaining of representative samples. The challenge continues to be addressed by the adoption of sampling protocols. In particular, for peanuts (groundnuts), protocols have been developed by the Codex Alimentarius Commission (75, 76) and by the European Commission (77, 78) and form the basis for the Origin Certificate Program of the United States of America (USA) (79). More recently, the Codex Alimentarius Commission, in setting MLs for aflatoxins in peanuts, almonds, Brazil nuts, hazelnuts and pistachios intended for further processing and for ready-to-eat almonds, Brazil nuts, hazelnuts, pistachios and dried figs, has specified sampling protocols for regulatory purposes (80). As an aid to understanding and implementing appropriate sampling and subsampling protocols for mycotoxins in general, the Joint FAO/International Atomic Energy Agency (IAEA) Programme, Nuclear Techniques in Food and Agriculture, has published a manual (81), whereas two training videos have been produced (82, 83). In general, associated with each sampling protocol is an operating characteristics curve, which gives the statistical probability of acceptable lots being rejected and contaminated lots being accepted. These curves are specific to each mycotoxin/commodity combination and can vary with the sampling parameters chosen. The statistical research from which these were derived is available in the public domain and consolidated as a “mycotoxin sampling tool” by FAO (84). Problems of representative sampling are most acute in addressing contamination in rural subsistence villages, where the necessary large samples are generally not available for food security reasons. Additionally, processing of the large sample weights can be challenging in a field setting.
Effects of processing In common with other mycotoxins, the milling of cereals does not destroy aflatoxins, but merely distributes them among the milling fractions or products. In general, those fractions intended for human food have reduced levels, whereas those intended for animal feed (e.g. the bran fraction) have elevated levels. Prior to milling, processes such as grain cleaning and separation are useful

21
Contaminants
management tools, potentially eliminating contaminated kernels and leading to a reduction of contaminant levels in the final milled product. In this regard, hand sorting is also a viable method in rural farms or in small-scale industrial food processors lacking sophisticated sorting machines. A number of publications have highlighted the reductions in contamination of cereal foods that can be achieved in rural settings using the common processes of sorting, winnowing, washing, crushing, dehulling and fermentation (either alone or when combined with steeping and cooking) (85–87). Unit operations such as heating, roasting and baking can reduce the levels of aflatoxins during the processing of foods, but complete elimination does not occur. The degree of elimination is variable and depends on the process and the conditions under which it is applied. For example, the decreases registered during extrusion processes are dependent on the design of extruder, moisture content of food, pressure applied and resulting temperatures.
Prevention and control Aflatoxin contamination of crops both preharvest and postharvest poses a serious health hazard as well as a significant economic burden from lack of sale of contaminated commodities. A reduction in risk will require an integrated systems approach that includes targeted agronomic cultural practices, biological control methods and enhancement of host plant resistance, coupled with postharvest technologies such as proper drying and storage of affected crop products, with the development of appropriate alternative uses to retain at least some economic value. Strategies for preharvest mitigation are designed to limit fungal invasion of crops by aflatoxigenic fungi and subsequent aflatoxin production. The strategies to minimize aflatoxin contamination in crops begin prior to planting (best management practices). Decisions must be made with respect to the selection of the cultivar to be planted, planting and harvesting dates, plant density, co-cropping and crop rotation, as well as soil treatments, irrigation and plant protection management (reviewed in (88–94)). The contribution of each of these practices may vary from geographic location to location. However, these practices are considered to have a significant effect on reducing aflatoxin contamination when practised together. The use of microbes to control aflatoxins in food and feed has been extensively reviewed (95–98). Microbes such as bacteria and yeasts have been investigated for their ability to reduce toxin contamination. However, no commercial application of bacteria and yeast biocontrol products has been established. One strategy that has received significant attention for reduction of aflatoxins prior to harvest has been biological control using non-toxigenic

22
Joint FAO/WHO Expert Committee on Food Additives Eighty-third report W
HO
Tec
hnic
al R
epor
t Ser
ies,
No.
100
2, 2
017
(atoxigenic) A. flavus isolates. Strains formulated into biological control products may be single isolate or multiple isolates to improve broader adaptability (99). This approach has been deployed on crops such as cotton, maize, peanuts, figs and pistachios in the USA, maize in Africa (11, 98) and peanuts in Australia (100), Argentina (101) and China (96). This strategy has also been used for maize in Thailand to measure the effectiveness of this treatment preharvest and postharvest; the results were promising, but inconsistent (102). Several factors have been identified that affect efficacy, such as available moisture for spore germination, too much moisture from rainfall, resulting in uneven distribution of the applied material, and time of application of the biocontrol formulation (103). The added cost of application also makes this strategy more suitable for areas routinely affected by chronic aflatoxin contamination because, to be effective, the application of the biocontrol formulation has to occur at early stages of crop development. The longer-term implications of the application of biocontrol formulations, such as the very low level of sexual recombination in restoring toxigenicity, adaptability of these applied strains under changing climatic conditions, the effect of such application on the microbiome or population biology of the field, and the potential for unsafe exposure to fungal inoculum (11, 94, 104, 105), remain to be evaluated. The most long-term, stable solution to control preharvest aflatoxin contamination is through enhancing the ability of the host crop to prevent fungal infection and/or the production of aflatoxins by the invading fungus. This can be achieved through either plant breeding or genetic engineering of crops of interest. However, these processes are laborious and extremely time consuming. Breeding efforts to obtain germplasm resistant to aflatoxin accumulation is particularly challenging because of strong environmental pressures on infection and aflatoxin production by A. flavus (reviewed in (106–110)). Additionally, finding resistant lines through traditional breeding is difficult because the phenotypic or agronomic characteristics that the breeder needs to look for are difficult to define. Moreover, it has been established that resistance is not conferred by a single gene and is a quantitative trait needing the combined effect of multiple genes (111). Plant breeding and varietal selection have provided significant maize and peanut genetic material demonstrating resistance to fungal invasion or toxin formation; however, commercial lines have yet to be marketed. Some of these lines are drought resistant and have shown reduced levels of aflatoxins. However, with the advent of new technologies such as genomics, proteomics and transcriptomics, the process of understanding and utilizing host–pathogen interactions has been significantly enhanced. Identification of markers to facilitate the transfer of resistance traits into desirable genetic backgrounds is essential for marker-assisted breeding. Marker genes or quantitative trait loci (QTL) of interest associated at high frequency with A. flavus or aflatoxin resistance due to genetic linkage (i.e.

23
Contaminants
close proximity on the chromosome of both traits – namely, the marker locus and the disease resistance–determining locus) have been identified for maize (110). In addition, resistance-associated proteins (RAPs) have been identified from maize using proteomic studies comparing susceptible and resistant germplasm (112). These RAPs have mapped to the resistance loci (QTL maps). Gene silencing, using genetic engineering (RNA interference), of five aflatoxin biosynthetic pathway genes in peanut plants was successful in controlling aflatoxin accumulation following inoculation with A. flavus in laboratory studies (113). The preharvest contamination of commodities with aflatoxins is generally limited to maize, cottonseed, peanuts and tree nuts. In contrast, postharvest contamination can be found in a variety of other agricultural crops, such as coffee, rice and spices. This contamination during storage can be influenced by factors such as moisture, temperature, mechanical or insect damage to commodities, aeration and the level of fungal inoculum. Therefore, preventive measures against aflatoxin contamination postharvest must address these conditions. Additionally, other measures, such as chemical decontamination or use of enterosorbents, can be used to remove aflatoxins from already-contaminated commodities (114–116). A number of research groups have attempted to correlate various environmental factors with the potential for A. flavus growth, and consequently aflatoxin production, in both preharvest and postharvest situations. “Predictive analytics” is an emerging discipline in which large volumes of climatic and agronomic data are mined for modelling to predict future outbreaks. In contrast to Fusarium head blight and deoxynivalenol, for which government and commercial predictive models are widely used by farmers in Canada and the USA, there are no commercially successful models available to predict aflatoxin contamination in any commodity. The reliability and predictive power of the results of successful models depend entirely on the quality and number of data points from farmers’ fields coupled with about a decade of field experience to refine the model. A number of models for predicting aflatoxin contamination in both field and storage conditions have been developed (reviewed in (117, 118)), with relatively high correlation (up to 0.8). Model prediction will never be 100% accurate, especially for predicting aflatoxin contamination, because there are too many factors, other than environmental factors, that significantly influence this contamination at harvest or during storage. The availability of accurate and detailed information on the factors that affect aflatoxin contamination will enable researchers to improve model performance in the future.
24
Joint FAO/WHO Expert Committee on Food Additives Eighty-third report W
HO
Tec
hnic
al R
epor
t Ser
ies,
No.
100
2, 2
017
Levels and patterns of contamination in food commodities The evaluation of the occurrence of aflatoxins was restricted to AFB1 and AFT and to those human foods most likely to be contaminated (cereals, nuts and spices). The presence of the hydroxylated metabolite AFM1 in milk, both human and dairy, was also considered. The open literature contains results of a large number of surveys for these contaminants. The methods employed in these papers (mostly HPLC as opposed to traditional TLC or ELISA) were of generally sufficient sensitivity (low LOD/LOQ) to measure low microgram per kilogram levels. A factor in assessing the results of open literature surveys is the problem that not all authors make it clear whether the mean values they report are for positive samples only or for all samples, thus complicating the assessment. Of the studies in cereals, most work was reported for wheat, maize and rice, whereas barley, oats and sorghum received little attention. Generally, it was noted that surveys in developing countries showed higher contaminant levels compared with reports from developed countries. A similar pattern emerged for nuts, particularly peanuts, in which extremely high contamination was reported in markets of developing countries. Of the range of spices investigated, chilli had both the highest contamination prevalence (up to 100%) and the highest contaminant levels. Surveys of dairy milk and its processed products followed the same geographic pattern, with a number of samples reported above the ML (0.5 µg/kg) set by the Codex Alimentarius Commission (119). AFM1 in human milk is a more complex issue, in that it occurs as a consequence of maternal exposure to AFB1. This exposure is minimal in developed countries, but can be problematic in rural subsistence farming areas of developing countries. With respect to the Global Environment Monitoring System – Food Contamination Monitoring and Assessment Programme (GEMS/Food) contaminants database, there was little information on the occurrence of aflatoxins in food from developing countries. In examining entries in the database, it was found that certain data were unreliable, in that some contaminant values had clearly been incorrectly captured (or entered). Further, the wide range of LOD/LOQ values reported made any assessment of per cent positive samples difficult. Also, in cases where the number of samples was relatively small, a few large outliers could heavily influence the calculation of the mean. The nature of the database precludes any conclusions on these contaminated samples and what they represent in terms of sampling for compliance, survey or importation. The level of testing clearly relates to the importance of the commodity in trade and the potential for Aspergillus infection and consequent aflatoxin contamination. The only transfer from feed to food that is a concern for food safety is that of the hydroxylated AFB1 metabolite, AFM1, secreted in milk. Although

25
Contaminants
transfer can also occur in eggs and liver, the relative levels with respect to feed contamination are low (120).
Food consumption and dietary exposure assessment Since the previous evaluation by JECFA, a number of national estimates of dietary exposure have been published. The Committee considered evaluations by Africa (various countries), Argentina, Brazil, China, Egypt, France, Greece, Ireland, Islamic Republic of Iran, Japan, Kenya, Lebanon, Malaysia, Mexico, Morocco, the Netherlands, New Zealand, Pakistan, Portugal, the Republic of Korea, Serbia, Spain, Sri Lanka, Tunisia, Turkey and the United Republic of Tanzania. These reports include dietary exposure assessments for AFT (27 studies), AFB1 (29 studies), AFB2 (six studies), AFG1 (five studies), AFG2 (five studies) and AFM1 (19 studies). Studies varied in the range of foods included.
Mean AFT dietary exposures in developed countries are generally less than 1 ng/kg bw per day, even at high exposure percentiles (e.g. 95th). Dietary exposure estimates for AFT for some sub-Saharan African countries exceed 100 ng/kg bw per day. However, it should be noted that these estimates are often based on very minimal data. AFB1 dietary exposure estimates also indicate differences between developed and developing countries, with dietary exposures in developed countries usually less than 1 ng/kg bw per day, even at high exposure percentiles (e.g. 95th). Mean estimated AFB1 dietary exposures in developing countries range from less than 0.1 ng/kg bw per day to approximately 49 ng/kg bw per day, with dietary exposure in sub-Saharan African countries reported to be as high as 400 ng/kg bw per day. Estimates of dietary exposure to AFM1 rarely exceeded 1 ng/kg bw per day in any country. The exceptions were studies in Serbia and Egypt, which estimated dietary exposures up to 6.5 and 8.8 ng/kg bw per day for young children (1–5 years) and breastfed infants, respectively (121, 122). The Committee prepared additional national estimates of dietary exposure based on food consumption information from the FAO/WHO Chronic Individual Food Consumption Database – Summary statistics (CIFOCOss) and aflatoxin concentration data from the GEMS/Food contaminants database. Additional national estimates of dietary exposure were determined only for countries for which no national estimates of dietary exposure have been published since the previous assessment by the Committee. All mean estimates of dietary exposure to AFT or AFB1 were less than 10 ng/kg bw per day at the upper bound, with most less than 5 ng/kg bw per day. Mean estimates of dietary exposure to AFM1 were mostly less than 0.5 ng/kg bw per day, except for estimates for Bulgaria (infants, toddlers and other children), with upper-bound dietary exposure estimates up to 2.5 ng/kg bw per day.
26
Joint FAO/WHO Expert Committee on Food Additives Eighty-third report W
HO
Tec
hnic
al R
epor
t Ser
ies,
No.
100
2, 2
017
The Committee prepared updated international estimates using the food consumption from the GEMS/Food cluster diets. Individual data points on the concentration of the contaminant (AFT, AFB1 and AFM1) in foods from each cluster were pooled to derive summary representative concentrations for each cluster for use in the dietary exposure calculations. For each commodity, when concentration data were not available for a cluster, the global total lower- bound (LB) and upper-bound (UB) means, obtained by pooling the data across all clusters, were used to assess exposure. It should be noted that no data were available from clusters G01–G04, G12, G14 or G16, including mainly African, Middle Eastern and Central Asian countries and island states from the Pacific and Indian oceans and the Caribbean. Cluster G05 (mainly South and Central American countries) provided data only on peanuts, cluster G13 (mainly African countries) provided data only on rice and sorghum, and cluster G06 (mainly Middle Eastern countries) provided very limited data on pistachios and dairy products. A standard body weight of 60 kg was used to assess exposure per kilogram body weight. Exposures estimated are LB and UB mean exposures expressed in nanograms per kilogram body weight per day and are representative of chronic dietary exposure. Estimates of dietary exposure for a high consumer were derived as twice the mean dietary exposure. It has been suggested that this is a good approximation to the 90th percentile of dietary exposure (123).
For the UB scenario, the mean estimated dietary exposure to AFT ranged from 1.3 ng/kg bw per day (cluster G08, including Austria, Germany, Poland and Spain) to 34.8 ng/kg bw per day (cluster G13, including African countries and Haiti). The mean estimated dietary exposure to AFB1 for the UB scenario ranged from 0.9 ng/kg bw per day (cluster G07, including European countries and Australia, Bermuda and Uruguay) to 13.5 ng/kg bw per day (cluster G13). The mean estimated dietary exposure to AFM1 for the UB scenario ranged from 0.02 ng/kg bw per day (cluster G03, including African countries and Paraguay, and cluster G14, including island nations in the Pacific and Indian oceans) to 0.56 ng/kg bw per day (cluster G10, including European and North American countries, New Zealand and the Republic of Korea). Similar patterns of exposure were seen under the LB scenario. In the previous evaluation, dietary exposure to AFT and AFB1 was primarily from consumption of maize and peanuts. However, the inclusion of data from a wider range of cereals in the current assessment has resulted in changes to the main contributing commodities. Rice was the main contributor to UB dietary AFT exposure (range 34.5–80.3%) for clusters G05, G10, G12, G13, G14 and G17 (clusters mainly include countries from Central and South America, island nations, parts of sub-Saharan Africa and a range of developed countries), whereas wheat was the main contributor to UB dietary AFT exposure (range 37.0–76.5%) for clusters G01, G02, G04, G06, G07, G08, G11 and G15 (clusters mainly include countries from North Africa, the
27
Contaminants
Balkans, the Middle East, Central Asia, Caribbean islands, Europe and various other developed countries). Maize was the main contributor to UB dietary AFT exposure (range 44.7–47.6%) for the remaining three clusters (G03, G09 and G16, clusters mainly include countries from sub-Saharan Africa and East Asian countries). A slightly different pattern was seen for AFB1, with rice being the main contributor to UB dietary AFB1 exposure (58.7%) for cluster G14 only (cluster includes mainly Pacific island nations), sorghum (range 37.3–58.7%) for clusters G13 and G16 (clusters include countries in sub-Saharan Africa) and maize (range 29.0–53.7%) for clusters G03, G05, G12 and G17 (clusters include countries from Central and South America, sub-Saharan Africa and some island nations). Wheat was the major contributor to UB AFB1 dietary exposure (range 33.8–80.2%) for the remaining 10 clusters. Cattle milk was the dominant contributor to UB AFM1 dietary exposure (range 51.8–99.0%) for all clusters except cluster G07 (cluster includes various developed countries), where a greater contribution came from cheese consumption (57.5% compared with 38.5% for cattle milk). The Committee noted that the international exposure estimates obtained in the present evaluation were higher than those of the previous evaluation, due to the inclusion of a greater range of data on aflatoxins in cereals.
With the exception of very high estimates of dietary exposure to AFT for some African countries (105–850 ng/kg bw per day), all national and international mean estimates of dietary AFT exposure were in the range <0.01–58 ng/kg bw per day, with high consumer (90th or 95th percentile) estimates in the range <0.01–200 ng/kg bw per day. For AFB1, mean dietary exposure estimates were in the range <0.01–49 ng/kg bw per day, with high-percentile estimates in the range <0.01–150 ng/kg bw per day. For AFM1, mean dietary exposure estimates were in the range <0.001–8.8 ng/kg bw per day, with high-percentile exposures in the range <0.001–5.0 ng/kg bw per day. It should be noted that these very wide ranges in estimates of dietary exposure are mainly due to the literature estimates of dietary exposure, with their diverse methodologies. Estimates of dietary exposure derived by the Committee (national and international) encompass a narrower, but still wide, range of estimates. Table 1 provides a summary of the range of exposure estimates derived from each of the three sources outlined above. Exposure estimates have been further separated into those pertaining to children and those pertaining to adults or the general population.
Impact assessment of implementation of Codex MLs in ready-to-eat peanutsCCCF asked the Committee to consider the impact of establishing MLs for AFT in ready-to-eat peanuts. In order to evaluate the potential effect of these MLs on chronic dietary exposure, all occurrence data on total AFT for ready-to-eat peanuts were categorized into the groups for which an ML has been proposed

28
Joint FAO/WHO Expert Committee on Food Additives Eighty-third report W
HO
Tec
hnic
al R
epor
t Ser
ies,
No.
100
2, 2
017
Table 1Summary of the range of estimates of dietary exposure for AFT, AFB1 and AFM1 derived from the literature, CIFOCOss and GEMS/Food cluster diets
Aflatoxin/population groupa/ estimate type
Range of estimated dietary exposures (ng/kg bw per day)Mean High percentileb,c
AFTChildrenNational – literature <0.01–25 <0.01–197National – CIFOCOss 0.5–9.6 1.0–19AdultsNational – literature Sub-Saharan Africa 1.4–850 – Other countries <0.01–58 <0.01–200National – CIFOCOss 0.04–5.0 0.1–11International 0.3–35 0.7–70AFB1
ChildrenNational – literature <0.01–13 <0.01–17National – CIFOCOss <0.01–10 <0.01–20AdultsNational – literature Sub-Saharan Africa 402 – Other countries <0.01–49 0.04–150National – CIFOCOss 0.03–4.3 0.06–8.5International 0.2–14 0.4–27AFM1
ChildrenNational – literature 0.02–8.8 0.13–0.32National – CIFOCOss <0.001–2.5 <0.001–5.0AdultsNational – literature 0.005–1.4 0.05–0.80National – CIFOCOss <0.001–0.14 <0.001–0.28International 0.001–0.56 0.002–1.1
a For the purpose of this summary table, “children” were taken to be any population group described as infants, toddlers or children. “Adults” were taken to be any population group described as adults, adolescents, elderly, very elderly or the general population.
b 90th or 95th percentile.c In some cases, the maximum high-percentile exposure estimate may be less than the maximum mean exposure estimate. This is due to the fact that high-percentile
dietary exposure estimates were not determined in all studies.

29
Contaminants
MLMean AFT dietary exposure for all
clusters (LB–UB, ng/kg bw per day)Proportion of ready-to-eat peanuts
rejected (%)No ML 5.3–8.3 –ML = 15 µg/kg 5.0–8.0 9.7ML = 10 µg/kg 5.0–8.0 12.6ML = 8 µg/kg 5.0–8.0 14.0ML = 4 µg/kg 4.9–8.0 19.8
(ML = 4, 8, 10 or 15 µg/kg), and resultant LB and UB mean concentrations were calculated. It was further assumed that the mean concentration of AFB1 in ready-to-eat peanuts would decrease with lower MLs in the same proportions as the decrease in the mean concentration of AFT. An international dietary exposure assessment for AFT and AFB1 was performed based on these MLs. For this, all samples for which the concentration of AFT exceeded its ML were excluded from the calculation of the LB and UB mean concentrations. The percentages of rejected samples after implementation of the proposed MLs were determined by cluster and overall. An ML of 15 µg/kg for ready-to-eat peanuts resulted in 2.7–14.5% of samples being rejected (overall 9.7%), whereas an ML of 4 µg/kg resulted in 4.2–23.8% of samples being rejected (overall 19.8%). The highest rejection rates were for cluster G05 (the cluster includes mainly South and Central American countries, whereas the data used for the assessment were solely from Brazil).
The effect of the implementation of the proposed Codex MLs on chronic dietary exposure to AFT and AFB1 was evaluated by means of the GEMS/Food cluster diets. For the UB scenario, imposition of an ML of 15 µg/kg for ready-to-eat peanuts reduced chronic dietary exposure to AFT by a maximum of 20% (cluster G16, including sub-Saharan African countries). Imposing the strictest proposed ML of 4 µg/kg for ready-to-eat peanuts reduced chronic dietary exposure to AFT by a maximum of 21% compared with dietary exposure without imposition of any ML for ready-to-eat peanuts. The additional reduction in dietary exposure to AFT from the reduction in ML from 15 to 4 µg/kg was negligible for all clusters. The maximum impact on estimated AFB1 dietary exposure from imposition of the strictest proposed ML (4 µg/kg) was a reduction of 13%.
Table 2 includes a summary of the impact of the various MLs considered on estimated AFT dietary exposure and ready-to-eat peanut rejection rates, at a global level.
Table 2Impact of different MLs for ready-to-eat peanuts on dietary AFT exposure estimates and ready-to-eat peanut rejection rates, at a global level
30
Joint FAO/WHO Expert Committee on Food Additives Eighty-third report W
HO
Tec
hnic
al R
epor
t Ser
ies,
No.
100
2, 2
017
Dose–response analysisThe current Committee confirmed liver cancer to be the critical end-point associated with dietary exposure to aflatoxins and used this end-point to characterize the health risk.
The Committee at the forty-ninth meeting of JECFA (Annex 1, reference 131) evaluated a number of epidemiological studies that associated aflatoxin exposures with risks of liver cancer, from which was determined the potency for HBsAg+ and HBsAg− individuals by selecting the median potency estimate among a suite of competing models. However, the Committee at the forty-ninth meeting of JECFA did not provide a complete uncertainty analysis of the Yeh at al. (50) data describing the relative risks between HBsAg+ and HBsAg− populations or upper bounds to the potency estimate. Owing to the availability of advanced statistical methodology, the Committee at the current meeting reanalysed the data of Yeh et al. (50), which is still considered the critical study, using a consistent methodological framework. As model uncertainty was a significant concern, a Bayesian model-averaged estimate of the potency (124) was computed.
Model averaging is a Bayesian technique that determines the posterior potency estimate from observed data and prior information. The prior is a probability model that weighs the importance of each model based upon considerations made before modelling the data, and the posterior is also a probability model that gives weights of the importance of each model given the data.
There is strong biological evidence to conclude that AFB1 is a low-dose linear genotoxic carcinogen. For the prior probability model, the Committee determined prior weights for each model. From the low-dose linear argument (i.e. consistency with animal data) and the models’ similarity to commonly used toxicological dose–response models, the linear model of Wu-Williams, Zeise & Thomas (125) and multistage cancer model of Bowers et al. (126) were given increased weight in comparison with the other models, totalling 80%. The other two models were given a total weight of 20%. Table 3 gives the potency estimate as well as the 95% UB on this estimate for all models, including the model average. The Committee decided to use the model-average estimate of 0.017 (0.049, UB) for HBsAg− individuals and 0.269 (0.562, UB) for HBsAg+ individuals for aflatoxin exposures of 1 ng/kg bw per day. The central estimates are virtually unchanged from the previous Committee’s potency estimates of 0.01 for HBsAg− individuals and 0.3 for HBsAg+ individuals for aflatoxin exposure of 1 ng/kg bw per day. However, as that estimate did not include an estimate of the statistical uncertainty of the potency, the current Committee chose the UB values of 0.049 and 0.562 for HBsAg− and HBsAg+ individuals, respectively, which reflected the statistical uncertainty of the estimate.

31
Contaminants
Table 3Estimated potency for 1 ng/kg bw per day (in 100 000 person years) of aflatoxin exposure from different models applied, fitted to the data of Yeh et al. (50)
Model HBsAg status Potencya Prior weight Posterior weightWu-Williams, Zeise & Thomas (125) Multiplicative linear − 0.005 (0.009) 0.10 0.09
+ 0.140 (0.326)Additive − 0.029 (0.058) 0.40 0.47
+ 0.410 (0.615)Hoseyni (128) Exponential multiplicative − 0.002 (0.003) 0.10 0.30
+ 0.054 (0.124)Bowers et al. (126) Multistage cancer − 0.018 (0.029) 0.40 0.14
+ 0.350 (0.474)Model average − 0.017 (0.049)
+ 0.269 (0.562)a 95% UB given in parentheses.
These human potency estimates were compared with potency estimates computed from a dose–response analysis based upon the animal study of Wogan, Paglialunga & Newberne (14). For this analysis, the estimate was taken from the model-averaged estimate of the dose–response curve. As this dose–response curve has been found to be less prone to error when extrapolating to potencies as low as 1/1000 (127), the dose associated with this potency was estimated and used to linearly extrapolate the potency of the dose associated with 1 ng/kg bw per day. Using a body weight to the ¾ power conversion factor between humans and rats, the estimated lifetime potency for AFB1 in rats is estimated to correspond to 4.7 cases per 100 000 lifetimes in humans, with a 90% confidence interval of (1.3, 74.9). Using the data of Yeh et al. (50) and assuming a lifetime of 75 years, the potency is estimated to be 1.3 cases per 100 000 lifetimes, with an UB estimate of 3.6.
Evaluation The Committee reaffirmed the conclusions of the forty-ninth meeting of JECFA that aflatoxins are among the most potent mutagenic and carcinogenic substances known, based on studies in test species and human epidemiological studies, and that HBV infection is a critical contributor to the potency of aflatoxins in inducing liver cancer. The more recent information about human polymorphisms

32
Joint FAO/WHO Expert Committee on Food Additives Eighty-third report W
HO
Tec
hnic
al R
epor
t Ser
ies,
No.
100
2, 2
017
in metabolizing enzymes (e.g. CYPs, SULTs) has described population variability in the balance between activation and detoxification processes for aflatoxins. This knowledge has been used in conjunction with biomarkers to evaluate the effectiveness of pharmacological and dietary interventions with the aim of reducing cancer risk (22). Increased reporting and identification of acute aflatoxicosis outbreaks, particularly in areas of Africa, led this Committee to consider the available data on acute exposure. Indeed, loss of lives attributed to aflatoxins was most recently reported in the United Republic of Tanzania during the summer of 2016. Ranges of AFB1 exposures between 20 and 120 µg/kg bw per day for a period of 1–3 weeks (37) or consumption of staple food containing concentrations of 1 mg/kg or higher (e.g. (39)) would be suspected to cause acute aflatoxicosis and possibly death. The Committee did not assess acute dietary exposure, but noted that the estimates of chronic dietary exposure are at least 2–5 orders of magnitude lower than the doses associated with acute effects. Since the forty-ninth meeting of the Committee, epidemiological data have become available to support the hypothesis that aflatoxin exposure in utero and during early life has negative effects on growth; in particular, decreased height is the most frequently associated anthropometric parameter. The available data did not provide evidence for an exposure level at which there is a significant risk for growth faltering. The Committee considered that the development of analytical technologies based on aptamers may have relevance in remote areas, because of their inherent stability, ease of production and use. The Committee noted that there were limited contamination data from developing countries, which hindered a more comprehensive and global evaluation of aflatoxin occurrence and may have resulted in an underestimate of dietary exposure in these countries. Only five food commodities (maize, peanuts, rice, sorghum and wheat) each contribute more than 10% to international dietary exposure estimates for more than one GEMS/Food cluster diet, for either AFT or AFB1. The Committee noted that international dietary exposure estimates (AFT and AFB1) were generally higher than those reported at the sixty-eighth meeting (Annex 1, reference 187). This was predominantly due to the availability of concentration data for rice, sorghum and wheat and their inclusion in the international dietary exposure estimates. Although overall concentrations of aflatoxins in rice and wheat are lower than concentrations in maize and groundnuts (a traditional focus for aflatoxin risk management), the high consumption of rice and wheat in some countries means that these cereals may account for up to 80% of dietary aflatoxin exposure for those GEMS/Food cluster diets. Mean AFB1 concentrations in sorghum from the GEMS/Food contaminants database are higher than those

33
Contaminants
for maize; combined with high consumption levels of sorghum in some GEMS/Food clusters, this cereal contributes 16–59% of dietary exposure in six GEMS/Food clusters. The database on sorghum is considerably more limited than that on maize. The Committee estimated the cancer potency per 100 000 population for exposure to AFB1 at 1 ng/kg bw per day. The resulting central estimates are 0.01 additional cancer cases per 100 000 for HBsAg− populations and 0.3 additional cancer cases per 100 000 for HBsAg+ populations. UB estimates are 0.049 additional cancer cases per 100 000 for HBsAg− populations and 0.562 additional cancer cases per 100 000 for HBsAg+ populations. The Committee calculated global aflatoxin-related hepatocellular carcinoma risk based on the new central and UB cancer potency estimates from the current dose–response analysis and international dietary exposure estimates described above. Aflatoxin-related cancer rates were calculated, accounting for prevalence of chronic HBsAg positivity (129), by GEMS/Food cluster. The low end of the range refers to LB estimates at the mean dietary AFB1 exposure, minimum HBsAg+ rates for countries in the cluster and the central potency estimate. The high end of the range refers to UB estimates at the 90th percentile of dietary AFB1 exposure, maximum HBsAg+ rates for countries in the cluster and UB estimates of cancer potency. The lowest cancer risks were estimated for clusters G07 and G08 (European and other developed countries), with cancer risk estimates in the range <0.01–0.10 aflatoxin-induced cancers per year per 100 000 population, with wheat being the major contributing food commodity. For countries within these clusters, HBsAg+ rates were in the range 0.01–1.2%. The highest cancer risks were for cluster G13 (sub-Saharan African countries and Haiti), with cancer risk estimates in the range 0.21–3.94 aflatoxin-induced cancers per year per 100 000 population, with sorghum and maize being the major contributing food commodities. For countries within this cluster, HBsAg+ rates were in the range 5.2–19%. Other clusters with relatively high cancer risks were G03 (sub-Saharan African countries and Paraguay, with maize and sorghum being the major contributing food commodities), G05 (mainly Central and South American countries, with maize, rice, sorghum and wheat being the major contributing food commodities) and G16 (sub-Saharan African countries, with maize and sorghum being the major contributing food commodities). The Committee noted that the aflatoxin-related hepatocellular carcinoma risk rates calculated here are within the range of aflatoxin-related foodborne disease (hepatocellular carcinoma) incidences published by WHO. The Committee noted that a common background cancer rate was used in the cancer potency estimates. A sensitivity analysis showed that changing the background cancer rates has minimal impact on the analysis.

34
Joint FAO/WHO Expert Committee on Food Additives Eighty-third report W
HO
Tec
hnic
al R
epor
t Ser
ies,
No.
100
2, 2
017
Given the relative cancer potencies and international dietary exposure estimates for AFB1 and AFM1, AFM1 will generally make a negligible (<1%) contribution to aflatoxin-induced cancer risk for the general population.
The Committee concluded that enforcing an ML of 10, 8 or 4 µg/kg for ready-to-eat peanuts would have little further impact on dietary exposure to AFT for the general population, compared with setting an ML of 15 µg/kg. At an ML of 4 µg/kg, the proportion of the world market of ready-to-eat peanuts rejected would be approximately double the proportion rejected at an ML of 15 µg/kg (about 20% versus 10%).
RecommendationsThe Committee recommends that efforts continue to reduce aflatoxin exposure using valid intervention strategies, including the development of effective, sustainable and universally applicable preharvest prevention strategies (e.g. (11)).
Based on their contribution to dietary aflatoxin exposure in some areas of the world, rice, wheat and sorghum need to be considered in future risk management activities for aflatoxins.
The Committee recommends further research and efforts to alleviate stunting taking aflatoxin exposure into consideration as a possible contributing factor.
The Committee recommends that if additional epidemiological studies are conducted, they should be prospective studies and performed in a high-exposure area (e.g. in Africa). The Committee advises the development of surveillance programmes for regions for which currently little information on occurrence of aflatoxins exists, carefully considering the impact of these programmes on food security.
A monograph addendum was prepared.
References1. Horn BW. Ecology and population biology of aflatoxigenic fungi in soil. Toxin Rev. 2003;22:351–79.2. Magoha H, Kimanya M, De Meulenaer B, Roberfroid D, Lachat C, Kolsteren P. Association between aflatoxin M1 exposure
through breast milk and growth impairment in infants from Northern Tanzania. World Mycotoxin J. 2014;7:277–84.3. Sinnhuber RO, Lee DJ, Wales JH, Landers MK, Keyl AC. Hepatic carcinogenesis of aflatoxin M1 in rainbow trout (Salmo
gairdneri) and its enhancement by cyclopropene fatty acids. J Natl Cancer Inst. 1974;53:1285–8.4. Wong ZA, Hsieh DP. Mutagenicity of aflatoxins related to their metabolism and carcinogenic potential. Proc Natl Acad Sci
USA. 1976;73:2241–4. 5. Guengerich FP, Johnson WW, Shimada T, Ueng Y-F, Yamazaki H, Langouët S. Activation and detoxification of aflatoxin B1.
Mutat Res. 1998;402:121–8.6. International Agency for Research on Cancer. Some traditional herbal medicines, some mycotoxins, naphthalene and
styrene. IARC Monogr Eval Carcinog Risks Hum. 2002;82:1–556.

35
Contaminants
7. International Agency for Research on Cancer. Chemical agents and related occupations. IARC Monogr Eval Carcinog Risks Hum. 2010;100F:226–48.
8. Pitt JI, Wild CP, Baan RA, Gelderblom WCA, Miller JD, Riley RT et al., editors. Improving public health through mycotoxin control. IARC Sci Publ. 2012;158:1–151.
9. Eaton DL, Beima KM, Bammler TK, Riley RT, Voss KA. Hepatotoxic mycotoxins. Compr Toxicol. 2010;9:527–69.10. Liu Y, Wu F. Global burden of aflatoxin-induced hepatocellular carcinoma: a risk assessment. Environ Health Perspect.
2010;118:818–24. 11. Wild CP, Miller JD, Groopman JD. Mycotoxin control in low- and middle-income countries. Lyon: International Agency for
Research on Cancer; and Geneva: World Health Organization; 2015 (IARC Working Group Report No. 9). 12. Smela ME, Currier SS, Bailey EA, Essigmann JM. The chemistry and biology of aflatoxin B1: from mutational spectrometry to
carcinogenesis. Carcinogenesis. 2001;22:535–45.13. Kamdem LK, Meineke I, Gödtel-Armbrust U, Brockmöller J, Wojnowski L. Dominant contribution of P450 3A4 to the hepatic
carcinogenic activation of aflatoxin B1. Chem Res Toxicol. 2006;19(4):577–86. 14. Wogan GN, Paglialunga S, Newberne PM. Carcinogenic effects of low dietary levels of aflatoxin B1 in rats. Food Cosmet
Toxicol. 1974;12:681–5.15. Williams DE. The rainbow trout liver cancer model: response to environmental chemicals and studies on promotion and
chemoprevention. Comp Biochem Physiol C Toxicol Pharmacol. 2012;155:121–7. 16. Bailey GS, Dashwood R, Loveland PM, Pereira C, Hendricks JD. Molecular dosimetry in fish: quantitative target organ
DNA adduction and hepatocarcinogenicity for four aflatoxins by two exposure routes in rainbow trout. Mutat Res. 1998;399:233–44.
17. Choy WN. A review of the dose–response induction of DNA adducts by aflatoxin B1 and its implications to quantitative cancer-risk assessment. Mutat Res. 1993;296:181–98.
18. Cupid BC, Lightfoot TJ, Russell D, Gant SJ, Turner PC, Dingley KH et al. The formation of AFB1–macromolecular adducts in rats and humans at dietary levels of exposure. Food Chem Toxicol. 2004;42:559–69.
19. Pottenger LH, Andrews LS, Bachman AN, Boogaard PJ, Cadet J, Embry MR et al. An organizational approach for the assessment of DNA adduct data in risk assessment: case studies for aflatoxin B1, tamoxifen and vinyl chloride. Crit Rev Toxicol. 2014;44:348–91.
20. Valsta LM, Hendricks JD, Bailey GS. The significance of glutathione conjugation for aflatoxin B1 metabolism in rainbow trout and coho salmon. Food Chem Toxicol. 1988;26:129–35.
21. Monroe DH, Eaton DL. Comparative effects of butylated hydroxyanisole on hepatic in vivo DNA binding and in vitro biotransformation of aflatoxin B1 in the rat and mouse. Toxicol Appl Pharmacol. 1987;90:401–9.
22. Kensler TW, Roebuck BD, Wogan GN, Groopman JD. Aflatoxin: a 50-year odyssey of mechanistic and translational toxicology. Toxicol Sci. 2011;120(Suppl 1):S28–48.
23. Hussain SP, Schwank J, Staib F, Wang XW, Harris CC. TP53 mutations and hepatocellular carcinoma: insights into the etiology and pathogenesis of liver cancer. Oncogene. 2007;26(15):2166–76.
24. Armbrecht BH. Aflatoxicosis in swine. In: Wyllie TD, Morehouse LG, editors. Mycotoxic fungi, mycotoxins, mycotoxicoses, vol. 2. New York: Marcel Dekker; 1978:227–35.
25. Gizachew D, Szonyi B, Tegegne A, Hanson J, Grace D. Aflatoxin contamination of milk and dairy feeds in the Greater Addis Ababa milk shed, Ethiopia. Food Control. 2016;59:773–9.
26. Atherstone C, Grace D, Lindahl JF, Kang’ethe EK, Nelson F. Assessing the impact of aflatoxin consumption on animal health and productivity. Afr J Food Agric Nutr Dev. 2016;16:10949–66.
27. Zhang YJ, Rossner P Jr, Chen Y, Agrawal M, Wang Q, Wang L et al. Aflatoxin B1 and polycyclic aromatic hydrocarbon adducts, p53 mutations and p16 methylation in liver tissue and plasma of hepatocellular carcinoma patients. Int J Cancer. 2006;119:985–91.
28. McCoy LF, Scholl PF, Sutcliffe AE, Kieszak SM, Powers CD, Rogers HS et al. Human aflatoxin albumin adducts quantitatively compared by ELISA, HPLC with fluorescence detection, and HPLC with isotope dilution mass spectrometry. Cancer Epidemiol Biomarkers Prev. 2008;17:1653–7.
29. Scholl PF, Turner PC, Sutcliffe AE, Sylla A, Diallo MS, Friesen MD et al. Quantitative comparison of aflatoxin B1 serum albumin adducts in humans by isotope dilution mass spectrometry and ELISA. Cancer Epidemiol Biomarkers Prev. 2006;15:823–6.

36
Joint FAO/WHO Expert Committee on Food Additives Eighty-third report W
HO
Tec
hnic
al R
epor
t Ser
ies,
No.
100
2, 2
017
30. Kirk GD, Lesi OA, Mendy M, Szymanska K, Whittle H, Goedert JJ et al. 249ser TP53 mutation in plasma DNA, hepatitis B viral infection, and risk of hepatocellular carcinoma. Oncogene. 2005;24:5858–67.
31. Stern MC, Umbach DM, Yu MC, London SJ, Zhang Z-Q, Taylor JA. Hepatitis B, aflatoxin B1, and p53 codon 249 mutation in hepatocellular carcinomas from Guangxi, People’s Republic of China, and a meta-analysis of existing studies. Cancer Epidemiol Biomarkers Prev. 2001;10:617–25.
32. Azziz-Baumgartner E, Lindblade K, Gieseker K, Rogers HS, Kieszak S, Njapau H et al. Case–control study of an acute aflatoxicosis outbreak, Kenya, 2004. Environ Health Perspect. 2005;113:1779–83.
33. Centers for Disease Control and Prevention. Outbreak of aflatoxin poisoning – eastern and central provinces, Kenya, January–July 2004. MMWR Morb Mortal Wkly Rep. 2004;53(34):790–3.
34. Krishnamachari KAVR, Nagarajan V, Bhat R, Tilak TBG. Hepatitis due to aflatoxicosis: an outbreak in western India. Lancet. 1975;305(7915):1061–3.
35. Ngindu A, Johnson BK, Kenya PR, Ngira JA, Ocheng DM, Nandwa H et al. Outbreak of acute hepatitis caused by aflatoxin poisoning in Kenya. Lancet. 1982;1:1346–8.
36. Aflatoxin Partnership Newsletter. Special PPM Edition. August–October 2016. Addis Ababa: African Union Commission, Department of Rural Economy & Agriculture, Partnership for Aflatoxin Control in Africa; 2016.
37. Wild CP, Gong YY. Mycotoxins and human disease: a largely ignored global health issue. Carcinogenesis. 2010;31:71–82.38. Groopman JD, Egner PA, Schulze KJ, Wu LS-F, Merrill R, Mehra S et al. Aflatoxin exposure during the first 1000 days of life in
rural South Asia assessed by aflatoxin B1–lysine albumin biomarkers. Food Chem Toxicol. 2014;74:184–9.39. Serck-Hanssen A. Aflatoxin-induced fatal hepatitis. Arch Environ Health. 1970;20:729–31.40. Gong YY, Cardwell K, Hounsa A, Egal S, Turner PC, Hall AJ et al. Dietary aflatoxin exposure and impaired growth in young
children from Benin and Togo: cross sectional study. BMJ. 2002;325:20–1.41. Gong YY, Egal S, Hounsa A, Turner PC, Hall AJ, Cardwell KF et al. Determinants of aflatoxin exposure in young children from
Benin and Togo, West Africa: the critical role of weaning. Int J Epidemiol. 2003;32:556–62.42. Gong Y, Hounsa A, Egal S, Turner PC, Sutcliffe AE, Hall AJ et al. Postweaning exposure to aflatoxin results in impaired child
growth: a longitudinal study in Benin, West Africa. Environ Health Perspect. 2004;112:1334–8.43. Turner PC, Moore SE, Hall AJ, Prentice AM, Wild CP. Modification of immune function through exposure to dietary aflatoxin
in Gambian children. Environ Health Perspect. 2003;111:217–20.44. Turner PC, Collinson AC, Cheung YB, Gong Y, Hall AJ, Prentice AM et al. Aflatoxin exposure in utero causes growth faltering
in Gambian infants. Int J Epidemiol. 2007;36:1119–25.45. Mitchell NJ, Riley RT, Egner PA, Groopman JD, Wu F. Chronic aflatoxin exposure in children living in Bhaktapur, Nepal:
extension of the MAL-ED study. J Expo Sci Environ Epidemiol. 2017;27(1):106–11.46. Shirima CP, Kimanya ME, Routledge MN, Srey C, Kinabo JL, Humpf H-U et al. A prospective study of growth and biomarkers
of exposure to aflatoxin and fumonisin during early childhood in Tanzania. Environ Health Perspect. 2015;123(2):173–8.47. Castelino JM, Routledge MN, Wilson S, Dunne DW, Mwatha JK, Gachuhi K et al. Aflatoxin exposure is inversely associated
with IGF1 and IGFBP3 levels in vitro and in Kenyan schoolchildren. Mol Nutr Food Res. 2015;59:574–81. 48. Hernandez-Vargas H, Castelino J, Silver MJ, Dominguez-Salas P, Cros MP, Durand G et al. Exposure to aflatoxin B1 in utero is
associated with DNA methylation in white blood cells of infants in The Gambia. Int J Epidemiol. 2015;44:1238–48.49. Jiang Y, Jolly PE, Ellis WO, Wang JS, Phillips TD, Williams JH. Aflatoxin B1 albumin adduct levels and cellular immune status
in Ghanaians. Int Immunol. 2005;17:807–14. 50. Yeh FS, Yu MC, Mo CC, Luo S, Tong MJ, Henderson BE. Hepatitis B virus, aflatoxins, and hepatocellular carcinoma in southern
Guangxi, China. Cancer Res. 1989;49:2506–9.51. Chen JG, Egner PA, Ng D, Jacobson LP, Munoz A, Zhu YR et al. Reduced aflatoxin exposure presages decline in liver cancer
mortality in an endemic region of China. Cancer Prev Res. 2013;6:1038–45.52. WHO estimates of the global burden of foodborne diseases: foodborne disease burden epidemiology reference group
2007–2015. Geneva: World Health Organization; 2015.53. Ross RK, Yuan JM, Yu MC, Wogan GN, Qian GS, Tu JT et al. Urinary aflatoxin biomarkers and risk of hepatocellular carcinoma.
Lancet. 1992;339:943–6.54. Qian GS, Ross RK, Yu MC, Yuan JM, Gao YT, Henderson BE et al. A follow-up study of urinary markers of aflatoxin exposure
and liver cancer risk in Shanghai, People’s Republic of China. Cancer Epidemiol Biomarkers Prev. 1994;3:3–10.
37
Contaminants
55. Wang LY, Hatch M, Chen CJ, Levin B, You SL, Lu SN et al. Aflatoxin exposure and risk of hepatocellular carcinoma in Taiwan. Int J Cancer. 1996;67:620–5.
56. Lunn RM, Zhang YJ, Wang LY, Chen CJ, Lee PH, Lee CS et al. p53 mutations, chronic hepatitis B virus infection, and aflatoxin exposure in hepatocellular carcinoma in Taiwan. Cancer Res. 1997;57:3471–7.
57. Kuniholm MH, Lesi OA, Mendy M, Akano AO, Sam O, Hall AJ et al. Aflatoxin exposure and viral hepatitis in the etiology of liver cirrhosis in the Gambia, West Africa. Environ Health Perspect. 2008;116:1553–7.
58. Wu HC, Wang Q, Yang HI, Ahsan H, Tsai WY, Wang LY et al. Aflatoxin B1 exposure, hepatitis B virus infection, and hepatocellular carcinoma in Taiwan. Cancer Epidemiol Biomarkers Prev. 2009;18:846–53.
59. Asim M, Sarma MP, Thayumanavan L, Kar P. Role of aflatoxin B1 as a risk for primary liver cancer in north Indian population. Clin Biochem. 2011;44:1235–40.
60. Qi LN, Bai T, Chen ZS, Wu FX, Chen YY, De Xiang B et al. The p53 mutation spectrum in hepatocellular carcinoma from Guangxi, China: role of chronic hepatitis B virus infection and aflatoxin B1 exposure. Liver Int. 2015;35:999–1009.
61. Liu Y, Chang CC, Marsh GM, Wu F. Population attributable risk of aflatoxin-related liver cancer: systematic review and meta-analysis. Eur J Cancer. 2012;48:2125–36.
62. Wojnowski L, Turner PC, Pedersen B, Hustert E, Brockmoller J, Mendy M et al. Increased levels of aflatoxin–albumin adducts are associated with CYP3A5 polymorphisms in The Gambia, West Africa. Pharmacogenetics. 2004;14:691–700.
63. Long XD, Yao JG, Zeng Z, Ma Y, Huang XY, Wei ZH et al. Polymorphisms in the coding region of X-ray repair complementing group 4 and aflatoxin B1–related hepatocellular carcinoma. Hepatology. 2013;58:171–81.
64. Long XD, Zhao D, Wang C, Huang XY, Yao JG, Ma Y et al. Genetic polymorphisms in DNA repair genes XRCC4 and XRCC5 and aflatoxin B1–related hepatocellular carcinoma. Epidemiology. 2013;24:671–81.
65. Yao JG, Huang XY, Long XD. Interaction of DNA repair gene polymorphisms and aflatoxin B1 in the risk of hepatocellular carcinoma. Int J Clin Exp Pathol. 2014;7:6231–44.
66. Tang L, Tang M, Xu L, Luo H, Huang T, Yu J et al. Modulation of aflatoxin biomarkers in human blood and urine by green tea polyphenols intervention. Carcinogenesis. 2008;29(2):411–7.
67. Turner NW, Subrahmanyam S, Piletsky SA. Analytical methods for determination of mycotoxins: a review. Anal Chim Acta. 2009;632(2):168–80.
68. Shephard GS. Aflatoxin analysis at the beginning of the twenty-first century. Anal Bioanal Chem. 2009;395(5):1215–24.69. Shephard GS. Current status of mycotoxin analysis: a critical review. J AOAC Int. 2016;99(4):842–8. 70. Wacoo AP, Wendiro D, Vuzi PC, Hawumba JF. Methods for detection of aflatoxins in agricultural food crops. J Appl Chem.
2014;2014:Article ID 706291.71. Vidal JC, Bonel L, Ezquerra A, Hernández S, Bertolín JR, Cubel C et al. Electrochemical affinity biosensors for detection of
mycotoxins: a review. Biosens Bioelectron. 2013;49:146–58. 72. Trucksess MW, Zhang K. Cutting-edge techniques for mycotoxin analysis. J AOAC Int. 2016;99(4):835–6.73. P4P Purchase for progress. Rome: World Food Programme; 2011.74. P4P triggers further investments in food quality and safety. Rome: World Food Programme; 2014.75. Maximum level and sampling plan for total aflatoxins in peanuts intended for further processing. Rome: Food and
Agriculture Organization of the United Nations, Joint FAO/WHO Food Standards Programme, Codex Alimentarius Commission; 2001 (Codex Stan 209-1999, Rev. 1-2001).
76. General guidelines on sampling. Rome: Food and Agriculture Organization of the United Nations, Joint FAO/WHO Food Standards Programme, Codex Alimentarius Commission; 2004 (Codex Stan CAC/GL50-2004).
77. European Commission. Commission Regulation (EC) No 401/2006 laying down the methods of sampling and analysis for the official control of the levels of mycotoxins in foodstuffs. O J. 2006;L70:12–34.
78. European Commission. Commission Regulation (EU) No 178/2010 amending Regulation (EC) No 401/2006 as regards groundnuts (peanuts), other oil seeds, tree nuts, apricot kernels, liquorice and vegetable oil. O J. 2010;L52:32–43.
79. Adams J, Whitaker TB. Peanuts, aflatoxins and the US Origin Certification Programme. In: Barug D, Van Egmond H, Lopez-Garcia R, Van Osenbrugen T, Visconti A, editors. Meeting the mycotoxin menace. Wageningen: Wageningen Academic; 2004:183–96.

38
Joint FAO/WHO Expert Committee on Food Additives Eighty-third report W
HO
Tec
hnic
al R
epor
t Ser
ies,
No.
100
2, 2
017
80. Working document for information and use in discussions related to contaminants and toxins in the GSCTFF. Rome: Food and Agriculture Organization of the United Nations, Joint FAO/WHO Food Standards Programme, Codex Alimentarius Commission, Codex Committee on Contaminants in Foods; 2016 (CF/10 INF/1).
81. Whitaker T, Slate A, Doko B, Maestroni B, Cannavan A, editors. Sampling procedures to detect mycotoxins in agricultural products. Dordrecht: Springer; 2010.
82. Brera C, Miraglia M, Pineiro M, producers. Sampling procedures for mycotoxin determination. A training video. Rome: Food and Agriculture Organization of the United Nations; 2007.
83. Video on sampling procedures. Istituto Superiore di Sanità; 2015.84. Mycotoxin sampling tool. Version 1.1. Rome: Food and Agriculture Organization of the United Nations; 2013.85. Adegoke GO, Otumu FJ, Akanni AO. Influence of grain quality, heat and processing time on the reduction of aflatoxin B1
levels in “tuwo” and “ogi”: two cereal-based products. Plant Foods Hum Nutr. 1994;43:113–7.86. Kpodo K, Sorensen AK, Jakobbsen M. The occurrence of mycotoxins in fermented maize products. Food Chem. 1996;56:147–
53.87. Fandohan P, Zoumenou D, Hounhouigan DJ, Marasas WFO, Wingfield MJ, Hell K. Fate of aflatoxins and fumonisins during
the processing of maize into food products in Benin. Int J Food Microbiol. 2005;98:249–59.88. Hell K, Cardwell KF, Poehling HM. Relationship between management practices, fungal infection and aflatoxin for stored
maize in Benin. J Phytopathol. 2003;151:690–8.89. Munkvold GP. Crop management practices to minimize the risk of mycotoxins contamination in temperate-zone maize.
In: Leslie JF, Logrieco AF, editors. Mycotoxin reduction in grain chains. Chichester: John Wiley & Sons, Inc.; 2014:59–75. 90. Waliyar F, Kumar PL, Traoré A, Ntare BR, Diarra B, Kodio O. Pre- and postharvest management of aflatoxin contamination
in peanuts. In: Leslie JF, Bandyopadhyay R, Visconti A, editors. Mycotoxins: detection methods, management, public health and agricultural trade. Wallingford: CABI; 2008:209–18.
91. Torres AM, Barros GG, Palacios SA, Chulze SN, Battilani P. Review on pre- and post-harvest management of peanuts to minimize aflatoxin contamination. Food Res Int. 2014;62:11–9.
92. Abbas HK, Wilkinson JR, Zablotowicz RM, Accinelli C, Abel CA, Bruns HA et al. Ecology of Aspergillus flavus, regulation of aflatoxin production, and management strategies to reduce aflatoxin contamination of corn. Toxin Rev. 2009;28(2–3):142–53.
93. Wagacha JM, Muthomi JW. Mycotoxin problem in Africa: current status, implications to food safety and health and possible management strategies. Int J Food Microbiol. 2008;124(1):1–12.
94. Alberts JF, Lilly M, Rheeder JP, Burger HM, Shephard GS, Gelderblom WCA. Technological and community-based methods to reduce mycotoxin exposure. Food Control. 2017;73(Part A):101–9.
95. Dorner JW. Biological control of aflatoxin contamination of crops. J Toxicol Toxin Rev. 2004;23(2–3):425–50.96. Yin Y, Lou T, Yan L, Michailides TJ, Ma Z. Molecular characterization of toxigenic and atoxigenic Aspergillus flavus isolates,
collected from peanut fields in China. J Appl Microbiol. 2009;107(6):1857–65. 97. Guan S, Zhou T, Yin Y, Xie M, Ruan Z, Young JC. Microbial strategies to control aflatoxins in food and feed. World Mycotoxin
J. 2011;4(4):413–24.98. Bandyopadhyay R, Ortega-Beltran A, Akande A, Mutegi C, Atehnkeng J, Kaptoge L et al. Biological control of aflatoxins in
Africa: current status and potential challenges in the face of climate change. World Mycotoxin J. 2016;9(5):771–89. 99. Atehnkeng J, Ojiambo P, Cotty P, Bandyopadhyay R. Field efficacy of a mixture of atoxigenic Aspergillus flavus Link: Fr
vegetative compatibility groups in preventing aflatoxin contamination in maize (Zea mays L.). Biol Control. 2014;72:62–70.100. Pitt JI, Hocking AD. Mycotoxins in Australia: biocontrol of aflatoxin in peanuts. Mycopathologia. 2006;162(3):233–43. 101. Chulze SN, Palazzini JM, Torres AM, Barros G, Ponsone ML, Geisen R et al. Biological control as a strategy to reduce the
impact of mycotoxins in peanuts, grapes and cereals in Argentina. Food Addit Contam Part A Chem Anal Control Expo Risk Assess. 2015;32(4):471–9.
102. Pitt JI, Manthong C, Siriacha P, Chotechaunmanirat S, Markwell PJ. Studies on the biocontrol of aflatoxin in maize in Thailand. Biocontrol Sci Technol. 2015;25(9):1070–91.
103. Bock CH, Cotty PJ. Wheat seed colonized with atoxigenic Aspergillus flavus: characterization and production of a biopesticide for aflatoxin control. Biocontrol Sci Technol. 1999;9:529–43.

39
Contaminants
104. Ehrlich KC, Moore GG, Mellon JE, Bhatnagar D. Challenges facing the biocontrol strategy for eliminating aflatoxin contamination. World Mycotoxin J. 2015;8(2):225–33.
105. Horn BW, Gell RM, Singh R, Sorensen RB, Carbone I. Sexual reproduction in Aspergillus flavus sclerotia: acquisition of novel alleles from soil populations and uniparental mitochondrial inheritance. PloS One. 2016;11(1):e0146169.
106. Payne GA. Process of contamination by aflatoxin-producing fungi and their impact on crops. In: Sinha KK, Bhatnagar D, editors. Mycotoxins in agriculture and food safety. New York: Marcel Dekker, Inc.; 1998:279–306.
107. Fountain JC, Khera P, Yang L, Nayak SN, Scully BT, Lee RD et al. Resistance to Aspergillus flavus in maize and peanut: molecular biology, breeding, environmental stress, and future perspectives. Crop J. 2015;3(3):229–37.
108. Brown RL, Menkir A, Chen Z-Y, Bhatnagar D, Yu J, Yao H et al. Breeding aflatoxin-resistant maize lines using recent advances in technologies – a review. Food Addit Contam Part A Chem Anal Control Expo Risk Assess. 2013;30(8):1382–91.
109. Bhatnagar-Mathur P, Sunkara S, Bhatnagar-Panwar M, Waliyar F, Sharma KK. Biotechnological advances for combating Aspergillus flavus and aflatoxin contamination in crops. Plant Sci. 2015;234:119–32.
110. Warburton ML, Williams WP. Aflatoxin resistance in maize: what have we learned lately? Adv Bot. 2014;2014:Article ID 352831.
111. Kelley RY, Williams WP, Mylroie JE, Boykin DL, Harper JW, Windham GL et al. Identification of maize genes associated with host plant resistance or susceptibility to Aspergillus flavus infection and aflatoxin accumulation. PLoS One. 2012;7(5):e36892.
112. Chen Z-Y, Rajasekaran K, Brown RL, Sayler RJ, Bhatnagar D. Discovery and confirmation of genes/proteins associated with maize aflatoxin resistance. World Mycotoxin J. 2015;8(2):211–24.
113. Arias RS, Dang PM, Sobolev VS. RNAi-mediated control of aflatoxins in peanut: method to analyze mycotoxin production and transgene expression in the peanut/Aspergillus pathosystem. J Vis Exp. 2015;106:e53398.
114. Waliyar F, Osiru M, Ntare BR, Kumar KVK, Sudini H, Traore A et al. Post-harvest management of aflatoxin contamination in groundnut. World Mycotoxin J. 2015;8(2):245–52.
115. Hell K, Fandohan P, Bandyopadhyay R, Kiewnick S, Sikora R, Cotty PJ. Pre- and post-harvest management of aflatoxin in maize: an African perspective. In: Leslie JF, Bandyopadhyay R, Visconti A, editors. Mycotoxins: detection methods, management, public health and agricultural trade. Oxfordshire: CAB International; 2008:219–29.
116. Kolosova A, Stroka J. Substances for reduction of the contamination of feed by mycotoxins: a review. World Mycotoxin J. 2011;4(3):225–56.
117. Battilani P, Leggieri MC. Predictive modelling of aflatoxin contamination to support maize chain management. World Mycotoxin J. 2015;8(2):161–70.
118. Battilani P, Toscano P, Van der Fels-Klerx HJ, Moretti A, Camardo Leggieri M, Brera C et al. Aflatoxin B1 contamination in maize in Europe increases due to climate change. Sci Rep. 2016;6:24328.
119. General standard for contaminants and toxins in food and feed. Rome: Food and Agriculture Organization of the United Nations, Joint FAO/WHO Food Standards Programme, Codex Alimentarius Commission; 1995 (Codex Stan 193-1995).
120. Park DL, Pohland AE. A rationale for the control of aflatoxin in animal feeds. In: Steyn P, Vleggaar R, editors. Mycotoxins and phycotoxins. Amsterdam: Elsevier Science Publishers; 1986:473–82.
121. Kos J, Lević J, Đuragić O, Kokić B, Miladinović I. Occurrence and estimation of aflatoxin M1 exposure in milk in Serbia. Food Control. 2014;38:41–6.
122. El-Tras WF, El-Kady NN, Tayel AA. Infants exposure to aflatoxin M1 as a novel foodborne zoonosis. Food Chem Toxicol. 2011;49:2816–9.
123. FAO/WHO. Principles and methods for the risk assessment of chemicals in food. A joint publication of the Food and Agriculture Organization of the United Nations and the World Health Organization. Geneva: World Health Organization; 2009 (Environmental Health Criteria 240).
124. Hoeting JA, Madigan D, Raftery AE, Volinsky CT. Bayesian model averaging: a tutorial (with comments by M. Clyde, David Draper and E.I. George, and a rejoinder by the authors). Stat Sci. 1999;14(4):382–417.
125. Wu-Williams AH, Zeise L, Thomas D. Risk assessment for aflatoxin B1: a modeling approach. Risk Anal. 1992;12:559–67.126. Bowers J, Brown B, Springer J, Tollefson L, Lorentzen R, Henry S. Risk assessment for aflatoxin: an evaluation based on the
multistage model. Risk Anal. 1993;13(6):637–42.127. Wheeler MW, Bailer AJ. An empirical comparison of low-dose extrapolation from points of departure (PoD) compared to
extrapolations based upon methods that account for model uncertainty. Regul Toxicol Pharmacol. 2013;67:75–82.

40
Joint FAO/WHO Expert Committee on Food Additives Eighty-third report W
HO
Tec
hnic
al R
epor
t Ser
ies,
No.
100
2, 2
017
128. Hoseyni MS. Risk assessment for aflatoxin: III. Modeling the relative risk of hepatocellular carcinoma. Risk Anal. 1992;12:123–6.
129. Schweitzer A, Horn J, Mikolajczyk RT, Krause G, Ott J. Estimations of worldwide prevalence of chronic hepatitis B virus infection: a systematic review of data published between 1965 and 2013. Lancet. 2015;386:1546–55.
3.2 4,15-Diacetoxyscirpenol Explanation4,15-Diacetoxyscirpenol (Fig. 4) (4,15-DAS; (3α,4β)-3-hydroxy-12,13-epoxy- tricothec-9-ene-4,15-diyl diacetate; Chemical Abstracts Service [CAS] No. 2270-40-8) or anguidine is a trichothecene mycotoxin produced mainly by Fusarium langsethiae, F. poae and F. sambucinum (1–4). All trichothecenes have the same core 12,13-epoxytrichothec-9-ene structure, and trichothecene analogues have different patterns of substitution around this core structure. 4,15-DAS is a type A trichothecene, with similar structure to T-2 toxin and HT-2 toxin. Both T-2 toxin and HT-2 toxin have an ester function at the C-8 position, whereas HT-2 toxin additionally has a hydroxyl group at the C-4 position.
The main food groups reported to be contaminated with 4,15-DAS are cereals and cereal-based products, which include wheat, oat, barley, rice, rye, maize and sorghum (2, 5–7). In addition to cereals, 4,15-DAS has been found in coffee beans (8). 4,15-DAS has not previously been evaluated by JECFA. The structurally related type A trichothecenes T-2 toxin and HT-2 toxin were evaluated by JECFA at the fifty-sixth meeting (Annex 1, reference 152). The Committee evaluated 4,15-DAS at the present meeting in response to a request from CCCF. At the present meeting, the Committee reviewed published studies relevant to the human health risk assessment of 4,15-DAS obtained through a comprehensive search of peer-reviewed literature using PubMed, Embase and Global Health. The literature search on the occurrence of and dietary exposure to 4,15-DAS was run using three databases (Scopus, PubMed and Ovid) and a cut-off date of 2000.
Biochemical aspects4,15-DAS is rapidly absorbed and metabolized, with plasma concentrations of 4,15-DAS and two unconjugated metabolites, 15-monoacetoxyscirpenol (15-MAS) and scirpentriol (SCP), peaking within 30–60 minutes after gelatine capsule intubation in swine and decreasing to non-detectable amounts 48 hours after dosing (9). Following oral administration of a single radiolabelled 4,15-DAS dose of 0.55 or 0.66 mg/kg bw to rats and mice, respectively, radiolabel was found in the gastrointestinal tract, liver, kidney and tissues of the lympho-
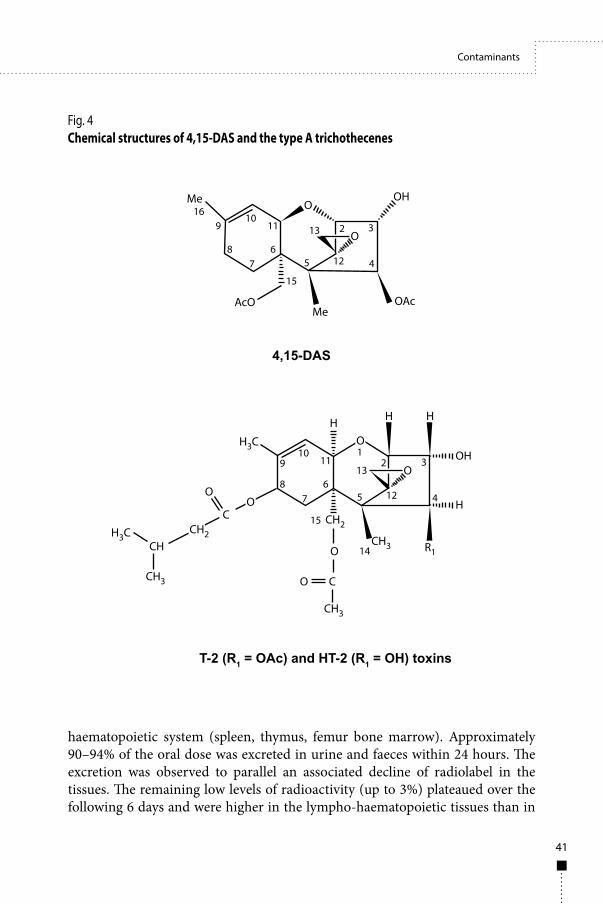
41
Contaminants
haematopoietic system (spleen, thymus, femur bone marrow). Approximately 90–94% of the oral dose was excreted in urine and faeces within 24 hours. The excretion was observed to parallel an associated decline of radiolabel in the tissues. The remaining low levels of radioactivity (up to 3%) plateaued over the following 6 days and were higher in the lympho-haematopoietic tissues than in
T-2 (R1 = OAc) and HT-2 (R1 = OH) toxins
4,15-DAS
169
1011
687
13
5
15
12
2 3
4
OAc
OH
O
O
Me
Me
AcO
Fig. 4Chemical structures of 4,15-DAS and the type A trichothecenes
H3C
CH3
CH3
CH3
H3CCH2
R1
910
11
687
13
15
14
1
5 12
2 3
4
OH
H
H HH
O
O
CO
O
CCH2
CH

42
Joint FAO/WHO Expert Committee on Food Additives Eighty-third report W
HO
Tec
hnic
al R
epor
t Ser
ies,
No.
100
2, 2
017
the other tissues (10). Although the available studies indicate that 4,15-DAS is bioavailable following oral exposure, the extent to which this occurs is not clear. In the pig, the majority of 4,15-DAS was excreted in the faeces as metabolites, with only a small amount of 4,15-DAS or metabolites detected in the urine (11). In mice and rats, the majority of the radiolabel was excreted in the urine (10).
In vitro studies indicate that 4,15-DAS is metabolized by gut microflora to several metabolites, including 15-MAS, SCP, de-epoxy MAS and de-epoxy SCP, in rats, cattle and pigs. The de-epoxidation is considered to be an important step in the detoxification of trichothecenes. However, de-epoxidation was not observed in chickens, horses or dogs (12, 13). In vivo and in vitro studies suggest that metabolism continues in the liver biphasically: in phase I, deacetylation via hydrolysis (first at C-4 and then at C-15) and hydroxylation (at C-7 and C-8), and in phase II, conjugation with glucuronic acid. Glucuronide conjugates of 4,15-DAS were identified in all species tested except chicken (14).
Toxicological studies4,15-DAS is acutely toxic, with oral median lethal dose (LD50) values in the range of 2–15 mg/kg bw in mice, rats and chickens. The lowest oral LD50 was observed in chickens (15). The higher susceptibility of chickens to the toxicity of 4,15-DAS is consistent with biotransformation data that demonstrated the deficiencies of chickens for de-epoxidation in the gut microflora and conjugation reactions in the liver (13, 14, 16).
Effects of acute oral exposure to 4,15-DAS in mice, rats, chickens and pigs included lethargy, diarrhoea, vomiting and flushing of the skin, together with necrosis in the gastrointestinal tract and the lympho-haematopoietic tissues. Limited short-term studies of toxicity were available. In studies in which 4,15-DAS was administered to livestock animals in the diet for periods of up to 9 weeks, oral lesions, feed refusal and reduced body weights or body weight gains were consistently observed. These studies were not considered suitable for an assessment of risk for humans.
No long-term studies of toxicity or carcinogenicity were available.Tests for genotoxicity with 4,15-DAS in bacterial or eukaryotic in
vitro systems gave uniformly negative results. One in vivo study with 4,15-DAS administered intraperitoneally was available (17); however, owing to study limitations, it is unclear whether the observed DNA strand breaks and chromosomal aberrations were a consequence of an interaction between the toxicant and genetic material or were secondary to cytotoxicity and inhibition of protein synthesis by 4,15-DAS. The Committee noted that DNA strand breaks and chromosomal aberrations were observed for T-2 toxin and that these effects

43
Contaminants
were observed only at doses known to cause cytotoxicity and inhibition of protein and DNA synthesis (Annex 1, reference 152).
No reproductive or developmental toxicity studies conducted by the oral route of exposure in mammalian species were available.
Structure–activity predictions for the toxicity of the metabolites of 4,15-DAS and the reported potency ranking for in vitro cytotoxicity and inhibition of protein synthesis indicate that the metabolites are less toxic than the parent compound (18–20). However, the available comparative data for 4,15-DAS and 15-MAS indicate that adverse effects are induced with similar potency when the compounds are administered by the oral route of exposure (21–23). As 4,15-DAS is rapidly converted to 15-MAS and other common metabolites in both the gut microflora and the liver, the toxicity of 4,15-DAS in vivo can be considered to include that of 15-MAS.
Because of the limited availability of data on 4,15-DAS, the Committee considered its similarity with the other type A trichothecenes, T-2 and HT-2, by comparing the available toxicological data for these trichothecenes and reviewing studies of combined effects. The comparison of 4,15-DAS with T-2/HT-2 toxin is supported by the similar chemical structures of type A trichothecenes and evidence that, similar to other trichothecene mycotoxins, 4,15-DAS has been shown to be a potent inhibitor of the initial step of protein synthesis (20, 24–26); to inhibit DNA synthesis (27); and to induce apoptosis in T-lymphocytes (28–30).
When comparing in vitro cytotoxic effects on blood cell progenitors or mitogen-stimulated human lymphocytes (31–35), T-2 toxin was consistently observed to be more potent than 4,15-DAS. A comparison of in vivo effects was limited by differences in study design and a limited number of comparable studies between the available databases. The critical effects identified for T-2 toxin at the fifty-sixth meeting of JECFA were decreased white blood cell counts, haemoglobin and red blood cells and a decreased lymphocyte proliferative response to mitogen stimulation, following short-term dietary exposure of pigs to T-2 toxin at a dose of 0.03 mg/kg bw per day (36). In the short-term dietary pig studies conducted with 4,15-DAS, which involved only a few animals, no effects on blood cell counts were observed at doses up to 0.4 mg/kg bw per day, the highest dose tested (37, 38). However, evidence from other animal studies suggests that 4,15-DAS and T-2 toxin cause similar immunotoxic and haematotoxic effects following oral exposure. In mice, depletion of lymphocytes from lymphoid tissues was observed following 2-day administration of 4,15-DAS by gavage at a dose of 3 mg/kg bw per day (39). Similar observations were reported after T-2 toxin was administered to mice as a single gavage dose of 4 mg/kg bw (40). In addition, although a comparable rat study was not available for T-2 toxin, administration of oral doses of 4,15-DAS to rats at 1 mg/kg bw 3

44
Joint FAO/WHO Expert Committee on Food Additives Eighty-third report W
HO
Tec
hnic
al R
epor
t Ser
ies,
No.
100
2, 2
017
times a week for 5 weeks (equivalent to 0.43 mg/kg bw per day) was associated with decreased haemoglobin, haematocrit and red blood cell count from day 7 onward. Atrophy and necrosis of the bone marrow, thymus, spleen, lymph nodes and gastrointestinal tract were observed within 2–4 weeks of treatment (41).
Although T-2 toxin appears to be more potent than 4,15-DAS in vitro and in vivo, the available data are insufficient for establishing relative potencies.
Of the few studies that considered the combined effects of 4,15-DAS and T-2 toxin, a consistent additive dose effect was observed for end-points such as in vitro inhibition of protein synthesis and lymphocyte proliferation (20, 34), oral lethal doses following acute exposure (42) and the incidence of oral lesions, feed refusal and decreased egg production following short-term dietary exposure in chickens (43).
Observations in domestic animals/veterinary toxicologyFusarium species have been associated with a number of animal toxicoses. However, only two case reports in bovines and chickens were identified in the literature that specifically identified 4,15-DAS as one of the mycotoxins associated with toxicoses. In these cases, the clinical observations included, but were not limited to, diarrhoea, loss of appetite, dehydration, weakness and death (44, 45). These chickens revealed necrosis in the gastrointestinal tract and bursa of Fabricius (site of haematopoiesis), as well as depletion of lymphocytes (45).
Observations in humansIn the 1970s and early 1980s, 4,15-DAS was investigated under the name anguidine for its potential as a cancer chemotherapeutic agent using intravenous infusion dosing at doses ranging from 0.1 to 10 mg/m2 (equivalent to 2.7–270 µg/kg bw), but these investigations were ultimately discontinued due to the lack of sufficient efficacy against tumours and observations of adverse effects in phase II clinical trials. The reported adverse effects in these trials were consistent with the target sites of toxicity of 4,15-DAS observed in the animal studies. These adverse effects included myelosuppression, which was characterized as decreased levels of lymphocytes and platelets, vomiting and hypotension beginning at doses equivalent to 81 µg/kg bw and reports of mild nausea at lower doses equivalent to 41–65 µg/kg bw (46–48).
In historical outbreaks of illness associated with Fusarium species where 4,15-DAS was investigated, 4,15-DAS was not detected (49, 50).

45
Contaminants
Analytical methods The Committee reviewed and identified specific analytical issues associated with the screening and quantification of 4,15-DAS and modified3 forms of 4,15-DAS, including 4,15-DAS metabolites in human biomarker studies. Several screening tests using antibodies have been established for the detection of 4,15-DAS (51). However, most of the immunoassays for trichothecenes have moderate or strong cross-reactivity with closely related compounds (52). Results from ELISA tests should always be confirmed using quantitative chromatographic methods. For quantification, 4,15-DAS is commonly extracted from the food matrix by acetonitrile/water or methanol/water; however, dilute-and-shoot extraction in combination with LC-MS/MS is more often used in more recently described methods (53). Modified forms of 4,15-DAS – 15-MAS-3-glucoside, 15-MAS-4-glucoside and DAS-3-glucoside – were identified in a maize reference material by LC–Orbitrap MS (54). The degradation product DAS-M1 was identified by LC–high-resolution MS after heating of 4,15-DAS in an aqueous solution, and it was quantified by LC-MS/MS (1). In human biomonitoring studies, 4,15-DAS was analysed in urine by either LC-MS/MS (55) or gas chromatography (GC)–MS/MS (56). The main issue related to analytical methods for the quantification of 4,15-DAS is that 4,15-DAS is usually detected as one of many mycotoxins using multi-mycotoxin methods. This means that the LOQ can vary considerably between methods, possibly resulting in many left-censored data, directly increasing exposure assessment uncertainty. A challenge to the analysis of 4,15-DAS in food and feed is the lack of harmonized methods, performance criteria for analytical methods, certified reference materials and proficiency tests. Analysis of modified forms of 4,15-DAS, including metabolites, has the additional challenge that not all analytical standards are currently available.
Sampling protocols No published information on sampling protocols specifically for 4,15-DAS was found. However, as for other trichothecene mycotoxins, it is assumed that 4,15-DAS will be distributed unevenly in a batch of raw materials.
Although no sampling protocols specific to 4,15-DAS were found, some generic guidelines on sampling of mycotoxins are available. The FAO sampling tool on sampling protocols, developed for both food analysts and regulatory
3 The term “modified” is used to refer to covalently bound metabolites that are produced by fungi, formed through an interaction between 4,15-DAS and matrix constituents in a plant or during food processing, or metabolized in the human or animal body.
46
Joint FAO/WHO Expert Committee on Food Additives Eighty-third report W
HO
Tec
hnic
al R
epor
t Ser
ies,
No.
100
2, 2
017
officials, can be used (57), and sampling protocols are available from the Codex Alimentarius Commission standard CODEX STAN 193-1995 (58). Furthermore, the European Commission has sampling protocols for the purpose of official control of the levels of mycotoxins in foodstuffs, as described in Regulation (EC) No 401/2006 and its amendments (59).
Effects of processing Reports on the effects of food processing on the occurrence of 4,15-DAS in foods were evaluated by the Committee. No papers were found on the distribution of 4,15-DAS in the fractions after sorting, cleaning and milling of cereals. One paper reported that 4,15-DAS in aqueous solution was hydrolysed to DAS-M1 after thermal treatment.
Prevention and control There is little information available on specific intervention measures to prevent 4,15-DAS contamination. As 4,15-DAS is produced by Fusarium species, management strategies to prevent contamination of crops with 4,15-DAS may focus on prevention of Fusarium infection and growth in the whole production chain and decontamination procedures of harvested crops. Preharvest measures to reduce Fusarium infection focus on careful consideration of management strategies and plant protection products to keep plants healthy and the Fusarium inoculum low (60). Soil type (61) and tillage (62) influence survival and propagation of Fusarium. Management practices that aim at healthy plants should be implemented by sowing and harvest at the appropriate time (60, 63), careful use of fertilizer (64) and irrigation (65). Use of plant protection products should be carefully considered, as they are not always effective against Fusarium (66). Currently, several biocontrol practices are under development aiming at either outcompeting toxigenic Fusarium species (67) or inhibiting biosynthesis of mycotoxins (68). Crop rotation with non-host crops such as beets, onions, beans, clover, alfalfa, vegetables or chicory will prevent buildup of inoculum (63). Use of existing crop cultivars resistant to Fusarium may reduce fungal infection and possibly 4,15-DAS contamination of the crop (69). No literature was identified on postharvest strategies to prevent 4,15-DAS contamination, other than a small number of papers on decontamination treatments. Irradiation (70), thermal treatment (1) and chemical decontamination (71) showed effects on 4,15-DAS decontamination under experimental settings. Biodecontamination of feed can be carried out using microorganisms (or enzymes) and adsorbents, which, when added to feed, can reduce the bioavailability of 4,15-DAS (72).
47
Contaminants
Levels and patterns of contamination in food commodities The Committee evaluated data on 4,15-DAS contamination in food that were submitted to the GEMS/Food contaminants database and that were derived from about 80 papers published mainly between 2000 and 2016. The number of data submitted to the GEMS/Food contaminants database on the occurrence of 4,15-DAS in food was relatively low (16 814 records), and only 2.3% of the records had positive data (above the LOD). The main food commodities reported to be contaminated with 4,15-DAS were cereals and cereal-based foods. Few records on other food commodities were found, and generally no 4,15-DAS was detected in those other food commodities (specified as not detected or below the LOD). The highest prevalence of 4,15-DAS was found in sorghum from Africa (14% from 1083 records), with a highest value of 109 µg/kg. No 4,15-DAS was detected in samples from the Americas (2400 records). Less than 1% (0.6%) of the samples from the Western Pacific Region (1039 records) were contaminated with 4,15-DAS, with the highest level of 8 µg/kg in potato chips. A prevalence of 4% occurred in samples from the Eastern Mediterranean Region (450 records), with analyses only for sorghum. In Europe (11 842 records), the prevalence of 4,15-DAS in food was 1.5%, mainly in cereals and cereal-based food, as well as one sample of cereal-based food for infants and one snack food sample. Data from the scientific literature confirmed the low prevalence of 4,15-DAS in food and the relative importance of cereals. Results were mainly from European countries, which reported low prevalence and low concentrations of 4,15-DAS (73). In Spain, a high prevalence of 4,15-DAS and high contamination were detected in coffee (non-specified), with levels up to 402 µg/kg (74). Very few publications were found for the Americas, except a few papers published before the year 2000. Some papers were found on the occurrence of 4,15-DAS in the Western Pacific Region: low concentrations (<5 µg/kg) and a prevalence of 20% for corn, wheat and barley in Japan (2); and high concentrations (up to 1000 µg/kg) for maize in New Zealand (75). A low background level of 4,15-DAS was found in the African Region in maize, wheat and barley (range of prevalence 5–10%), with levels up to 97 µg/kg in Tunisia from the Eastern Mediterranean Region (6). The prevalence of 4,15-DAS in food samples from India was low, except for sorghum (prevalence of 43%, concentrations up to 70 µg/kg) (76). One paper from Pakistan reported a 10% prevalence of 4,15-DAS in maize samples, with a mean concentration of 516 µg/kg (77). Feed samples from the Russian Federation showed high concentrations of 4,15-DAS (up to 490 µg/kg) and high prevalence (up to 90%). However, these results were from one paper using an ELISA method with no confirmatory analysis (78).

48
Joint FAO/WHO Expert Committee on Food Additives Eighty-third report W
HO
Tec
hnic
al R
epor
t Ser
ies,
No.
100
2, 2
017
It can be concluded that the prevalence and contamination level of 4,15-DAS in food samples from various regions in the world are low, based on the results from both the GEMS/Food contaminants database and the scientific literature. Reports of high prevalence and high contamination levels of 4,15-DAS were mainly published before 2000. The main food group contributing to the occurrence of 4,15-DAS is cereals, and most reports are on sorghum. The other food group in which 4,15-DAS was occasionally detected was coffee.
No reports on transfer of 4,15-DAS from feed to food of animal origin were found.
Food consumption and dietary exposure assessment The Committee reviewed national dietary exposures to 4,15-DAS from the literature and calculated international estimates of dietary exposure for a number of regions in the world using concentration data from the GEMS/Food contaminants database and consumption data from the GEMS/Food cluster diets. Some estimates of mean dietary exposure were reported in published papers, such as 15 ng/kg bw per day in Finland (79) for consumption of cereals, between 1 and 8.5 ng/kg bw per day in Spain for consumption of cereals by adults and children, respectively (80), between 0.04 and 0.2 ng/kg bw per day in Spain for consumption of coffee by adolescents and adults, respectively (8), 24.7 ng/kg bw per day in Tunisia for consumption of cereals (6) and 0.1 ng/kg bw per day in Morocco for consumption of rice (6). The estimates for Finland and Tunisia include the major sources of dietary exposure; however, this is not the case for Morocco, where consumption of rice is very low, and for Spain, where there was no occurrence at all in cereals. For the international estimates of dietary exposure to 4,15-DAS, considering the very high proportion of non-detected analytical results for 4,15-DAS in foods (from 86% for Africa up to 100% for the Americas), an LB–UB approach was taken by the Committee. Moreover, considering the relatively low number of food commodities with quantified data from all over the world, it was decided to calculate the dietary exposure only for WHO regions for which data were available, and not for all cluster diets (Table 4). The WHO regions analysed for which both concentration data and consumption data were available were Africa (G13 cluster diet with sorghum), Eastern Mediterranean (G13 cluster diet with sorghum), Europe (average of G07, G08, G11, G15 cluster diets with all 18 GEMS/Food commodities), Western Pacific (G10 cluster diets with all 18 GEMS/Food commodities) and the Americas (G10 cluster diet with cereals, food for infants, legumes and pulses, nuts and oilseeds, starchy roots).

49
Contaminants
In order to limit the uncertainty in its estimates, the Committee decided to refine the UB estimates, taking into consideration the number of food commodities for which concentration data were available from WHO regions. Therefore, three scenarios for exposure to 4,15-DAS were calculated using this UB tiered approach for WHO regions when this was possible (e.g. Africa, Eastern Mediterranean, Europe and Western Pacific).
The best refined international LB–UB mean (high) exposure estimates for adults were 1.4–5 ng/kg bw per day (2.8–10 ng/kg bw per day) for Africa, 0–154 ng/kg bw per day (0–308 ng/kg bw per day) for the Americas (these results have a high level of uncertainty due to no detections at all), 0.4–4 ng/kg bw per day (0.8–8 ng/kg bw per day) for the Eastern Mediterranean, 2.8–41 ng/kg bw per day (5.6–82 ng/kg bw per day) for Europe and 0.4–6.5 ng/kg bw per day (0.8–13 ng/kg bw per day) for the Western Pacific. The Committee noted that the very high degree of censorship (below LOD/LOQ) in the concentration data set and the relatively high LOQs (particularly for the Americas) have a considerable influence on the results. Thus, there is substantial uncertainty in the estimated dietary exposures, and these need to be interpreted with caution.
Dose–response analysisOwing to limitations in the study design of the few available studies on 4,15-DAS, these studies were considered to be inadequate for dose–response modelling.
Table 4International estimates of exposure to 4,15-DAS via food for adultsa
Regional areaLB mean exposure (ng/kg bw per day)
UB mean exposure (scenario 1/2/3)
(ng/kg bw per day)
LB–UB P90 exposureb (scenario 1/2/3)
(ng/kg bw per day)Left-censorship
(%)Africa 1.4 20.3/20.3/5 2.8–40.6/40.6/10 86(Burkina Faso, Ethiopia, Mali)Americas 0 154/na/na 0–308/na/na 100(Canada)Eastern Mediterranean 0.4 17/17/4 0.8–34/34/8 96(Sudan)Europe 2.8 363/69/41 5.6–726/138/82 98.3(Czech Republic, Finland, France, Germany, Slovenia, United Kingdom)Western Pacific 0.4 239/57/6.5 0.8–478/114/13 99.4(China [Hong Kong Special Adminis-trative Region], New Zealand, Japan)
na: not able to be calculated; P90: 90th percentilea Body weight used is 60 kg.b P90 exposure is estimated by the Committee as twice the mean exposure (81).
50
Joint FAO/WHO Expert Committee on Food Additives Eighty-third report W
HO
Tec
hnic
al R
epor
t Ser
ies,
No.
100
2, 2
017
EvaluationThe Committee concluded that there are insufficient toxicological data available to derive a point of departure for the risk assessment of 4,15-DAS alone. There are limitations in the available short-term toxicity studies and no data from chronic exposure and reproductive and developmental toxicity studies.
4,15-DAS and T-2/HT-2 toxin are structurally similar, and there is evidence that they cause similar effects at the biochemical and cellular levels, have similarities in toxic effects in vivo and have an additive dose effect when co-exposure occurs. Therefore, the evidence was considered sufficient by the Committee to support including 4,15-DAS in the group PMTDI for T-2 and HT-2 toxin established at the fifty-sixth meeting of JECFA (Annex 1, reference 152). The PMTDI of 0.06 µg/kg bw for T-2 and HT-2 toxin, alone or in combination, was established based on a lowest-observed-adverse-effect level (LOAEL) of 0.03 mg/kg bw per day associated with changes in white blood cell counts following 3 weeks of dietary exposure in pigs (36) and the application of an uncertainty factor of 500. The inclusion of 4,15-DAS in the group PMTDI of 0.06 µg/kg bw is considered to be a conservative approach when taking into consideration the observation that T-2 toxin was consistently more potent than 4,15-DAS when comparing similar in vitro and in vivo end-points. The Committee noted that there is a paucity of occurrence data for 4,15-DAS and that what data were available to the Committee were frequently left-censored and had relatively high LOQs, thereby increasing the uncertainty in the dietary exposure assessment.
In the 2001 JECFA evaluation, the total dietary exposure to T-2 toxin and HT-2 toxin was estimated only from the GEMS/Food European diet owing to the fact that data on these toxins were not available from regions other than Europe. The total LB mean dietary exposure to T-2 toxin plus HT-2 toxin was estimated to be 16.3 ng/kg bw per day, with wheat, barley and oats being the major dietary sources (Annex 1, reference 152).
The Committee noted that only LB dietary exposure estimates for Europe were available for the sum of T-2, HT-2 and 4,15-DAS. From these estimates, the sum of the LB dietary exposure estimates for 4,15-DAS of up to 0.0028 µg/kg bw per day and the total dietary exposures estimated for T-2 plus HT-2 of 0.016 µg/kg bw per day results in a LB mean dietary exposure of 0.019 µg/kg bw per day and in a LB high dietary exposure estimated at 0.038 µg/kg bw per day (twice the mean (81)). It was not possible to estimate the UB dietary co-exposure because of the lack of UB data reported for T-2 and HT-2 toxins in the previous 2001 JECFA evaluation together with the substantial uncertainty that is reported for UB estimates of dietary exposure to 4,15-DAS. The Committee concluded that these LB estimates for Europe do not exceed the group PMTDI for T-2, HT-2 and 4,15-DAS.
51
Contaminants
RecommendationsThe Committee was made aware of new toxicity studies on T-2/HT-2 toxin and therefore recommends an update of the 2001 JECFA evaluation of T-2/HT-2 toxin.
In addition, studies are needed to address the relative potencies of 4,15-DAS and T-2/HT-2 toxin, the species differences with regard to bioavailability following oral exposure, the potential for chronic toxicity from exposure to concentrations in the diet, and the potential for reproductive and developmental toxicity of 4,15-DAS. The Committee recommends improving the LOQs for 4,15-DAS, particularly when developing multi-mycotoxin methods. The Committee encourages the development of analytical standards, suitable certified reference materials and proficiency tests to support the analysis of 4,15-DAS and its modified forms, including biomarkers. The Committee recommends that more food commodities be analysed using methods with appropriate sensitivity that would allow the refinement of its estimates of dietary exposure to DAS, T-2 and HT-2 from all regions.
A monograph was prepared.
References1. Shams M, Mitterbauer R, Corradini R, Wiesenberger G, Dall’Asta C, Schuhmacher R et al. Isolation and characterization
of a new less-toxic derivative of the Fusarium mycotoxin diacetoxyscirpenol after thermal treatment. J Agric Food Chem. 2011;59:9709–14.
2. Tamura M, Mochizuki N, Nagatomi Y, Harayama K, Toriba A, Hayakawa K. A method for simultaneous determination of 20 Fusarium toxins in cereals by high-resolution liquid chromatography–Orbitrap mass spectrometry with a pentafluorophenyl column. Toxins. 2015;7:1664–82.
3. Lysøe E, Frandsen RJN, Divon HH, Terzi V, Orrù L, Lamontanara A et al. Draft genome sequence and chemical profiling of Fusarium langsethiae, an emerging producer of type A trichothecenes. Int J Food Microbiol. 2016;221:29–36.
4. Thrane U, Adler A, Clasen PE, Galvano F, Langseth W, Logrieco A et al. Diversity in metabolite production by Fusarium langsethiae, Fusarium poae, and Fusarium sporotrichioides. Int J Food Microbiol. 2004;95:257–66.
5. GEMS/Food contaminants database. Geneva: World Health Organization, 2013.6. Serrano AB, Font G, Ruiz MJ, Ferrer E. Co-occurrence and risk assessment of mycotoxins in food and diet from Mediterranean
area. Food Chem. 2012;135:423–9.7. Schollenberger M, Muller HM, Rufle M, Suchy S, Plank S, Drochner W. Natural occurrence of 16 Fusarium toxins in grains and
feedstuffs of plant origin from Germany. Mycopathologia. 2006;161:43–52.8. Garcia-Moraleja A, Font G, Manes J, Ferrer E. Analysis of mycotoxins in coffee and risk assessment in Spanish adolescents
and adults. Food Chem Toxicol. 2015;86:225–33.9. Bauer J, Bollwahn W, Gareis M, Gedek B, Heinritzi K. Kinetic profiles of diacetoxyscirpenol and two of its metabolites in
blood serum of pigs. Appl Environ Microbiol. 1985;49:842–5.10. Wang J-S, Busby WF Jr, Wogan GN. Comparative tissue distribution and excretion of orally administered
[3H]diacetoxyscirpenol (anguidine) in rats and mice. Toxicol Appl Pharmacol. 1990;103:430–40.

52
Joint FAO/WHO Expert Committee on Food Additives Eighty-third report W
HO
Tec
hnic
al R
epor
t Ser
ies,
No.
100
2, 2
017
11. Bauer J, Gareis M, Gedek B. Metabolism of the trichothecenes T-2 toxin, diacetoxyscirpenol, and deoxynivalenol by farm animals. In: Chelkowski J, editor. Topics in secondary metabolism, vol. 2. Fusarium: mycotoxins, taxonomy and pathogenicity. Amsterdam: Elsevier; 1989:139–65.
12. Swanson SP, Nicoletti J, Rood HDJ, Buck WB, Cote LM, Yoshizawa T. Metabolism of three trichothecene mycotoxins, T-2 toxin, diacetoxyscirpenol and deoxynivalenol, by bovine rumen microorganisms. J Chromatogr. 1987;414:335–42.
13. Swanson SP, Helaszek C, Buck WB, Rood HDJ, Haschek WM. The role of intestinal microflora in the metabolism of trichothecene mycotoxins. Food Chem Toxicol. 1988;26:823–9.
14. Yang S, De Boevre M, Zhang H, De Ruyck K, Sun F, Wang Z et al. Unraveling the in vitro and in vivo metabolism of diacetoxyscirpenol in various animal species and human using ultrahigh-performance liquid chromatography–quadrupole/time-of-flight hybrid mass spectrometry. Anal Bioanal Chem. 2015;407:8571–83.
15. Richardson KE, Hamilton PB. Comparative toxicity of scirpentriol and its acetylated derivatives. Poult Sci. 1990;69(3):397–402.
16. Young JC, Zhou T, Yu H, Zhu H, Gong J. Degradation of trichothecene mycotoxins by chicken intestinal microbes. Food Chem Toxicol. 2007;45:136–43.
17. Hassanane M, Abdalla E, El-Fiky S, Amer M, Hamdy A. Mutagenicity of the mycotoxin diacetoxyscirpenol on somatic and germ cells of mice. Mycotoxin Res. 2000;16:53–64.
18. Ueno Y. General toxicology. In: Ueno Y, editor. Developments in food science. IV. Trichothecenes – Chemical, biological and toxicological aspects. Tokyo/Amsterdam: Kodansha/Elsevier; 1983:125–46.
19. Ueno Y. Mode of action of trichothecenes. Pure Appl Chem. 1977;49:1737–45.20. Thompson WL, Wannemacher RW Jr. Structure–function relationships of 12,13-epoxytrichothecene mycotoxins in cell
culture: comparison to whole animal lethality. Toxicon. 1986;24(10):985–94.21. Mirocha CJ, Pawlowsky RJ, Zhu TX, Lee YW. Chemistry and biological activity of Fusarium roseum mycotoxins. In: Lacey J,
editor. Trichothecenes and other mycotoxins. Chichester: John Wiley & Sons, Ltd.; 1985:291–305.22. Richardson KE, Hamilton PB. Comparative toxicity of scirpentriol and its acetylated derivatives. Poult Sci. 1990;69(3):397–
402. 23. Ademoyero AA, Hamilton PB. Mouth lesions in broiler chickens caused by scirpenol mycotoxins. Poult Sci. 1991;70:2082–9.24. Tscherne JS, Pestka S. Inhibition of protein synthesis in intact HeLa cells. Antimicrob Agents Chemother. 1975;8:479–87.25. Mizuno S. Mechanism of inhibition of protein synthesis initiation by diacetoxyscirpenol and fusarenon X in the reticulocyte
lysate system. Biochim Biophys Acta. 1975;377:207–14.26. Cundliffe E, Davies JE. Inhibition of initiation, elongation, and termination of eukaryotic protein synthesis by trichothecene
fungal toxins. Antimicrob Agents Chemother. 1977;11:491–9.27. Cooray R. Effects of some mycotoxins on mitogen-induced blastogenesis and SCE frequency in human lymphocytes. Food
Chem Toxicol. 1984;22:529–34.28. Lee DH, Park T, Kim HW. Induction of apoptosis by disturbing mitochondrial-membrane potential and cleaving PARP in
Jurkat T cells through treatment with acetoxyscirpenol mycotoxin. Biol Pharm Bull. 2006;29(4):648–54.29. Nasri T, Bosch RR, Voorde ST, Fink-Gremmels J. Differential induction of apoptosis by type A and B trichothecenes in Jurkat
T-lymphocytes. Toxicol In Vitro. 2006;20:832–40.30. Jun DY, Kim JS, Park HS, Song WS, Bae YS, Kim YH. Cytotoxicity of diacetoxyscirpenol is associated with apoptosis by
activation of caspase-8 and interruption of cell cycle progression by down-regulation of cdk4 and cyclin B1 in human Jurkat T cells. Toxicol Appl Pharmacol. 2007;222:190–201.
31. Parent-Massin D, Fuselier R, Thouvenot D. In vitro toxicity of trichothecenes on human haematopoietic progenitors. Food Addit Contam. 1994;11:441–7.
32. Parent-Massin D, Thouvenot D. In vitro toxicity of trichothecenes on rat haematopoietic progenitors. Food Addit Contam. 1995;12:41–9.
33. Rio B, Lautraite S, Parent-Massin D. In vitro toxicity of trichothecenes on human erythroblastic progenitors. Hum Exp Toxicol. 1997;16:673–9.
34. Thuvander A, Wikman C, Gadhasson I. In vitro exposure of human lymphocytes to trichothecenes: individual variation in sensitivity and effects of combined exposure on lymphocyte function. Food Chem Toxicol. 1999;37:639–48.
53
Contaminants
35. Froquet R, Sibiril Y, Parent-Massin D. Trichothecene toxicity on human megakaryocyte progenitors (CFU-MK). Hum Exp Toxicol. 2001;20:84–9.
36. Rafai P, Tuboly S, Bata A, Tilly P, Vanyi A, Papp Z et al. Effect of various levels of T-2 toxin in the immune system of growing pigs. Vet Rec. 1995;136:511–4.
37. Harvey RB, Kubena LF, Elissalde MH, Corrier DE, Huff WE, Rottinghaus GE et al. Co-contamination of swine diets by aflatoxin and diacetoxyscirpenol. J Vet Diagn Invest. 1991;3:155–60.
38. Weaver GA, Kurtz HJ, Bates FY, Mirocha CJ, Behrens JC, Hagler WM. Diacetoxyscirpenol toxicity in pigs. Res Vet Sci. 1981;31:131–5.
39. Ziprin RL, Corrier DE. Listeriosis in diacetoxyscirpenol-treated mice. Am J Vet Res. 1987;48:1516–9.40. Corrier DE, Ziprin RL. Immunotoxic effects of T-2 toxin on cell-mediated immunity to listeriosis in mice: comparison with
cyclophosphamide. Am J Vet Res. 1986;47(9):1956–86.41. Janse van Rensburg DF, Thiel PG, Jaskiewicz K. Short-term effects of two Fusarium toxins, diacetoxyscirpenol and
neosolaniol monoacetate, in male Wistar rats. Food Chem Toxicol. 1987;25:767–71.42. Hoerr FJ, Carlton WW, Yagen B. Mycotoxicosis caused by a single dose of T-2 toxin or diacetoxyscirpenol in broiler chickens.
Vet Pathol. 1981;18:652–64. 43. Diaz GJ, Squires EJ, Julian RJ, Boermans HJ. Individual and combined effects of T-2 toxin and DAS in laying hens. Br Poult
Sci. 1994;35:393–405.44. Galhardo M, Birgel EH, So-Ares LMV, Furlani RPZ, Birgel EH. Intoxicação por Diacetoxiscirpenol em bovinos alimentados com
polpa cítrica no Estado de São Paulo, Brasil. Braz J Vet Res Anim Sci. 1997;34(2):90–1.45. Konjevic D, Srebocan E, Gudan A, Lojkic I, Severin K, Sokolovic M. A pathological condition possibly caused by spontaneous
trichothecene poisoning in Brahma poultry: first report. Avian Pathol. 2004;33:377–80.46. Murphy WK, Burgess MA, Valdivieso M, Livingston RB, Bodey GP, Freireich EJ. Phase I clinical evaluation of anguidine.
Cancer Treat Rep. 1978;62:1497–1502.47. DeSimone PA, Greco FA, Lessner HF. Phase I evaluation of a weekly schedule of anguidine. Southeastern Cancer Study Group
Committee on Gastrointestinal Malignancies. Cancer Treat Rep. 1979;63:2015–7.48. DeSimone PA, Greco FA, Lessner HF, Bartolucci A. Phase II evaluation of anguidine (NSC 141537) in 5-day courses in
colorectal adenocarcinoma. A Southeastern Cancer Study Group Trial. Am J Clin Oncol. 1986;9:187–8.49. Beardall JM, Miller JD. Diseases in humans with mycotoxins as possible causes. In: Miller JD, Trenholm HL, editors.
Mycotoxins in grain: compounds other than aflatoxins. St Paul (MN): Eagan Press; 1994:487–539.50. Toxicology and occurrence of nivalenol, fusarenon X, diacetoxyscirpenol, neosolaniol and 3- and 15-acetyldeoxynivalenol: a
review of six trichothecenes. Bilthoven: National Institute for Public Health and the Environment (RIVM); 2002.51. Hack R, Klaffer U, Terplan G. A monoclonal-antibody to the trichothecene mycotoxin diacetoxyscirpenol. Lett Appl Microbiol.
1989;8:71–5.52. Tangni EK, Motte JC, Callebaut A, Pussemier L. Cross-reactivity of antibodies in some commercial deoxynivalenol test kits
against some fusariotoxins. J Agric Food Chem. 2010;58:12625–33.53. Lopez P, de Rijk T, Sprong RC, Mengelers MJB, Castenmiller JJM, Alewijn M. A mycotoxin-dedicated total diet study in the
Netherlands in 2013: Part II – Occurrence. World Mycotoxin J. 2016;9:89–108.54. Nakagawa H, Sakamoto S, Sago Y, Nagashima H. Detection of type A trichothecene di-glucosides produced in corn by high-
resolution liquid chromatography–Orbitrap mass spectrometry. Toxins. 2013;5:590–604.55. Heyndrickx E, Sioen I, Huybrechts B, Callebaut A, De Henauw S, De Saeger S. Human biomonitoring of multiple mycotoxins
in the Belgian population: results of the BIOMYCO study. Environ Int. 2015;84:82–9.56. Rodriguez-Carrasco Y, Font G, Molto JC, Berrada H. Quantitative determination of trichothecenes in breadsticks by gas
chromatography–triple quadrupole tandem mass spectrometry. Food Addit Contam Part A Chem Anal Control Expo Risk Assess. 2014;31:1422–30.
57. Mycotoxin sampling tool (Version 1.1). Rome: Food and Agriculture Organization of the United Nations; 2016.58. General standard for contaminants and toxins in food and feed. Rome: Food and Agriculture Organization of the United
Nations, Joint FAO/WHO Food Standards Programme, Codex Alimentarius Commission; 1995:65 (CODEX STAN 193-1995). 59. European Commission. Commission Regulation (EC) No 401/2006 of 23 February 2006 laying down the methods of
sampling and analysis for the official control of the levels of mycotoxins in foodstuffs. O J. 2006;L70:12–34.

54
Joint FAO/WHO Expert Committee on Food Additives Eighty-third report W
HO
Tec
hnic
al R
epor
t Ser
ies,
No.
100
2, 2
017
60. Jouany JP. Methods for preventing, decontaminating and minimizing the toxicity of mycotoxins in feeds. Anim Feed Sci Technol. 2007;137:342–62.
61. Risk assessment of mycotoxins in cereal grain in Norway. VKM-Norwegian Scientific Committee for Food Safety; 2013 (Document no. 10-004-4-Final: 62-81).
62. Oldenburg E, Valenta H, Sator C. [Risk assessment and avoidance strategies in feed production.] In: Dänicke S, Oldenburg E, editors. [Risk factors for Fusarium toxin formation and prevention strategies in feed production and feeding.] Landbauforschung Völkenrode, Sonderheft no. 216;2000:5–34 (in German).
63. Eeckhout M, Haesaert G, Landschoot S, Deschuyffeleer N, De Laethauwer S. Guidelines for prevention and control of mould growth and mycotoxin production in cereals. Mycohunt. Annex 1 to D8.1. Report guidelines on prevention measures; 2013.
64. Hofer K, Barmeier G, Schmidhalter U, Habler K, Rychlik M, Huckelhoven R et al. Effect of nitrogen fertilization on Fusarium head blight in spring barley. Crop Prot. 2016;88:18–27.
65. Ferrigo D, Raiola A, Causin R. Plant stress and mycotoxin accumulation in maize. Agrochimica. 2014;58:116–27.66. Cabral LC, Pinto VF, Patriarca A. Application of plant derived compounds to control fungal spoilage and mycotoxin
production in foods. Int J Food Microbiol. 2013;166:1–14.67. Ng LC, Ngadin A, Azhari M, Zahari NA. Potential of Trichoderma spp. as biological control agents against bakanae pathogen
(Fusarium fujikuroi) in rice. Asian J Plant Pathol. 2015;9(2):46–58.68. Pagnussatt FA, Ponte EMD, Garda-Buffon J, Badiale-Furlong E. Inhibition of Fusarium graminearum growth and mycotoxin
production by phenolic extract from Spirulina sp. Pestic Biochem Physiol. 2014;108:21–6.69. Góral T, Stuper-Szablewska K, Busko M, Boczkowska M, Walentyn-Góral D, Wisniewska H et al. Relationships between
genetic diversity and Fusarium toxin profiles of winter wheat cultivars. Plant Pathol J. 2015;31:226–44. 70. Kottapalli B, Wolf-Hall CE, Schwarz P. Effect of electron-beam irradiation of the safety and quality of Fusarium-infected
malting barley. Int J Food Microbiol. 2006;110:224–31. 71. Young JC, Zhu H, Zhou T. Degradation of trichothecene mycotoxins by aqueous ozone. Food Chem Toxicol. 2006;44:417–24.72. Review of mycotoxin-detoxifying agents used as feed additives: mode of action, efficacy and feed/food safety. Parma:
European Food Safety Authority; 2009.73. Schollenberger M, Muller HM, Ernst K, Sondermann S, Liebscher M, Schlecker C et al. Occurrence and distribution of 13
trichothecene toxins in naturally contaminated maize plants in Germany. Toxins. 2012;4:778–87.74. Garcia-Moraleja A, Font G, Manes J, Ferrer E. Simultaneous determination of mycotoxin in commercial coffee. Food Control.
2015;57:282–92.75. Hussein HM, Franich RA, Baxter M, Andrew IG. Naturally occurring Fusarium toxins in New Zealand maize. Food Addit
Contam. 1989;6(1):49–57.76. Lincy SV, Latha R, Chandrashekar A, Manonmani HK. Detection of toxigenic fungi and quantification of type A trichothecene
levels in some food and feed materials from India. Food Control. 2008;19:962–6.77. Khatoon S, Hanif NQ, Tahira I, Sultana N, Sultana K, Ayub N. Natural occurrence of aflatoxins, zearalenone and trichothecenes
in maize grown in Pakistan. Pak J Bot. 2012;44(1):231–6.78. Kononenko GP, Burkin AA, Gavrilova OP, Gagkaeva TY. Fungal species and multiple mycotoxin contamination of cultivated
grasses and legumes crops. Agric Food Sci. 2015;24(4):323–30.79. Reports on tasks for scientific cooperation. Report of experts participating in Task 3.2.10. Collection of occurrence data
of Fusarium toxins in food and assessment of dietary intake by the population of EU Member States. Directorate-General Health and Consumer Protection; 2003.
80. Rodríguez-Carrasco Y, Ruiz MJ, Font G, Berrada H. Exposure estimates to Fusarium mycotoxins through cereals intake. Chemosphere. 2013;93:2297–2303.
81. FAO/WHO. Principles and methods for the risk assessment of chemicals in food. A joint publication of the Food and Agriculture Organization of the United Nations and the World Health Organization. Geneva: World Health Organization; 2009 (Environmental Health Criteria 240).
55
Contaminants
3.3 FumonisinsExplanation Fumonisins are produced by Fusarium verticillioides (formerly F. moniliforme), F. proliferatum and F. fujikuroi, as well as some less common Fusarium species, for example F. anthophilum, F. dlamini, F. napiforme and F. thapsinum (1, 2). Fumonisin B2 (FB2) and fumonisin B4 (FB4) are also produced by Aspergillus niger (3). Fumonisins are common contaminants of maize and have also been found in rice.
The B series of the fumonisins are modified sphingoid bases, including fumonisin B1 (FB1) (CAS No. 116355-83-0), FB2 (CAS No. 116355-84-1), fumonisin B3 (FB3) (CAS No. 136379-59-4) and FB4 (CAS No. 136379-60-7), which are the major forms found in food and were described previously by the Committee at the seventy-fourth meeting of JECFA (Annex 1, reference 206). There are also many other fumonisin analogues that can be classified into four main groups, A, B, C and P, which contain two tricarballylic acid (TCA) moieties. Members of the series FBX are different from these, because they are esterified by other carboxylic acids, such as cis-aconitic acid, oxalylsuccinic acid and oxalylfumaric acid. There are also fumonisin analogues that have their 19- or 20-carbon aminopolyhydroxyalkyl chain esterified by fatty acids, such as palmitic acid, linoleic acid and oleic acid. At the time of the 2011 evaluation, there were at least 28 FB1 isomers that had been isolated and characterized. The hydrolysis of the tricarballylic esters at C-14 and C-15 gives rise to partially hydrolysed fumonisin B or totally hydrolysed fumonisin B in food.
Fumonisins were evaluated by JECFA for the first time at the fifty-sixth meeting (Annex 1, references 152 and 153) and then re-evaluated at the seventy-fourth meeting (Annex 1, references 205 and 206). At the seventy-fourth meeting, the Committee used a short-term dose–response study of liver toxicity in male transgenic mice fed diets containing purified FB1 (4) to derive a group PMTDI for FB1, FB2 and FB3, alone or in combination, of 2 µg/kg bw on the basis of a lower 95% confidence limit on the benchmark dose for a 10% response (BMDL10) of 0.165 mg/kg bw per day and an uncertainty factor of 100. Because the derived PMTDI at the seventy-fourth meeting of JECFA was the same as the group PMTDI established at the fifty-sixth meeting of JECFA, based on renal toxicity in a 90-day rat study, the group PMTDI for FB1, FB2 and FB3, alone or in combination, was retained at the seventy-fourth meeting.
Fumonisins were evaluated by the present Committee in response to a request from CCCF for an updated exposure assessment. The Committee also evaluated toxicological studies that had become available since the previous evaluation in 2011.

56
Joint FAO/WHO Expert Committee on Food Additives Eighty-third report W
HO
Tec
hnic
al R
epor
t Ser
ies,
No.
100
2, 2
017
A literature search was conducted to identify all available published data since 2010 using the University of Georgia Libraries Galileo databases and the University of Saskatchewan Electronic Library. The search terms included, singly or in combination, fumonisin, Fusarium verticillioides, ceramide, toxicology, reproduction, genotoxicity, acute, and chronic, among others. The literature search on the occurrence of and dietary exposure to fumonisins was run using three databases (Scopus, PubMed and Ovid) and a cut-off date of 2011.
Biochemical aspectsMost of the studies reported since 2011 provide information that confirms the findings and conclusions reported previously (5) (Annex 1, references 153 and 206). This update of the biochemical aspects of fumonisins will focus on new findings or those that extend previous findings or confirm older findings that were uncertain.
A recent feeding study in rats confirmed that only small amounts of hydrolysed FB1, relative to FB1, are formed in the gut, where the relative recoveries in faeces of FB1, partially hydrolysed FB1 and fully hydrolysed FB1 (HFB1) were 93.8%, 5.9% and 0.3%, respectively (6).
Very small amounts of FB1 are excreted in the urine. A recent study in mice showed that following intraperitoneal dosing, the half-life of urinary FB1 (UFB1) was less than 24 hours, whereas elevated levels of sphingoid bases and sphingoid base 1-phosphates in blood increased after UFB1 peaked (<4 hours), and elevated levels were detectable up to at least 120 hours after the last dose of FB1, with an estimated half-life of between 48 and 72 hours (7). Likewise, a recent study confirmed the rapid absorption and elimination of FB1 in rats, showing that after a single oral dose, UFB1 peaked rapidly (12 hours) and then decreased equally rapidly, with a half-life in the urine of between 24 and 36 hours (8).
In humans consuming known amounts of fumonisins, FB1 was detected in the urine soon after exposure began and decreased rapidly after consumption or exposure ceased (9). The total urinary excretion of FB1 in humans was less than 1% of the cumulative dose, a value similar to that reported in animal studies. The estimated half-life in humans was less than 48 hours after they consumed FB1-containing diets for 3 consecutive days. A study involving 1200 women found that FB1 was excreted in the urine much more efficiently than FB2 or FB3, based on the relative levels of FB1, FB2 and FB3 in the food consumed (10).
The free primary amino group in FB1 is required for inhibition of ceramide synthase. This finding has been confirmed and extended in a recent in vivo study using diets formulated with highly purified FB1, partially hydrolysed FB1 (one TCA side-chain removed), HFB1 (both TCA side-chains removed) and

57
Contaminants
N-(1-deoxy-D-fructos-1-yl) FB1. The results show that the fumonisin derivatives did not elevate the sphinganine/sphingosine ratio and were significantly less nephrotoxic than FB1 (6).
Recent studies show that FB1, as shown previously for HFB1, is a substrate for ceramide synthase, forming N-acyl-FB1 derivatives in vivo and in vitro. Considerably more N-acyl-hydrolysed FB1 accumulates in cells compared with N-acyl-FB1. This mimics the relative accumulation of HFB1 and FB1 (11, 12). Very little of the total FB1 in the male rat kidney (the most sensitive target organ) was metabolized to N-acyl-FB1, whereas in the liver, approximately half of the total fumonisins consisted of the N-acyl-FB1 derivatives.
The N-acyl-FB1 derivatives are more cytotoxic in vitro than FB1. The in vivo toxicity of the N-acyl-FB1 derivatives and N-acyl-hydrolysed FB1 derivatives is not known; however, hydrolysed FB1 is much less toxic than FB1, as shown in both previously reviewed (Annex 1, reference 206) and more recent feeding studies (12–15).
FB1 is a potent and specific inhibitor of ceramide synthases. There has been growing evidence for the important role of ceramides, sphingoid bases and sphingoid base-1-phosphates as cellular mediators in the development of human diseases, but there is no evidence of FB1-induced ceramide synthase inhibition in any human disease, nor is there evidence that FB1-induced ceramide synthase inhibition is in itself an adverse effect. As in the previous JECFA evaluations, there were many animal studies providing evidence that fumonisin inhibits ceramide biosynthesis and stimulates sphingoid base phosphorylation. Recent studies in mice (7) show that the elevated levels of sphinganine and sphinganine 1-phosphate in liver and kidney are paralleled by increased levels of sphinganine 1-phosphate in mouse blood spots in a dose-dependent fashion following oral exposure to FB1. The increased sphinganine 1-phosphate in blood spots, liver and kidney is positively correlated with the UFB1. The Committee noted that disruption of lipid metabolism consequent to inhibition of ceramide synthases appears to play an important and early role in fumonisin toxicity and carcinogenicity in animal models.
The development of mice lacking ceramide synthase 2 has led to a better understanding of how decreased ceramide biosynthesis and increased sphinganine are involved in the development of liver lesions, liver cancer, mitochondrial dysfunction, increased oxidative stress and biochemical/structural changes in membranes (16–20). The Committee concluded that these findings provide additional mechanistic support for involvement of disrupted sphingolipid metabolism in the FB1-induced increased oxidative damage to lipids, proteins and DNA, liver damage and liver cancer.

58
Joint FAO/WHO Expert Committee on Food Additives Eighty-third report W
HO
Tec
hnic
al R
epor
t Ser
ies,
No.
100
2, 2
017
Toxicological studiesIn the previous evaluations, the Committee concluded that FB1 was not acutely toxic. There have been no new acute toxicity studies reported since 2011.
Since 2011, three short-term rat studies have been conducted with purified FB1. None of these studies was a dose–response feeding study (6, 21, 22).
In addition, the Committee reviewed the 2012 study by Bondy et al. (23), which is the final report of the short-term study with purified FB1 in mice that was provided to the Committee in 2011 as a preliminary report of unpublished data (4). In the study, the effects of dietary FB1 exposure on the mouse liver were characterized after 26 weeks of exposure to 0, 5, 50 or 150 mg FB1/kg diet. Comparison of the incidence of and pathology scores for megalocytic (karyocytomegalic) hepatocytes and apoptosis in the preliminary and final reports showed slight differences in the incidence data due to the addition of four mice: one additional mouse in the control group (0 mg/kg bw per day), one additional mouse in the low-dose group (0.4 mg/kg bw per day) and two additional mice in the high-dose group (12 mg/kg bw per day). There was also one mouse in the mid-dose group (4 mg/kg bw per day) for which the pathology score was adjusted from zero to one. The Committee concluded that these slight differences ((4) vs (23)) would not change the overall toxicological assessment performed by the previous Committee.
Other short-term toxicity studies have been conducted using fumonisin obtained from a variety of sources and are described briefly below, but they are not further considered in the assessment owing to poor characterization of the test material or other study limitations.
One study in mice involved only one high dose level of FB1 of unspecified purity (24), and the other mouse study used repeated intraperitoneal injection of a partially purified fumonisin preparation (25). A single dose level feeding study in male rats used F. verticillioides culture material (26), and another feeding study in male rats used culture material diets at high dose levels (50, 100 or 200 mg FB1/kg diet) (27). In a third rat study, male rats were fed diets containing FB1 prepared from maize naturally contaminated with fumonisins at 0.22, 1.8, 3.6 or 4.2 mg FB1/kg diet (28). Two studies were conducted in pigs using fungal culture material or partially purified fumonisins. One of the studies was a multi-dose feeding study (0, 3, 6 or 9 mg FB1/kg diet) (29); the diets were prepared using F. verticillioides culture material. The other study in pigs involved only a single dose level of partially purified fumonisins (30).
The studies conducted on genotoxicity since 2011 support the conclusions of the 2001 and 2011 evaluations with regards to the lack of evidence for fumonisin-induced DNA damage being a consequence of direct interaction with DNA or metabolism to a DNA-reactive metabolite. The more recent studies also
59
Contaminants
suggest that the source of reactive oxygen species is disruption of mitochondrial integrity (19, 20, 31). The Committee concluded that the weight of the evidence is that fumonisins are not DNA reactive, nor are they metabolized to DNA-reactive metabolites, but increased oxidative stress may play a role in the DNA damage observed in some in vivo studies.
Since 2011, there has been one oral gavage dose–response developmental toxicity study in mice (n = 2–4 per dose group) using pure FB1 (0, 5, 10, 15, 25 and 50 mg/kg bw per day), which showed the induction of neural tube defects at all doses greater than 5 mg/kg bw per day (7).
Another study in mice found that intragastric intubation of pure FB1 at 12.5 mg/kg bw per day induced neural tube defects in the litters from four of seven treated dams (32).
In a study in rats (n = 2 or 3 per dose group) fed methyl donor–sufficient or methyl donor–deficient diets for 30 days with and without oral gavage of 0.004 mg FB1/kg bw per day and then mated and fed the same diets plus 0.004 mg FB1/kg bw per day for an additional 30 days, FB1-only treatment and FB1-plus methyl donor–deficient diet treatment were associated with a multitude of changes, including histone modifications in the fetal livers (33). In addition, several in vitro studies have shown that fumonisins can cause epigenetic effects and subsequent effects on gene expression that might alter the risk of disease (34–36).
In 2011, the Committee considered the effects on the immune system to be relevant to the risk assessment; however, all of the studies were performed using single doses. Since 2011, there have been additional in vivo studies documenting the immunotoxic effects of fumonisins, and in particular the ability to alter the response to infectious agents. Only one study was done using pure FB1, and that study used subcutaneous injection in mice (37). There were also six in vivo studies in pigs. One study used intragastric gavage of F. verticillioides culture material extracts (38), and four other studies used F. verticillioides culture material extracts to formulate diets containing FB1, which were fed to pigs at a single dose level (39–42). In the last pig study evaluated, naturally contaminated maize was used to prepare diets containing 12 mg FB1 plus FB2/kg diet in order to investigate their effects on pigs co-exposed to Salmonella enterica, with mostly negative results (43).
In previous evaluations, the most notable neurological effect of fumonisin was the induction of equine leukoencephalomalacia, a disease believed to be the result of vascular dysregulation. Since the last evaluation, there have been only a few studies investigating the potential neurotoxicity of fumonisin. In mice, a single intraperitoneal injection of 8 mg pure FB1/kg bw sensitized the mice to pentylenetetrazol-induced seizures (44). In another study, rats were fed diets containing FB1 and FB2 prepared using F. verticillioides culture material at a concentration of 0, 1 or 3 mg/kg; effects on the myenteric neurons were observed

60
Joint FAO/WHO Expert Committee on Food Additives Eighty-third report W
HO
Tec
hnic
al R
epor
t Ser
ies,
No.
100
2, 2
017
(45). A study conducted in pigs reported effects on protein content in brain regions (46).
In 2011, there were a large number of in vitro and in vivo studies investigating the combined effects of fumonisins and other mycotoxins. In the present evaluation, the new co-exposure studies for fumonisins and aflatoxins are covered separately (see section 3.7). The studies describing the combined effects of in vivo and in vitro co-exposure of fumonisins with mycotoxins other than aflatoxins were also evaluated; as in 2011 (Annex 1, reference 206), the current evaluation included numerous in vivo and in vitro studies showing a wide range of responses suggesting antagonistic, additive and more than additive (synergistic) responses. Many of the studies involved only a single dose level of individual mycotoxins, and therefore accurate quantitative assessment of interactions was not possible.
In 2011, the Committee noted that the nephrotoxicity of culture material was much greater than the nephrotoxicity of pure FB1. No studies have been conducted since 2011 that specifically addressed this concern.
Since 2011, two in vivo feeding studies, one using naturally contaminated maize (28) and the other using F. verticillioides culture material (29), produced toxicological results in rats and pigs, respectively, consistent with the view that pure FB1, naturally contaminated maize containing FB1 and F. verticillioides culture material containing FB1 are not toxicologically equivalent.
The Committee also noted that the reason for the differences in the toxicity of pure FB1, culture material containing fumonisins and naturally contaminated maize is likely related to differences in the chemical composition of the various test agents. For example, before the availability of pure FB1, many animal feeding experiments were conducted by incorporating culture material of F. verticillioides grown mainly on autoclaved maize kernels. Many studies were reported with cultures inoculated with F. moniliforme (now F. verticillioides) MRC 826. Although most studies report analytical data for FB1 only, it is now known that the processing required to prepare culture material alters not just the growth of F. verticillioides, but also the ratios of various secondary metabolites, including mycelial proteins and fungal metabolites. Although these metabolites would be present in naturally contaminated grains, they would not be present in the same relative amounts. Thus, in the Committee’s opinion, although the use of F. verticillioides maize culture material has been viewed as representative of naturally contaminated maize, they are not the same, and therefore it should not be surprising that the toxicological profiles of pure fumonisins, culture material containing fumonisins and naturally contaminated maize containing fumonisins are different.

61
Contaminants
Observations in domestic animals/veterinary toxicologySince 2011, there have been few available published reports on field disease outbreaks in farm and domestic animals involving fumonisin. Nonetheless, farm animals are frequently used in studies of fumonisin toxicity because of the fact that mycotoxin-contaminated feed is often suspected of being involved in field performance problems and the susceptibility of poultry and other farm animals to infectious agents. The Committee noted that development of reporting systems designed to identify suspected mycotoxin involvement in farm/domestic animal disease outbreaks could be informative for identifying areas where the risk for mycotoxins as a contributing factor in human diseases may also be increased.
Observations in humansSince the last JECFA evaluation, biomarkers of fumonisin exposure have been used increasingly to estimate human exposure worldwide. UFB1 is the most commonly used biomarker of exposure and has been validated in multiple human studies. UFB1 has also been used as a biomarker to evaluate the effectiveness of dietary interventions designed to help decrease fumonisin exposure in humans. UFB1 is reflective of recent fumonisin exposure, but in areas where maize is a dietary staple and exposure is likely to occur at every meal and year-round, UFB1 levels may be indicative of an individual’s chronic exposure.
FB1 was found in the urine of exclusively breastfed infants, suggesting that human breast milk could be an important source of exposure in young children (47). Although previous animal-based data demonstrated an insignificant feed-to-milk transfer, one study in humans has reported the detection of high levels of FB1 in breast milk from Tanzanian women (48). The Committee considered the method used in the Magoha et al. (48) study to quantify the FB1 in breast milk to be inadequate for this matrix.
In an effort to develop mechanism-based biomarkers of fumonisin, a method to quantify phosphorylated sphingoid bases in human blood spots was developed based on the fact that red blood cells are the main storage reservoir for sphinganine 1-phosphate and sphingosine 1-phosphate (7). A human study in Guatemala (49) showed that there was a positive and statistically significant correlation between UFB1 (biomarker of exposure) and the blood spot levels of sphinganine 1-phosphate and the sphinganine 1-phosphate/sphingosine 1-phosphate ratio (biomarkers of effect) in humans consuming diets containing high levels of fumonisins. For both the sphinganine 1-phosphate/sphingosine 1-phosphate ratio and the sphinganine 1-phosphate concentration, the first statistically significant increases occurred in the UFB1 concentration range of >0.5 to <1.0 ng FB1/mL. A UFB1 concentration of 0.5 ng/mL was estimated to be equivalent to an exposure of 1.67 µg FB1/kg bw per day. The Committee concluded

62
Joint FAO/WHO Expert Committee on Food Additives Eighty-third report W
HO
Tec
hnic
al R
epor
t Ser
ies,
No.
100
2, 2
017
that these data support the hypothesis that daily exposure to high levels of FB1 is likely to result in inhibition of ceramide synthase in humans, similar to what has been described in many animal studies.
A limited number of epidemiological studies have been published since the last JECFA evaluation on the associations between fumonisin exposure and health outcomes in humans. In an ecological study conducted in the Islamic Republic of Iran, FB1 contamination in rice, but not in maize, was associated with an increased risk of oesophageal cancer (50). However, the Committee decided that no causal relationship could be derived because of the lack of control for other risk factors of oesophageal cancer. One nested case–control study investigated the contribution of fumonisin exposure to the risk of hepatocellular cancer in two cohorts in China, yet a significant association was not found (51).
Two prospective epidemiological studies were conducted in the United Republic of Tanzania investigating the association of mycotoxin exposure and childhood growth. In one study, a significant negative association was found between UFB1 and the length-for-age z-score and length velocity among young children followed up until 6–14 months of age (52). In the other study, exposure to fumonisin from maize-based foods, either alone or together with aflatoxin, was not significantly associated with stunting or underweight among infants followed up until 5 months of age (53). However, the result of this study was compromised by low statistical power and the limitation of exposure characterization.
Levels and patterns of contamination in food Data since the last assessment of fumonisins during the seventy-fourth meeting of the Committee in 2011 (Annex 1, reference 206) were included with information collated from two sources. First, the GEMS/Food contaminants database was screened for fumonisin data (FB1, FB2, FB3 and total fumonisins) submitted from January 2011 until August 2016; second, a literature search was conducted on fumonisin occurrence data published during the same time period. The data set from the GEMS/Food contaminants database contained 56 707 records and included samples collected from 2000 to 2016. The majority of records were for FB1 and FB2 (25 148 and 19 990, respectively), with a smaller data set for FB3 and total fumonisins (8164 and 3405, respectively). Data for total fumonisins were calculated based on the sum of FB1, FB2 and FB3 (7580 samples). The distribution of total fumonisins (FB1, FB2 and FB3) across the food categories was similar to that of FB1. The overall ratio between the three fumonisins was 68:20:12.
The majority of samples were cereals and cereal products (approximately 80%), and the highest occurrence and highest concentrations were detected in samples of cereals and cereal-based products and the other food categories that may contain cereals. Of the cereals and cereal-based products, maize and maize-

63
Contaminants
based products had the highest occurrence and mean concentrations of FB1. For maize samples, the occurrence above the LOQ was close to 50%, with an LB mean of 310 μg/kg, an UB mean of 392 μg/kg and a maximum of 23 800 μg/kg. The data originated predominantly from Europe, followed by Canada and Japan. Higher mean concentrations of FB1 were reported for maize and maize products in the literature from Africa, South America and other countries in the Western Pacific Region (54–57).
Sorghum had intermediate levels of FB1 occurrence (12% above LOQ) and concentration (LB mean 31 µg/kg), whereas all other cereal grains had a much lower occurrence (<5%) and LB means below 3 μg/kg. However, wheat, barley and oats all had maximum concentrations between 500 and 1000 μg/kg, indicating that higher concentrations can occasionally occur in these cereals.
The non-cereal-based category samples contained predominantly undetectable or low concentrations of FB1; this corresponded to results within the published literature. FB1 was undetectable (LOQ 30–67 μg/kg) in milk and dairy products and rarely detected in meat and meat products (occurrence 2.6% [LOQ 5–33 μg/kg] and LB mean 3.1 μg/kg), indicating that transfer into animal products is negligible. This is in agreement with the previous assessment of the Committee at its seventy-fourth meeting in 2011 (Annex 1, reference 206). Consequently, an evaluation of the occurrence of fumonisins in feed was not conducted at the current meeting.
Overall, the estimated global means from the GEMS/Food contaminants database reported here are lower than those in the Committee’s previous assessment in 2011 (Annex 1, reference 206). For example, the global FB1 LB mean reported in this evaluation for maize is 310 µg/kg, compared with 1237 µg/kg in 2011. It is not possible to directly compare the data sets, as there is evidence that differences observed are largely due to a major shift in the geographical distribution of reported samples.
Fumonisins exist in various forms within food, such as hydrolysed and matrix-bound forms. The partially and fully hydrolysed forms of fumonisins are usually present as a low proportion of the parent fumonisins. Fumonisins can also be non-covalently bound with proteins and complex carbohydrates. Previous studies have shown that the level of bound fumonisins is usually higher than the level of the free forms, with one study reporting that the ratio of bound to free fumonisins for maize products varied from 0.06 to 25, with a mean ratio of 3 (58). There are limited data on the occurrence of bound fumonisins in different cereals, the impact of processing on these bound mycotoxins and their bioavailability after consumption.

64
Joint FAO/WHO Expert Committee on Food Additives Eighty-third report W
HO
Tec
hnic
al R
epor
t Ser
ies,
No.
100
2, 2
017
Food consumption and dietary exposure estimatesThe Committee evaluated the chronic dietary exposure to FB1 and total fumonisins (FB1 + FB2 + FB3). For this, it reviewed a number of national evaluations of dietary exposure to fumonisins that have been published since its last evaluation of fumonisins at its seventy-fourth meeting in 2011. Additionally, the Committee also estimated the dietary exposure to fumonisins based on occurrence data submitted to the GEMS/Food contaminants database combined with food consumption data from either the GEMS/Food cluster diets (international estimates) or the FAO/WHO CIFOCOss database (national estimates).
The Committee considered national evaluations performed by Brazil, China (including Hong Kong Special Administrative Region), France, Guatemala, Japan, Malawi, the Netherlands, Portugal, Republic of Korea, Spain, United Republic of Tanzania, Viet Nam and Zimbabwe. In these studies, the mean exposure to FB1 and total fumonisins in European countries was generally below 250 ng/kg bw per day. High exposures to FB1 were reported for Zimbabwe (59) and China (60), with a maximum of 7700 ng/kg bw per day for adults living in the rural province of Huaian. For total fumonisins, the highest mean exposures were reported in Malawi, ranging from 3000 to 15 000 ng/kg bw per day (61). No mean concentrations of total fumonisins were reported in the Malawi study. Based on the per capita consumption of 368 g of maize and an adult body weight of 60 kg used in the study to calculate the exposure, the Committee calculated a mean concentration of 2400 µg/kg to obtain the highest reported exposure level of 15 000 ng/kg bw per day. This concentration is a factor of 6 higher than the highest UB mean concentration reported in the occurrence data for maize from the GEMS/Food contaminants database. The authors observed that if maize was considered to be consumed after dehulling, the dietary exposure would drop by a factor of 3 or even greater (61). Owing to the large differences in foods included in the published assessments, ranging from only one food (e.g. only maize or coffee) to the whole diet, and differences in methodologies used to assess the exposure (e.g. per capita consumption or individual food consumption data), it is not possible to compare the exposures between the studies.
The Committee subsequently estimated national exposures to FB1 and total fumonisins from all food sources using national food consumption data available from the CIFOCOss database combined with FB1 and total fumonisins data submitted to the GEMS/Food contaminants database from January 2011 until August 2016. WHO region-specific LB and UB mean concentrations were calculated per food (group). To map the concentration data to the foods recorded in the CIFOCOss database, the countries present in the CIFOCOss database were grouped according to WHO region. Exposures were corrected for individual body

65
Contaminants
weights. To assess potential high exposure, the mean exposures were multiplied by a factor of 2. This factor approximates the 90th percentile of exposure (62).
The highest national exposures to FB1 and total fumonisins were observed in the youngest age groups. In the LB scenario, the highest mean exposure to FB1 and total fumonisins was observed in the group “other children” (3–9 years) from Greece, at 800 and 1200 ng/kg bw per day, respectively. The UB mean exposure estimate for FB1 was highest in toddlers (1–2 years) from Italy, at 2000 ng/kg bw per day, whereas the UB mean exposure estimate for total fumonisins was highest in toddlers from Germany, at 3200 ng/kg bw per day (Table 5). For the high national exposure estimates for children and adults, see Table 5. Major contributors to the LB mean exposures to both FB1 and total fumonisins were the food groups “cakes, cookies and pies”, “cereal-based composite foods” and “cereal grains (non-specified)”. Focusing only on infants and toddlers, the food group “foods for infants and small children” was also a relevant contributor to the LB mean exposure.
Table 5Summary of the mean and high (90th percentile) national and international estimates of chronic dietary exposure to FB1 and total fumonisins (FB1 + FB2 + FB3) calculated by the Committee
Type of estimation and populationa
Exposure (ng/kg bw per day)
FB1 Total fumonisins
Mean High Mean High
LBb UBb LB UB LB UB LB UB
National estimates Children 0–800 180–2 000 0–1 600 360–3 900 0–1 200 270–3 200 0–2 300 530–6 400 Adults 17–470 140–910 34–950 280–1 800 22–640 210–1 300 45–1 300 420–2 500International estimates Adults 2–560 300–1 200 5–1 100 610–2 300 13–820 440–2 100 25–1 600 880–4 300
a For the purpose of the summary table, “children” were taken to be any population group described as infants, toddlers, children or adolescents. “Adults” were taken to be any population group described as adults, elderly or very elderly. All estimates were rounded.
b The LB estimates were derived by substituting zero for analytical results below the LOD/LOQ when calculating mean concentration values. The UB estimate was derived by substituting the value of the LOQ for analytical results below the LOD/LOQ.
The Committee also calculated international exposure estimates for FB1 and total fumonisins from all dietary sources using the same occurrence data mapped to food consumption data of the 17 GEMS/Food cluster diets. For this, LB and UB mean fumonisin concentrations per food (group) were calculated per cluster and across all clusters. The international LB mean exposure estimates for FB1 and total fumonisins ranged from 2 ng/kg bw per day (cluster G09; mainly

66
Joint FAO/WHO Expert Committee on Food Additives Eighty-third report W
HO
Tec
hnic
al R
epor
t Ser
ies,
No.
100
2, 2
017
East Asian countries) to 560 ng/kg bw per day (cluster G05: mainly South and Central America) and from 13 ng/kg bw per day (cluster G09) to 820 ng/kg bw per day (cluster G05), respectively (Table 5). The highest UB mean exposure estimates for FB1 and total fumonisins were observed in cluster G15 (European countries): 1200 and 2100 ng/kg bw per day, respectively. The high exposures, estimated by multiplying the mean exposures by a factor of 2, are listed in Table 5. In the LB scenario, maize contributed more than 60% to the international exposure to FB1 and total fumonisins in all clusters except two, owing to a low concentration in maize (cluster G09) or a low consumption of maize (cluster G11; Belgium and the Netherlands). In this last cluster, wheat contributed 95% of the fumonisin exposure. In the UB scenario, wheat was also an important source of exposure in additional clusters.
The national and international exposures estimated by the Committee according to the UB scenario should be interpreted with care. Of the data considered in the exposure assessment for FB1, 74% (n = 18 157) of the samples were reported to contain FB1 below the LOD or LOQ. Because of this, the UB exposure estimates may be considered as worst-case estimates based on the data available to the Committee for the exposure assessment. Also, the high LOQs reported in the database contributed to this overestimation. For France and the Netherlands, recent national exposure estimates were available from the public literature covering a wide range of dietary sources (63, 64), which used (partly) the same underlying consumption data from the CIFOCOss database. These national estimates were considerably lower than those estimated by the Committee in the LB scenario. The reported LB mean FB1 exposure in children from France was 15.5 ng/kg bw per day, compared with 130–240 ng/kg bw per day estimated by the Committee. For the Netherlands, the corresponding estimates in children were 0 and 150–180 ng/kg bw per day, respectively. For total fumonisins, the estimated LB mean exposure in Dutch children was 0 ng/kg bw per day in the national study, compared with 220–250 ng/kg bw per day as calculated by the Committee. In the French study, no exposure estimates for total fumonisins were reported (63). These differences in exposure were due to higher levels of fumonisins in the GEMS/Food contaminants database compared with those used in the national studies. Furthermore, foods as recorded in the food consumption databases were analysed for fumonisins in these studies. This allowed for a more precise mapping of foods consumed to those analysed than was possible with the data available to the Committee. These foods were also, if relevant, prepared as consumed before analysis. The effect of processing on the levels of fumonisins in food was reviewed during the seventy-fourth meeting of the Committee (Annex 1, reference 206). The Committee concluded that thermal heating may result in a reduction of fumonisin levels in heated food. However, the Committee also observed that the results from the different studies were variable

67
Contaminants
and that further studies were required to determine the fate of fumonisins and their reactions in heated food. In contrast, the data in the two national studies were collected during a limited period of time: June 2007 to January 2009 in the French study (65) and the autumn/winter period of 2013 in the Dutch study (66). Mycotoxin levels have a high seasonal and annual variation, as they are highly dependent on climatic conditions. It is therefore uncertain how well the national estimates represent the exposure to fumonisins over a longer period of time. In the assessment of the Committee, a more extended period of data sampling was covered, including the years 2000–2014 for the WHO European Region.
At the seventy-fourth meeting of the Committee in 2011, the exposure to FB1 and total fumonisins was also estimated using the GEMS/Food cluster diets combined with concentration data from the GEMS/Food contaminants database (Annex 1, reference 206). The LB mean estimated exposures to FB1 ranged from 100 to 6100 ng/kg bw per day. Corresponding estimates for total fumonisins were 200–8200 ng/kg bw per day. The current exposure estimations tended to be lower: 2–560 ng/kg bw per day for FB1 and 13–820 ng/kg bw per day for total fumonisins (Table 5), despite the fact that processed foods were also included in the current assessment. In both assessments, maize contributed the most to the exposure. Comparing the mean FB1 levels in this food showed that the levels used in the present assessment were lower than those used in 2011: 270 µg/kg (average of maize, maize flour and maize meal) compared with 1237 µg/kg. For total fumonisins, the levels were 360 and 1651 µg/kg, respectively. In the present assessment, the maize samples used from the GEMS/Food contaminants database were from Canada, Brazil, Japan, China (including Hong Kong Special Administrative Region), Republic of Korea, Singapore, USA and 19 countries belonging to the WHO European Region. No maize data were available from countries belonging to the African, Eastern Mediterranean or South-East Asia regions. In 2011, very high levels of FB1 and total fumonisins were reported for the regional clusters A and G: LB mean FB1 levels were 4322 and 2971 µg/kg, and LB mean total fumonisin levels were 5921 and 4071 µg/kg, respectively. Countries belonging to these regional clusters belonged to the African (cluster A) and the South-East Asia (cluster G) WHO regions. It can therefore not be ruled out that owing to the absence of information on FB1 and total fumonisin levels in maize from countries belonging to these two regions, some national exposures may have been underestimated, as well as the current international estimates for the clusters that represent these regions, such as G01, G03, G04 and G13. In 2014, as a result of the fumonisin exposure assessment of the Committee at its seventy-fourth meeting, MLs of fumonisins (FB1 + FB2) in maize and maize flour/meal were set by the Codex Alimentarius Commission at 4000 and 2000 µg/kg, respectively. It is not possible with the current data set to determine whether these MLs have already resulted in a decrease in fumonisin levels and thus

68
Joint FAO/WHO Expert Committee on Food Additives Eighty-third report W
HO
Tec
hnic
al R
epor
t Ser
ies,
No.
100
2, 2
017
contributed to the lower exposure estimates. At the 2011 meeting, no exposure to FB1 and total fumonisins was estimated based on national food consumption data as available in the CIFOCOss database.
The Committee concluded, based on the calculated national and international exposure estimates (Table 5), that the LB mean and high (90th percentile) chronic FB1 exposures in adults were maximally 0.56 and 1.1 µg/kg bw per day, respectively. For total fumonisins, the corresponding exposure estimates were 0.82 and 1.6 µg/kg bw per day (Table 5). Given the uncertainty regarding the large percentage (around 70%) of samples with a fumonisin level below the LOD or LOQ (so-called “non-detect” samples), the UB mean and high exposures were estimated to be as high as 1.2 and 2.3 µg/kg bw per day for FB1 and 2.1 and 4.3 µg/kg bw per day for total fumonisins, respectively. In children, the LB mean and high chronic FB1 exposures were maximally 0.8 and 1.6 µg/kg bw per day, and for total fumonisins, maximally 1.2 and 2.3 µg/kg bw per day, respectively. In this population group, the UB mean and high exposures were estimated to be as high as 2.0 and 3.9 µg/kg bw per day for FB1 and 3.2 and 6.4 µg/kg bw per day for total fumonisins, respectively. Because of the absence of information on fumonisin levels in maize of countries belonging to the African, Eastern Mediterranean and South-East Asia regions in the current assessment, the national and international exposures related to these regions may have been underestimated. Maize is the predominant source of LB exposure to FB1 and total fumonisins in most cluster diets. In the UB scenario, wheat was also an important contributor to the exposure to fumonisins in some clusters.
Dose–response analysisThe Committee reviewed the previous dose–response analysis in light of the updated Bondy et al. (23) study and confirmed the previous analysis.
EvaluationThe Committee reaffirmed the conclusions of the seventy-fourth meeting that fumonisins are associated with a wide range of toxic effects, and the liver and kidney are the most sensitive target organs. The Committee reviewed the studies that have become available since the 2011 evaluation and concluded that the 2010 study by Bondy et al. (4), subsequently updated in 2012 (23), remained the most relevant for the evaluation. The Committee evaluated the updated Bondy et al. (23) data and concluded that they would not change the overall toxicological assessment performed previously by the Committee. Thus, the established group PMTDI of 2 µg/kg bw for FB1, FB2 and FB3, alone or in combination, was retained by the current Committee.

69
Contaminants
The Committee noted the paucity of new data on the occurrence of fumonisins in food submitted to the GEMS/Food contaminants database since 2011 by all WHO regions except for Europe, as opposed to the data used in the previous evaluation (2011). Owing to these differences in the data sets between 2011 and the current evaluation, a direct comparison was not possible.
The Committee noted that there are limited data on the occurrence of bound fumonisins in different cereals, the impact of processing on these bound mycotoxins and their bioavailability after consumption.
LB mean and high (90th percentile) chronic FB1 exposures in adults were maximally 0.56 and 1.1 µg/kg bw per day, respectively. For total fumonisins, the corresponding exposure estimates were 0.82 and 1.6 µg/kg bw per day. The UB mean and high exposures were estimated to be as high as 1.2 and 2.3 µg/kg bw per day for FB1, respectively, and as high as 2.1 and 4.3 µg/kg bw per day for total fumonisins, respectively. In children, the LB mean and high chronic FB1 exposures were maximally 0.8 and 1.6 µg/kg bw per day, respectively, and for total fumonisins, maximally 1.2 and 2.3 µg/kg bw per day, respectively. In this population group, the UB mean and high exposures were estimated to be as high as 2.0 and 3.9 µg/kg bw per day for FB1, respectively, and as high as 3.2 and 6.4 µg/kg bw per day for total fumonisins, respectively. Maize is the predominant source of LB exposure to FB1 and total fumonisins in most cluster diets. In the UB scenario, wheat was also an important contributor to the exposure to fumonisins in some clusters.
Comparison of the estimates of exposure to FB1 and total fumonisins with the group PMTDI indicates that the group PMTDI was not exceeded at the LB mean exposure level in both children and adults. Assuming that all non-detect samples contained fumonisin at the LOQ, the UB mean exposure to total fumonisins in children exceeded the PMTDI in several countries. This was also true for the high (90th percentile) exposure, independent of the fumonisin concentration assigned to the non-detect samples. For adults, only the UB high exposure exceeded the PMTDI. The Committee noted that, owing to the high percentage of non-detect samples in the concentration database (around 70%) and the wide range of LOQs reported in the GEMS/Food contaminants database for fumonisins, the UB estimates may be interpreted as a worst-case estimate of exposure based on the data available.
The Committee noted that the international exposure estimates for FB1 and total fumonisins were lower than those estimated by the Committee at its seventy-fourth meeting in 2011. In the current assessment, a larger part of the occurrence data was from countries belonging to the WHO European Region compared with 2011, resulting in lower overall fumonisin levels in maize. In the current assessment, no information on fumonisin levels in maize was available from countries belonging to the African, Eastern Mediterranean or South-East

70
Joint FAO/WHO Expert Committee on Food Additives Eighty-third report W
HO
Tec
hnic
al R
epor
t Ser
ies,
No.
100
2, 2
017
Asia regions, where higher fumonisin concentrations are typically detected. Given these limitations of the occurrence data used in the exposure assessment and high exposures reported in the literature in some countries, it is likely that the exposures to fumonisins in areas where maize is a staple food and high contamination with fumonisins can occur are higher than those estimated by the Committee at this meeting, as can be seen in the previous evaluation, which was based on a larger and more representative data set. Co-exposure of fumonisins with aflatoxins is covered separately (see section 3.7).
RecommendationsThe Committee noted the need for data on FB1 in breast milk using analytical methods with appropriate specificity and sensitivity in order to further evaluate this potential exposure route. The Committee recommended that exposure to fumonisins be reduced, particularly in areas where maize is the major dietary staple food and where high contamination can occur. The Committee advises the development of surveillance programmes for regions for which little current information on occurrence of fumonisins in the GEMS/Food contaminants database exists, carefully considering the impact of these programmes on food security. The Committee recommended that these countries be encouraged to submit fumonisin concentration data to the GEMS/Food contaminants database. The Committee recommended that countries be encouraged to analyse fumonisins in food samples using analytical methods with appropriate sensitivity to reduce the uncertainty in the exposure assessment, especially for maize and wheat. The Committee recommends that additional studies be conducted to better understand the occurrence of bound fumonisins in different cereals, the impact of processing on these bound mycotoxins and their bioavailability after consumption.
A monograph addendum was prepared.
References1. Rheeder JP, Marasas WF, Vismer HF. Production of fumonisin analogs by Fusarium species. Appl Environ Microbiol.
2002;68:2101–5.2. Suga H, Kitajima M, Nagumo R, Tsukiboshi T, Uegaki R, Nakajima T et al. A single nucleotide polymorphism in the translation
elongation factor 1α gene correlates with the ability to produce fumonisin in Japanese Fusarium fujikuroi. Fungal Biol. 2014;118:402–12.

71
Contaminants
3. Mogensen JM, Larsen TO, Nielsen KF. Widespread occurrence of the mycotoxin fumonisin B2 in wine. J Agric Food Chem. 2010;58:4853–7.
4. Bondy GS, Mehta R, Caldwell D, Coady L, Armstrong C, Savard M et al. Effects of long term exposure to fumonisin B1 on p53+/− transgenic mice. Ottawa: Health Canada, Health Products and Food Branch, Food Directorate, Bureau of Chemical Safety, Toxicology Research Division; 2010 (unpublished).
5. Fumonisin B1. Geneva: World Health Organization, International Programme on Chemical Safety; 2000 (Environmental Health Criteria 219).
6. Hahn I, Nagl V, Schwartz-Zimmermann HE, Varga E, Schwarz C, Slavik V et al. Effects of orally administered fumonisin B1 (FB1), partially hydrolysed FB1, hydrolysed FB1 and N-(1-deoxy-D-fructos-1-yl) FB1 on the sphingolipid metabolism in rats. Food Chem Toxicol. 2015;76:11–8.
7. Riley RT, Showker JL, Lee CM, Zipperer CE, Mitchell TR, Voss KA et al. A blood spot method for detecting fumonisin-induced changes in putative sphingolipid biomarkers in LM/Bc mice and humans. Food Addit Contam Part A Chem Anal Control Expo Risk Assess. 2015;32:934–49.
8. Mitchell NJ, Xue KS, Lin S, Marroquin-Cardona A, Brown KA, Elmore SE et al. Calcium montmorillonite clay reduces AFB1 and FB1 biomarkers in rats exposed to single and co-exposures of aflatoxin and fumonisin. J Appl Toxicol. 2014;34:795–804.
9. Riley RT, Torres O, Showker JL, Zitomer NC, Matute J, Voss KA et al. The kinetics of urinary fumonisin B1 excretion in humans consuming maize-based diets. Mol Nutr Food Res. 2012;56:1445–55.
10. Torres O, Matute J, Gelineau-van Waes J, Maddox JR, Gregory SG, Ashley-Koch AE et al. Urinary fumonisin B1 and estimated fumonisin intake in women from high- and low-exposure communities in Guatemala. Mol Nutr Food Res. 2014;58:973–83.
11. Harrer H, Laviad EL, Humpf HU, Futerman AH. Identification of N-acyl-fumonisin B1 as new cytotoxic metabolites of fumonisin mycotoxins. Mol Nutr Food Res. 2013;57:516–22.
12. Harrer H, Humpf HU, Voss KA. In vivo formation of N-acyl-fumonisin B1. Mycotoxin Res. 2015;31:33–40.13. Grenier B, Bracarense A-PF, Schwartz HE, Trumel C, Cossalter A-M, Schatzmayr G et al. The low intestinal and hepatic toxicity
of hydrolyzed fumonisin B1 correlates with its inability to alter the metabolism of sphingolipids. Biochem Pharmacol. 2012;83:1465–73.
14. Voss KA, Riley RT. Fumonisin toxicity and mechanism of action: overview and 34 current perspectives. Food Saf. 2013;1(1):20130006.
15. Masching S, Naehrer K, Schwartz-Zimmermann HE, Sarandan M, Schaumberger S, Dohnal I et al. Gastrointestinal degradation of fumonisin B1 by carboxylesterase FumD prevents fumonisin induced alteration of sphingolipid metabolism in turkey and swine. Toxins. 2016;8(3):84.
16. Pewzner-Jung Y, Park H, Laviad EL, Silva LC, Lahiri S, Stiban J et al. A critical role for ceramide synthase 2 in liver homeostasis: I. Alterations in lipid metabolic pathways. J Biol Chem. 2010;285:10902–10.
17. Pewzner-Jung Y, Brenner O, Braun S, Laviad EL, Ben-Dor S, Feldmesser E et al. A critical role for ceramide synthase 2 in liver homeostasis: II. Insights into molecular changes leading to hepatopathy. J Biol Chem. 2010;285:10911–23.
18. Silva LC, Ben David O, Pewzner-Jung Y, Laviad EL, Stiban J, Bandyopadhyay S et al. Ablation of ceramide synthase 2 strongly affects biophysical properties of membranes. J Lipid Res. 2012;53:430–6.
19. Novgorodov SA, Riley CL, Yu J, Borg KT, Hannun YA, Proia RL et al. Essential roles of neutral ceramidase and sphingosine in mitochondrial dysfunction due to traumatic brain injury. J Biol Chem. 2014;289:13142–154.
20. Zigdon H, Kogot-Levin A, Park JW, Goldschmidt R, Kelly S, Merrill AH Jr et al. Ablation of ceramide synthase 2 causes chronic oxidative stress due to disruption of the mitochondrial respiratory chain. J Biol Chem. 2013;288:4947–56.
21. Denli M, Blandon JC, Salado S, Guynot ME, Casas J, Perez JF. Efficacy of 12 AdiDetox™ in reducing the toxicity of fumonisin B1 in rats. Food Chem Toxicol. 2015;78:60–3.
22. Riedel S, Abel ST, Swanevelder S, Gelderblom WCA. Induction of an altered lipid 45 phenotype by two cancer promoting treatments in rat liver. Food Chem Toxicol. 2015;78:96–104.
23. Bondy GS, Mehta R, Caldwell D, Coady L, Armstrong C, Savard M et al. Effects of long term exposure to the mycotoxin fumonisin B1 in p53 heterozygous and p53 homozygous transgenic mice. Food Chem Toxicol. 2012;50:3604–13.
24. Alizadeh AM, Mohammadghasemi F, Zendehdel K, Kamyabi-Moghaddam Z, Tavassoli A, Amini-Najafi F et al. Apoptotic and proliferative activity of mouse gastric mucosa following oral administration of fumonisin B1. Iran J Basic Med Sci. 2015;18:8–13.

72
Joint FAO/WHO Expert Committee on Food Additives Eighty-third report W
HO
Tec
hnic
al R
epor
t Ser
ies,
No.
100
2, 2
017
25. Sozmen M, Devrim AK, Tunca R, Bayezit M, Dag S, Essiz D. Protective effects of silymarin on fumonisin B1–induced hepatotoxicity in mice. J Vet Sci. 2014;15:51–60.
26. Venancio JC, Emerich SS, Delatorre Branquinho NT, de Sousa FC, Marcal Natali MR, Baroni EA. Effect of administering a diet contaminated with fumonisins on the kidneys of Wistar rats. Acta Sci Biol Sci. 2014;36:333–41.
27. Khalil AA, Abou-Gabal AE, Abdellatef AA, Khalid AE. Protective role of probiotic lactic acid bacteria against dietary fumonisin B1–induced toxicity and DNA-fragmentation in Sprague-Dawley rats. Prep Biochem Biotechnol. 2015;45:530–50.
28. Voss KA, Riley RT, Moore ND, Burns TD. Alkaline cooking (nixtamalisation) reduced the in vivo toxicity of fumonisin-contaminated corn in a rat feeding bioassay. Food Addit Contam Part A Chem Anal Control Expo Risk Assess. 2013;30:1415–21.
29. Souto PCMC, Ramalho LNZ, Ramalho FS, Gregorio MC, Bordin K, Cossalter AM et al. [Weight gain, feed consumption and histology of organs from piglets fed rations containing low levels of fumonisin B1.] Pesq Vet Bras. 2015;35:451–5 (in Portuguese).
30. Lalles JP, Lessard M, Oswald IP, David JC. Consumption of fumonisin B1 for 9 days induces stress proteins along the gastrointestinal tract of pigs. Toxicon. 2010;55:244–9.
31. Domijan A-M, Abramov AY. Fumonisin B1 inhibits mitochondrial respiration and deregulates calcium homeostasis – Implication to mechanism of cell toxicity. Int J Biochem Cell Biol. 2011;43:897–904.
32. Liao YJ, Yang JR, Chen SE, Wu SJ, Huang SY, Lin JJ et al. Inhibition of fumonisin B1 cytotoxicity by nanosilicate platelets during mouse embryo development. PLoS One. 2014;9:e112290.
33. Pellanda H, Forges T, Bressenot A, Chango A, Bronowicki JP, Gueant JL et al. Fumonisin FB1 treatment acts synergistically with methyl donor deficiency during rat pregnancy to produce alterations of H3- and H4-histone methylation patterns in fetuses. Mol Nutr Food Res. 2012;56:976–85.
34. Chuturgoon AA, Phulukdaree A, Moodley D. Fumonisin B1 modulates expression of human cytochrome P450 1b1 in human hepatoma (Hepg2) cells by repressing Mir-27b. Toxicol Lett. 2014;227:50–5.
35. Sancak D, Ozden S. Global histone modifications in fumonisin B1 exposure in rat kidney epithelial cells. Toxicol In Vitro. 2015;29(7):1809–15.
36. Gardner NM, Riley RT, Showker JL, Voss KA, Sachs AJ, Maddox JR et al. Elevated sphingoid base-1-phosphates and decreased histone deacetylase activity 2 after fumonisin B1 treatment in mouse embryonic fibroblasts. Toxicol Appl Pharmacol. 2016;298:58–65.
37. Tafesse FG, Rashidfarrokhi A, Schmidt FI, Freinkman E, Dougan S, Dougan M et al. Disruption of sphingolipid biosynthesis blocks phagocytosis of Candida albicans. PLoS Pathog. 2015;11(10):e1005188.
38. Malik A, Toth I, Nagy B. Colonization of conventional weaned pigs by enteropathogenic Escherichia coli (Epec) and its hazard potential for human health. Acta Vet Hung. 2012;60:297–307.
39. Pósa R, Donko T, Bogner P, Kovacs M, Repa I, Magyar T. Interaction of Bordetella bronchiseptica, Pasteurella multocida, and fumonisin B1 in the porcine respiratory tract as studied by computed tomography. Can J Vet Res. 2011;75:176–82.
40. Pósa R, Kovács M, Donkó T, Szabó-Fodor J, Mondok J, Bogner P et al. Effect of Mycoplasma hyopneumoniae and fumonisin B1 toxin on the lung in pigs. Ital J Anim Sci. 2009;8(Suppl 3):172–4.
41. Pósa R, Magyar T, Stoev SD, Glávits R, Donkó T, Repa I et al. Use of computed tomography and histopathologic review for lung lesions produced by the interaction between Mycoplasma hyopneumoniae and fumonisin mycotoxins in pigs. Vet Pathol. 2013;50:971–9.
42. Pósa R, Stoev SD, Kovács M, Donkó T, Repa I, Magyar T. A comparative pathological finding in pigs exposed to fumonisin B1 and/or Mycoplasma hyopneumoniae. Toxicol Ind Health. 2016;32:998–1012.
43. Burel C, Tanguy M, Guerre P, Boilletot E, Cariolet R, Queguiner M et al. Effect of low dose of fumonisins on pig health: immune status, intestinal microbiota and sensitivity to Salmonella. Toxins (Basel). 2013;5(4):841–64.
44. Poersch AB, Trombetta F, Souto NS, Lima de OC, Monteiro Braga AC, Dobrachinski F et al. Fumonisin B1 facilitates seizures induced by pentylenetetrazol in mice. Neurotoxicol Teratol. 2015;51:61–7.
45. Sousa FC, Schamber CR, Seron Amorin SS, Marcal Natali MR. Effect of fumonisin-containing diet on the myenteric plexus of the jejunum in rats. Auton Neurosci. 2014;185:93–9.
46. Gbore FA. Protein profiles of serum, brain regions and hypophyses of pubertal boars fed diets containing fumonisin B1. IFE J Sci. 2013;15:167–75.

73
Contaminants
47. Njumbe Ediage E, Diana Di Mavungu J, Song S, Sioen I, De Saeger S. Multimycotoxin analysis in urines to assess infant exposure: a case study in Cameroon. Environ Int. 2013;57–58:50–9.
48. Magoha H, De Meulenaer B, Kimanya M, Hipolite D, Lachat C, Kolsteren P. Fumonisin B1 contamination in breast milk and its exposure in infants under 6 months of age in Rombo, Northern Tanzania. Food Chem Toxicol. 2014;74:112–6.
49. Riley RT, Torres O, Matute J, Gregory SG, Ashley-Koch AE, Showker JL et al. Evidence for fumonisin inhibition of ceramide synthase in humans consuming maize-based foods and living in high exposure communities in Guatemala. Mol Nutr Food Res. 2015;59:2209–24.
50. Alizadeh AM, Rohandel G, Roudbarmohammadi S, Roudbary M, Sohanaki H, Ghiasian SA et al. Fumonisin B1 contamination of cereals and risk of esophageal cancer in a high risk area in northeastern Iran. Asian Pac J Cancer Prevent. 2012;13:2625–8.
51. Persson EC, Sewram V, Evans AA, London WT, Volkwyn Y, Shen Y-J et al. Fumonisin B1 and risk of hepatocellular carcinoma in two Chinese cohorts. Food Chem Toxicol. 2012;50:679–83.
52. Shirima CP, Kimanya ME, Routledge MN, Srey C, Kinabo JL, Humpf HU et al. A prospective study of growth and biomarkers of exposure to aflatoxin and fumonisin during early childhood in Tanzania. Environ Health Perspect. 2015;23:173–8.
53. Magoha H, Kimanya M, De Meulenaer B, Roberfroid D, Lachat C, Kolsteren P. Risk of dietary exposure to aflatoxins and fumonisins in infants less than 6 months of age in Rombo, Northern Tanzania. J Matern Child Nutr. 2016;12:516–27.
54. Adetunji M, Atanda O, Ezekiel CN, Sulyok M, Warth B, Beltran E et al. Fungal and bacterial metabolites of stored maize (Zea mays, L.) from five agro-ecological zones of Nigeria. Mycotoxin Res. 2014;30:89–102.
55. Fu M, Li RJ, Guo CC, Pang MH, Liu YC, Dong JG. Natural incidence of Fusarium species and fumonisins B1 and B2 associated with maize kernels from nine provinces in China in 2012. Food Addit Contam Part A Chem Anal Control Expo Risk Assess. 2015;32:503–11.
56. Phuong NH, Thieu NQ, Ogle B, Pettersson H. Aflatoxins, fumonisins and zearalenone contamination of maize in the Southeastern and Central Highlands provinces of Vietnam. Agriculture. 2015;5:1195–1203.
57. Rocha LO, Nakai VK, Braghini R, Reis TA, Kobashigawa E, Correa B. Mycoflora and co-occurrence of fumonisins and aflatoxins in freshly harvested corn in different regions of Brazil. Int J Mol Sci. 2009;10:5090–103.
58. Bryła M, Waśkiewicz A, Podolska G, Szymczyk K, Jędrzejczak R, Damaziak K et al. Occurrence of 26 mycotoxins in the grain of cereals cultivated in Poland. Toxins (Basel). 2016;8(6):160.
59. Hove M, De Boevre M, Lachat C, Jacxsens L, Nyanga LK, De Saeger S. Occurrence and risk assessment of mycotoxins in subsistence farmed maize from Zimbabwe. Food Control. 2016;69:36–44.
60. Sun G, Wang S, Hu X, Su J, Zhang Y, Xie Y et al. Co-contamination of aflatoxin B1 and fumonisin B1 in food and human dietary exposure in three areas of China. Food Addit Contam Part A Chem Anal Control Expo Risk Assess. 2011;28:461–70.
61. Matumba L, Sulyok M, Monjerezi M, Biswick T, Krska R. Fungal metabolites diversity in maize and associated human dietary exposures relate to micro-climatic patterns in Malawi. World Mycotoxin J. 2015;8:269–82.
62. FAO/WHO. Principles and methods for the risk assessment of chemicals in food. A joint publication of the Food and Agriculture Organization of the United Nations and the World Health Organization. Geneva: World Health Organization; 2009 (Environmental Health Criteria 240).
63. Sirot V, Fremy J-M, Leblanc J-C. Dietary exposure to mycotoxins and health risk assessment in the second French total diet study. Food Chem Toxicol. 2013;52:1–11.
64. Sprong RC, de Wit-Bos L, te Biesebeek JD, Alewijn M, Lopez P, Mengelers MJB. A mycotoxin-dedicated total diet study in the Netherlands in 2013: Part III – Exposure and risk assessment. World Mycotoxin J. 2016;9(1):109–28.
65. Sirot V, Volatier JL, Calamassi-Tran G, Dubuisson C, Ménard C, Dufour A et al. Core food of the French food supply: second Total Diet Study. Food Addit Contam Part A Chem Anal Control Expo Risk Assess. 2009;26:623–39.
66. Sprong RC, de Wit-Bos L, Zeilmaker MJ, Alewijn M, Castenmiller JJM, Mengelers MJB. A mycotoxin-dedicated total diet study in the Netherlands in 2013: Part I – Design. World Mycotoxin J. 2016;9(1):73–87.

74
Joint FAO/WHO Expert Committee on Food Additives Eighty-third report W
HO
Tec
hnic
al R
epor
t Ser
ies,
No.
100
2, 2
017
3.4 Glycidyl esters
ExplanationGlycidyl esters are processing-induced contaminants primarily found in refined fats and oils and foods containing fats and oils. Initial research related to glycidyl esters was largely performed as part of the investigation into 3-MCPD esters. During MCPD ester analysis, variable MCPD concentrations were obtained, leading to a proposal that additional compounds were present in edible oils and converted to 3-MCPD during sample analysis (1). The presence of additional processing-induced contaminants, glycidyl esters, in refined edible oils was later confirmed. Initially, it was assumed that 3-MCPD esters and glycidyl esters were formed by similar processes, but it is now known that their mechanisms of formation are different, with glycidyl ester formation directly associated with elevated temperatures (>240 °C) and time at these elevated temperatures (2). Glycidyl esters are generally formed from diacylglycerols, with no requirement for the presence of chlorinated compounds. Formation of glycidyl esters occurs following intramolecular rearrangement, elimination of a fatty acid and epoxide formation (Fig. 5).
Fig. 5Glycidyl monoester with examples of fatty acid chains: i) lauric acid, ii) stearic acid and iii) linoleic acid
Examples of possible R groups (fatty acid chains)

75
Contaminants
Glycidyl esters have not been evaluated previously by the Committee. The present evaluation was conducted in response to a request from CCCF for a full evaluation for glycidyl esters.
A comprehensive search of peer-reviewed literature was conducted in PubMed (toxicological) and Scopus (occurrence) for glycidyl esters and glycidol, taking the recent opinion by EFSA (3) into consideration, as well as secondary literature (reports and reviews). Only recent occurrence data (2012–2016) were evaluated, as there has been considerable improvement in the analysis of glycidyl esters and as changes in oil processing have led to a decrease in the levels of glycidyl esters in the finished oils. Data generated prior to this date were considered less reliable and few in number.
Biochemical aspectsGlycidyl estersSeven glycidyl esters (glycidyl laurate, myristate, palmitate, stearate, oleate, linoleate and linolenate) were shown to be rapidly (within 15 minutes) and fully hydrolysed by lipase from Aspergillus niger in a static in vitro system with gastric electrolyte solution at pH 4.8. In a dynamic gastrointestinal tract model simulating the different gastrointestinal compartments, the efficient degradation of the seven different glycidyl esters was confirmed using milk as a food matrix. It was shown for deuterated glycidyl oleate and glycidyl palmitate that the major hydrolysis product was glycidol (92%). The chain length of the fatty acids (12–18 carbons) did not have a significant impact on kinetics (4).
Following dosing of male rats with [2-14C]glycidyl palmitate by gavage at a single dose of 209.4 mg/kg bw, tissue distribution and excretion were investigated. Seven days after dosing, 41.3% of the 14C activity had been excreted in urine, 32.9% in expired air and 21.6% in faeces; 9.1% remained in tissues and organs. The highest concentrations of retained radiolabel were in liver, skeletal muscle, bone and erythrocytes 24 hours and 7 days after administration (5).
Male rats that had received a single equimolar dose of glycidol (50 mg/kg bw) or glycidyl palmitate (209.4 mg/kg bw) by gavage showed similar concentrations of the glycidol-derived haemoglobin adduct N-(1,2-dihydroxypropyl)valine in blood. Although the same steady-state level of haemoglobin adducts was seen for both substances, the level was reached for glycidyl palmitate with a delay of approximately 4–8 hours compared with glycidol. Concentrations of 2,3-dihydroxypropyl mercapturic acid excreted in urine were also similar for both substances at the three sampling time points (0–8 hours, 8–24 hours, 24–48 hours), reaching a recovery of approximately 14% of the dose as 2,3-dihydroxypropyl mercapturic acid 48 hours after administration.
76
Joint FAO/WHO Expert Committee on Food Additives Eighty-third report W
HO
Tec
hnic
al R
epor
t Ser
ies,
No.
100
2, 2
017
Based on the measurements of these two biomarkers, the authors concluded that glycidyl palmitate was rapidly and efficiently hydrolysed to glycidol (5).
Male rats and male cynomolgus monkeys were administered a single gavage or intravenous dose of glycidol (75 mg/kg bw) or a single equimolar gavage dose of glycidyl linoleate (341 mg/kg bw), and glycidol concentrations in plasma were monitored (for 24 hours in rats, 96 hours in cynomolgus monkeys). Glycidyl linoleate was not detectable in either species at any sampling time point. In the rat, maximum glycidol concentrations in plasma were reached 15–30 minutes after oral dosing, and concentrations were non-detectable after 24 hours for both substances. Similar blood kinetics for glycidol were observed for the administered glycidyl linoleate compared with glycidol in rats. In cynomolgus monkeys, the area under the concentration–time curve (AUC) for glycidol in plasma was only 56% following orally administered glycidyl linoleate compared with glycidol. Times to reach maximum blood values (Cmax) were 4 times longer in cynomolgus monkeys than in rats, whereas Cmax values after oral dosing of glycidol and glycidyl linoleate were also significantly reduced for cynomolgus monkeys compared with rats (factor of 4 for glycidol and factor of 17 for glycidyl linoleate). Although only a small number of cynomolgus monkeys were available at each sampling point (n = 3) and only “free” glycidol was measured in blood, the authors suggest that the pharmacokinetic differences between rats and cynomolgus monkeys might be attributable to differences in lingual or gastric lipase activity, stomach pH or epoxide metabolism (6).
In conclusion, glycidyl esters are efficiently hydrolysed in rats following oral dosing, resulting in the release of free glycidol. For cynomolgus monkeys, hydrolysis of glycidyl esters in the gastrointestinal tract is also evident, but to a lesser extent compared with rats. There are no human studies currently available describing the hydrolysis of glycidyl esters. Based on the results from in vitro gastrointestinal tract simulation models and in vivo evidence in rats, the Committee concluded that substantial hydrolysis of glycidyl esters to glycidol is likely to occur in the gastrointestinal tract. For the purpose of the current assessment, complete hydrolysis of the glycidyl esters is assumed.
GlycidolApproximately 87–92% of orally administered [1,3-14C]glycidol was absorbed from the gastrointestinal tract of male rats administered a single oral dose (gavage) of 37.5 or 75 mg/kg bw. Similar disposition kinetics were observed for oral and intravenous dosing, with 40–48% of the radioactivity excreted in urine, 5–12% in faeces, 26–32% exhaled as carbon dioxide and 7–8% retained in tissues within 72 hours (9–12% within 24 hours) after administration; highest concentrations

77
Contaminants
of radioactivity were in blood cells, thyroid, liver, kidney and spleen. Fifteen different metabolites were detected in urine, but not further identified (7). In the previously described study by Wakabayashi et al. (6), absolute systemic bioavailability of glycidol was estimated as 69% in rats and 34% in cynomolgus monkeys, respectively. Glycidol has been shown to be conjugated with glutathione and excreted in urine of rats and mice as S-(2,3-dihydroxypropyl)cysteine and 2,3-dihydroxypropyl mercapturic acid (8). In vitro investigations with rat liver and pulmonary microsomes have demonstrated that glycidol can be conjugated with glutathione or hydrolysed to form glycerol. The formation of glycerol from glycidol is catalysed by epoxide hydrolases (8, 9).
Human and rat blood samples were incubated with varying concentrations of glycidol for 1 hour at 37 °C, and a dose-dependent formation of N-(1,2-dihydroxypropyl)valine haemoglobin adducts was observed, with no significant species differences (10).
Rats received a single oral dose of glycidol (4.92–75 mg/kg bw), and whole blood was analysed for N-(1,2-dihydroxypropyl)valine haemoglobin adducts 24 hours after dosing. A dose-dependent increase in N-(1,2-dihydroxypropyl)valine levels was observed, which was statistically significantly different from control levels in all dose groups (10).
Toxicological studiesGlycidyl estersNo oral repeated-dose toxicity studies in rodents administered glycidyl esters were identified. The only available study is on various genotoxicity end-points using glycidyl linoleate in comparison with glycidol, which indicates that this ester is less genotoxic than glycidol. Although glycidol was positive in vitro in all tested bacterial strains (Salmonella typhimurium TA98, TA100, TA1535 and TA1537 and Escherichia coli WP2uvrA, with and without metabolic activation), glycidyl linoleate tested positive only in strains TA100 and TA1535 with and without metabolic activation and in E. coli WP2uvrA with metabolic activation. In the in vitro chromosomal aberration test with Chinese hamster lung cells, glycidol induced structural aberrations but no numerical aberrations, whereas glycidyl linoleate was negative for both end-points. When tested in vivo, neither substance induced micronuclei in the bone marrow of mice (11).
GlycidolThe oral LD50 of glycidol is 450 mg/kg bw in mice and 420–850 mg/kg bw in rats (12–14).

78
Joint FAO/WHO Expert Committee on Food Additives Eighty-third report W
HO
Tec
hnic
al R
epor
t Ser
ies,
No.
100
2, 2
017
In oral short-term toxicity studies with mice and rats, significantly reduced sperm count and reduced sperm motility were observed at doses of 53.6 mg/kg bw per day and higher in mice and at doses at and above the lowest tested dose of 17.9 mg/kg bw per day in rats (doses adjusted to 7 days/week dosing). Effects at higher doses (generally above 100 or 200 mg/kg bw per day; doses adjusted to 7 days/week dosing) included effects on kidney (tubule degeneration) and brain (demyelination in medulla and thalamus and/or necrosis in the cerebellum) in both species, as well as testicular atrophy in rats (15).
In oral long-term studies on toxicity and carcinogenicity in mice and rats, glycidol induced tumours in various tissues in both sexes at doses equal to and greater than the lowest tested doses of 17.9 and 26.8 mg/kg bw per day for mice and rats, respectively (doses adjusted to 7 days/week dosing) (15). The United States National Toxicology Program (NTP) (15) concluded that there was “clear evidence for carcinogenic activity” in male mice based on increased incidences of neoplasms of the Harderian gland, forestomach, skin, liver and lung, and in female mice based on increased incidences of neoplasms of the Harderian gland, mammary gland, uterus, subcutaneous tissue and skin. In rats, the NTP (15) concluded that there was “clear evidence of carcinogenic activity” in male rats based on increased incidences of mesotheliomas of the tunica vaginalis, fibroadenomas of the mammary gland, gliomas of the brain and neoplasms of the forestomach, intestine, skin, Zymbal gland and thyroid gland, and in female rats for increased incidences of fibroadenomas and adenosarcomas (now termed carcinosarcoma) of the mammary gland, gliomas of the brain, neoplasms of the oral mucosa, forestomach, clitoral gland and thyroid gland and leukaemia. Glycidol administered orally (17.9–142.9 mg/kg bw per day, doses adjusted to 7 days/week dosing) for 40 weeks to transgenic p16Ink4a/p19Arf mice induced increased incidences of histiocytic sarcomas and alveolar/bronchiolar adenoma (16), in contrast to another transgenic mouse strain (p53+/− mice), in which no tumours were reported after 6 months of oral administration of glycidol at 25–50 mg/kg bw per day (17).
Glycidol was clearly genotoxic in vitro in many bacterial and mammalian cell assays on mutagenicity with and without an exogenous metabolic system and induced sex-linked recessive lethal mutations and heritable translocations in Drosophila melanogaster, sister chromatid exchanges and chromosomal aberrations in Chinese hamster cells, DNA strand breaks in Chinese hamster ovary cells, rat kidney epithelial cells and human embryonic kidney cells as well as sister chromatid exchanges and chromosomal aberrations in human lymphocytes (11, 18–21). Glycidol also tested mostly positive in vivo, including DNA strand breaks in rat liver and urinary bladder (22), induction of micronuclei (15) and chromosomal aberrations and sister chromatid exchanges in mouse bone marrow (23).

79
Contaminants
In addition, the reactivity of the epoxy moiety adds evidence for the mutagenicity of glycidol via direct DNA interaction without need of prior metabolic activation.
Several studies on effects on reproduction and fertility were identified; however, none of them meets modern standards as a result of unconventional experimental design. Oral administration of glycidol at 200 (but not at 100) mg/kg bw per day for 5 days was shown to induce temporary/reversible infertility and spermatocoeles in male rats (24). Intraperitoneal administration of glycidol at approximately 3.5 mg/kg bw per day for 14 days was shown to reduce sperm motility in male rats without affecting fertility, in contrast to equimolar 3-MCPD, which produced complete infertility (25).
In an oral 14-day study on immunotoxicity in mice, glycidol doses of 125–250 mg/kg bw per day were shown to significantly alter several immune modulatory end-points compared with controls, whereas two bacterial host susceptibility tests were negative, indicating no effects on cell-mediated immunity functions; the NOAEL for immunotoxicity was 25 mg/kg bw per day (26).
In an oral 4-week study on neurotoxicity in rats, decreased relative brain weight, abnormal gait and axonopathy in the central and peripheral nervous systems were observed at glycidol doses of 200 mg/kg bw per day; the NOAEL was 30 mg/kg bw per day (27).
In an oral developmental neurotoxicity study in which pregnant rats were dosed from gestation day 6 until postnatal day 21, abnormal gait and axon injury in the central and peripheral nervous systems were observed at glycidol doses of 108.8 mg/kg bw per day in dams. No changes in reproductive end-points were seen in dams at any dose. The maternal toxicity NOAEL was 48.8 mg/kg bw per day. The NOAEL for offspring toxicity was 18.5 mg/kg bw per day, based on reduced body weight gain at higher doses. At 108.8 mg/kg bw per day, histopathological changes in the brain were observed in offspring, whereas gait was unaffected at any dose (28).
Observations in humansNo clinical or epidemiological studies were identified.
Analytical methods During studies related to indirect 3-MCPD ester analysis, artificially elevated concentrations of 3-MCPD were obtained when chlorinated compounds were used in the analytical procedure, relative to results from methods that used other reagents (e.g. sodium bromide, ammonium sulfate) (1, 29). This indicated that structurally related compounds were present in the oils or fats, and conversion to 3-MCPD was a function of the analytical procedure (1).

80
Joint FAO/WHO Expert Committee on Food Additives Eighty-third report W
HO
Tec
hnic
al R
epor
t Ser
ies,
No.
100
2, 2
017
Both indirect and direct methods of analysis are used for the determination of glycidyl ester concentrations in edible oils and foods. The indirect methods, which are used most frequently, require hydrolytic cleavage of the esters from the glycidol moiety prior to analysis, similar to indirect methods for the measurement of MCPD esters (30). Using direct methods, the analysis of intact glycidyl esters is performed without cleavage of the fatty acid esters from the glycidol moiety. Glycidyl ester analysis generally includes the addition of isotopically labelled (deuterated or 13C) MCPD, MCPD esters or glycidyl esters prior to extraction of samples to allow for correction of any losses or conversion that may occur during sample preparation, followed by extraction with solvent.
The presence of the glycidol epoxide ring necessitates the development of stable intermediates through a reaction of the glycidol moiety with a nucleophilic agent (e.g. sodium chloride or bromide), which may be performed either before or after hydrolysis of the ester group. The reaction to cleave the fatty acid esters from the glycidyl esters has been successfully performed using acidic or alkaline conditions or via enzymatic cleavage in a low-pH environment (pH 5). Following completion of the cleavage of fatty acid methyl esters from the glycidyl esters, the reaction is stopped by balancing the pH in the reaction vessel. Addition of sodium chloride or sodium bromide results in the formation of MCPD or monobromopropanediol, with analysis following derivatization, which is most frequently reported using phenylboronic acid (30).
Indirect methods that involve the comparison of results obtained for MCPD alone or MCPD concentrations based on the sum of MCPD plus the MCPD formed through the conversion of glycidol originating from glycidyl esters require application of a conversion factor (0.67) to correct for the molecular weight difference between MCPD (110.54 g/mol) and glycidol (74.08 g/mol) (1). The results obtained using this approach are based on the assumption that complete conversion of glycidol to MCPD has occurred and that the only source of the additional MCPD is from glycidyl esters (29).
Three indirect official methods pertaining to the analysis of glycidyl esters exclusively in oils and fats have been developed by the American Oil Chemists’ Society (31–33). One of the AOCS official methods quantifies glycidol by the difference in the 3-MCPD concentrations measured in paired samples, where the glycidol in one sample of the pair has been converted to MCPD whereas the other sample is not subject to the conversion, and therefore the result is based on MCPD concentrations alone. AOCS Official Method Cd 29c-13 (33) is harmonized with the international standard method in fats and oils (ISO 18363-1) (34).
Direct analysis of intact glycidyl esters, where glycidyl esters are isolated from samples and analysed without cleavage of esters, is also performed in some laboratories. Analysis of extracted samples is generally performed following a two-step cleanup procedure followed by LC-MS (35, 36). Reporting of results
81
Contaminants
using direct methods tends to be as a total glycidol concentration based on five or seven glycidyl esters, to address the dominant fatty acids (palmitic acid, linolenic acid, linoleic acid, oleic acid, stearic acid plus lauric acid and myristic acid) present in oils.
Additionally, a method for the direct detection of glycidyl esters in edible oil has been developed jointly by the AOCS and the Japan Oil Chemists’ Society. Similar to other methods reported in the literature, the method requires two stages of solid-phase extraction cleanup followed by LC-MS analysis (AOCS Official Method Cd 28-10) (37).
Sampling protocols Although the Codex Alimentarius Commission has not established specific sampling protocols for glycidyl esters, general guidelines on sampling have been developed (38). Best practices have been established for numerous contaminants and include the collection of samples by qualified individuals using containers that are clean and non-reactive and that protect samples from contamination or damage during transport and storage. Sampling of commercial food products must ensure that samples collected are representative of the lot. Therefore, collection of multiple samples (incremental samples) from within the lot is recommended and may be used to form an aggregate sample from which laboratory samples may be analysed. Prior to the subsampling for laboratory analysis, homogenization of the aggregate sample should be performed, consistent with good laboratory practices. Sample collection must be focused on food commodities that are relevant to glycidyl esters, such as fats, oils and products containing fats and oils.
Effects of processing Glycidyl esters are present in processed oils, fats and food prepared using these products. These compounds are, however, not generally present in crude or unrefined oils at elevated levels. As a result, they are considered to be food processing–induced compounds, where the processing of oils or fats leads to the production of glycidyl esters. The steps required for refining or purification of oils or fats may contribute to the formation (e.g. deodorization) or mitigation (e.g. degumming) of these food contaminants.
Preparation of refined oils from the crude form involves several steps, which include degumming, neutralization, bleaching and deodorization (39). Degumming of oils removes phospholipids and is generally performed at relatively low temperatures (80–120 °C) (39, 40). Neutralization of oils involves interaction of the oils with sodium carbonate or bicarbonate to lower the acid value (increase the pH), prior to deodorization (41). The bleaching process involves exposure of oils to bleaching clays to remove phospholipids from the oils

82
Joint FAO/WHO Expert Committee on Food Additives Eighty-third report W
HO
Tec
hnic
al R
epor
t Ser
ies,
No.
100
2, 2
017
(42). The final stage of oil refining is known as deodorization, where, in addition to acid treatment, oils are heated at elevated temperatures (>200 °C) (43). The refining process has been investigated to determine the impact on formation of glycidyl esters, although the majority of research has focused on the MCPD esters owing to their earlier discovery.
It has been established by several researchers that deodorization, where oils are exposed to elevated temperatures, is the critical step in the formation of glycidyl esters (39). Finished palm oil products have been shown to have higher glycidyl ester levels than other oils when subjected to similar refining conditions. Processing of palm oil has resulted in elevated glycidyl ester and MCPD ester production, relative to other oil types, indicating that oil constituents have an impact on the effect of processing (2). Glycidyl ester values were significantly higher after deodorization of non-degummed palm oil samples, suggesting that the removal of the precursors during the degumming step is beneficial.
Prevention and control The formation of glycidyl esters is a function of the composition of the oil and the processing conditions used to refine crude oils. The type of oil processed has an impact on the glycidyl ester formation capacity, with palm oil producing greater amounts of glycidyl esters compared with other oil types owing to the high levels of diacylglycerols in the oil (1). Oils high in diacylglycerols, which are known to be glycidyl ester precursors, are expected to produce higher levels of glycidyl esters, although other compounds, such as glycerol and phospholipids, may also contribute to the formation of glycidyl esters (2, 44). Chlorinated compounds are not anticipated to have an impact on glycidyl ester formation, whereas they are required for the formation of 3-MCPD esters (45). Strategies to prevent and control the formation of glycidyl esters in final oil products include:
■ selection of raw material with low precursor content; ■ removal of precursors using chemical treatment at mid-range
temperatures; ■ deodorization performed at neutral pH below 240 °C; ■ adoption of dual deodorization protocols; ■ utilization of adsorbents to remove glycidyl esters in post-treatment.
The Committee noted the commitment of the European fats and oils industry trade organization (FEDIOL) to continue to reduce the levels of glycidyl esters in refined vegetable oils and encouraged the organization to continue to reduce the levels of these contaminants.

83
Contaminants
Levels and patterns of contamination in food commodities Globally, oils and fats are regional in their production and may be consumed in higher proportions in the production area than in importing countries. The variety of oils consumed in any given region varies depending on the source (FAOSTAT database: http://www.fao.org/faostat/en). Palm oil and its products are a major fat source in South-east Asia, but less dominant in Europe and North America, whereas soya bean oil is the predominant vegetable oil in North and South America, and rapeseed and sunflower seed oils are more common in Europe. The determination of the types of oil in a finished food is often complicated by the use of mixtures to give a food a particular texture or structure, and the oils used may reflect the availability of suitable ingredients. It is apparent that glycidyl esters are formed in the processing of vegetable oils mainly during the deodorization stage. The extent to which they are formed depends on the oilseed or fruit being processed, the process being used and the type of equipment installed. Hence, the refined oil obtained from any oil source may vary in glycidyl ester content. From reports of the analysis of foodstuffs in a number of countries, it appears that refined vegetable oil is a major contributor to the levels of glycidyl esters found in food (3). There appears to be little evidence that glycidyl esters are formed in food during processing or cooking, and there is a reasonable correlation between the levels of glycidyl esters in the oils used and the amounts of the oils that were used in the food. A search using PubMed did not yield any publications showing the occurrence of free glycidol in food. Glycidyl ester content was tested in more than 100 different edible fats, oils and related products containing fats or oils, such as cookies and cooking sprays, in Canada (46). Most virgin/unprocessed/unrefined oils did not contain detectable levels of glycidyl esters. However, glycidyl ester levels were highly variable in refined oils and fats, reaching 11 µg/kg, expressed as glycidol equivalents.
It should be noted that methods for the analysis of glycidyl esters in foods, other than for fats and oils, have not been subjected to full collaborative study, and it is not clear if the same samples were analysed by any of the laboratories involved in the provision of the majority of the results received from the USA, Canada and the European Union in response to the call for data. Although these methods themselves might exhibit reasonable precision for different food types, their accuracy has not been evaluated under rigorous conditions. Recently, a collaborative study has been organized for the analysis of contaminants in high-fat foods (margarines and mayonnaise), but no international work on other food types has been initiated.
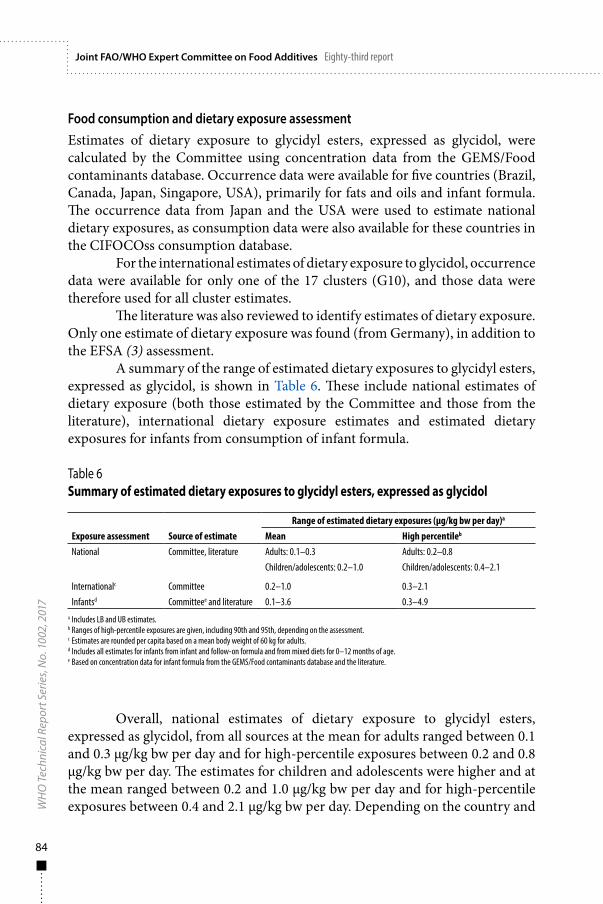
84
Joint FAO/WHO Expert Committee on Food Additives Eighty-third report W
HO
Tec
hnic
al R
epor
t Ser
ies,
No.
100
2, 2
017
Food consumption and dietary exposure assessmentEstimates of dietary exposure to glycidyl esters, expressed as glycidol, were calculated by the Committee using concentration data from the GEMS/Food contaminants database. Occurrence data were available for five countries (Brazil, Canada, Japan, Singapore, USA), primarily for fats and oils and infant formula. The occurrence data from Japan and the USA were used to estimate national dietary exposures, as consumption data were also available for these countries in the CIFOCOss consumption database.
For the international estimates of dietary exposure to glycidol, occurrence data were available for only one of the 17 clusters (G10), and those data were therefore used for all cluster estimates.
The literature was also reviewed to identify estimates of dietary exposure. Only one estimate of dietary exposure was found (from Germany), in addition to the EFSA (3) assessment.
A summary of the range of estimated dietary exposures to glycidyl esters, expressed as glycidol, is shown in Table 6. These include national estimates of dietary exposure (both those estimated by the Committee and those from the literature), international dietary exposure estimates and estimated dietary exposures for infants from consumption of infant formula.
Table 6Summary of estimated dietary exposures to glycidyl esters, expressed as glycidol
Exposure assessment Source of estimateRange of estimated dietary exposures (µg/kg bw per day)a
Mean High percentileb
National Committee, literature Adults: 0.1–0.3 Adults: 0.2–0.8Children/adolescents: 0.2–1.0 Children/adolescents: 0.4–2.1
Internationalc Committee 0.2–1.0 0.3–2.1Infantsd Committeee and literature 0.1–3.6 0.3–4.9
a Includes LB and UB estimates.b Ranges of high-percentile exposures are given, including 90th and 95th, depending on the assessment.c Estimates are rounded per capita based on a mean body weight of 60 kg for adults.d Includes all estimates for infants from infant and follow-on formula and from mixed diets for 0–12 months of age.e Based on concentration data for infant formula from the GEMS/Food contaminants database and the literature.
Overall, national estimates of dietary exposure to glycidyl esters, expressed as glycidol, from all sources at the mean for adults ranged between 0.1 and 0.3 µg/kg bw per day and for high-percentile exposures between 0.2 and 0.8 µg/kg bw per day. The estimates for children and adolescents were higher and at the mean ranged between 0.2 and 1.0 µg/kg bw per day and for high-percentile exposures between 0.4 and 2.1 µg/kg bw per day. Depending on the country and

85
Contaminants
population group, palm oil, margarine or soya bean oil was the main contributor to exposure, and infant formula for infants consuming mixed diets.
International estimates of UB mean dietary exposure to glycidyl esters, expressed as glycidol, were in the same range of between 0.2 and 1.0 µg/kg bw per day for adults, and high exposures (90th percentile) were between 0.3 and 2.1 µg/kg bw per day for adults. Palm oil was the highest contributor to overall dietary glycidol exposure for 11 of the clusters, with margarine being the highest contributor for five clusters.
Estimated dietary exposures to glycidyl esters, expressed as glycidol, for infants 0–12 months of age were broader in range than estimates for children, adults or the general population, particularly around the high end of the ranges. Mean exposures ranged between 0.1 and 3.6 µg/kg bw per day, and high-percentile exposures between 0.3 and 4.9 µg/kg bw per day.
Dose–response analysisComplete hydrolysis of glycidyl esters to glycidol was assumed for the present evaluation. Glycidol is genotoxic and is carcinogenic in various tissues of rats and mice of both sexes, and the NTP carcinogenicity studies with mice and rats (15) are considered the pivotal studies for risk assessment. To find the most sensitive target organ, the USEPA’s Benchmark Dose Software (BMDS version 2.6.1) models were fitted to data reported in the NTP studies. For this analysis, doses were adjusted by a factor of 5/7 to account for the fact that the animals were dosed only 5 out of 7 days of the week. All models in the BMDS software were fitted to the data using its default settings for restricted models. For the male rat, mesothelioma in the tunica vaginalis/peritoneum provided the lowest BMDLs. In mice, hepatocellular adenoma/carcinoma in males provided the lowest BMDLs. Results for the female rats and mice were significantly higher. Overall, mesothelioma in the tunica vaginalis/peritoneum in the male rat from the NTP (15) study was the most sensitive end-point, with a benchmark dose for a 10% response (BMD10) of 3.0 mg/kg bw per day and a BMDL10 of 2.4 mg/kg bw per day, obtained using the quantal-linear model (Table 7).
EvaluationExperimental evidence indicates that glycidyl esters are substantially hydrolysed to glycidol in the gastrointestinal tract and elicit toxicity as glycidol. The Committee therefore based its evaluation on the conservative assumption of complete hydrolysis of glycidyl esters to glycidol. Whereas the experimental data supporting substantial hydrolysis are derived from studies with post-weaning animals, the Committee concluded that the capacity of the neonate to hydrolyse

86
Joint FAO/WHO Expert Committee on Food Additives Eighty-third report W
HO
Tec
hnic
al R
epor
t Ser
ies,
No.
100
2, 2
017
fatty acids in the gut is efficient, and therefore the same assumption of substantial hydrolysis could be extended to this age group.
The Committee concluded that glycidol is a genotoxic compound and considered its carcinogenicity as the most sensitive end-point on which to base a point of departure. The lowest BMDL10 was 2.4 mg/kg bw per day for mesotheliomas in the tunica vaginalis/peritoneum in male rats observed in the NTP (15) carcinogenicity study (doses adjusted for non-continuous dosing).
The Committee noted that there are no published collaboratively studied methods for the determination of glycidyl esters in complex foods, in contrast to the situation with fats and oils; therefore, caution should be applied when interpreting analytical data from complex foods.
The Committee further noted that there was uncertainty in comparing the reported levels in the same foods from different regions because of the lack of interlaboratory comparisons and the absence of data arising from proficiency testing schemes.
As it is not appropriate to establish a health-based guidance value for substances that are both genotoxic and carcinogenic, the MOE approach is chosen.
National estimates of dietary exposure were used for determining the MOEs. This was because they were considered to be the most representative of dietary exposure, as they are based on consumption data from national dietary surveys. The majority of the surveys used include 2 or more days of data, which better estimate chronic dietary exposure.
The national dietary exposures are considered to be reliable estimates, as they are based on a range of foods in the diet and include the key foods in which glycidol contamination is known to occur – namely, fats and oils. The
Species / study type (route of administration)
Doses (mg/kg bw per day)a Critical end-point
BMD10 (mg/kg bw per day)
BMDL10 (mg/kg bw per day)
Mouse
Two-year study of toxicity and carcinogenicity (gavage)
0, 17.9, 35.7 Hepatocellular adenoma/carcinoma (males)
5.4 2.6
Rat
Two-year study of toxicity and carcinogenicity (gavage)
0, 26.8, 53.6 Mesothelioma of tunica vaginalis/peritoneum (males)
3.0 2.4
Table 7Results of benchmark dose modelling from the NTP (15) study in rats and mice
a Doses adjusted to 7 days/week dosing.
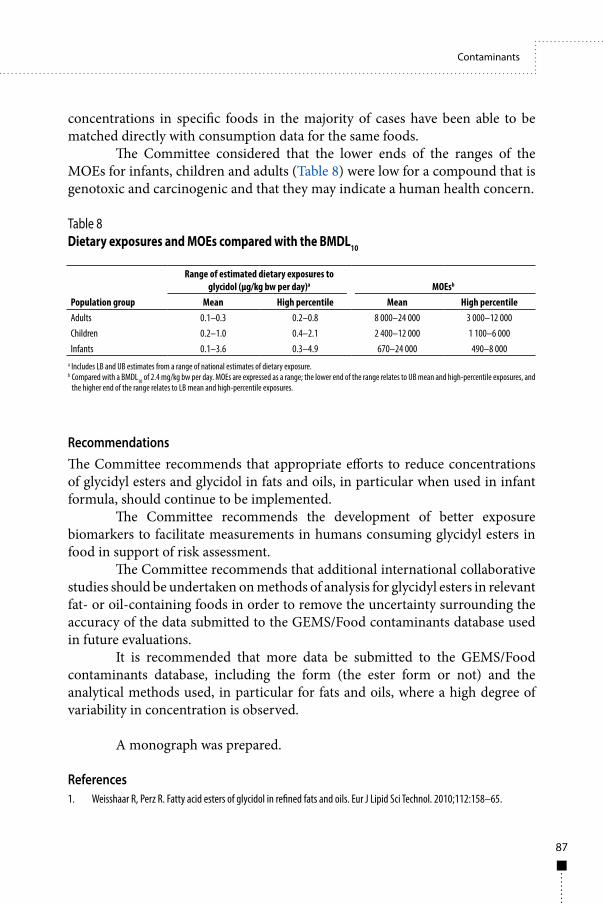
87
Contaminants
concentrations in specific foods in the majority of cases have been able to be matched directly with consumption data for the same foods.
The Committee considered that the lower ends of the ranges of the MOEs for infants, children and adults (Table 8) were low for a compound that is genotoxic and carcinogenic and that they may indicate a human health concern.
Table 8 Dietary exposures and MOEs compared with the BMDL10
a Includes LB and UB estimates from a range of national estimates of dietary exposure.b Compared with a BMDL10 of 2.4 mg/kg bw per day. MOEs are expressed as a range; the lower end of the range relates to UB mean and high-percentile exposures, and
the higher end of the range relates to LB mean and high-percentile exposures.
RecommendationsThe Committee recommends that appropriate efforts to reduce concentrations of glycidyl esters and glycidol in fats and oils, in particular when used in infant formula, should continue to be implemented. The Committee recommends the development of better exposure biomarkers to facilitate measurements in humans consuming glycidyl esters in food in support of risk assessment.
The Committee recommends that additional international collaborative studies should be undertaken on methods of analysis for glycidyl esters in relevant fat- or oil-containing foods in order to remove the uncertainty surrounding the accuracy of the data submitted to the GEMS/Food contaminants database used in future evaluations.
It is recommended that more data be submitted to the GEMS/Food contaminants database, including the form (the ester form or not) and the analytical methods used, in particular for fats and oils, where a high degree of variability in concentration is observed.
A monograph was prepared.
References 1. Weisshaar R, Perz R. Fatty acid esters of glycidol in refined fats and oils. Eur J Lipid Sci Technol. 2010;112:158–65.
Population group
Range of estimated dietary exposures to glycidol (µg/kg bw per day)a MOEsb
Mean High percentile Mean High percentileAdults 0.1–0.3 0.2–0.8 8 000–24 000 3 000–12 000Children 0.2–1.0 0.4–2.1 2 400–12 000 1 100–6 000Infants 0.1–3.6 0.3–4.9 670–24 000 490–8 000
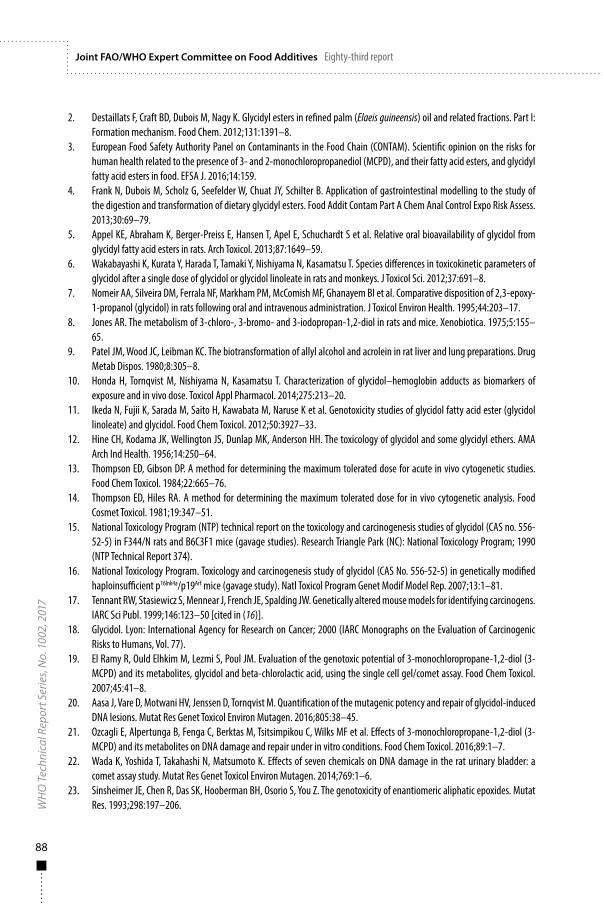
88
Joint FAO/WHO Expert Committee on Food Additives Eighty-third report W
HO
Tec
hnic
al R
epor
t Ser
ies,
No.
100
2, 2
017
2. Destaillats F, Craft BD, Dubois M, Nagy K. Glycidyl esters in refined palm (Elaeis guineensis) oil and related fractions. Part I: Formation mechanism. Food Chem. 2012;131:1391–8.
3. European Food Safety Authority Panel on Contaminants in the Food Chain (CONTAM). Scientific opinion on the risks for human health related to the presence of 3- and 2-monochloropropanediol (MCPD), and their fatty acid esters, and glycidyl fatty acid esters in food. EFSA J. 2016;14:159.
4. Frank N, Dubois M, Scholz G, Seefelder W, Chuat JY, Schilter B. Application of gastrointestinal modelling to the study of the digestion and transformation of dietary glycidyl esters. Food Addit Contam Part A Chem Anal Control Expo Risk Assess. 2013;30:69–79.
5. Appel KE, Abraham K, Berger-Preiss E, Hansen T, Apel E, Schuchardt S et al. Relative oral bioavailability of glycidol from glycidyl fatty acid esters in rats. Arch Toxicol. 2013;87:1649–59.
6. Wakabayashi K, Kurata Y, Harada T, Tamaki Y, Nishiyama N, Kasamatsu T. Species differences in toxicokinetic parameters of glycidol after a single dose of glycidol or glycidol linoleate in rats and monkeys. J Toxicol Sci. 2012;37:691–8.
7. Nomeir AA, Silveira DM, Ferrala NF, Markham PM, McComish MF, Ghanayem BI et al. Comparative disposition of 2,3-epoxy-1-propanol (glycidol) in rats following oral and intravenous administration. J Toxicol Environ Health. 1995;44:203–17.
8. Jones AR. The metabolism of 3-chloro-, 3-bromo- and 3-iodopropan-1,2-diol in rats and mice. Xenobiotica. 1975;5:155–65.
9. Patel JM, Wood JC, Leibman KC. The biotransformation of allyl alcohol and acrolein in rat liver and lung preparations. Drug Metab Dispos. 1980;8:305–8.
10. Honda H, Tornqvist M, Nishiyama N, Kasamatsu T. Characterization of glycidol–hemoglobin adducts as biomarkers of exposure and in vivo dose. Toxicol Appl Pharmacol. 2014;275:213–20.
11. Ikeda N, Fujii K, Sarada M, Saito H, Kawabata M, Naruse K et al. Genotoxicity studies of glycidol fatty acid ester (glycidol linoleate) and glycidol. Food Chem Toxicol. 2012;50:3927–33.
12. Hine CH, Kodama JK, Wellington JS, Dunlap MK, Anderson HH. The toxicology of glycidol and some glycidyl ethers. AMA Arch Ind Health. 1956;14:250–64.
13. Thompson ED, Gibson DP. A method for determining the maximum tolerated dose for acute in vivo cytogenetic studies. Food Chem Toxicol. 1984;22:665–76.
14. Thompson ED, Hiles RA. A method for determining the maximum tolerated dose for in vivo cytogenetic analysis. Food Cosmet Toxicol. 1981;19:347–51.
15. National Toxicology Program (NTP) technical report on the toxicology and carcinogenesis studies of glycidol (CAS no. 556-52-5) in F344/N rats and B6C3F1 mice (gavage studies). Research Triangle Park (NC): National Toxicology Program; 1990 (NTP Technical Report 374).
16. National Toxicology Program. Toxicology and carcinogenesis study of glycidol (CAS No. 556-52-5) in genetically modified haploinsufficient p16Ink4a/p19Arf mice (gavage study). Natl Toxicol Program Genet Modif Model Rep. 2007;13:1–81.
17. Tennant RW, Stasiewicz S, Mennear J, French JE, Spalding JW. Genetically altered mouse models for identifying carcinogens. IARC Sci Publ. 1999;146:123–50 [cited in (16)].
18. Glycidol. Lyon: International Agency for Research on Cancer; 2000 (IARC Monographs on the Evaluation of Carcinogenic Risks to Humans, Vol. 77).
19. El Ramy R, Ould Elhkim M, Lezmi S, Poul JM. Evaluation of the genotoxic potential of 3-monochloropropane-1,2-diol (3-MCPD) and its metabolites, glycidol and beta-chlorolactic acid, using the single cell gel/comet assay. Food Chem Toxicol. 2007;45:41–8.
20. Aasa J, Vare D, Motwani HV, Jenssen D, Tornqvist M. Quantification of the mutagenic potency and repair of glycidol-induced DNA lesions. Mutat Res Genet Toxicol Environ Mutagen. 2016;805:38–45.
21. Ozcagli E, Alpertunga B, Fenga C, Berktas M, Tsitsimpikou C, Wilks MF et al. Effects of 3-monochloropropane-1,2-diol (3-MCPD) and its metabolites on DNA damage and repair under in vitro conditions. Food Chem Toxicol. 2016;89:1–7.
22. Wada K, Yoshida T, Takahashi N, Matsumoto K. Effects of seven chemicals on DNA damage in the rat urinary bladder: a comet assay study. Mutat Res Genet Toxicol Environ Mutagen. 2014;769:1–6.
23. Sinsheimer JE, Chen R, Das SK, Hooberman BH, Osorio S, You Z. The genotoxicity of enantiomeric aliphatic epoxides. Mutat Res. 1993;298:197–206.

89
Contaminants
24. Cooper ER, Jones AR, Jackson H. Effects of alpha-chlorohydrin and related compounds on the reproductive organs and fertility of the male rat. J Reprod Fertil. 1974;38:379–86.
25. Brown-Woodman PDC, White IG, Ridley DD. The antifertility activity and toxicity of alpha-chlorohydrine derivatives in male rats. Contraception. 1979;19:517–29.
26. Guo TL, McCay JA, Brown RD, Musgrove DL, Butterworth L, Munson AE et al. Glycidol modulation of the immune responses in female B6C3F1 mice. Drug Chem Toxicol. 2000;23:433–57.
27. Akane H, Shiraki A, Imatanaka N, Akahori Y, Itahashi M, Abe H et al. Glycidol induces axonopathy and aberrations of hippocampal neurogenesis affecting late-stage differentiation by exposure to rats in a framework of 28-day toxicity study. Toxicol Lett. 2014;224:424–32.
28. Akane H, Shiraki A, Imatanaka N, Akahori Y, Itahashi M, Ohishi T et al. Glycidol induces axonopathy by adult-stage exposure and aberration of hippocampal neurogenesis affecting late-stage differentiation by developmental exposure in rats. Toxicol Sci. 2013;134:140–54.
29. Kuhlmann J. Determination of bound 2,3-epoxy-1-propanol (glycidol) and bound monochloropropanediol (MCPD) in refined oils. Eur J Lipid Sci Technol. 2011;113:335–44.
30. Crews C, Chiodini A, Granvogl M, Hamlet C, Hrnčiřík K, Kuhlmann J et al. Analytical approaches for MCPD esters and glycidyl esters in food and biological samples: a review and future perspectives. Food Addit Contam Part A Chem Anal Control Expo Risk Assess. 2013;30:11–45.
31. AOCS Official Method Cd 29a-13. 2- and 3-MCPD fatty acid esters and glycidol fatty acid esters in edible oils and fats by acid transesterification. American Oil Chemists’ Society; 2013:1–18.
32. AOCS Official Method Cd 29b-13. Determination of bound monochloropropanediol- (MCPD-) and bound 2,3-epoxy-1-propanol (glycidol-) by gas chromatography/mass spectrometry (GC/MS). American Oil Chemists’ Society; 2013:1–14.
33. AOCS Official Method Cd 29c-13. Fatty-acid-bound 3-chloropropane-1,2-diol (3-MCPD) and 2,3-epoxi-propane-1-ol (glycidol), determination in oils and fats by GC/MS (differential measurement). American Oil Chemists’ Society; 2013:1–13.
34. BS ISO 18363-1:2015. Animal and vegetable fats and oils – determination of fatty-acid-bound chloropropanediols (MCPDs) and glycidol by GC/MS. Part 1: Method using fast alkaline transesterification and measurement for 3-MCPD and differential measurement for glycidol. British Standards Institution; 2015:1–11.
35. Becalski A, Feng SY, Lau BP, Zhao T. Glycidyl fatty acid esters in food by LC-MS/MS: method development. Anal Bioanal Chem. 2012;403:2933–42.
36. MacMahon S, Mazzola E, Begley TH, Diachenko GW. Analysis of processing contaminants in edible oils. Part 1. Liquid chromatography–tandem mass spectrometry method for the direct detection of 3-monochloropropanediol monoesters and glycidyl esters. J Agric Food Chem. 2013;61(20):4737–47.
37. Joint AOCS/JOCS Official Method Cd 28-10. Glycidyl fatty acid esters in edible oils. American Oil Chemists’ Society and Japan Oil Chemists’ Society; 2012:1–8.
38. General guidelines on sampling. Rome: Food and Agriculture Organization of the United Nations, Joint FAO/WHO Food Standards Programme, Codex Alimentarius Commission; 2004 (CAC/GC-50-2004).
39. Pudel F, Benecke P, Fehling P, Freudenstein A, Matthäus B, Schwaf A. On the necessity of edible oil refining and possible sources of 3-MCPD and glycidyl esters. Eur J Lipid Sci Technol. 2011;113:368–73.
40. Šmidrkal J, Ilko V, Filip V, Doležal M, Zelinková Z, Kyselka J et al. Formation of acylglycerol chloro derivatives in vegetable oils and mitigation strategy. Czech J Food Sci. 2011;29:448–56.
41. Freudenstein A, Weking J, Matthäus B. Influence of precursors on the formation of 3-MCPD and glycidyl esters in a model oil under simulated deodorization conditions. Eur J Lipid Sci Technol. 2013;115:286–94.
42. Hrncirik K, van Duijn G. An initial study on the formation of 3-MCPD esters during oil refining. Eur J Lipid Sci Technol. 2011;113:374–9.
43. Matthäus B, Freudenstein A, Pudel F, Rudolph T. Final results of the German FEI research project concerning 3-MCPD esters and related compounds – mitigation strategies. Presented at 9th Euro Fed Lipid Congress, Rotterdam, the Netherlands, 18–21 September 2011.
44. Shimizu M, Vosmann K, Matthäus B. Generation of 3-monochloro-1,2-propanediol and related materials from tri-, di-, and monoolein at deodorization temperature. Eur J Lipid Sci Technol. 2012;114:1268–73.

90
Joint FAO/WHO Expert Committee on Food Additives Eighty-third report W
HO
Tec
hnic
al R
epor
t Ser
ies,
No.
100
2, 2
017
45. Nagy K, Sandoz L, Craft BD, Destaillats F. Mass-defect filtering of isotope signatures reveals the source of chlorinated palm oil contaminants. Food Addit Contam Part A Chem Anal Control Expo Risk Assess. 2011;28(11):1492–500.
46. Becalski A, Feng S, Lau BP-Y, Zhao T. A pilot survey of 2- and 3-monochloropropanediol and glycidol fatty acid esters in foods on the Canadian market 2011–2013. J Food Comp Anal. 2015;37:58–66.
3.5 3-MCPD esters and 3-MCPDExplanation 3-Monochloro-1,2-propanediol (3-MCPD) esters are processing-induced contaminants found in various refined oils and fats and are formed from acylglycerols in the presence of chlorinated compounds during deodorization at high temperature (Fig. 6). “3-MCPD esters” is a general term for 3-MCPD esterified with one (sn-1- and sn-2-monoesters) or two identical or different fatty acids (diesters). Depending on the fatty acid composition of the oil or fat, a variety of different 3-MCPD esters can be formed during processing. In foods that contain refined vegetable oils or fats, mainly diesters are found. Concentrations of 3-MCPD esters in refined oils increase incrementally as follows: rapeseed oil < soya bean oil < sunflower oil < safflower oil < walnut oil < palm oil (1).
3-MCPD esters have not been previously evaluated by the Committee. The present evaluation was conducted in response to a request from CCCF for an evaluation of 3-MCPD esters. 3-MCPD was evaluated at the forty-first, fifty-seventh and sixty-seventh meetings of JECFA (Annex 1, references 107, 154 and 184). At the sixty-seventh meeting, the Committee reaffirmed a PMTDI for 3-MCPD of 2 μg/kg bw, based on a lowest-observed-effect level (LOEL) of 1.1 mg/kg bw per day for tubular hyperplasia in the kidney seen in a long-term carcinogenicity study in rats (2). An uncertainty factor of 500 was applied to allow for the absence of a clear no-observed-effect level (NOEL) and to account for the effects on male fertility and inadequacies in the studies of reproductive toxicity. The Committee at that time noted that it had been reported that fatty acid esters of 3-MCPD are present in foods, but there were insufficient data to allow the evaluation of either their intake or their toxicological significance. A literature search of publicly available peer-reviewed literature in PubMed was conducted for toxicity data on 3-MCPD esters (no time restrictions, full data set) as well as for 3-MCPD since the last JECFA evaluation (2005–2016, with a focus on biochemical aspects, oral repeated-dose toxicity studies and genotoxicity studies). The recent opinion by EFSA (3) was taken into consideration, as well as secondary literature (reports and reviews). Only recent occurrence data obtained from a literature search on Scopus (2012–2016) were evaluated, as there have been considerable improvements in the analysis of 3-MCPD esters and as changes in oil processing have led to a decrease in the levels of 3-MCPD esters in

91
Contaminants
the finished oils. Data generated prior to this date were considered less reliable and few in number.
Fig. 6A) 3-MCPD diester, B) sn-2 3-MCPD and C) sn-1 3-MCPD monoester, with examples of fatty acid chains i) myristic acid, ii) palmitic acid and iii) oleic acid
Examples of possible R groups (fatty acid chains)
Biochemical aspects3-MCPD estersIn vitro, various 3-MCPD esters were shown to be substrates for porcine pancreatic lipases and, particularly sn-1-monoesters, were hydrolysed rapidly and almost completely as determined by the release of 3-MCPD (>95% within 1 minute at 37 °C). Although a diester (3-MCPD palmitate-oleate) was also efficiently hydrolysed in the same test system, the hydrolysis occurred at a slower rate (>95% within 90 minutes at 37 °C) (4). In another in vitro study, approximately 40% of 3-MCPD dioleate was hydrolysed mainly to 3-MCPD-sn-2-monooleate, releasing only small amounts of free 3-MCPD, after a 3-hour incubation with porcine pancreatic lipase at 37 °C (5).
Following oral administration of equimolar 3-MCPD and 3-MCPD dipalmitate to rats, significant amounts of 3-MCPD in the blood were detected (86% based on a comparison of AUC values for free 3-MCPD), demonstrating efficient hydrolysis. The maximum plasma concentration (Cmax) of 3-MCPD was
A B C
92
Joint FAO/WHO Expert Committee on Food Additives Eighty-third report W
HO
Tec
hnic
al R
epor
t Ser
ies,
No.
100
2, 2
017
approximately 5 times lower following administration of 3-MCPD dipalmitate compared with 3-MCPD. In support of the efficiency of the hydrolysis, no 3-MCPD dipalmitate was detected in blood, kidney, liver or fat following oral administration. Excretion of free 3-MCPD in urine (within 72 hours) and faeces (within 48 hours) after dosing was also investigated and was found to be similar for equimolar doses of 3-MCPD and its dipalmitate, with 2.0% and 2.4% of the dose as 3-MCPD in urine and 0.5% and 1.4% in faeces, respectively (6). After oral administration of 3-MCPD dipalmitate to rats, measured urinary metabolites included, in decreasing order, 2,3-dihydroxypropyl mercapturic acid and free 3-MCPD; no (<LOD) β-chlorolactic acid was detected (7). Based on the available data, substantial hydrolysis of 3-MCPD esters (monoesters and diesters) to 3-MCPD in the gastrointestinal tract has been demonstrated. For the purpose of the current assessment, complete hydrolysis of the 3-MCPD esters is assumed.
3-MCPD3-MCPD appears to be detoxified by glutathione conjugation, yielding S-(2,3-dihydroxypropyl)cysteine and 2,3-dihydroxypropyl mercapturic acid. It can also be oxidized to β-chlorolactic acid and further to oxalic acid (Annex 1, reference 155). In the study by Barocelli et al. (7), 2,3-dihydroxypropyl mercapturic acid was detected in urine of rats at a higher percentage than free 3-MCPD, and only traces (<1% of the dose) of β-chlorolactic acid were excreted, suggesting a more important role of the glutathione pathway than previously considered.
Toxicological studies3-MCPD estersIn rats and mice, some 3-MCPD diesters and 3-MCPD sn-1-monoesters are acutely less toxic (oral LD50 values ranging from 1780 to >5000 mg/kg bw, corresponding to 332 to >941 mg/kg bw 3-MCPD equivalents) (8–10) than 3-MCPD (oral LD50 values of 118–291 mg/kg bw) (11, 12). The Committee noted that the differences in acute toxicity were likely due to the lower maximal plasma concentration of 3-MCPD following administration of the 3-MCPD ester.
Short-term oral exposure to 3-MCPD dipalmitate, 3-MCPD dioleate or 3-MCPD monopalmitate revealed the kidney to be the main target organ in rats, with effects generally occurring at doses above 2 mg/kg bw per day expressed as 3-MCPD. Renal effects included increased relative kidney weight; at higher doses, histopathological changes included tubular epithelial hyperplasia, glomerular lesions and accumulation of hyaline casts. Effects on male reproductive organs (increased testis weight, histopathological findings in testes and epididymis) and liver weight increase were generally seen at doses equal to and greater than 30 mg/kg bw per day expressed as 3-MCPD (7, 10, 13). The target organs and relative

93
Contaminants
potencies were in general similar for the 3-MCPD esters 3-MCPD dipalmitate, 3-MCPD monopalmitate and 3-MCPD dioleate in comparison with 3-MCPD, which supports the assumption of substantial hydrolysis of 3-MCPD esters in the gastrointestinal tract to 3-MCPD. No in vitro genotoxicity studies were available. In an in vivo genotoxicity study, 4 weeks of oral exposure (5 days/week gavage dosing) to the 3-MCPD esters 3-MCPD dipalmitate, 3-MCPD monopalmitate and 3-MCPD dioleate and also free 3-MCPD at equimolar doses (40 mg/kg bw per day expressed as 3-MCPD) in transgenic F344 gpt delta rats produced no positive results in the micronucleus assay with bone marrow, the Pig-a mutation assay with red blood cells and the gpt assay in kidney and testis (14).
There were no oral long-term toxicity or developmental toxicity studies identified for any 3-MCPD esters. 3-MCPD dipalmitate administered to male rats at oral doses of 100–200 mg/kg bw per day on 5 consecutive days caused infertility, which was partly reversible. The infertility was described as comparable with that occurring with equimolar doses of 3-MCPD (15).
3-MCPDIn previous 3-MCPD evaluations by the Committee, the 2-year carcinogenicity study in Fischer 344 rats by Sunahara, Perrin & Marchesini (2) (Annex 1, reference 155) was considered the critical study, with kidney identified as the main target organ. A LOEL of 1.1 mg/kg bw per day was identified for renal tubular hyperplasia as the most sensitive end-point. Although the Committee at that meeting noted some increased incidences of benign renal, mammary and testicular tumours, they were considered to be secondary to observed increases in chronic progressive nephropathy and/or endocrine imbalance due to hormonally mediated Leydig cell tumours. In addition, no genotoxic potential has been demonstrated in vivo for 3-MCPD.
New oral studies with 3-MCPD that have become available since the previous evaluation include short-term toxicity studies in mice and rats, long-term toxicity studies in mice and rats and a 26-week carcinogenicity study in transgenic CB6F1 rasH2-Tg mice.
In a short-term oral toxicity study conducted with 3-MCPD in mice, a NOAEL of 18.05 mg/kg bw per day was identified, based on testicular effects (16).
In a short-term oral toxicity study conducted with 3-MCPD in rats, the kidney and the testes were identified as critical target organs. Nephrotoxicity was particularly severe in females, resulting in death due to acute renal failure at 29.5 mg/kg bw per day in 35% of females. Effects observed in both sexes included various histopathological findings in the kidneys (e.g. tubular epithelial hyperplasia, glomerular lesions and accumulation of hyaline casts), which

94
Joint FAO/WHO Expert Committee on Food Additives Eighty-third report W
HO
Tec
hnic
al R
epor
t Ser
ies,
No.
100
2, 2
017
appeared to be mainly restricted to the middle and high doses (7.4 and 29.5 mg/kg bw per day). Testicular effects, including degeneration of seminiferous tubules and decreases in spermatid density, were mainly observed at the highest dose (29.5 mg/kg bw per day) (7). The Committee noted that there were deficiencies in the reporting of this study.
In a 2-year oral (drinking-water) carcinogenicity study in mice, no increases in neoplastic or non-neoplastic lesions were observed up to the highest dose tested, 31.0 mg/kg bw per day (17). There was no significant increase in tumour incidence in a 26-week gavage carcinogenicity study in transgenic CB6F1 rasH2-Tg mice, with a LOAEL of 10 mg/kg bw per day, based on increased relative kidney weight (18).
In a 2-year oral (drinking-water) carcinogenicity study in SD rats, there were dose-related increased incidences of renal nephropathy and tubular hyperplasia, with the hyperplasia more frequently observed in males, being significantly different from controls at all doses (1.97, 8.27 and 29.5 mg/kg bw per day) in males. Atrophy and arteritis/periarteritis in testes were also significantly increased compared with controls at all doses, although not in a dose-related manner. Increased incidences of renal cell tumours (adenoma or carcinoma) in both sexes and of Leydig cell tumours in males were observed, being significantly different from controls at the highest dose (19).
Observations in humansNo clinical or epidemiological studies were identified.
Analytical methods The initial work in the area of 3-MCPD was focused on the determination of the free 3-MCPD or unesterified 3-MCPD. In analysing food for 3-MCPD, there appeared to be 3-MCPD-containing food categories that were unlikely to contain soya sauce or hydrolysed vegetable protein. Subsequent reports indicated that perhaps oils and fats could be a common precursor for this contaminant. Analysis of oils and fats led to confirmation of the presence of variable concentrations of 3-MCPD fatty acid esters in this category. Early method development for oils and fats was hampered by the lack of analytical standards for the large family of possible 3-MCPD monoesters and diesters. This situation has been rectified fairly recently, allowing for method development directed at the measurement of the 3-MCPD esters to commence.
There are two main approaches to 3-MCPD ester analysis, which include (1) the measurement of 3-MCPD esters after individual esters have been converted to MCPD through the cleavage of fatty acid moieties using either acidic or alkaline conditions or using enzymatic cleavage and (2) the measurement of

95
Contaminants
intact MCPD esters. These methods are described as indirect methods and direct methods, respectively (20). 3-MCPD esters are frequently distinguished in the literature from 3-MCPD through reference to bound MCPD (intact 3-MCPD esters) and free 3-MCPD, respectively (20).
The extraction of MCPD esters from homogeneous food samples is performed using solvent to extract the lipid from samples and generally includes the addition of isotopically labelled 3-MCPD analogues to allow for recovery correction during sample preparation. Labelled standards are generally deuterated analogues of free MCPD or MCPD esters, although 13C analogues have been used.
Indirect methods are based on derivatization of the free MCPD using phenylboronic acid and heptafluorobutyrylimidazole, following cleavage of fatty acid methyl esters under acidic or alkaline conditions or via enzymatic cleavage, prior to indirect analysis (20). Analysis is generally performed using GC-MS, although early research into the determination of MCPD was also performed using GC with flame ionization detection and electron capture detection (21).
In contrast, direct measurement allows for analysis of the MCPD esters without the need for derivatization. Two steps of solid-phase extraction are generally used for the cleanup of extracts prior to direct analysis (22). Analysis is performed with LC-MS (23). Until recently, the lack of analytical standards for individual MCPD esters has had an impact on the ability to perform analysis of the esters directly.
3-MCPD LODs reported using indirect methods have ranged widely, with older data collected in the early 2000s having much higher limits (e.g. 5000 µg/kg) than more recently developed data (<10 µg/kg). Direct methods require the determination of an LOD for each of the esters measured, and the LODs can span more than 1 order of magnitude (10–160 µg/kg). A collaborative study was also performed to compare results obtained for MCPD esters in oils using the German Society for Fat Science (DGF) and the SGS Germany GmbH methods, showing that both methods would accurately determine 3-MCPD concentrations in fats and oils, with the assumption that glycidol was the only 3-MCPD-forming substance in the oils (24).
A number of reference methods are available for the measurement of MCPD, including the Association of Official Analytical Chemists’ (AOAC) first action for an official method for the analysis of free 3-MCPD in a variety of foods (25). More recently, the AOCS developed three official methods pertaining to the analysis of MCPD esters exclusively in oils and fats. All three AOCS methods result in the determination of the 2- and 3-MCPD-equivalent concentrations, with a concurrent determination of glycidol-equivalent concentrations (26–28).

96
Joint FAO/WHO Expert Committee on Food Additives Eighty-third report W
HO
Tec
hnic
al R
epor
t Ser
ies,
No.
100
2, 2
017
Sampling protocols Although the Codex Alimentarius Commission has not established specific sampling protocols for MCPD or its esters, general guidelines on sampling have been developed (29). Best practices have been established for numerous contaminants and include the collection of samples by qualified individuals using containers that are clean and non-reactive and that protect samples from contamination or damage during transport and storage. Sampling of commercial food products must ensure that samples collected are representative of the lot. Therefore, collection of multiple samples (incremental samples) from within the lot is recommended and may be used to form an aggregate sample from which laboratory samples may be analysed. Prior to the subsampling for laboratory analysis, homogenization of the aggregate sample should be performed, consistent with good laboratory practices. Sample collection must be focused on food commodities that are relevant to MCPD and MCPD esters (e.g. fats, oils, foods containing these products).
Effects of processing 3-MCPD esters are generated during the refining of crude oils and fats. The formation of 3-MCPD esters in oils has been associated with deodorization using high temperatures (30). Unrefined oils contain a variety of compounds that contribute to the formation of 3-MCPD esters, including acylglycerols, phospholipids, free fatty acids and chlorinated compounds. The details of the implementation of refining practices performed prior to deodorization have a critical impact on 3-MCPD ester formation, as does the temperature at which the deodorization is performed. The preliminary steps in the refining process include degumming or washing, neutralization, bleaching and deodorization (31). The condition of fruit, etc., used for making oils will also have an impact on the levels of 3-MCPD esters, with bruised components contributing to higher levels of these contaminants (32).
Degumming of oils removes phospholipids and is generally performed at relatively low temperatures (80–120 °C). Neutralization of oils involves interaction of the oils with sodium carbonate or bicarbonate to lower the acid value (increase the pH), prior to deodorization. The bleaching process involves exposure of oils to bleaching clays to remove phospholipids from the oils. The final stage of oil refining is known as deodorization, where, in addition to acid treatment, oils are heated at higher temperatures (generally >200 °C). The refining process has been investigated to determine the impact on formation of glycidyl esters and MCPD esters, although the majority of research has focused on the MCPD esters owing to their earlier discovery.
97
Contaminants
It has been reported that palm oil has the highest concentrations of 3-MCPD esters compared with other oil types (e.g. soya bean, rapeseed, sunflower) (33, 34). Palm oil is known not to contain high levels of phospholipids; therefore, the degumming step is often not performed with this oil, or dry degumming (treatment with citric or phosphoric acid) is performed. As a result of the elevated 3-MCPD concentrations in palm oil, palm oil has been the focus of much investigation related to 3-MCPD ester formation and identification of mitigation strategies (35, 36). Other groups have examined seed oils (virgin and refined) as part of their investigation into where 3-MCPD formation is most important.
Unlike the glycidyl esters, formation of 3-MCPD esters is not directly correlated with increased temperature, particularly above 240 °C. 3-MCPD ester formation does occur at temperatures corresponding to the deodorization of oils (generally >200 °C).
Prevention and control Strategies to prevent and control the formation of 3-MCPD esters in oils and fats have been mainly focused on raw material pretreatment, the refining conditions and purification adsorbents. Recent reports indicate that efforts to control the level of 3-MCPD esters in edible oils should begin with the selection and washing of the raw material. In the pretreatment of oilseeds, organic chlorine–containing compounds are considered to be the main donors in the formation of 3-MCPD esters (37). Washing raw material before refining with water or ethanol could remove those critical reactants and reduce 3-MCPD ester-forming capability (38). Another important strategy for the prevention and control of the formation of 3-MCPD esters in oils is the optimization of refining conditions, including water degumming, bleaching additives, steam distillation and thermal treatment. Control of temperature of the steam distillation and neutralization before the deodorization step have the greatest impact on the prevention and control of 3-MCPD ester formation. Dual deodorization using a short first step at a high temperature (250–270 °C) combined with a second longer step at a lower temperature (200 °C) also shows significant reduction of 3-MCPD ester formation. The application of adsorbents and additives, including calcinated zeolite, synthetic magnesium silicate and antioxidants, following deodorization further reduces the formation of 3-MCPD esters. It can be concluded that strategies to prevent and control the formation of 3-MCPD esters in final oil products include:
■ selection of raw material with low precursor content;

98
Joint FAO/WHO Expert Committee on Food Additives Eighty-third report W
HO
Tec
hnic
al R
epor
t Ser
ies,
No.
100
2, 2
017
■ removal of precursors using chemical treatment at mid-range temperatures;
■ deodorization performed with a neutral pH at temperatures <240 °C; ■ adoption of dual deodorization protocols; ■ utilization of adsorbents to remove 3-MCPD esters in post-treatment.
The Committee noted the commitment of the European fats and oils industry trade organization (FEDIOL) to continue to reduce the levels of 3-MCPD esters in refined vegetable oils and encouraged the organization to continue to reduce the levels of these contaminants.
Levels and patterns of contamination in food commodities Vegetable oils and fats are regional in their production and are consumed in relatively higher proportions in the production area than in importing countries (FAOSTAT database: http://www.fao.org/faostat/en/#home). Therefore, it can be seen that palm oil and its products are the major fats consumed in South-east Asia, but less dominant in Europe and North America, whereas soya bean oil is dominant in North and South America, and rapeseed and sunflower seed oils are more common in Europe. The pattern of consumption of individual oils in any finished food is further complicated, as a mixture of oils is often used to give a food a particular texture or structure.
It is apparent that 3-MCPD esters are formed in the processing of vegetable oils mainly during the deodorization step. The extent to which they are formed may depend on the oilseed or fruit being processed and the process being used. Hence, the refined oil obtained from any oil source may vary in 3-MCPD ester content. From reports of the analysis of foodstuffs in a number of countries, it appears that refined vegetable oil is a major contributor to the levels of 3-MCPD esters found in food (3). It should be noted that methods for the analysis of 3-MCPD esters in foods, other than for fats and oils, have not been subjected to full collaborative study, and it is not clear if the same samples were analysed by any of the laboratories involved in the provision of the majority of the results received from the USA, Canada and the European Union in response to the call for data. Although these methods themselves might exhibit reasonable precision for different food types, their accuracy has not been evaluated under rigorous conditions. Recently, a collaborative study has been organized for the analysis of contaminants in high-fat foods (margarines and mayonnaise), but no international work on other food types has been initiated.
Early studies of 3-MCPD esters in retail food products indicated that free 3-MCPD occurred at approximately 9.6–82.7 µg/kg food (39), whereas the levels
99
Contaminants
of 3-MCPD esters (monoesters and diesters) varied between the LOD (1.1 mg/kg fat) and 36.8 mg/kg fat. Foodstuffs of plant origin processed at high temperatures also contained elevated levels of 3-MCPD esters (0.14–6.10 mg/kg), as did coffee surrogates and malts following high-temperature roasting (0.145–1.184 mg/kg and 0.004–0.65 mg/kg, respectively) (40). In contrast, most virgin/unprocessed/unrefined oils do not contain detectable levels of MCPD esters (33, 41). Levels of MCPD esters in toasted unrefined sesame oils found by MacMahon, Begley & Diachenko (42) were comparable with the levels of MCPD esters found in toasted and unrefined sesame oils by Becalski et al. (41), indicating that the roasting process might not be the sole reason for the presence of MCPD esters in processed sesame oils. There appears to be little evidence that further 3-MCPD esters are formed in food during processing or cooking.
Dingel & Matissek (43) indicated that 3-MCPD esters are not formed during the deep frying process, perhaps because of the lower frying temperature used (160–188 °C) or because chlorine-containing compounds were no longer present in the deodorized high-oleic sunflower oil used.
Food consumption and dietary exposure assessment The Committee searched the scientific literature using PubMed and Web of Science to identify estimates of exposure to 3-MCPD, which includes 3-MCPD esters (expressed as 3-MCPD equivalents), free 3-MCPD and total 3-MCPD (i.e. 3-MCPD esters and free 3-MCPD), published from 2012 to 2016. The year 2012 was chosen as the start date owing to concerns about the accuracy of 3-MCPD ester analyses conducted prior to that time and to concerns that analyses of samples collected prior to 2012 may not reflect concentrations of 3-MCPD in products currently on the market. The Committee also estimated exposures to 3-MCPD at the national and international levels based on data submitted to the GEMS/Food contaminants database. It should be noted that the analytical methods underlying some of the 3-MCPD concentration data were not provided and, where known, may not have been among those validated in international collaborative studies. A summary of estimates of 3-MCPD dietary exposure is shown in Table 9.
Published estimates of mean dietary exposure to 3-MCPD esters ranged from 0.2 µg/kg bw per day for adults to 1.3 µg/kg bw per day for children aged 7–10 years (44, 45). Li et al. (45) estimated that adults 18–49 years of age and children 7–10 years of age have 95th percentile dietary exposures to 3-MCPD esters of 2.6 and 3.8 µg/kg bw per day, respectively, based on a probabilistic analysis that combined distributions of food consumption data with distributions of 3-MCPD ester concentrations.

100
Joint FAO/WHO Expert Committee on Food Additives Eighty-third report W
HO
Tec
hnic
al R
epor
t Ser
ies,
No.
100
2, 2
017
Mean and high (95th percentile) dietary exposures to free 3-MCPD were 0.08 and 0.44 µg/kg bw per day, respectively, in the population 10 years and older in Brazil (46).
Published estimates of dietary exposure to total 3-MCPD are limited to those reported by EFSA (3) for Europe. The median of the mean dietary exposures to total 3-MCPD across European surveys ranged from 0.3 μg/kg bw per day for adults and elderly to 0.9 μg/kg bw per day for infants; the median of the high (95th percentile) dietary exposures ranged from 0.6 μg/kg bw per day for adults and elderly to 1.9 μg/kg bw per day for toddlers. For infants exclusively fed infant formula, dietary exposure to 3-MCPD esters was estimated to be 2.4 μg/kg bw per day, based on the mean formula concentration. Exposure was also calculated using the 95th percentile 3-MCPD concentration in formula to capture brand loyalty to products having high concentrations of 3-MCPD esters; this exposure was estimated to be 3.2 μg/kg bw per day.
National estimatesThe Committee estimated national dietary exposures to 3-MCPD esters for Japan and the USA based on concentration data on fats and oils submitted to the GEMS/Food contaminants database and on consumption data from the CIFOCOss database. Estimates of dietary exposure to 3-MCPD esters ranged from 0.1 µg/kg
Table 9Summary of estimates of dietary exposures to 3-MCPD (esters and total)
Source of estimate Population
Range of estimated dietary exposures (µg/kg bw per day)a
Mean consumption High-percentile consumptionb
Mean concentration
95th percentile concentrationc
Mean concentration
95th percentile concentrationc
NationalCommittee and literature Adults 0.2–0.7 0.5–2.6d
Children/adolescents 0.4–1.3 0.8–3.8d
Infantse <1–10 15–21 <1–12 25InternationalCommittee Adultsf 0.2–1.7 0.4–3.4
a Includes LB and UB estimates.b 90th or 95th percentile, depending on the assessment.c The 95th percentile concentration was estimated only where the number of samples was greater than 60.d Upper end of range based on probabilistic assessment that combined distributions of food consumption data with distributions of 3-MCPD ester concentrations.e Includes all estimates for infants from infant and follow-on formula and from mixed diets for 0–12 months of age. Based on data on 3-MCPD ester concentrations in
infant formula from the GEMS/Food contaminants database and the literature.f Per capita estimates based on a body weight of 60 kg.

101
Contaminants
bw per day (mean consumption by the general population, Japan) to 0.6 µg/kg bw per day (90th percentile consumption by children, USA).
The Committee also estimated dietary exposure to 3-MCPD esters for infants exclusively consuming infant formula using GEMS/Food contaminants data and data on infant energy requirements. Mean dietary exposures to 3-MCPD esters from prepared infant formula were estimated for infants in Canada and Japan as 5–7 µg/kg bw per day, depending on age, and in the USA as 7–10 µg/kg bw per day, based on estimated median formula consumption.
Dietary exposure to 3-MCPD esters for young infants was also estimated based on 95th percentile 3-MCPD concentrations to capture brand loyalty to products having high concentrations of 3-MCPD esters. This estimate was possible only for the USA as a result of sample size considerations. These dietary exposures to 3-MCPD for infants in the USA were estimated to be 21 and 25 µg/kg bw per day for median and 95th percentile formula consumption, respectively. The high dietary exposures to 3-MCPD esters estimated for formula-fed infants in the USA are likely due to the inclusion of palm oil and/or palm olein as ingredients in many infant formulas in the USA. No information was available on major oil ingredients in non-USA infant formula samples.
International estimatesThe Committee estimated international per capita dietary exposures to 3-MCPD (esters, free and total) for adults based on concentration data on fats, oils and soya sauce from the GEMS/Food contaminants database and on consumption data from the GEMS/Food cluster diets. 3-MCPD concentration data submitted by Brazil, Canada, China, Japan, Singapore and the USA were used in the analyses; global averages were used in analyses for clusters with no concentration data. Dietary exposures to free 3-MCPD from consumption of hydrolysed vegetable protein were estimated based on assumptions used in the previous JECFA assessment.
International estimates of mean dietary exposure to total 3-MCPD ranged from 0.2 µg/kg bw per day for cluster G14 (Comoros, Fiji, Kiribati, Papua New Guinea, Solomon Islands, Sri Lanka, Vanuatu) to 1.7 µg/kg bw per day for cluster G11 (Belgium, the Netherlands). Dietary exposures at the 90th percentile were estimated to be 0.4–3.4 µg/kg bw per day (Table 9). These exposures largely reflect contributions from fats and oils; free 3-MCPD did not contribute significantly to dietary exposure to total 3-MCPD.
Dose–response analysisThe main target organs for 3-MCPD and its esters in rats and for 3-MCPD in mice were the kidneys and the male reproductive organs. 3-MCPD was carcinogenic

102
Joint FAO/WHO Expert Committee on Food Additives Eighty-third report W
HO
Tec
hnic
al R
epor
t Ser
ies,
No.
100
2, 2
017
in two rat strains, but not in mice. Oral long-term studies on toxicity and carcinogenicity in the F344 rat by Sunahara et al. (2) (previously evaluated by JECFA) and in the SD rat by Cho et al. (19) (new study) were considered the pivotal studies for risk assessment (Table 10), and renal tubular hyperplasia was considered the most sensitive end-point. In accordance with JECFA guidance on dose–response modelling, all models in the USEPA’s BMDS suite (version 2.6.1) were fitted to the data from Sunahara et al. (2) and Cho et al. (19) using the software’s default constraints for restricted models. For the restricted models and the Cho et al. (19) data, the only model having acceptable fit, i.e. P-values greater than 0.1, was the log-logistic model. As a comparison, the BMDL10s were computed from unrestricted models; all of the unrestricted models estimated the BMDL10 at unrealistically low doses. For further comparison, the model-averaging software of Wheeler & Bailer (47), which is available in source code as supplemental material, was used to compute the model-average estimate to compare the estimates based upon the log-logistic model. For this comparison, all models, except the quantal-quadratic, were included in the analysis, and the Bayesian Information Criterion was used to compute the model-average weights. The model-average BMDL10 estimates were close to the values provided by the log-logistic model, which gave support for the use of the log-logistic model. For the two studies using the BMDS suite, the BMD10 estimates for male rats ranged between 1.21 and 4.55 mg/kg bw per day, with 95% BMDL10s ranging between 0.87 and 3.36 mg/kg bw per day. Female rats had a larger range between the two studies. Here, BMD10 estimates ranged between 1.89 and 29.1 mg/kg bw per
Table 10Results of benchmark dose modelling in two studies in rats
Species / study type (route of administration)Reference
Doses (mg/kg bw per day) Critical end-point
BMD10 (mg/kg bw per day)
BMDL10 (mg/kg bw per day)
SD rat, 2-year study of toxicity and carcinogenicity (drinking-water)
Cho et al. (19)
0, 1.97, 8.27, 29.5 Renal tubular hyperplasia
Male
Female
1.21a
1.29b
23.5c
28.0b
0.87a
0.89b
14.4c
20.4b
F344 rat, 2-year study of toxicity and carcinogenicity (drinking-water)
Sunahara et al. (2)
0.11, 1.1, 5.2, 28.3 Renal tubular hyperplasia
Male
Female
1.64a
2.47b
1.89a
1.96b
1.08a
1.74b
1.30a
1.60b
a Restricted log-logistic model.b Model average.c Restricted quantal linear model.

103
Contaminants
day, with 95% BMDL10s ranging between 1.30 and 24.1 mg/kg bw per day. For the assessment, the lowest BMDL10 was 0.87 mg/kg bw per day for renal tubular hyperplasia in male rats from the Cho et al. (19) study using the restricted log-logistic model.
Evaluation Experimental evidence indicates that 3-MCPD esters are substantially hydrolysed to 3-MCPD in the gastrointestinal tract and elicit toxicity as free 3-MCPD. The Committee therefore based its evaluation on the conservative assumption of complete hydrolysis of 3-MCPD esters to 3-MCPD. Whereas the experimental data supporting substantial hydrolysis are derived from studies with post-weaning animals, the Committee concluded that the capacity of the neonate to hydrolyse fatty acids in the gut is efficient, and therefore the same assumption of substantial hydrolysis could be extended to this age group.
The main target organs for 3-MCPD and its esters in rats and for 3-MCPD in mice are the kidneys and the male reproductive organs. 3-MCPD was carcinogenic in two rat strains, but not in mice. No genotoxic potential has been demonstrated in vivo for 3-MCPD. Two long-term carcinogenicity studies with 3-MCPD in rats were identified as pivotal studies, and renal tubular hyperplasia was identified as the most sensitive end-point (2, 19). The lowest BMDL10 for renal tubular hyperplasia was calculated to be 0.87 mg/kg bw per day for male rats (19). After application of a 200-fold uncertainty factor, the Committee established a group PMTDI of 4 µg/kg bw for 3-MCPD and 3-MCPD esters, singly or in combination, expressed as 3-MCPD equivalents (rounded to one significant figure). The overall uncertainty factor of 200 incorporates a factor of 2 related to the inadequacies in the studies of reproductive toxicity.
The previous PMTDI of 2 μg/kg bw for 3-MCPD, established at the fifty-seventh meeting and retained at the sixty-seventh meeting, was withdrawn. The Committee noted that there are no published collaboratively studied methods for the determination of 3-MCPD esters in complex foods in contrast to the situation with fats and oils; therefore, caution should be applied when interpreting analytical data from complex foods. The Committee further noted that there was uncertainty in comparing the reported levels in the same foods from different regions because of the lack of interlaboratory comparisons and the absence of data arising from proficiency testing schemes.
The Committee noted that estimated dietary exposures to 3-MCPD for the general population, even for high consumers (up to 3.8 µg/kg bw per day), did not exceed the new PMTDI. Estimates of mean dietary exposure to 3-MCPD
104
Joint FAO/WHO Expert Committee on Food Additives Eighty-third report W
HO
Tec
hnic
al R
epor
t Ser
ies,
No.
100
2, 2
017
for formula-fed infants, however, could exceed the PMTDI by up to 2.5-fold for certain countries (e.g. 10 μg/kg bw per day in the first month of life).
Although the current evaluation was specific to the request for an evaluation of 3-MCPD esters, the Committee was aware that 2-MCPD esters can be detected in some of the same foods as 3-MCPD esters. There are, however, currently limited food occurrence data available for 2-MCPD and 2-MCPD esters in the GEMS/Food contaminants database, and the toxicological database is currently insufficient to allow a hazard characterization.
RecommendationsThe Committee recommends that appropriate efforts to reduce concentrations of 3-MCPD esters and 3-MCPD in infant formula continue to be implemented.
The Committee recommends that additional international collaborative studies should be undertaken on methods of analysis for 3-MCPD esters in relevant fat- or oil-containing foods in order to remove the uncertainty surrounding the accuracy of the data submitted to the GEMS/Food contaminants database for use in future evaluations. To address the uncertainty associated with reproductive effects, experimental studies would be required to elucidate the potential reproductive toxicity of 3-MCPD esters, including exposure of newborns.
A monograph on 3-MCPD esters, including an update on 3-MCPD since the last JECFA evaluation, was prepared.
References 1. Weisshaar R. 3-MCPD-esters in edible fats and oils – a new and worldwide problem. Eur J Lipid Sci Technol. 2008;110:671–2.2. Sunahara G, Perrin I, Marchesini M. Carcinogenicity study on 3-monochloropropane-1,2-diol (3-MCPD) administered
in drinking water to Fischer 344 rats. Unpublished report no. RE-SR93003 submitted to WHO by Nestec Ltd, Research & Development, Switzerland; 1993.
3. European Food Safety Authority Panel on Contaminants in the Food Chain (CONTAM). Scientific opinion on the risks for human health related to the presence of 3- and 2-monochloropropanediol (MCPD), and their fatty acid esters, and glycidyl fatty acid esters in food. EFSA J. 2016;14:159.
4. Seefelder W, Varga N, Studer A, Williamson G, Scanlan FP, Stadler RH. Esters of 3-chloro-1,2-propanediol (3-MCPD) in vegetable oils: significance in the formation of 3-MCPD. Food Addit Contam Part A Chem Anal Control Expo Risk Assess. 2008;25:391–400.
5. Kaze N, Watanabe Y, Sato H, Murota K, Kotaniguchi M, Yamamoto H et al. Estimation of the intestinal absorption and metabolism behaviors of 2- and 3-monochloropropanediol esters. Lipids. 2016;51:913–22.
6. Abraham K, Appel KE, Berger-Preiss E, Apel E, Gerling S, Mielke H et al. Relative oral bioavailability of 3-MCPD from 3-MCPD fatty acid esters in rats. Arch Toxicol. 2013;87:649–59.
7. Barocelli E, Corradi A, Mutti A, Petronini PG. Comparison between 3-MCPD and its palmitic esters in a 90-day toxicology study. EFSA Supporting Publications. 2011;8(9):1–131 (CFP/EFSA/CONTAM/2009/01).
8. Liu M, Gao BY, Qin F, Wu PP, Shi HM, Luo W et al. Acute oral toxicity of 3-MCPD mono- and di-palmitic esters in Swiss mice and their cytotoxicity in NRK-52E rat kidney cells. Food Chem Toxicol. 2012;50:3785–91.

105
Contaminants
9. Liu M, Liu J, Wu Y, Gao B, Wu P, Shi H et al. Preparation of five 3-MCPD fatty acid esters, and the effects of their chemical structures on acute oral toxicity in Swiss mice. J Sci Food Agric. 2017;97(3):841–8.
10. Li J, Wang S, Wang M, Shi W, Du X, Sun C. The toxicity of 3-chloropropane-1,2-dipalmitate in Wistar rats and a metabonomics analysis of rat urine by ultra-performance liquid chromatography–mass spectrometry. Chem Biol Interact. 2013;206:337–45.
11. Qian G, Zhang H, Zhang G, Yin L. [Study on acute toxicity of R, S and (R,S)-3-monchloropropane-1,2-diol.] Wei Sheng Yan Jiu. 2007;36:137–40 (in Chinese).
12. Ericsson RJ, Baker VF. Male antifertility compounds: biological properties of U-5897 and U-15,646. J Reprod Fertil. 1970;21:267–73.
13. Onami S, Cho YM, Toyoda T, Mizuta Y, Yoshida M, Nishikawa A et al. A 13-week repeated dose study of three 3-monochloropropane-1,2-diol fatty acid esters in F344 rats. Arch Toxicol. 2014;88:871–80.
14. Onami S, Cho YM, Toyoda T, Horibata K, Ishii Y, Umemura T et al. Absence of in vivo genotoxicity of 3-monochloropropane-1,2-diol and associated fatty acid esters in a 4-week comprehensive toxicity study using F344 gpt delta rats. Mutagenesis. 2014;29:295–302.
15. Rooney FR, Jackson H. The contraceptive action of aliphatic diesters of alpha chlorohydrin in male rats. IRCS Med Sci Libr Compend. 1980;8(1):65.
16. Cho WS, Han BS, Lee H, Kim C, Nam KT, Park K et al. Subchronic toxicity study of 3-monochloropropane-1,2-diol administered by drinking water to B6C3F1 mice. Food Chem Toxicol. 2008;46:1666–73.
17. Jeong JB, Han S, Cho WS, Choi M, Ha CS, Lee BS et al. Carcinogenicity study of 3-monochloropropane-1,2-diol (3-MCPD) administered by drinking water to B6C3F1 mice showed no carcinogenic potential. Arch Toxicol. 2010;84:719–29.
18. Lee BS, Park SJ, Kim YB, Han JS, Jeong EJ, Son HY et al. Twenty-six-week oral carcinogenicity study of 3-monochloropropane-1,2-diol in CB6F1-rasH2 transgenic mice. Arch Toxicol. 2017;91(1):453–64.
19. Cho WS, Han BS, Nam KT, Park K, Choi M, Kim SH et al. Carcinogenicity study of 3-monochloropropane-1,2-diol in Sprague-Dawley rats. Food Chem Toxicol. 2008;46:3172–7.
20. Crews C, Chiodini A, Granvogl M, Hamlet C, Hrnčiřík K, Kuhlmann J et al. Analytical approaches for MCPD esters and glycidyl esters in food and biological samples: a review and future perspectives. Food Addit Contam Part A Chem Anal Control Expo Risk Assess. 2013;30(1):11–45.
21. Wenzl T, Lachenmeier DW, Gökmen V. Analysis of heat-induced contaminants (acrylamide, chloropropanols and furan) in carbohydrate-rich food. Anal Bioanal Chem. 2007;389(1):119–37.
22. Dubois M, Tarres A, Goldmann T, Empl AM, Donaubauer A, Seefelder W. Comparison of indirect and direct quantification of esters of monochloropropanediol in vegetable oil. J Chromatogr A. 2012;1236:189–201.
23. MacMahon S, Ridge CD, Begley TH. Liquid chromatography–tandem mass spectrometry (LC-MS/MS) method for the direct detection of 2-monochloropropanediol (2-MCPD) esters in edible oils. J Agric Food Chem. 2014;62(48):11647–56.
24. Fiebig H-J. Determination of ester-bound 3-chloro-1,2-propanediol and glycidol in fats and oils – a collaborative study. Eur J Lipid Sci Technol. 2011;113(3):393–9.
25. 48.1.06. AOAC Official Method 2000.01. 3-Chloro-1,2-propanediol in foods and food ingredients. Gas chromatography/mass spectrometric detection. First Action 2000. AOAC International; 2005.
26. AOCS Official Method Cd 29a-13. 2- and 3-MCPD fatty acid esters and glycidol fatty acid esters in edible oils and fats by acid transesterification. American Oil Chemists’ Society; 2013:1–18.
27. AOCS Official Method Cd 29b-13. Determination of bound monochloropropanediol- (MCPD-) and bound 2,3-epoxy-1-propanol (glycidol-) by gas chromatography/mass spectrometry (GC/MS). American Oil Chemists’ Society; 2013:1–14.
28. AOCS Official Method Cd 29c-13. Fatty-acid-bound 3-chloropropane-1,2-diol (3-MCPD) and 2,3-epoxi-propane-1-ol (glycidol), determination in oils and fats by GC/MS (differential measurement). American Oil Chemists’ Society; 2013:1–13.
29. General guidelines on sampling. Rome: Food and Agriculture Organization of the United Nations, Joint FAO/WHO Food Standards Programme, Codex Alimentarius Commission; 2004 (CAC/GC-50-2004).
30. Šmidrkal J, Tesařová M, Hrádková I, Berčíková M, Adamčíková A, Filip V. Mechanism of formation of 3-chloropropan-1,2-diol (3-MCPD) esters under conditions of the vegetable oil refining. Food Chem. 2016;211:124–9.
31. Pudel F, Benecke P, Fehling P, Freudenstein A, Matthäus B, Schwaf A. On the necessity of edible oil refining and possible sources of 3-MCPD and glycidyl esters. Eur J Lipid Sci Technol. 2011;113:368–73.
32. Gibon V, De Greyt W, Kellens M. Palm oil refining. Eur J Lipid Sci Technol. 2007;109:315–35.

106
Joint FAO/WHO Expert Committee on Food Additives Eighty-third report W
HO
Tec
hnic
al R
epor
t Ser
ies,
No.
100
2, 2
017
33. Kuhlmann J. Determination of bound 2,3-epoxy-1-propanol (glycidol) and bound monochloropropanediol (MCPD) in refined oils. Eur J Lipid Sci Technol. 2011;113(3):335–44.
34. Weisshaar R. Fatty acid esters of 3-MCPD: overview of occurrence and exposure estimates. Eur J Lipid Sci Technol. 2011;113(3):304–8.
35. Destaillats F, Craft BD, Sandoz L, Nagy K. Formation mechanisms of monochloropropanediol (MCPD) fatty acid diesters in refined palm (Elaeis guineensis) oil and related fractions. Food Addit Contam Part A Chem Anal Control Expo Risk Assess. 2012;29(1):29–37.
36. Matthäus B, Pudel F. Chapter 2. Mitigation of MCPD and glycidyl esters in edible oils. In: Processing contaminants in edible oils: MCPD and glycidyl esters. American Oil Chemists’ Society; 2014:23–55.
37. Matthäus B, Pudel F, Fehling P, Vosmann K, Freudenstein A. Strategies for the reduction of 3-MCPD esters and related compounds in vegetable oils. Eur J Lipid Sci Technol. 2011;113(3):380–6.
38. Li C, Jia H, Wang Y, Shen M, Nie S, Xie M. Determination of 3-monochloropropane-1,2-diol esters in edible oil – method validation and estimation of measurement uncertainty. Food Anal Meth. 2016;9(4):845–55.
39. Svejkovká B, Novotný O, Divinová V, Réblová Z, Doležal M, Velíšek J. Esters of 3-chloropropane-1,2-diol in foodstuffs. Czech J Food Sci. 2004;22:190–6.
40. Divinová V, Dolezal M, Velisek J. Free and bound 3-chloropropane-1,2-diol in coffee surrogates and malts. Czech J Food Sci. 2007;25:39–47.
41. Becalski A, Feng S, Lau BPY, Zhao T. A pilot survey of 2- and 3-monochloropropanediol and glycidol fatty acid esters in foods on the Canadian market 2011–2013. J Food Comp Anal. 2015;37:58–66.
42. MacMahon S, Begley TH, Diachenko GW. Occurrence of 3-MCPD and glycidyl esters in edible oils in the United States. Food Addit Contam Part A Chem Anal Control Expo Risk Assess. 2013;30(12):2081–92.
43. Dingel A, Matissek R. Esters of 3-monochloropropane-1,2-diol and glycidol: no formation by deep frying during large-scale production of potato crisps. Eur Food Res Technol. 2015;241(5):719–23.
44. Chung HY, Chung SWC, Chan BTPP, Ho YY, Xiao Y. Dietary exposure to Hong Kong adults to fatty acid esters of 3-monochloropropane-1,2-diol. Food Addit Contam Part A Chem Anal Control Expo Risk Assess. 2013;30:1508–12.
45. Li C, Nie S-P, Zhou Y-Q, Xie MY. Exposure assessment of 3-monochloropropane-1,2-diol esters from edible oils and fats in China. Food Chem Toxicol. 2015;75:8–13.
46. Arisseto AP, Vicente E, Furlani RPZ, Toledo MC de F. Estimate of dietary intake of chloropropanols (3-MCPD and 1,3-DCP) and health risk assessment. Ciênc Tecnol Aliment Campinas. 2013;33(Suppl 1):125–33.
47. Wheeler MW, Bailer AJ. Model averaging software for dichotomous dose response risk estimation. J Stat Softw. 2008;26:1–15.
3.6 SterigmatocystinExplanation Sterigmatocystin is a toxic fungal secondary metabolite (mycotoxin) that is mainly produced by more than a dozen species of Aspergillus as well as by a number of phylogenetically and phenotypically different fungal genera (1–3). It is a polyketide-derived mycotoxin with CAS No. 10048-13-2 and International Union of Pure and Applied Chemistry (IUPAC) name (3aR,12cS)-8-hydroxy-6-methoxy-3a,12c-dihydro-7H-furo[3′,2′:4,5]furo[2,3-c]xanthen-7-one.
Human and animal exposure can occur if there is contamination of food or feed by a sterigmatocystin-producing fungus. Sterigmatocystin contamination mainly takes place during storage and has been reported in foods such as cheese

107
Contaminants
and beer (4), peanuts (5), crisp bread, rye wholemeal, white bread and muesli (6), rice (7) and chilli (8) and in feed (9, 10).
Structurally, sterigmatocystin is closely related to aflatoxins (Fig. 7). Sterigmatocystin is an intermediate in the biosynthetic pathway for aflatoxins (11, 12). Aspergillus versicolor and A. nidulans do not contain the enzymes necessary for the conversion of sterigmatocystin into aflatoxin (13). Only a few examples of co-occurrence with other mycotoxins, principally AFB1, have been reported in the literature (8, 14, 15).
Sterigmatocystin has not previously been evaluated by JECFA. The Committee reviewed sterigmatocystin at the present meeting at the request of CCCF.
The literature search for biological data was built on the review conducted by EFSA (16), updated by papers published after 2011. The search was performed in PubMed and Scopus. The literature search on the occurrence of and dietary exposure to sterigmatocystin was run using three databases (Scopus, PubMed and Ovid) and a cut-off date of 2000.
Biochemical aspectsIn animal studies, the absorption of [14C]sterigmatocystin administered orally could be as high as 77–100% in adult rats (18) and 85% in vervet monkeys (19). In rats, peak plasma levels were reached between 3 and 12 hours after oral administration, with a plasma half-life of 61–130 hours; about 10% of an
Fig. 7 Biosynthesis of aflatoxins from sterigmatocystin (adapted from (7))
G1
B1
STC OMSTC AFL
STC: sterigmatocystinOMSTC: O-methyl sterigmatocystinAFL: aflatoxin
CH3
CH3
CH3
OH
CH3CH3
CH3

108
Joint FAO/WHO Expert Committee on Food Additives Eighty-third report W
HO
Tec
hnic
al R
epor
t Ser
ies,
No.
100
2, 2
017
administered dose was eliminated in the urine, and 64–92% in the faeces (18). The half-life of excretion was 44 hours (20). In the vervet monkey, 70% of an oral dose was excreted unchanged in the faeces, 15% was eliminated in the urine and 4.5% was eliminated in the bile as sterigmatocystin glucuronide (19, 21).
The structures of phase I metabolites observed in vitro have not been completely identified, and there is no consensus in the literature about the pathways of metabolism. As sterigmatocystin forms DNA adducts and is structurally related to aflatoxins, some authors have speculated that a transient reactive epoxide, exo-sterigmatocystin-1,2-oxide, may be formed (22–25), but this is not supported by others (26, 27). Regarding phase II metabolites, in vivo studies in rats and vervet monkeys identified a glucuronide conjugate as the major metabolite in urine, and no sulfate conjugates were observed (19, 21, 28). In vitro studies also reported the formation of a glucuronide conjugate (24, 25).
Toxicological studiesIn acute toxicity tests, oral LD50 values for purified sterigmatocystin in rats were 120 mg/kg bw and above (29). The main target organs for acute toxicity in both rat and vervet monkey following acute oral and intraperitoneal dosing were the liver and kidney, which showed haemorrhage and necrosis in both species, with bile duct proliferation in the vervet monkey (29, 30).
Short-term toxicity studies confirm that the liver is the main target organ for the toxicity of sterigmatocystin (31–34). In the rat, a dose of purified sterigmatocystin equivalent to 5–10 mg/kg bw per day administered in the feed for 2–16 weeks caused extensive histopathological changes in the liver, leading to necrosis; hyperplastic nodules and bile duct proliferation were observed (32). A lower dose of sterigmatocystin of 0.2 mg/kg bw per day given in the diet (contaminated with A. versicolor) for 30 days also led to necrosis of the liver and caused depletion of cellular antioxidants and generation of reactive oxygen species, resulting in lipid peroxidation (34). Guinea-pigs given sterigmatocystin in capsules for 2 weeks at 4.2 mg/animal per day also showed extensive liver damage (33). Vervet monkeys given sterigmatocystin by intragastric administration at a dose of 20 mg/kg bw per day every 2 weeks for 12 months showed progressive necrotic liver changes and chronic hepatitis, culminating in large hyperplastic nodules with pleomorphic nuclei (31).
In long-term studies, sterigmatocystin was carcinogenic after oral administration in mice (35, 36), rats (37–40) and monkeys (species not specified) (41). Sterigmatocystin was also carcinogenic in experimental animals after intraperitoneal, subcutaneous or dermal administration (42–45).
Mice fed intermittently (2 weeks on, 2 weeks off) for up to 58 weeks with a diet containing sterigmatocystin (commercial or from mouldy rice

109
Contaminants
contaminated with A. versicolor) at a dose equivalent to 0.75 mg/kg bw per day showed increased incidences of pulmonary adenomas and adenocarcinomas in both males and females, with both forms of sterigmatocystin (35). Mice given purified sterigmatocystin in the diet at doses equivalent to 4.5 and 18 mg/kg bw per day for up to 55 weeks showed low incidences of hepatocellular adenoma and hepatocellular carcinoma, but high incidences of haemangioendotheliomas, hepatic angiosarcomas and brown fat angiosarcomas (36). The Committee noted that the results of this study show that sterigmatocystin has two targets for carcinogenicity – namely, the hepatocytes and the blood vessels.
Wistar-derived male and female rats were given purified sterigmatocystin for 52 weeks at a dose of 0.15, 0.3 or 1.5 mg/rat by gavage, 5 days a week, or continuously in the diet at doses equivalent to 0.5, 1 and 5 mg/kg bw per day for the first 6 months, increasing to 0.75, 1.5 and 7.5 mg/kg bw per day for the second 6 months. There was a high incidence of mortality in the high-dose dietary group. Hepatocellular carcinomas were seen at all doses with both methods of administration in 40–100% of survivors, with a clear dose–response relationship in the groups dosed by gavage (37). In another study in male Wistar rats given purified sterigmatocystin in the diet at a dose equivalent to 0.5 mg/kg bw per day for 54 weeks, 53% developed hepatocellular carcinomas (38).
In male Donryu rats exposed to sterigmatocystin for up to 101 weeks from feed to which mouldy rice contaminated with A. versicolor was added, giving doses equivalent to 0.25 and 0.5 mg/kg bw per day, a high proportion of test animals died as a result of infection. In the survivors, the incidence of hepatocellular carcinomas was 85% and 92% in the low- and high-dose groups, respectively (39).
In male ACI/N rats given purified sterigmatocystin in the diet for more than 2 years at a dose equivalent to 0.005, 0.05 or 0.5 mg/kg bw per day, tumours in the liver, testis, adrenal gland and 12 other sites were found. The overall incidence of tumours of all types combined did not show a dose–response relationship, but the incidence of liver tumours was dose related (0/11, 0/27, 1/29 and 5/26 in control, low-dose, mid-dose and high-dose groups). One animal in the mid-dose group had a liver haemangiosarcoma; three animals in the high-dose group had haemangiosarcoma, and one had hepatocellular carcinoma. The Committee noted that the authors stated that there were five liver tumours in total in the highest-dose group, but the breakdown of the histological types accounts for only four tumours. There were clear dose–response relationships for other non-neoplastic histopathological changes in the liver, including central necrosis (2/11, 7/27, 14/29 and 16/26 in control, low-dose, mid-dose and high-dose groups), hyperplastic foci or areas of hepatocellular alteration (1/11, 4/27, 9/29 and 21/26 in control, low-dose, mid-dose and high-dose groups) and hyperplastic nodules (0/11, 0/27, 0/29 and 3/26 in control, low-dose, mid-dose and high-dose groups)

110
Joint FAO/WHO Expert Committee on Food Additives Eighty-third report W
HO
Tec
hnic
al R
epor
t Ser
ies,
No.
100
2, 2
017
described by the authors as benign hepatic cell tumours (40). Although not all such lesions are preneoplastic and such lesions do not necessarily progress to carcinomas, hyperplastic foci and hyperplastic nodules are known to be increased in incidence after administration of hepatocarcinogens (46, 47).
In 30 monkeys (species not specified) treated orally once a week with sterigmatocystin at either 1.0 or 2.0 mg/kg bw (equivalent to 0.14 and 0.29 mg/kg bw per day) for about 18 years, 33% of treated monkeys developed one or more hepatic tumours. Five animals in each dose group developed hepatic tumours; in total across the two dose groups, there were seven hepatocellular carcinomas, two cholangiocarcinomas and one cholangiosarcoma. One monkey developed a renal cell carcinoma. The incidence of tumours in each dose group was not given (41).
Although there are a number of long-term studies in rodents, the majority of them have limitations with regard to their utility for risk assessment owing to small numbers of animals, use of only one sex, use of only one or two doses, less than lifetime durations of exposure, or use of fungal preparations or mouldy feed as test material in which other mycotoxins were likely to be present. It should be noted that the study by Maekawa et al. (40) also has limitations (e.g. brief reporting, only male rats used, small control group, dosing not commencing until 11 weeks of age, and a discrepancy between the total numbers of liver tumours given in tables), but the Committee considered that it was the only study with data that are appropriate for dose–response analysis.
The Committee noted that the rat strain used in the Maekawa et al. (40) study, ACI/N, did not appear to be as responsive as other strains tested in terms of the induction of hepatocellular tumours. Comparing the results from dietary administration of sterigmatocystin, Purchase & van der Watt (37) reported that 8/9 Wistar-derived rats developed hepatocellular carcinoma at the lowest dose tested of 0.5–0.75 mg/kg bw per day for 52 weeks, Terao, Aikawa & Kera (38) reported that 8/14 Wistar rats developed hepatocellular carcinoma at the only dose tested of 0.5 mg/kg bw per day for 54 weeks, and Ohtsubo, Saito & Kimura (39) reported that 11/13 Donryu rats developed hepatocellular carcinoma at the lowest dose tested of 0.25 mg/kg bw per day for up to 101 weeks. By contrast, in the study of Maekawa et al. (40), only 1/26 ACI/N rats developed hepatocellular carcinoma at the highest dose tested of 0.5 mg/kg bw per day for up to 122 weeks, with slightly more hepatic haemangiosarcomas (3/26 and 1/29 in the high- and mid-dose groups, respectively). ACI/N rats also developed proportionately more haemangiosarcomas than hepatocellular carcinomas, which is the opposite of the reported findings in the other two strains.
Extensive in vitro studies on the genotoxicity of sterigmatocystin are available, and almost all tests give positive results. Sterigmatocystin is mutagenic in vitro in bacterial cells after metabolic activation (48–56) and in mammalian cells (57–60). It induces chromosomal aberrations, micronuclei and chromosome

111
Contaminants
damage (sister chromatid exchange, unscheduled DNA synthesis, comet assay) in vitro in mammalian cells, including human cells (54, 57, 61–72). In vivo, it causes chromosomal aberrations in rats, chromosomal aberrations and micronuclei in fish, and chromosome damage (sister chromatid exchange) in mice (73–75).
Sterigmatocystin forms guanyl-N7 adducts in vitro with calf thymus DNA in the presence of rat or human liver microsomes (22, 56) and forms dose-related DNA adducts in rat liver in vivo after intraperitoneal administration (76, 77).
Taking account of the available information on genotoxicity, carcinogenicity and DNA adduct formation, the Committee concluded that sterigmatocystin is genotoxic and carcinogenic.
Studies on immunotoxic effects suggest that sterigmatocystin may have immunomodulatory activity (16, 33, 78–81). However, firm conclusions cannot be drawn, because the in vivo data are difficult to interpret as specific immunotoxic effects, whereas the relevance of the in vitro data is difficult to interpret, because these experiments were conducted with rather high concentrations of sterigmatocystin.
There are no data on the reproductive or developmental toxicity of sterigmatocystin in mammalian species.
Sterigmatocystin and aflatoxin B1
Compared with AFB1, the acute oral toxicity (LD50) of sterigmatocystin in rats is 10 or more times lower (29, 82).
In a short-term toxicity study in which sterigmatocystin was administered orally to rats for up to 16 weeks with interim kills, there were extensive histopathological changes in the liver leading to necrosis, but the study authors noted that bile duct proliferation did not progress beyond that seen after 8 weeks of exposure and was not nearly as extensive as that following aflatoxin (probably AFB1) treatment (32).
The carcinogenic potency of sterigmatocystin relative to that of aflatoxin (probably AFB1) has been considered by Purchase & van der Watt (37). In their studies on Wistar-derived rats, administration of 105 µg of aflatoxin per week for 50 weeks resulted in 6/7 rats (86%) developing hepatomas in 80 weeks; in comparison, 60% or 80% of rats receiving 750 or 1500 µg sterigmatocystin per week, respectively, for 52 weeks developed tumours or hyperplastic nodules by week 123. From these data, Purchase & van der Watt (37) estimated that aflatoxin is “no more than 10 times” as potent as sterigmatocystin. The authors also noted the virtual absence of bile duct proliferation and complete absence of cholangiocarcinomas after sterigmatocystin administration, in contrast to the

112
Joint FAO/WHO Expert Committee on Food Additives Eighty-third report W
HO
Tec
hnic
al R
epor
t Ser
ies,
No.
100
2, 2
017
extensive bile duct reaction produced by aflatoxin. There have been no studies in which purified AFB1 and sterigmatocystin have been given in combination.
Regarding genotoxicity, sterigmatocystin was found to be less mutagenic than AFB1 in bacterial cells in the presence of metabolic activation (48–54). However, inconsistent results were obtained in bacterial cells using human liver extract for metabolic activation, sometimes showing less and sometimes more mutagenicity (50). In mouse hepatocytes, induction of unscheduled DNA synthesis was higher for AFB1 than for sterigmatocystin (54, 62). However, in human skin fibroblasts, the induction of unscheduled DNA synthesis with sterigmatocystin was higher than with AFB1, with or without metabolic activation (61). In a mouse mammary carcinoma cell line, the induction of 8-azaguanine-resistant mutations and the level of chromosomal aberrations were higher for sterigmatocystin than for AFB1 (57).
Observations in domestic animals/veterinary toxicologyIn dairy cattle, a case of poisoning in a farm in the USA has been reported in relation to feed contamination by several fungal strains, dominated by A. versicolor and A. candidus. The concentration of sterigmatocystin was 7.75 mg/kg feed. The animals exhibited bloody diarrhoea, loss of milk production and death in some cases (83).
Observations in humansStudies in China have suggested that there is a correlation between exposure to sterigmatocystin (contamination rate and content in grains) and the prevalence of stomach and liver cancers (84). A clinical study in China detected sterigmatocystin in the blood of 4/13 patients with liver and stomach cancer (range 65–113 μg/kg) and in 1/14 healthy persons (68 μg/kg), but sterigmatocystin concentrations in the urine were all below the LOD. Sterigmatocystin–DNA adducts were found in 50% of sampled tissues of tumours from 12 patients (85).
Analytical methods Screening tests for sterigmatocystin include TLC and rapid test kits based on antibodies. Prior to the mid-1990s, only a very limited number of research papers had been published on the screening of sterigmatocystin using qualitative and semiquantitative methods. ELISA or immunochromatographic devices as screening tests for mycotoxins are commercially available, but few are suitable to screen for sterigmatocystin in food. Positive results should be confirmed with specific and quantitative methods.
Analytical methods for the determination of sterigmatocystin in foodstuffs include TLC, GC, GC-MS, HPLC with ultraviolet (UV) detection,

113
Contaminants
HPLC with fluorescence detection, LC-MS, LC-MS/MS and ELISA; however, methods published in the scientific literature in recent years indicate that LC-MS/MS is a fast, accurate and reproducible technique for the detection and quantification of sterigmatocystin in foods and feeds (86, 87). Chromatographic methods with an LOQ of 2 µg/kg for sterigmatocystin have been developed and validated (88, 89). Further advances in the analysis of sterigmatocystin have been achieved by application of multi-mycotoxin analysis using LC-MS/MS (90, 91).
Yao et al. (92) developed a biosensor constructed by multi-walled carbon nanotubes for the detection of sterigmatocystin. Chen et al. (93) also developed a rapid and highly sensitive electrochemical biosensor for the detection of sterigmatocystin based on an enzyme, aflatoxin oxidase.
Real-time quantitative polymerase chain reaction (qPCR) methods have been proposed to quantify sterigmatocystin-producing fungi in foods with a minimum LOD of 10 colony-forming units per gram. It had been reported that the qPCR method would be useful for monitoring sterigmatocystin-producing fungi in hazard analysis and critical control point (HACCP) programmes to prevent accumulation of the toxin in foods during storage and processing.
No certified reference materials are available for the determination of sterigmatocystin in food matrices. Furthermore, no proficiency tests or quality assurance interlaboratory schemes for the analysis of sterigmatocystin in food or feed have been identified.
Sampling protocols An effective sampling protocol is a prerequisite for the control of mycotoxins in food and feed. Although no sampling protocols specific to sterigmatocystin were found, there are some generic guidelines on sampling of mycotoxins available. The FAO sampling tool on sampling protocols, developed for both food analysts and regulatory officials, can be used (94), and there are sampling protocols available from the Codex Alimentarius Commission’s standard CODEX STAN 193-1995 (95). Furthermore, the European Commission has sampling protocols for the purpose of official control of the levels of mycotoxins in foodstuffs, as described in Regulation (EC) No 401/2006 and its amendments (96).
Effects of processing Cleaning methods such as sieving fines or broken kernels from bulk materials and sorting, by physically removing contaminated kernels, have been shown to reduce mycotoxins; however, there is no information on such processes for the reduction of sterigmatocystin in food commodities. Milling and baking processes have been reported to decrease sterigmatocystin levels. Roasting of coffee beans at 200 °C for 20 minutes reduced the concentration of added sterigmatocystin by

114
Joint FAO/WHO Expert Committee on Food Additives Eighty-third report W
HO
Tec
hnic
al R
epor
t Ser
ies,
No.
100
2, 2
017
68% under laboratory conditions (97). Sterigmatocystin levels were reported to decrease during food fermentation and in cheese making; a report showed 80% reduction of sterigmatocystin in the curd and 20% in the whey, indicating low solubility of the toxin in aqueous media. Sterigmatocystin has also been reported in beer, which indicates that the toxin can survive the brewing process (90).
Food processing, such as milling, roasting, bread making, cheese making and fermentation, can result in decreased levels of sterigmatocystin in foods; however, the extent of decrease depends on the type of food and processing conditions.
Prevention and control Sterigmatocystin is produced during storage of food and feed, which means that prevention and control will focus on postharvest measures. However, specific management and control measures to prevent sterigmatocystin in food and feed were not identified. It is assumed that most of the strategies focusing on prevention of aflatoxin contamination postharvest may also be relevant for sterigmatocystin, as these two mycotoxins have a common biosynthetic pathway.
Several in vitro studies reported on prevention of fungal growth or production of sterigmatocystin by, for example, extracts of oregano, African pencil-cedar, tomato, onions and garlic (98–101).
The most important postharvest measure to prevent sterigmatocystin contamination is management of storage conditions. It was reported that storing grains at controlled temperature and water activity with elevated carbon dioxide and low oxygen concentrations resulted in no observable growth of or sterigmatocystin production by A. flavus and A. parasiticus (102).
Also, no mycelial growth or sterigmatocystin production was detected after gamma irradiation of A. versicolor in vitro (103), and irradiation was shown to eliminate the occurrence of the fungus and toxin in dairy cattle feed (104).
Levels and patterns of contamination in food commodities In total, 4419 data on sterigmatocystin occurrence were reported in the GEMS/Food contaminants database, with 94% censorship globally. The only food commodity analysed is cereals and cereal-based foods. Africa is the region that contributes the most positive data, with 21% positive samples, all being sorghum; 10% of the positive samples had concentrations in excess of 100 µg/kg. Data from the other WHO regions show lower prevalence: 1.75% for the Americas, 0% (0/51 food samples) for the Western Pacific, 2.9% for the Eastern Mediterranean, and 0% (0/246 samples) for Europe. The range of LODs reported was 0.3–3 µg/kg. Approximately 50 papers were found in the scientific literature with information on sterigmatocystin occurrence. Most of the publications employed
115
Contaminants
multi-mycotoxin analysis and were not on sterigmatocystin specifically, and they were therefore difficult to interpret. Most information was found on cereals and cereal-based products. There were also positive detections at low concentrations (usually below 20 µg/kg) in cheese, chilli, pepper, coffee, beer and nuts. Contamination of feed is generally low, with a few reports of high concentrations (maximum 733 µg/kg) in Japan, Argentina and the Russian Federation. No reports were found on the occurrence of sterigmatocystin in animal products; therefore, it was not possible to evaluate the transfer of sterigmatocystin from feed to foods.
Food consumption and dietary exposure assessment As a consequence of the limited information on occurrence, few dietary exposure evaluations were published. Dietary exposure through coffee consumption was estimated for Spain, with mean values of 0.049 ng/kg bw per day for adults and 0.011 ng/kg bw per day for adolescents (105). Dietary exposure to sterigmatocystin from wheat consumption in the Syrian Arab Republic was estimated to range between 0.7 and 10 ng/kg bw per day, the latter being a worst-case scenario (106). Another estimated dietary exposure to sterigmatocystin was from consumption of spices in Sri Lanka, resulting in a mean range of 0.04–0.15 ng/kg bw per day for adults (lowest LB–highest UB) (107). These dietary exposure estimates were based on very limited data and cannot be considered as representative of national or international exposure.
International estimatesConsidering the limited contamination data in published papers and the very high proportion of non-detected analytical results for sterigmatocystin in foods (from 78.5% for Africa up to 100% for Europe and the Western Pacific), an LB–UB approach was used by the Committee to calculate estimates only for WHO regions for which data on consumption and contamination were available in the GEMS/Food contaminants database and the GEMS/Food cluster diets (Table 11). The five WHO regions analysed were Africa (G13 cluster diet with sorghum), Eastern Mediterranean (G13 cluster diet with sorghum), Europe (average of G07, G08, G11 and G15 cluster diets with cereals, snacks and desserts), Western Pacific (G10 cluster diet with cereals) and the Americas (G10 cluster diet with cereals, food for infants, legumes and pulses, nuts and oilseeds, starchy roots).
The best refined international LB–UB mean (or high) exposure estimates for adults were 16–17 ng/kg bw per day (32–34 ng/kg bw per day) for Africa, 0.3–6.3 ng/kg bw per day (0.6–13 ng/kg bw per day) for the Americas, 0.3–3.5 ng/kg bw per day (0.6–7 ng/kg bw per day) for the Eastern Mediterranean, 0–22 ng/

116
Joint FAO/WHO Expert Committee on Food Additives Eighty-third report W
HO
Tec
hnic
al R
epor
t Ser
ies,
No.
100
2, 2
017
kg bw per day (0–44 ng/kg bw per day) for Europe and 0–0.5 ng/kg bw per day (0–1 ng/kg bw per day) for the Western Pacific.
These results are very uncertain because of the very high left-censorship (below LOD), equal to 100% in Europe and in Western Pacific, except for Africa, and the limited number of food commodities analysed.
Dose–response analysisThe critical effect for sterigmatocystin is carcinogenicity, and the long-term rat study by Maekawa et al. (40), using dietary administration of doses equivalent to 0, 0.005, 0.05 and 0.5 mg/kg bw per day, was considered the most suitable for dose–response modelling. The critical end-point selected was hepatic haemangiosarcoma in male rats. In accordance with JECFA guidance on dose–response modelling, all models in the USEPA’s BMDS software (version 2.6.1) were fitted to the data using the software’s default constraints for restricted models. The log-logistic model yielded the lowest estimate of the BMDL10, 0.16 mg/kg bw per day. For comparison (see section 2.1.1), the model-averaging software of Wheeler & Bailer (109), which is available in source code as supplemental material, was used to compute the model-average estimate to compare the estimates based upon the log-logistic model. For this comparison, all models, except the quantal-quadratic, were included, and the Bayesian Information Criterion was used to compute the model-average weights. The BMDL10 estimates using model averaging yielded an estimate of 0.30 mg/kg bw per day.
Table 11Exposure estimatesa for adults for WHO regions
WHO regionMean exposure (LB–UB)
(ng/kg bw per day)High exposure (LB–UB)b
(ng/kg bw per day) Left-censorshipc (%)Africa (Burkina Faso, Mali, Ethiopia)
16–17 32–34 78.5
Americas (Canada)
0.3–6.3 0.6–13 98.25
Eastern Mediterranean(Sudan)
0.3–3.5 0.6–7 97.1
Europe (Czech Republic, the Netherlands, United Kingdom)
0–22 0–44 100
Western Pacific (Japan)
0–0.5 0–1 100
a Estimates are per capita based on a mean body weight of 60 kg for adults.b High estimates were estimated by the Committee to be equal to twice the mean, which is a good approximation of the 90th percentile (108).c Below the LOD.

117
Contaminants
The Committee selected the BMDL10 of 0.16 mg/kg bw per day for hepatic haemangiosarcoma in male rats (40) from the restricted log-logistic model as the point of departure for use in the risk assessment.
Evaluation As it is not appropriate to establish a health-based guidance value for substances that are genotoxic carcinogens, the Committee used an MOE approach based on the BMDL10 for sterigmatocystin of 0.16 mg/kg bw per day as the point of departure. The Committee noted that there is a paucity of occurrence data, and what data were available to the Committee frequently were left-censored, thereby increasing the uncertainty in the exposure assessment.
The Committee calculated MOEs for mean and high estimates of dietary exposure to sterigmatocystin. The MOEs for adults ranged from 9400 to more than 530 000 for mean estimates based on UB and LB assumptions, respectively. For high estimates, MOEs for adults ranged from 4700 to 270 000. The lowest MOEs were observed for the African Region (from 4700 [UB] to 5000 [LB] for the high-exposure range, and from 9400 [UB] to 10 000 [LB] for the mean-exposure range). The Committee noted that these estimates, which are based only on adult populations and for which only one food commodity (sorghum) was considered, may indicate a human health concern. MOEs were not calculated for Europe or Japan, as sterigmatocystin was not detected in any samples. For all other regions, the Committee considered that the MOEs were not of human health concern even at the UB high exposure.
Overall, the Committee concluded that the data used for calculating the MOEs have considerable limitations, both for the dietary exposure estimate and for the toxicological point of departure. Limited data on occurrence in food were available, and analytical detection limits were high in some countries. The only long-term carcinogenicity study suitable for dose–response modelling used an uncommon strain of rat (ACI/N), and, in view of the low incidence of liver tumours in this animal model, it may not be the most appropriate for human risk assessment. Consequently, the derived MOEs should be considered only as crude estimates.
The Committee also noted that sterigmatocystin and AFB1 have the same main target organ (the liver). The comparative animal data on carcinogenicity are very limited, but indicate that sterigmatocystin is less potent than AFB1.
RecommendationsThe Committee recommends improving the LOQs for sterigmatocystin, particularly when developing multi-mycotoxin methods.

118
Joint FAO/WHO Expert Committee on Food Additives Eighty-third report W
HO
Tec
hnic
al R
epor
t Ser
ies,
No.
100
2, 2
017
The Committee recommends that more food commodities, especially stored crops, be analysed with appropriate analytical LODs that would allow refining the estimates of dietary exposure to sterigmatocystin from all regions. The Committee encourages the development of suitable certified reference materials and proficiency tests to support the analysis of sterigmatocystin.
A monograph was prepared.
References 1. Jurjević Z, Peterson SW, Solfrizzo M, Peraica M. Sterigmatocystin production by nine newly described Aspergillus species in
section Versicolores grown in two different media. Mycotoxin Res. 2013;29(3):141–5. 2. Hubka V, Novakova A, Peterson SW, Frisvad JC, Sklenar F, Matsuzawa T et al. A reappraisal of Aspergillus section Nidulantes
with descriptions of two new sterigmatocystin-producing species. Plant Syst Evol. 2016;302(9):1267–99. 3. Rank C, Nielsen KF, Larsen TO, Varga J, Samson RA, Frisvad JC. Distribution of sterigmatocystin in filamentous fungi. Fungal
Biol. 2011;115:406–20. 4. Veršilovskis A, Bartkevics V, Mikelsone V. Sterigmatocystin presence in Latvian grains. Food Chem. 2008;109:243–8. 5. Varga E, Glauner T, Berthiller F, Krska R, Schuhmacher R, Sulyok M. Development and validation of a (semi-)quantitative
UHPLC-MS/MS method for the determination of 191 mycotoxins and other fungal metabolites in almonds, hazelnuts, peanuts and pistachios. Anal Bioanal Chem. 2013;405:5087–5104.
6. Mol HGL, MacDonald SJ, Anagnostopoulos C, Spanjer M, Bertuzzi T, Pietri A. European survey on sterigmatocystin in cereals, cereals-based products, beer and nuts. World Mycotoxin J. 2016;9(4):633–42.
7. Rofiat AS, Fanelli F, Atanda O, Sulyok M, Cozzi G, Bavaro S et al. Fungal and bacterial metabolites associated with natural contamination of locally processed rice (Oryza sativa L.) in Nigeria. Food Addit Contam Part A Chem Anal Control Expo Risk Assess. 2015;32(6):950–9.
8. Yogendrarajah P, Jacxsens L, De Saeger S, De Meulenaer B. Co-occurrence of multiple mycotoxins in dry chilli (Capsicum annum L.) samples from the markets of Sri Lanka and Belgium. Food Control. 2014;46:26–34.
9. Warth B, Parich A, Atehnkeng J, Bandyopadhyay R, Schuhmacher R, Sulyok M et al. Quantitation of mycotoxins in food and feed from Burkina Faso and Mozambique using a modern LC-MS/MS multitoxin method. J Agric Food Chem. 2012;60(36):9352–63.
10. Biancardi A, Dall’Asta C. Determination of sterigmatocystin in feed by LC-MS/MS. Food Addit Contam Part A Chem Anal Control Expo Risk Assess. 2015;32(12):2093–2100.
11. Keller NP, Kantz NJ, Adams TH. Aspergillus nidulans verA is required for production of the mycotoxin sterigmatocystin. Appl Environ Microbiol. 1994;60:1444–50.
12. Yu J, Bhatnagar D, Ehrlich KC. Aflatoxin biosynthesis. Rev Iberoam Micol. 2002;19:191–200. 13. Sweeney MJ, Dobson ADW. Molecular biology of mycotoxin biosynthesis. FEMS Microbiol Lett. 1999;175:149–63. 14. Abramson D, Hulasare R, White NDG, Jayas DS, Marquardt RR. Mycotoxin formation in hulless barley during granary storage
at 15 and 19% moisture content. J Stored Prod Res. 1999;35(3):297–305. 15. Yogendrarajah P, Deschuyffeleer N, Jacxsens L, Sneyers P-J, Maene P, De Saeger S et al. Mycological quality and mycotoxin
contamination of Sri Lankan peppers (Piper nigrum L.) and subsequent exposure assessment. Food Control. 2014;41:219–30. 16. European Food Safety Authority. Scientific Opinion on the risk for public and animal health related to the presence of
sterigmatocystin in food and feed. EFSA J. 2013;11(6):3254.17. Carbone I, Ramirez-Prado JH, Jakobek JL, Horn BW. Gene duplication, modularity and adaptation in the evolution of the
aflatoxin gene cluster. BMC Evol Biol. 2007;7:111–23.18. Walkow J, Sullivan G, Maness D, Yakatan GJ. Sex and age differences in the distribution of 14C-sterigmatocystin in immature
and mature rats: a multiple dose study. J Am Coll Toxicol. 1985;4:45–51.19. Steyn M, Thiel PG. Biliary excretion of sterigmatocystin by vervet monkeys. Biochem Pharmacol. 1976;25:265–6.
119
Contaminants
20. Wang DS, Sun HL, Xiao FY, Ji XH, Liang YX, Han FG. Distribution and excretion of 3H-sterigmatocystin in rats. IARC Sci Publ. 1991;105:424–6.
21. Thiel PG, Steyn M. Urinary excretion of the mycotoxin, sterigmatocystin by vervet monkeys. Biochem Pharmacol. 1973;22:3267–73.
22. Essigmann JM, Barker LJ, Fowler KW, Francisco MA, Reinhold VN, Wogan GN. Sterigmatocystin–DNA interactions: identification of a major adduct formed after metabolic activation in vitro. Proc Natl Acad Sci USA. 1979;76:179–83.
23. Essigmann JM, Donahue PR, Story DL, Wogan GN, Brunengraber H. Use of the isolated perfused rat liver to study carcinogen–DNA adduct formation from aflatoxin B1 and sterigmatocystin. Cancer Res. 1980;40:4085–91.
24. Cabaret O, Puel O, Botterel F, Pean M, Khoufache K, Costa JM et al. Metabolic detoxication pathways for sterigmatocystin in primary tracheal epithelial cells. Chem Res Toxicol. 2010;23:1673–81.
25. Cabaret O, Puel O, Botterel F, Pean M, Bretagne S, Delaforge M. Contribution of uniformly 13C-enriched sterigmatocystin to the study of its pulmonary metabolism. Rapid Commun Mass Spectrom. 2011;25:2704–10.
26. Krol ES. Metabolic detoxication pathways for sterigmatocystin in primary tracheal epithelial cells: structural identification of glutathione adducts. Chem Res Toxicol. 2011;24:1339–40.
27. Pfeiffer E, Fleck SC, Metzler M. Catechol formation: a novel pathway in the metabolism of sterigmatocystin and 11-methoxysterigmatocystin. Chem Res Toxicol. 2014;27(12):2093–9.
28. Olson JJ, Chu FS. Immunochemical studies of urinary metabolites of sterigmatocystin in rats. J Agric Food Chem. 1993;41:250–5.
29. Purchase IF, van der Watt JJ. Acute toxicity of sterigmatocystin to rats. Food Cosmet Toxicol. 1969;7:135–9.30. van der Watt JJ, Purchase IF. The acute toxicity of retrorsine, aflatoxin and sterigmatocystin in vervet monkeys. Br J Exp
Pathol. 1970;51:183–90.31. Purchase IF, van der Watt JJ. The acute and chronic toxicity of sterigmatocystin. In: Purchase IFH, editor. Mycotoxins in
human health: proceedings of a symposium held in Pretoria. London: MacMillan; 1970:209–13.32. van der Watt JJ, Purchase IF. Subacute toxicity of sterigmatocystin to rats. S Afr Med J. 1970;44:159–60.33. Richard JL, Thurston JR, Lillehoj EB, Cysewski SJ, Booth GD. Complement activity, serum protein, and hepatic changes in
guinea pigs given sterigmatocystin or aflatoxin, alone or in combination. Am J Vet Res. 1978;39:163–6.34. Sivakumar V, Thanislass J, Niranjali S, Devaraj H. Lipid peroxidation as a possible secondary mechanism of sterigmatocystin
toxicity. Hum Exp Toxicol. 2001;20:398–403.35. Zwicker GM, Carlton WW, Tuite J. Long-term administration of sterigmatocystin and Penicillium viridicatum to mice. Food
Cosmet Toxicol. 1974;12:491–7.36. Enomoto M, Hatanaka J, Igarashi S, Uwanuma Y, Ito H, Asaoka S et al. High incidence of angiosarcomas in brown-fat tissue
and livers of mice fed sterigmatocystin. Food Chem Toxicol. 1982;20:547–56.37. Purchase IF, van der Watt JJ. Carcinogenicity of sterigmatocystin. Food Cosmet Toxicol. 1970;8:289–95.38. Terao K, Aikawa T, Kera K. A synergistic effect of nitrosodimethylamine on sterigmatocystin carcinogenesis in rats. Food
Cosmet Toxicol. 1978;16:591–96.39. Ohtsubo K, Saito M, Kimura H. High incidence of hepatic tumours in rats fed mouldy rice contaminated with Aspergillus
versicolor containing sterigmatocystin. Food Cosmet Toxicol. 1978;16:143–9.40. Maekawa A, Kajiwara T, Odashima S, Kurata H. Hepatic changes in male ACI/N rats on low dietary levels of sterigmatocystin.
Gann. 1979;70:777–81.41. Thorgeirsson UP, Dalgard DW, Reeves J, Adamson RH. Tumor incidence in a chemical carcinogenesis study of nonhuman
primates. Regul Toxicol Pharmacol. 1994;19:130–51.42. Dickens F, Jones HE, Waynforth HB. Oral, subcutaneous and intratracheal administration of carcinogenic lactones and
related substances: the intratracheal administration of cigarette tar in the rat. Br J Cancer. 1966;20:134–44.43. Purchase IF, van der Watt JJ. Carcinogenicity of sterigmatocystin to rat skin. Toxicol Appl Pharmacol. 1973;26:274–81.44. Fujii K, Kurata H, Odashima S, Hatsuda Y. Tumor induction by a single subcutaneous injection of sterigmatocystin in
newborn mice. Cancer Res. 1976;36:1615–8.45. Terao K. Mesotheliomas induced by sterigmatocystin in Wistar rats. Gann. 1978;69:237–47.46. Thoolen B, Maronpot RR, Harada T, Nyska A, Rousseaux C, Nolte T et al. Proliferative and nonproliferative lesions of the rat
and mouse hepatobiliary system. Toxicol Pathol. 2010;38(Suppl 7):5S–81S.

120
Joint FAO/WHO Expert Committee on Food Additives Eighty-third report W
HO
Tec
hnic
al R
epor
t Ser
ies,
No.
100
2, 2
017
47. Thoolen B, Ten Kate FJ, van Diest PJ, Malarkey DE, Elmore SA, Maronpot RR. Comparative histomorphological review of rat and human hepatocellular proliferative lesions. J Toxicol Pathol. 2012;25:189–99.
48. McCann J, Choi E, Yamasaki E, Ames BN. Detection of carcinogens as mutagens in the Salmonella/microsome test: assay of 300 chemicals. Proc Natl Acad Sci USA. 1975;72:5135–9.
49. Ueno Y, Kubota K. DNA-attacking ability of carcinogenic mycotoxins in recombination-deficient mutant cells of Bacillus subtilis. Cancer Res. 1976;36:445–51.
50. Tang T, Friedman MA. Carcinogen activation by human liver enzymes in the Ames mutagenicity test. Mutat Res. 1977;46:387–94.
51. Kuczuk MH, Benson PM, Heath H, Hayes AW. Evaluation of the mutagenic potential of mycotoxins using Salmonella typhimurium and Saccharomyces cerevisiae. Mutat Res. 1978;53:11–20.
52. Ueno Y, Kubota K, Ito T, Nakamura Y. Mutagenicity of carcinogenic mycotoxins in Salmonella typhimurium. Cancer Res. 1978;38:536–42.
53. Wehner FC, Thiel PG, van Rensburg SJ, Demasius IP. Mutagenicity to Salmonella typhimurium of some Aspergillus and Penicillium mycotoxins. Mutat Res. 1978;58:193–203.
54. Mori H, Sugie S, Yoshimi N, Kitamura J, Niwa M, Hamasaki T et al. Genotoxic effects of a variety of sterigmatocystin-related compounds in the hepatocyte/DNA-repair test and the Salmonella microsome assay. Mutat Res. 1986;173:217–22.
55. Krivobok S, Olivier P, Marzin DR, Seigle-Murandi F, Steiman R. Study of the genotoxic potential of 17 mycotoxins with the SOS chromotest. Mutagenesis. 1987;2:433–9.
56. Baertschi SW, Raney KD, Shimada T, Harris TM, Guengerich FP. Comparison of rates of enzymatic oxidation of aflatoxin B1, aflatoxin G1, and sterigmatocystin and activities of the epoxides in forming guanyl-N7 adducts and inducing different genetic responses. Chem Res Toxicol. 1989;2:114–22.
57. Umeda M, Tsutsui T, Saito M. Mutagenicity and inducibility of DNA single-strand breaks and chromosome aberrations by various mycotoxins. Gann. 1977;68:619–25.
58. Reiners JJJ, Yotti LP, McKeown CK, Nesnow S, Slaga TJ. Keratinocyte cell-mediated mutagenesis assay: correlation with in vivo tumor studies. Carcinogenesis. 1983;4:321–6.
59. Noda K, Umeda M, Ueno Y. Cytotoxic and mutagenic effects of sterigmatocystin on cultured Chinese hamster cells. Carcinogenesis. 1981;2:945–9.
60. Morita H, Umeda M, Ogawa HI. Mutagenicity of various chemicals including nickel and cobalt compounds in cultured mouse FM3A cells. Mutat Res. 1991;261:131–7.
61. Stich HF, Laishes BA. The response of xeroderma pigmentosum cells and controls to the activated mycotoxins, aflatoxins and sterigmatocystin. Int J Cancer. 1975;16:266–74.
62. Mori H, Kawai K, Ohbayashi F, Kuniyasu T, Yamazaki M, Hamasaki T et al. Genotoxicity of a variety of mycotoxins in the hepatocyte primary culture/DNA repair test using rat and mouse hepatocytes. Cancer Res. 1984;44:2918–23.
63. Ellard S, Mohammed Y, Dogra S, Wolfel C, Doehmer J, Parry JM. The use of genetically engineered V79 Chinese hamster cultures expressing rat liver CYP1A1, 1A2 and 2B1 cDNAs in micronucleus assays. Mutagenesis. 1991;6:461–70.
64. Ellard S, Parry JM. A comparative study of the use of primary Chinese hamster liver cultures and genetically engineered immortal V79 Chinese hamster cell lines expressing rat liver CYP1A1, 1A2 and 2B1 cDNAs in micronucleus assays. Toxicology. 1993;82:131–49.
65. Crofton-Sleigh C, Doherty A, Ellard S, Parry EM, Venitt S. Micronucleus assays using cytochalasin-blocked MCL-5 cells, a proprietary human cell line expressing five human cytochromes P-450 and microsomal epoxide hydrolase. Mutagenesis. 1993;8:363–72.
66. Jaksic D, Puel O, Canlet C, Kopjar N, Kosalec I, Klarić MS. Cytotoxicity and genotoxicity of versicolorins and 5-methoxysterigmatocystin in A549 cells. Arch Toxicol. 2012;86(10):1583–91.
67. Zhang D, Cui Y, Shen H, Xing L, Cui J, Wang J et al. Sterigmatocystin-induced DNA damage triggers G2 arrest via an ATM/p53-related pathway in human gastric epithelium GES-1 cells in vitro. PLoS One. 2013;8(5):e65044.
68. Wang J, Huang S, Xing L, Shen H, Yan X, Wang J et al. Role of hMLH1 in sterigmatocystin-induced G2 phase arrest in human esophageal epithelial Het-1A cells in vitro. Toxicol Lett. 2013;217(3):226–34.

121
Contaminants
69. Wang J, Huang S, Xing L, Cui J, Tian Z, Shen H et al. Sterigmatocystin induces G1 arrest in primary human esophageal epithelial cells but induces G2 arrest in immortalized cells: key mechanistic differences in these two models. Arch Toxicol. 2015;89(11):2015–25.
70. Anninou N, Chatzaki E, Papachristou F, Pitiakoudis M, Simopoulos C. Mycotoxins’ activity at toxic and sub-toxic concentrations: differential cytotoxic and genotoxic effects of single and combined administration of sterigmatocystin, ochratoxin A and citrinin on the hepatocellular cancer cell line Hep3B. Int J Environ Res Public Health. 2014;11(2):1855–72.
71. Huang S, Wang J, Xing L, Shen H, Yan X, Wang J et al. Impairment of cell cycle progression by sterigmatocystin in human pulmonary cells in vitro. Food Chem Toxicol. 2014;66:89–95.
72. Gao W, Jiang L, Ge L, Chen M, Geng C, Yang G et al. Sterigmatocystin-induced oxidative DNA damage in human liver–derived cell line through lysosomal damage. Toxicol In Vitro. 2015;29(1):1–7.
73. Curry PT, Reed RN, Martino RM, Kitchin RM. Induction of sister-chromatid exchanges in vivo in mice by the mycotoxins sterigmatocystin and griseofulvin. Mutat Res. 1984;137:111–5.
74. Ueda N, Fujie K, Gotoh-Mimura K, Chattopadhyay SC, Sugiyama T. Acute cytogenetic effect of sterigmatocystin on rat bone-marrow cells in vivo. Mutat Res. 1984;139:203–6.
75. Abdel-Wahhab MA, Hasan AM, Aly SE, Mahrous KF. Adsorption of sterigmatocystin by montmorillonite and inhibition of its genotoxicity in the Nile tilapia fish (Oreachromis nilaticus). Mutat Res. 2005;582:20–7.
76. Reddy MV, Irvin TR, Randerath K. Formation and persistence of sterigmatocystin DNA adducts in rat-liver determined via P-32-postlabeling analysis. Mutat Res. 1985;152:85–96.
77. Olson JJ, Chu FS. Urinary excretion of sterigmatocystin and retention of DNA adducts in liver of rats exposed to the mycotoxin – an immunochemical analysis. J Agric Food Chem. 1993;41:602–6.
78. Liu Y, Xing X, Wang J, Xing L, Su Y, Yao Z et al. Sterigmatocystin alters the number of FoxP3+ regulatory T cells and plasmacytoid dendritic cells in BALB/c mice. Food Chem Toxicol. 2012;50(6):1920–6.
79. Zhang Y, Yao ZG, Wang J, Xing LX, Xia Y, Zhang XH. Effects of sterigmatocystin on TNF-α, IL-6 and IL-12 expression in murine peripheral blood mononuclear cells and peritoneal macrophages in vivo. Mol Med Rep. 2012;5(5):1318–22.
80. Wang X, Robertson AL, Li J, Chai RJ, Haishan W, Sadiku P et al. Inhibitors of neutrophil recruitment identified using transgenic zebrafish to screen a natural product library. Dis Model Mech. 2014;7(1):163–9.
81. Korkalainen M, Täubel M, Naarala J, Kirjavainen P, Koistinen A, Hyvärinen A et al. Synergistic proinflammatory interactions of microbial toxins and structural components characteristic to moisture-damaged buildings. Indoor Air. 2017;27:13–23.
82. Butler J. Acute toxicity of aflatoxin B1 in rats. Br J Cancer. 1964;18:756–62.83. Vesonder RF, Horn BW. Sterigmatocystin in dairy cattle feed contaminated with Aspergillus versicolor. Appl Environ
Microbiol. 1985;49:234–35.84. Lou JL, Tian HJ, Meng ZH, Gou ZQ. [Detection of sterigmatocystin in food/feed samples from area with various liver/stomach
cancer incidences by enzyme-linked immune-absorbent assay.] J Hyg Res. 1995;2:28–31 (in Chinese) [cited in Scott PM. Other mycotoxins. In: Magan N, Olsen M, editors. Mycotoxins in food: detection and control. Boca Raton (FL): CRC Press; 2004:417].
85. Tian H, Lou J, Du C. Determination of sterigmatocystin in cancerous tissues, blood and urine in patients with liver and stomach cancer. Zhonghua Yu Fang Yi Xue Za Zhi. 1995;29:276–78 [cited in (16)].
86. Marley P, Brown P, Mackie J, Donnelly C, Wilcox J, Pietri A et al. Analysis of sterigmatocystin in cereals, animal feed, seeds, beer and cheese by immunoaffinity column clean up and HPLC and LC-MS/MS quantification. Food Addit Contam Part A Chem Anal Control Expo Risk Assess. 2015;32(12):2131–7.
87. Mol HGJ, Pietri A, MacDonald SJ, Anagnostopoulos C, Spanjer M. Survey on sterigmatocystin in food. EFSA Supporting Publication. 2015;12(3):EN-774, 56 pp. doi:10.2903/sp.efsa.2015.EN-774.
88. Veršilovskis A, De Saeger S. Sterigmatocystin: occurrence in foodstuffs and analytical methods: an overview. Mol Nutr Food Res. 2010;54:136–47.
89. Stroka J, Dasko L, Spangenberg B, Anklam E. Determination of mycotoxin, sterigmatocystin, by thin-layer chromatography and reagent-free derivatisation. J Liq Chromatogr Relat Technol. 2004;27(13):2101–11.
90. Veršilovskis A, De Saeger S, Mikelstone V. Determination of sterigmatocystin in beer by high performance liquid chromatography with ultraviolet detection. World Mycotoxin J. 2008;1(2):161–6.

122
Joint FAO/WHO Expert Committee on Food Additives Eighty-third report W
HO
Tec
hnic
al R
epor
t Ser
ies,
No.
100
2, 2
017
91. Veršilovskis A, Van Peteghem C, De Saeger S. Determination of sterigmatocystin in cheese by high-performance liquid chromatography–tandem mass spectrometry. Food Addit Contam Part A Chem Anal Control Expo Risk Assess. 2009;26(1):127–33.
92. Yao DS, Cao H, Wen S, Liu DL, Bai Y, Zheng WJ. A novel biosensor for sterigmatocystin constructed by multi-walled carbon nanotubes (MWNT) modified with aflatoxin-detoxifizyme (ADTZ). Bioelectrochemistry. 2006;68(2):126–33.
93. Chen J, Liu D, Li S, Yao D. Development of an amperometric enzyme electrode biosensor for sterigmatocystin detection. Enzyme Microb Technol. 2010;47(4):119–26.
94. Mycotoxin sampling tool. User guide. Version 1.1. Rome: Food and Agriculture Organization of the United Nations; 2014.95. General standard for contaminants and toxins in food and feed. Rome: Food and Agriculture Organization of the United
Nations, Joint FAO/WHO Food Standards Programme, Codex Alimentarius Commission; 1995 (CODEX STAN 193-1995).96. European Commission. Commission Regulation (EC) No 401/2006 laying down the methods of sampling and analysis for
the official control of the levels of mycotoxins in foodstuffs. O J. 2006;L70:12–34.97. Levi CP, Ternk HL, Yeransian JA. Investigation of mycotoxins relative to coffee. In: Proceedings of the 7th Conference of the
Association Scientifique Internationale du Café; 1975:287–94. 98. Tanackov I, Tuco D. Antifungal activity of oregano extract against A. versicolor, E. nidulans and Eurotium spp. – producers of
sterigmatocystin. Matica Srpska Proc Nat Sci. 2011;120:165–76.99. Kouadio IA, Koffi LB, Dosso MB. Prevention of crops contamination by fungi and mycotoxins using natural substances
derived from Lycopersicon esculentum Mill. leaves. J Food Secur. 2013;1(2):16–26.100. Abdel Ghany TM. Eco-friendly and safe role of Juniperus procera in controlling of fungal growth and secondary metabolites.
J Plant Pathol Microbiol. 2014;5(3):1–9.101. Lim TK. Edible medicine and non-medicinal plants, vol 9. Modified stems, roots, bulbs. Dordrecht, Hiedelberg, New York:
Springer; 2015:163–4. 102. Weidenbomer M. Encyclopedia of food mycotoxins. Springer Science & Business Media; 2013:170. 103. Kume T, Ito H, Iizuka H, Takehisa M. Radiosensitivity of Aspergillus versicolor isolated from animal feeds and destruction of
sterigmatocystin by gamma-irradiation. Agric Biol Chem. 1983;47(5):1065–9.104. Aziz NH, Refai MK. Effect of gamma radiation on the growth of Aspergillus versicolor and activity of sterigmatocystin in dairy
cattle feed. Vet Med J. 1989;37(3):587–9. 105. García-Moraleja A, Font G, Mañes J, Ferrer E. Analysis of mycotoxins in coffee and risk assessment in Spanish adolescents
and adults. Food Chem Toxicol. 2015;86:225–33. 106. Alkadri D, Rubert J, Prodi A, Pisi A, Mañes J, Soler C. Natural co-occurrence of mycotoxins in wheat grains from Italy and
Syria. Food Chem. 2014;157:111–8.107. Yogendrarajah P, Jacxsens L, Lachat C, Walpita CN, Kolsteren P, De Saeger S et al. Public health risk associated with the co-
occurrence of mycotoxins in spices consumed in Sri Lanka. Food Chem Toxicol. 2014;74:240–8. 108. FAO/WHO. Principles and methods for the risk assessment of chemicals in food. A joint publication of the Food and
Agriculture Organization of the United Nations and the World Health Organization. Geneva: World Health Organization; 2009 (Environmental Health Criteria 240).
109. Wheeler MW, Bailer AJ. Model averaging software for dichotomous dose response risk estimation. J Stat Softw. 2008;26:1–15.
3.7 Co-exposure of fumonisins with aflatoxinsExplanation Fumonisins and aflatoxins are mycotoxins produced by fungi of Fusarium and Aspergillus species. Considering that fumonisins and aflatoxins are both frequent contaminants in cereal (especially maize, rice, sorghum and wheat) and cereal-based foods and that aflatoxins are common contaminants in groundnuts and
123
Contaminants
tree nuts, co-exposure to both mycotoxins is likely in areas where these foods are consumed as part of the routine diet.
As part of the evaluation of fumonisins at the seventy-fourth meeting (Annex 1, reference 205), the Committee evaluated the toxicological data on the concurrent exposure to fumonisins and other mycotoxins. There were no human studies available showing co-exposure, but there were co-exposure toxicological studies available using animal models. None of the co-exposure studies in animal models was considered adequate for use in the Committee’s evaluation of fumonisins; the Committee noted that the interaction between AFB1, a compound with known genotoxic and hepatocarcinogenic properties, and fumonisins, which have the potential to induce regenerative cell proliferation in the liver, would be of concern. The Committee has not performed a full evaluation for the co-exposure of fumonisins and aflatoxins previously. At the current meeting, the Committee evaluated updated toxicological and exposure data for fumonisins and aflatoxins separately (see sections 3.1 and 3.3). At the request of CCCF, the Committee also evaluated co-exposure to aflatoxins and fumonisins. The evaluation was based on a comprehensive literature search (University of Georgia Libraries Galileo databases, University of Saskatchewan Electronic Library, PubMed and Web of Science) for relevant publications from 2010 to 2016.
Biochemical aspectsThe biochemical aspects of aflatoxins and fumonisins have been provided separately in the current meeting report (see sections 3.1 and 3.3).
The results from a rat study showed that co-exposure (single oral gavage) to pure AFB1 (0.125 mg) and pure FB1 (25 mg) resulted in a decrease in urinary excretion of AFB1 (as measured by urinary AFM1 [UAFM1]) and UFB1 compared with the excretion when either mycotoxin was administered alone. In contrast, an increase in the serum AFB1–alb adduct, derived from the metabolic activation pathway that forms the reactive AFB1-8,9-epoxide intermediates, was observed. The mechanism for this pharmacokinetic interaction was not clear, yet it was suggested that the CYP metabolism of AFB1 might be affected (1). The Committee acknowledged that if the co-exposure alters the AFB1 metabolism and leads to a change in production of the reactive AFB1-exo-8,9-epoxide intermediate, co-exposure could in principle alter the risk of hepatocarcinogenicity of AFB1. However, there is currently no evidence that the interaction observed at the high concentrations used in the study also occurs at doses relevant to human exposure.
Another mechanism of interaction, as noted by the Committee at previous meetings, is based on the fact that AFB1 is a genotoxic initiator of tumour formation in liver and that FB1 is a potential cancer promotor in liver

124
Joint FAO/WHO Expert Committee on Food Additives Eighty-third report W
HO
Tec
hnic
al R
epor
t Ser
ies,
No.
100
2, 2
017
(2, 3) (Annex 1, references 77 and 205). The mutagenicity and carcinogenicity of AFB1 have been described in detail in section 3.1 of this report. As for FB1, recent human data have provided further support that daily exposure to high levels of fumonisins is likely to result in inhibition of ceramide synthase in humans, as is observed in animals (section 3.3). Decreased ceramide biosynthesis and increased sphingosine kinase activity have been associated with the development and progression of many human tumours (4–6). Ceramide synthase 2 knock-out mice show elevated levels of sphinganine, apoptosis and proliferation in the liver, upregulation of cell cycle–related genes, and spontaneously developed liver tumours (7, 8). Many of the changes and effects seen in the liver of the ceramide synthase 2 knock-out mice are reminiscent of changes and effects reported in studies where ceramide synthases are inhibited by FB1. These changes have been interpreted as the regenerative hyperplasia process that could promote the tumorigenic potential of DNA damage initiated by AFB1.
Toxicological studiesThe Committee at the seventy-fourth meeting reviewed the combined effects of fumonisins and other mycotoxins. These studies had limitations and showed inconclusive and sometimes contradictory results. The Committee at the seventy-fourth meeting concluded that because the fumonisins known to date do not share a similar mode of action with any other mycotoxin, it was unlikely that simple additive effects with other mycotoxins would occur (Annex 1, reference 205).
In the present evaluation, the newly available in vivo and in vitro studies of combined effects were evaluated for evidence suggestive of interactions. No long-term study on the effect of aflatoxin–fumonisin co-exposure has been done since the Committee’s last evaluation.
In one mouse study, pure AFB1 (80 µg/kg bw per day) and pure FB1 (100 µg/kg bw per day) were given by oral gavage, either alone or in combination, for 14 days. Among the observed effects, some showed less than additivity (i.e. the end-point was affected to the same extent for AFB1 only, FB1 only and co-exposure groups), such as the increase in relative spleen weight, whereas others showed additivity, such as activities of enzymes indicative of oxidative stress (9).
In a rat feeding study, F344 rats were exposed to pure AFB1 (equivalent to 15 µg/kg bw per day for 14 days) and pure FB1 (equivalent to 25 mg/kg bw per day for 21 days), alone or sequentially (the rats were treated with AFB1 and then FB1, with a recovery period of 21 days in between). The results showed that effects on some end-points, such as body weight, appeared to be less than additive, whereas others, such as the effects on some liver enzymes, appeared to be additive. Importantly, the lesions indicating liver damage, such as average number of apoptotic cells and the number and area of GST placental form positive (GST-P+)

125
Contaminants
foci, were found to be synergistic (10). These results support the hypothesis that fumonisins may be a promoter for aflatoxin-initiated hepatocarcinogenesis and confirmed the previous findings by Gelderblom et al. (3), which, along with the study in trout (2), were the basis for the Committee to acknowledge the concern for the increased hepatocarcinogenicity under the condition of co-exposure to aflatoxins and fumonisins.
In another rat feeding study, Wistar rats were exposed for 90 days to FB1 (100 mg/kg in diet from culture material extract) and pure AFB1 (40 µg/kg diet), either alone or in combination. Spleen mononuclear cells were isolated and analysed immediately for a series of toxicological end-points, most of which suggested a less than additive effect (11).
Chickens were fed diets containing aflatoxins (equivalent to 0.125 mg/kg bw, prepared with A. flavus culture material) or fumonisins (equivalent to 3.125 mg/kg bw, prepared with F. verticillioides culture material), alone or combined, for 56 days. Changes in plasma triglycerides, very low density lipoprotein levels and percentage of total liver lipids were observed in the co-exposure group (12). The nature of the interactions was not defined by the authors, but they appeared to be additive or less than additive.
The Committee noted that the above studies were conducted using only one dose of aflatoxins and fumonisins; thus, the nature of the interaction could not be assessed. The errors and pitfalls of this approach have also been critiqued by Chou (13).
Since 2011, there have been only a few in vitro studies published addressing the AFB1 and FB1 co-exposure interaction. In rat spleen mononuclear cells, AFB1 and FB1 each induced production of reactive oxygen species, with the combined effect being less than additive. However, other effects, such as on superoxide anion radical generation, protein oxidation, lipid peroxidation and DNA oxidation, were mostly suggestive of additivity in the combined treatment (14). In a rat liver hepatoma cell line, FB1 alone or in combination with AFB1 increased CYP1A transcription and activity, as well as upregulated the aryl hydrocarbon receptor in a dose-dependent manner. The effects were greatest in the cells treated with the FB1–AFB1 mixture, and in some cases the effects were suggestive of being more than additive (15). Because in vitro cytotoxicity of FB1 and the metabolism of AFB1 are highly dependent on the cell type, the Committee noted that the in vitro results need to be interpreted carefully.
With limited knowledge of the in vitro–in vivo extrapolation of many of the tested toxicological end-points and the above-mentioned limitations in the in vivo studies, the Committee concluded that the available toxicological studies do not provide adequate information on aflatoxin–fumonisin interactions to facilitate an understanding of the role of co-exposure as a contributing factor in human disease.

126
Joint FAO/WHO Expert Committee on Food Additives Eighty-third report W
HO
Tec
hnic
al R
epor
t Ser
ies,
No.
100
2, 2
017
Observations in humansUrinary multi-biomarker analytical methods have recently been developed and increasingly used to estimate human exposure to mycotoxins. These methods are typically capable of simultaneously measuring the concentration of more than five urinary mycotoxin biomarkers, including UFB1 and UAFM1. In spite of a number of studies reporting the measurement of multiple urinary mycotoxin biomarkers concurrently, many provided the frequency of positive samples for each mycotoxin separately; thus, the status of co-occurrence of UFB1 and UAFM1 in the samples is unknown. Very few multi-biomarker analytical studies provided the urinary mycotoxin biomarker co-occurrence information. In a study conducted in women in Guatemala, of a total of 602 urine samples, 287 (48%) were positive for UFB1, 90 (15%) were positive for AFM1 and 66 of the 90 AFM1-positive samples were also positive for FB1 (73%). This result was in concordance with the fact that the contamination of maize with fumonisins and aflatoxins is common in Guatemala (16). None of the other studies has analysed samples from a population that was known to consume foods with frequent co-contamination of aflatoxins and fumonisins. With the low frequency of positive samples, no UFB1 and UAFM1 co-occurrence was found from those studies. One study in the United Republic of Tanzania measured UFB1 and plasma aflatoxin–albumin adducts (AF–alb) in children. UFB1 and AF–alb were detectable in 96% and 84% of the children, respectively, and 82% of the children had co-exposure. There was a significant positive correlation between levels of UFB1 and AF–alb (17). Although evidence in laboratory animals has suggested an additive or synergistic effect of fumonisin and aflatoxin co-exposure in the development of preneoplastic lesions (3, 10) or hepatocellular carcinoma (2), currently no data are available on such effects in humans. Two prospective epidemiological studies were conducted in the United Republic of Tanzania to investigate the role of fumonisins, aflatoxins and their co-exposure in childhood growth. In one study, a significant negative association was observed between UFB1, but not AF–alb, and length growth for 166 children followed up until 6–14 months of age. However, no interpretable results were found regarding the effect of fumonisin–aflatoxin co-exposure (18). In the other study, exposure to fumonisins or aflatoxins, alone or in combination, was not significantly associated with underweight or stunting in 143 infants less than 6 months of age (19).

127
Contaminants
Co-occurrence of fumonisins and aflatoxins in foodsAn evaluation of the co-occurrence of aflatoxins and fumonisins in foods was undertaken by the Committee. The degree of co-occurrence of aflatoxins and fumonisins can be influenced by many factors, including variety of the commodity, region, time of sampling, storage, food preparation and processing.
There is information available regarding the co-occurrence of a range of mycotoxins in foods that is broader than the aflatoxin and fumonisin groups. There is also information available for the range of different aflatoxins and fumonisins in foods either individually or as totals. Although this evaluation noted these aspects, the focus of the evaluation was co-occurrence of AFB1 and FB1.
Data used to evaluate the co-occurrence of aflatoxins and fumonisins in foods were obtained from two sources: the data in the GEMS/Food contaminants database and the literature from studies that analysed both mycotoxins. The evaluation aimed to determine the types of foods in which both mycotoxins occur, the degree of co-occurrence and the countries in which the co-occurrence exists.
Co-occurrence of aflatoxins and fumonisins in animal feed was not considered for this review because, as noted previously by the Committee at its seventy-fourth meeting, fumonisins do not transfer in significant amounts from feed to animal products.
The co-occurrence evaluation based on data from the GEMS/Food contaminants database was first based on all samples for each food and then by sample number for individual analytical samples. Co-occurrence was defined as where detected concentrations (>LOD or >LOQ, depending on the data available) were found for both AFB1 and FB1. For the analysis including all samples, there were over 84 000 data points for AFB1 and over 19 000 for FB1 in food samples from a variety of countries. The majority of detections of both AFB1 and FB1 were in the cereals and cereal-based products group. This included foods such as barley, maize, millet, rice, rye, sorghum and mixed cereal products. Although this provides a general guide as to the types of foods where co-occurrence may occur, a more detailed analysis of individual foods by sample was undertaken to determine the degree of co-occurrence within individual samples. Just over 5000 samples, across all countries and foods, in the GEMS/Food contaminants database had unique sample identification numbers. For 1.7% of these, co-occurrence of AFB1 and FB1 was reported. For individual samples, co-occurrence was found for maize (5.5%), cereals and cereal-based products (4.2%), bread and other cooked cereal products (2.8%), sorghum (1.4%) and cereal-based foods for infants and young children (0.4%). Of the 18 countries and one WHO region for which data were submitted by sample number, samples from nine countries

128
Joint FAO/WHO Expert Committee on Food Additives Eighty-third report W
HO
Tec
hnic
al R
epor
t Ser
ies,
No.
100
2, 2
017
had no co-occurrence. For the others, the degree of co-occurrence varied as a result of the number of samples and types of foods included, and therefore it was not possible to identify countries that had higher degrees of co-occurrence than others. There were also a limited number of WHO regions with co-occurrence data represented in the GEMS/Food contaminants database, with data from only four African countries for sorghum only.
Based on an evaluation of the literature, co-occurrence of AFB1 and FB1 was identified in samples of foods within the same study; however, it was mostly not possible to determine the degree of co-occurrence within the same samples. In contrast to the data in the GEMS/Food contaminants database, most of the studies in the literature were from African countries, and the main food groups assessed were maize and maize-based products. Other foods where co-occurrence was observed were other cereals (including sorghum, millet, rice, wheat), coffee, smoked meat and black pepper. The proportion of samples with AFB1 and FB1 detection varied widely (1–100%).
Co-exposure to aflatoxins and fumonisins in the dietAn evaluation of the co-exposure to AFB1 and FB1 was undertaken at the overall diet level to determine populations that are likely to be consuming diets that result in exposure to both mycotoxins, irrespective of co-occurrence in foods. These populations are more likely to be at a higher level of risk of potential adverse effects associated with co-exposure. To do this, an evaluation was done to highlight foods with higher concentrations of AFB1 and FB1 and populations that may have a higher consumption of these foods. The foods that are the main contributors to dietary exposures to AFB1 and FB1 were also determined, as foods that may not have high concentrations may contribute to dietary exposure if they are staple foods in a diet. Finally, a comparison of dietary exposures to AFB1 and FB1 was made at the national and international levels to determine populations with high exposure to both mycotoxins. Much of the information for this evaluation was from the separate assessments for aflatoxins and fumonisins conducted by the Committee at the current meeting (see sections 3.1 and 3.3).
Foods with the highest concentrations of AFB1 are groundnuts, cereals (namely, sorghum, maize, rice and wheat), tree nuts and some spices. Foods with the highest concentrations of FB1 are maize and maize products.
Based on consumption data from the GEMS/Food cluster diets, the highest consumption of maize and maize flour is from clusters G13, G03, G06, G16 and G05 (highest to lowest). These clusters include primarily African countries, but also some from central areas in the Americas (e.g. Guatemala, Mexico). The highest consumption of groundnuts (with shell, shelled and prepared) is found for clusters G16, G09, G13 and G03 (highest to lowest). These clusters include

129
Contaminants
African countries except cluster G09, which is mainly Asian countries. High consumption of both maize and groundnuts is seen in clusters G13, G03 and G16 (highest to lowest).
At the national and international levels, the main foods contributing to dietary exposure to AFB1 are cereals and cereal-based products (namely, maize, rice, wheat and sorghum), peanuts and spices. The main foods contributing to FB1 exposure were maize and maize-based products.
From the international estimates of dietary exposure, the two clusters with the highest dietary exposures to both AFB1 and FB1 were G05 (including Guatemala and Mexico) and G13 (which is made up of African countries) (Table 12). LB mean AFB1 exposures were over 7 ng/kg bw per day, and LB mean FB1 exposures were over 400 ng/kg bw per day for these clusters.
National estimates of dietary exposure were limited to 12 countries that had estimates for both AFB1 and FB1. Of these 12 countries, four countries had LB mean exposures to AFB1 over 2 ng/kg bw per day and LB mean exposures to FB1 over 100 ng/kg bw per day. These were Burkina Faso (adult women), Cyprus (adolescents), Italy (toddlers, children and adolescents) and the USA (children less than 6 years of age). From the literature where the same study included exposures for both AFB1 and FB1, there were estimates from three countries (France, Spain and China). Only the estimated exposures from China were high, with LB mean AFB1 exposure of 6.7 ng/kg bw per day and with LB mean FB1 exposures over 1500 ng/kg bw per day (20).
The Committee also reviewed the co-exposure for infants based on reports in the literature of detection of both aflatoxins and fumonisins in human breast milk. Contamination with AFM1 was also included in this part of the evaluation, given that this is the aflatoxin metabolite found in milk as a result of dietary exposure to aflatoxins in the mother.
Only one study has been identified that shows detectable concentrations of FB1 in human breast milk. This study (21), conducted in the United Republic of Tanzania, showed detectable concentrations of FB1 in 44% of 131 samples, with a concentration range of 6.5–472 µg/kg. The authors estimated dietary exposures to FB1 based on a consumption of 500 mL of breast milk per day, at a median of 3000 ng/kg bw per day (range 780–65 000 ng/kg bw per day). AFM1 was detected in all 143 breast milk samples from the United Republic of Tanzania, with a median concentration of 0.07 µg/kg (range 0.01–0.55 µg/kg) (22). This indicates the potential for co-exposure to aflatoxins and fumonisins for breastfed infants; however, the Committee considered the method used in the Magoha et al. (21) study to quantify the FB1 in breast milk to be inadequate for this matrix (see section 3.3).

130
Joint FAO/WHO Expert Committee on Food Additives Eighty-third report W
HO
Tec
hnic
al R
epor
t Ser
ies,
No.
100
2, 2
017
Tabl
e 12
Estim
ated
mea
n pe
r cap
ita d
ieta
ry ex
posu
res t
o AF
B 1 and
FB1 es
timat
ed b
y the
Com
mitt
ee
Myc
otox
in Sc
enar
ioEs
timat
ed di
etar
y exp
osur
e for
GEM
S/Fo
od cl
uste
rs (n
g/kg
bw pe
r day
)a,b
G01
G02
G03
G04
G05
G06
G07
G08
G09
G10
G11
G12
G13
G14
G15
G16
G17
AFB 1
LB3.0
2.66.5
5.17.
15.8
1.30.3
4.41.2
1.24.4
31.6
7.1
1.54.1
3.1UB
7.36.7
8.69.1
10.8
11.4
1.71.3
7.33.9
3.57.2
34.8
10.2
7.05.6
5.1FB
1LB
131
176
341
197
556
190
124
612
5843
029
640
247
7422
416
6UB
481
534
547
564
935
605
500
551
307
303
649
648
664
408
1150
397
390
LB: lo
wer b
ound
, whe
re no
t det
ecte
d con
cent
ratio
ns w
ere a
ssign
ed a
conc
entra
tion o
f zer
o; UB
: upp
er bo
und,
wher
e not
dete
cted c
once
ntra
tions
wer
e assi
gned
a co
ncen
tratio
n equ
al to
the L
OD/LO
Q.a B
ased
on co
ncen
tratio
n dat
a fro
m th
e GEM
S/Fo
od co
ntam
inant
s dat
abas
e and
cons
umpt
ion da
ta fr
om th
e GEM
S/Fo
od cl
uste
r diet
s.b B
old ty
pefac
e ind
icate
s the
thre
e clus
ters
with
the h
ighes
t diet
ary e
xpos
ure t
o eac
h of A
FB1 an
d FB 1 at
the L
B.
131
Contaminants
There was no co-occurrence of AFM1 and FB1 or AFB1 and FB1 in infant formula from data in the GEMS/Food contaminants database, because there were no detections of FB1 in infant formula. There were no papers identified in the literature reporting FB1 levels in infant formula. Therefore, there is no indication that there would be co-exposure to aflatoxins and fumonisins from infant formula.
Infant foods, primarily those that are cereal based, are consumed by infants under 12 months of age; at the same time, infants may also be consuming breast milk and/or infant formula. AFB1 and FB1 have been detected in foods for infants, including cereal-based foods and meals for infants. This is the case from the GEMS/Food contaminants database and the literature. This includes staple maize-based foods for infants from Africa, where consumption of these foods resulted in estimated dietary exposures to total aflatoxins of 1–786 ng/kg bw per day, to total fumonisins of 190–26 300 ng/kg bw per day (23), to total aflatoxins of 0.14–120 ng/kg bw per day and to total fumonisins of 5–880 ng/kg bw per day (24). Therefore, there can be co-exposure to aflatoxins and fumonisins in the diet of infants from infant foods.
Evaluation Fumonisins and aflatoxins are both frequent contaminants in cereals and cereal-based foods. Aflatoxins are common contaminants in groundnuts and tree nuts. Co-exposure to both mycotoxins is likely in areas where these foods are regularly consumed.
From the international estimates of dietary exposure, two GEMS/Food clusters (G05 and G13) have high dietary exposure to both AFB1 and FB1. The countries (Guatemala and the United Republic of Tanzania) where co-exposure has been confirmed using urinary or plasma exposure biomarkers of FB1 and AFB1 belong to these two clusters. Although evidence in laboratory animals from the previous and the present evaluations has suggested an additive or synergistic effect of fumonisin and aflatoxin co-exposure in the development of preneoplastic lesions or hepatocellular carcinoma, currently no data are available on such effects in humans.
Two prospective epidemiological studies do not support the hypothesis of an interaction between aflatoxins and fumonisins in childhood stunting.
The Committee concluded that there are few data available to support co-exposure as a contributing factor in human disease. However, the interaction between AFB1, a compound with known genotoxic properties, and fumonisins, which have the potential to induce regenerative cell proliferation (particularly at exposures above the PMTDI), remains a concern. This is due to the fact that the

132
Joint FAO/WHO Expert Committee on Food Additives Eighty-third report W
HO
Tec
hnic
al R
epor
t Ser
ies,
No.
100
2, 2
017
incidences of chronic liver disease and stunting are high in the areas of the world where the exposures to both mycotoxins are high and the co-exposure has been confirmed with biomarkers.
RecommendationsThere is a need to reduce human exposure to aflatoxins and fumonisins, alone or in combination, in particular in developing countries.
With regards to human studies, the emphasis should be on biomarker-based approaches. Biomarker-based studies in high-risk areas should include attempts to characterize the health issues common in individuals within communities where exposure is high, which can be compared with similar communities where exposure is low.
Experimental animal feeding studies should also use biomarker-based approaches and should be designed with multiple dose levels that reflect the levels of contamination seen in areas at high risk for co-exposure.
A monograph was prepared.
References1. Mitchell NJ, Xue KS, Lin S, Marroquin-Cardona A, Brown KA, Elmore SE et al. Calcium montmorillonite clay reduces AFB1 and
FB1 biomarkers in rats exposed to single and co-exposures of aflatoxin and fumonisin. J Appl Toxicol. 2014;34:795–804.2. Carlson DB, Williams DE, Spitsbergen JM, Ross PF, Bacon CW, Meredith FI et al. Fumonisin B1 promotes aflatoxin B1 and
N-methyl-N′-nitro-nitrosoguanidine initiated liver tumors in rainbow trout. Toxicol Appl Pharmacol. 2001;172:29–36.3. Gelderblom WCA, Marasas WFO, Lebepe-Mazure S, Swanevelder S, Vessey CJ, Hall P de la M. Interaction of fumonisin B1 and
aflatoxin B1 in a short-term carcinogenesis model in rat liver. Toxicology. 2002;171:161–73.4. Espaillat MP, Shamseddine AA, Adada MM, Hannun YA, Obeid LM. Ceramide and sphingosine-1-phosphate in cancer, two
faces of the sphinx. Transl Cancer Res. 2015;4:484–99.5. Reimann CM, Thuy AV, Weigel C, Gräler MH. Sphingosine-1-phosphate (S1P) in cancer immunity and development. Transl
Cancer Res. 2015;4:460–8.6. Suh JH, Saba JD. Sphingosine-1-phosphate in inflammatory bowel disease and colitis-associated colon cancer: the fat’s in
the fire. Transl Cancer Res. 2015;4:469–83.7. Pewzner-Jung Y, Park H, Laviad EL, Silva LC, Lahiri S, Stiban J et al. A critical role for ceramide synthase 2 in liver homeostasis:
I. Alterations in lipid metabolic pathways. J Biol Chem. 2010;285:10902–10.8. Pewzner-Jung Y, Brenner O, Braun S, Laviad EL, Ben-Dor S, Feldmesser E et al. A critical role for ceramide synthase 2 in liver
homeostasis: II. Insights into molecular changes leading to hepatopathy. J Biol Chem. 2010;285:10911–23. 9. Abbès S, Salah-Abbès JB, Jebali R, Younes RB, Oueslati R. Interaction of aflatoxin B1 and fumonisin B1 in mice causes
immunotoxicity and oxidative stress: possible protective role using lactic acid bacteria. J Immunotoxicol. 2016;13(1):46–54.10. Qian G, Lili L, Shuhan L, Xue KS, Mitchell NJ, Su J et al. Sequential dietary exposure to aflatoxin B1 and fumonisin B1 in F344
rats increases preneoplastic changes indicative of a synergistic interaction. Food Chem Toxicol. 2016;95:188–95.11. Theumer MG, Canepa MC, Lopez AG, Mary VS, Dambolena JS, Rubinstein HR. Subchronic mycotoxicoses in Wistar rats:
assessment of the in vivo and in vitro genotoxicity induced by fumonisins and aflatoxin B1, and oxidative stress biomarkers status. Toxicology. 2010;268:104–10.
12. Siloto EV, Oliveira EFA, Sartori JR, Fascina VB, Martins BAB, Ledoux DR et al. Lipid metabolism of commercial layers fed diets containing aflatoxin, fumonisin, and a binder. Poult Sci. 2013;92:2077–83.

133
Contaminants
13. Chou T-C. Drug combination studies and their synergy quantification using the Chou-Talalay method. Cancer Res. 2010;70:440–6.
14. Mary VS, Theumer MG, Arias SL, Rubinstein HR. Reactive oxygen species sources and biomolecular oxidative damage induced by aflatoxin B1 and fumonisin B1 in rat spleen mononuclear cells. Toxicology. 2012;302:299–307.
15. Mary VS, Valdehita A, Navas JM, Rubinstein HR, Fernandez-Cruz ML. Effects of aflatoxin B1, fumonisin B1 and their mixture on the aryl hydrocarbon receptor and cytochrome P450 1A induction. Food Chem Toxicol. 2015;75:104–11.
16. Torres O, Matute J, Gelineau-van Waes J, Maddox JR, Gregory SG, Ashley-Koch AE et al. Human health implications from co-exposure to aflatoxins and fumonisins in maize-based foods in Latin America: Guatemala as a case study. World Mycotoxin J. 2015;8(2):143–59.
17. Shirima CP, Kimanya ME, Kinabo JL, Routledge MN, Srey C, Wild CP et al. Dietary exposure to aflatoxin and fumonisin among Tanzanian children as determined using biomarkers of exposure. Mol Nutr Food Res. 2013;57(10):1874–81.
18. Shirima CP, Kimanya ME, Routledge MN, Srey C, Kinabo JL, Humpf HU et al. A prospective study of growth and biomarkers of exposure to aflatoxin and fumonisin during early childhood in Tanzania. Environ Health Perspect. 2015;23:173–8.
19. Magoha H, Kimanya M, De Meulenaer B, Roberfroid D, Lachat C, Kolsteren P. Risk of dietary exposure to aflatoxins and fumonisins in infants less than 6 months of age in Rombo, Northern Tanzania. J Matern Child Nutr. 2016;12:516–27.
20. Sun G, Wang S, Hu X, Su J, Zhang Y, Xie Y et al. Co-contamination of aflatoxin B1 and fumonisin B1 in food and human dietary exposure in three areas of China. Food Addit Contam Part A Chem Anal Control Expo Risk Assess. 2011;28:461–70.
21. Magoha H, De Meulenaer B, Kimanya M, Hipolite D, Lachat C, Kolsteren P. Fumonisin B1 contamination in breast milk and its exposure in infants under 6 months of age in Rombo, Northern Tanzania. Food Chem Toxicol. 2014;74:112–6.
22. Magoha H, Kimanya M, De Meulenaer B, Roberfroid D, Lachat C, Kolsteren P. Association between aflatoxin M1 exposure through breast milk and growth impairment in infants from Northern Tanzania. World Mycotoxin J. 2014;7(3):277–84.
23. Kimanya ME, Shirima CP, Magoha H, Shewiyo DH, De Meulenaer B, Kolsteren P et al. Co-exposures of aflatoxins with deoxynivalenol and fumonisins from maize based complementary foods in Rombo, Northern Tanzania. Food Control. 2014;41:76–81.
24. Magoha H, Kimanya M, De Meulenaer B, Roberfroid D, Lachat C, Kolsteren P. Risk of dietary exposure to aflatoxins and fumonisins in infants less than 6 months of age in Rombo, Northern Tanzania. J Matern Child Nutr. 2016;12:516–27.


135
4. Future work and recommendations
General considerationsConsiderations for dose–response modelling
Reiterating the recommendations of the seventy-second meeting of JECFA, the current Committee recommends that the JECFA Secretariat establish an expert working group to develop detailed guidance for the application of the methods most suitable to the work of the Committee. The working group should, inter alia, address the following aspects:
■ the use of constraints when fitting models that allow for restrictions on the slope and/or power parameters modelling (i.e. the use of restricted versus unrestricted models);
■ models to be used from the standard BMDS suite; ■ the use of model averaging, including selection of weights; ■ the use of non-parametric methods as an alternative for dose–
response risk assessment; ■ the use of biological information for the selection and specification of
models for dose–response; ■ transparent presentation of modelling outcomes in JECFA
publications; ■ review of developments in the USEPA BMDS software.
Handling non-detected or non-quantified analytical results for food chemicals
The Committee discussed a proposal regarding guidance on how to handle left-censored data in its evaluations. However, owing to the importance of this topic, the Committee decided that further considerations were required. These discussions will be continued after the meeting through a working group.
Contaminants4,15-Diacetoxyscirpenol
The Committee was made aware of new toxicity studies on T-2/HT-2 toxin and therefore recommends an update of the 2001 JECFA evaluation of T-2/HT-2 toxin.


137
AcknowledgementsThe Committee wishes to thank Ms M. Sheffer, Ottawa, Canada, for her assistance in the preparation of the report. FAO and WHO wish to acknowledge the significant contributions of the experts, as well as their institutions (where relevant), to the work of the eighty-third meeting of JECFA.


139
Annex 1
Reports and other documents resulting from previous meetings of the Joint FAO/WHO Expert Committee on Food Additives
1. General principles governing the use of food additives (First report of the Joint FAO/WHO Expert Committee on Food Additives). FAO Nutrition Meetings Report Series, No. 15, 1957; WHO Technical Report Series, No. 129, 1957 (out of print).
2. Procedures for the testing of intentional food additives to establish their safety for use (Second report of the Joint FAO/WHO Expert Committee on Food Additives). FAO Nutrition Meetings Report Series, No. 17, 1958; WHO Technical Report Series, No. 144, 1958 (out of print).
3. Specifications for identity and purity of food additives (antimicrobial preservatives and antioxidants) (Third report of the Joint FAO/WHO Expert Committee on Food Additives). These specifications were subsequently revised and published as Specifications for identity and purity of food additives, Vol. I. Antimicrobial preservatives and antioxidants, Rome, Food and Agriculture Organization of the United Nations, 1962 (out of print).
4. Specifications for identity and purity of food additives (food colours) (Fourth report of the Joint FAO/WHO Expert Committee on Food Additives). These specifications were subsequently revised and published as Specifications for identity and purity of food additives, Vol. II. Food colours, Rome, Food and Agriculture Organization of the United Nations, 1963 (out of print).
5. Evaluation of the carcinogenic hazards of food additives (Fifth report of the Joint FAO/WHO Expert Committee on Food Additives). FAO Nutrition Meetings Report Series, No. 29, 1961; WHO Technical Report Series, No. 220, 1961 (out of print).
6. Evaluation of the toxicity of a number of antimicrobials and antioxidants (Sixth report of the Joint FAO/WHO Expert Committee on Food Additives). FAO Nutrition Meetings Report Series, No. 31, 1962; WHO Technical Report Series, No. 228, 1962 (out of print).
7. Specifications for the identity and purity of food additives and their toxicological evaluation: emulsifiers, stabilizers, bleaching and maturing agents (Seventh report of the Joint FAO/WHO Expert Committee on Food Additives). FAO Nutrition Meetings Series, No. 35, 1964; WHO Technical Report Series, No. 281, 1964 (out of print).
8. Specifications for the identity and purity of food additives and their toxicological evaluation: food colours and some antimicrobials and antioxidants (Eighth report of the Joint FAO/WHO Expert Committee on Food Additives). FAO Nutrition Meetings Series, No. 38, 1965; WHO Technical Report Series, No. 309, 1965 (out of print).
9. Specifications for identity and purity and toxicological evaluation of some antimicrobials and antioxidants. FAO Nutrition Meetings Report Series, No. 38A, 1965; WHO/Food Add/24.65 (out of print).
10. Specifications for identity and purity and toxicological evaluation of food colours. FAO Nutrition Meetings Report Series, No. 38B, 1966; WHO/Food Add/66.25.
11. Specifications for the identity and purity of food additives and their toxicological evaluation: some antimicrobials, antioxidants, emulsifiers, stabilizers, flour treatment agents, acids, and bases (Ninth report of the Joint FAO/WHO Expert Committee on Food Additives). FAO Nutrition Meetings Series, No. 40, 1966; WHO Technical Report Series, No. 339, 1966 (out of print).

140
Joint FAO/WHO Expert Committee on Food Additives Eighty-third report W
HO
Tec
hnic
al R
epor
t Ser
ies,
No.
100
2, 2
017
12. Toxicological evaluation of some antimicrobials, antioxidants, emulsifiers, stabilizers, flour treatment agents, acids, and bases. FAO Nutrition Meetings Report Series, No. 40A, B, C; WHO/Food Add/67.29.
13. Specifications for the identity and purity of food additives and their toxicological evaluation: some emulsifiers and stabilizers and certain other substances (Tenth report of the Joint FAO/WHO Expert Committee on Food Additives). FAO Nutrition Meetings Series, No. 43, 1967; WHO Technical Report Series, No. 373, 1967.
14. Specifications for the identity and purity of food additives and their toxicological evaluation: some flavouring substances and non-nutritive sweetening agents (Eleventh report of the Joint FAO/WHO Expert Committee on Food Additives). FAO Nutrition Meetings Series, No. 44, 1968; WHO Technical Report Series, No. 383, 1968.
15. Toxicological evaluation of some flavouring substances and non-nutritive sweetening agents. FAO Nutrition Meetings Report Series, No. 44A, 1968; WHO/Food Add/68.33.
16. Specifications and criteria for identity and purity of some flavouring substances and non-nutritive sweetening agents. FAO Nutrition Meetings Report Series, No. 44B, 1969; WHO/Food Add/69.31.
17. Specifications for the identity and purity of food additives and their toxicological evaluation: some antibiotics (Twelfth report of the Joint FAO/WHO Expert Committee on Food Additives). FAO Nutrition Meetings Series, No. 45, 1969; WHO Technical Report Series, No. 430, 1969.
18. Specifications for the identity and purity of some antibiotics. FAO Nutrition Meetings Series, No. 45A, 1969; WHO/Food Add/69.34.
19. Specifications for the identity and purity of food additives and their toxicological evaluation: some food colours, emulsifiers, stabilizers, anticaking agents, and certain other substances (Thirteenth report of the Joint FAO/WHO Expert Committee on Food Additives). FAO Nutrition Meetings Series, No. 46, 1970; WHO Technical Report Series, No. 445, 1970.
20. Toxicological evaluation of some food colours, emulsifiers, stabilizers, anticaking agents, and certain other substances. FAO Nutrition Meetings Report Series, No. 46A, 1970; WHO/Food Add/70.36.
21. Specifications for the identity and purity of some food colours, emulsifiers, stabilizers, anticaking agents, and certain other food additives. FAO Nutrition Meetings Report Series, No. 46B, 1970; WHO/Food Add/70.37.
22. Evaluation of food additives: specifications for the identity and purity of food additives and their toxicological evaluation: some extraction solvents and certain other substances; and a review of the technological efficacy of some antimicrobial agents (Fourteenth report of the Joint FAO/WHO Expert Committee on Food Additives). FAO Nutrition Meetings Series, No. 48, 1971; WHO Technical Report Series, No. 462, 1971.
23. Toxicological evaluation of some extraction solvents and certain other substances. FAO Nutrition Meetings Report Series, No. 48A, 1971; WHO/Food Add/70.39.
24. Specifications for the identity and purity of some extraction solvents and certain other substances. FAO Nutrition Meetings Report Series, No. 48B, 1971; WHO/Food Add/70.40.
25. A review of the technological efficacy of some antimicrobial agents. FAO Nutrition Meetings Report Series, No. 48C, 1971; WHO/Food Add/70.41.
26. Evaluation of food additives: some enzymes, modified starches, and certain other substances: Toxicological evaluations and specifications and a review of the technological efficacy of some

141
Annex 1
antioxidants (Fifteenth report of the Joint FAO/WHO Expert Committee on Food Additives). FAO Nutrition Meetings Series, No. 50, 1972; WHO Technical Report Series, No. 488, 1972.
27. Toxicological evaluation of some enzymes, modified starches, and certain other substances. FAO Nutrition Meetings Report Series, No. 50A, 1972; WHO Food Additives Series, No. 1, 1972.
28. Specifications for the identity and purity of some enzymes and certain other substances. FAO Nutrition Meetings Report Series, No. 50B, 1972; WHO Food Additives Series, No. 2, 1972.
29. A review of the technological efficacy of some antioxidants and synergists. FAO Nutrition Meetings Report Series, No. 50C, 1972; WHO Food Additives Series, No. 3, 1972.
30. Evaluation of certain food additives and the contaminants mercury, lead, and cadmium (Sixteenth report of the Joint FAO/WHO Expert Committee on Food Additives). FAO Nutrition Meetings Series, No. 51, 1972; WHO Technical Report Series, No. 505, 1972, and corrigendum.
31. Evaluation of mercury, lead, cadmium and the food additives amaranth, diethylpyrocarbamate, and octyl gallate. FAO Nutrition Meetings Report Series, No. 51A, 1972; WHO Food Additives Series, No. 4, 1972.
32. Toxicological evaluation of certain food additives with a review of general principles and of specifications (Seventeenth report of the Joint FAO/WHO Expert Committee on Food Additives). FAO Nutrition Meetings Series, No. 53, 1974; WHO Technical Report Series, No. 539, 1974, and corrigendum (out of print).
33. Toxicological evaluation of some food additives including anticaking agents, antimicrobials, antioxidants, emulsifiers, and thickening agents. FAO Nutrition Meetings Report Series, No. 53A, 1974; WHO Food Additives Series, No. 5, 1974.
34. Specifications for identity and purity of thickening agents, anticaking agents, antimicrobials, antioxidants and emulsifiers. FAO Food and Nutrition Paper, No. 4, 1978.
35. Evaluation of certain food additives (Eighteenth report of the Joint FAO/WHO Expert Committee on Food Additives). FAO Nutrition Meetings Series, No. 54, 1974; WHO Technical Report Series, No. 557, 1974, and corrigendum.
36. Toxicological evaluation of some food colours, enzymes, flavour enhancers, thickening agents, and certain other food additives. FAO Nutrition Meetings Report Series, No. 54A, 1975; WHO Food Additives Series, No. 6, 1975.
37. Specifications for the identity and purity of some food colours, enhancers, thickening agents, and certain food additives. FAO Nutrition Meetings Report Series, No. 54B, 1975; WHO Food Additives Series, No. 7, 1975.
38. Evaluation of certain food additives: some food colours, thickening agents, smoke condensates, and certain other substances (Nineteenth report of the Joint FAO/WHO Expert Committee on Food Additives). FAO Nutrition Meetings Series, No. 55, 1975; WHO Technical Report Series, No. 576, 1975.
39. Toxicological evaluation of some food colours, thickening agents, and certain other substances. FAO Nutrition Meetings Report Series, No. 55A, 1975; WHO Food Additives Series, No. 8, 1975.
40. Specifications for the identity and purity of certain food additives. FAO Nutrition Meetings Report Series, No. 55B, 1976; WHO Food Additives Series, No. 9, 1976.

142
Joint FAO/WHO Expert Committee on Food Additives Eighty-third report W
HO
Tec
hnic
al R
epor
t Ser
ies,
No.
100
2, 2
017
41. Evaluation of certain food additives (Twentieth report of the Joint FAO/WHO Expert Committee on Food Additives). FAO Food and Nutrition Meetings Series, No. 1, 1976; WHO Technical Report Series, No. 599, 1976.
42. Toxicological evaluation of certain food additives. WHO Food Additives Series, No. 10, 1976.
43. Specifications for the identity and purity of some food additives. FAO Food and Nutrition Series, No. 1B, 1977; WHO Food Additives Series, No. 11, 1977.
44. Evaluation of certain food additives (Twenty-first report of the Joint FAO/WHO Expert Committee on Food Additives). WHO Technical Report Series, No. 617, 1978.
45. Summary of toxicological data of certain food additives. WHO Food Additives Series, No. 12, 1977.
46. Specifications for identity and purity of some food additives, including antioxidants, food colours, thickeners, and others. FAO Nutrition Meetings Report Series, No. 57, 1977.
47. Evaluation of certain food additives and contaminants (Twenty-second report of the Joint FAO/WHO Expert Committee on Food Additives). WHO Technical Report Series, No. 631, 1978.
48. Summary of toxicological data of certain food additives and contaminants. WHO Food Additives Series, No. 13, 1978.
49. Specifications for the identity and purity of certain food additives. FAO Food and Nutrition Paper, No. 7, 1978.
50. Evaluation of certain food additives (Twenty-third report of the Joint FAO/WHO Expert Committee on Food Additives). WHO Technical Report Series, No. 648, 1980, and corrigenda.
51. Toxicological evaluation of certain food additives. WHO Food Additives Series, No. 14, 1980.
52. Specifications for identity and purity of food colours, flavouring agents, and other food additives. FAO Food and Nutrition Paper, No. 12, 1979.
53. Evaluation of certain food additives (Twenty-fourth report of the Joint FAO/WHO Expert Committee on Food Additives). WHO Technical Report Series, No. 653, 1980.
54. Toxicological evaluation of certain food additives. WHO Food Additives Series, No. 15, 1980.
55. Specifications for identity and purity of food additives (sweetening agents, emulsifying agents, and other food additives). FAO Food and Nutrition Paper, No. 17, 1980.
56. Evaluation of certain food additives (Twenty-fifth report of the Joint FAO/WHO Expert Committee on Food Additives). WHO Technical Report Series, No. 669, 1981.
57. Toxicological evaluation of certain food additives. WHO Food Additives Series, No. 16, 1981.
58. Specifications for identity and purity of food additives (carrier solvents, emulsifiers and stabilizers, enzyme preparations, flavouring agents, food colours, sweetening agents, and other food additives). FAO Food and Nutrition Paper, No. 19, 1981.
59. Evaluation of certain food additives and contaminants (Twenty-sixth report of the Joint FAO/WHO Expert Committee on Food Additives). WHO Technical Report Series, No. 683, 1982.
60. Toxicological evaluation of certain food additives. WHO Food Additives Series, No. 17, 1982.
61. Specifications for the identity and purity of certain food additives. FAO Food and Nutrition Paper, No. 25, 1982.
143
Annex 1
62. Evaluation of certain food additives and contaminants (Twenty-seventh report of the Joint FAO/WHO Expert Committee on Food Additives). WHO Technical Report Series, No. 696, 1983, and corrigenda.
63. Toxicological evaluation of certain food additives and contaminants. WHO Food Additives Series, No. 18, 1983.
64. Specifications for the identity and purity of certain food additives. FAO Food and Nutrition Paper, No. 28, 1983.
65. Guide to specifications – General notices, general methods, identification tests, test solutions, and other reference materials. FAO Food and Nutrition Paper, No. 5, Rev. 1, 1983.
66. Evaluation of certain food additives and contaminants (Twenty-eighth report of the Joint FAO/WHO Expert Committee on Food Additives). WHO Technical Report Series, No. 710, 1984, and corrigendum.
67. Toxicological evaluation of certain food additives and contaminants. WHO Food Additives Series, No. 19, 1984.
68. Specifications for the identity and purity of food colours. FAO Food and Nutrition Paper, No. 31/1, 1984.
69. Specifications for the identity and purity of food additives. FAO Food and Nutrition Paper, No. 31/2, 1984.
70. Evaluation of certain food additives and contaminants (Twenty-ninth report of the Joint FAO/WHO Expert Committee on Food Additives). WHO Technical Report Series, No. 733, 1986, and corrigendum.
71. Specifications for the identity and purity of certain food additives. FAO Food and Nutrition Paper, No. 34, 1986.
72. Toxicological evaluation of certain food additives and contaminants. WHO Food Additives Series, No. 20. Cambridge University Press, 1987.
73. Evaluation of certain food additives and contaminants (Thirtieth report of the Joint FAO/WHO Expert Committee on Food Additives). WHO Technical Report Series, No. 751, 1987.
74. Toxicological evaluation of certain food additives and contaminants. WHO Food Additives Series, No. 21. Cambridge University Press, 1987.
75. Specifications for the identity and purity of certain food additives. FAO Food and Nutrition Paper, No. 37, 1986.
76. Principles for the safety assessment of food additives and contaminants in food. WHO Environmental Health Criteria, No. 70. Geneva, World Health Organization, 1987 (out of print). The full text is available electronically at www.who.int/pcs.
77. Evaluation of certain food additives and contaminants (Thirty-first report of the Joint FAO/WHO Expert Committee on Food Additives). WHO Technical Report Series, No. 759, 1987, and corrigendum.
78. Toxicological evaluation of certain food additives. WHO Food Additives Series, No. 22. Cambridge University Press, 1988.
79. Specifications for the identity and purity of certain food additives. FAO Food and Nutrition Paper, No. 38, 1988.
80. Evaluation of certain veterinary drug residues in food (Thirty-second report of the Joint FAO/WHO Expert Committee on Food Additives). WHO Technical Report Series, No. 763, 1988.

144
Joint FAO/WHO Expert Committee on Food Additives Eighty-third report W
HO
Tec
hnic
al R
epor
t Ser
ies,
No.
100
2, 2
017
81. Toxicological evaluation of certain veterinary drug residues in food. WHO Food Additives Series, No. 23. Cambridge University Press, 1988.
82. Residues of some veterinary drugs in animals and foods. FAO Food and Nutrition Paper, No. 41, 1988.
83. Evaluation of certain food additives and contaminants (Thirty-third report of the Joint FAO/WHO Expert Committee on Food Additives). WHO Technical Report Series, No. 776, 1989.
84. Toxicological evaluation of certain food additives and contaminants. WHO Food Additives Series, No. 24. Cambridge University Press, 1989.
85. Evaluation of certain veterinary drug residues in food (Thirty-fourth report of the Joint FAO/WHO Expert Committee on Food Additives). WHO Technical Report Series, No. 788, 1989.
86. Toxicological evaluation of certain veterinary drug residues in food. WHO Food Additives Series, No. 25, 1990.
87. Residues of some veterinary drugs in animals and foods. FAO Food and Nutrition Paper, No. 41/2, 1990.
88. Evaluation of certain food additives and contaminants (Thirty-fifth report of the Joint FAO/WHO Expert Committee on Food Additives). WHO Technical Report Series, No. 789, 1990, and corrigenda.
89. Toxicological evaluation of certain food additives and contaminants. WHO Food Additives Series, No. 26, 1990.
90. Specifications for identity and purity of certain food additives. FAO Food and Nutrition Paper, No. 49, 1990.
91. Evaluation of certain veterinary drug residues in food (Thirty-sixth report of the Joint FAO/WHO Expert Committee on Food Additives). WHO Technical Report Series, No. 799, 1990.
92. Toxicological evaluation of certain veterinary drug residues in food. WHO Food Additives Series, No. 27, 1991.
93. Residues of some veterinary drugs in animals and foods. FAO Food and Nutrition Paper, No. 41/3, 1991.
94. Evaluation of certain food additives and contaminants (Thirty-seventh report of the Joint FAO/WHO Expert Committee on Food Additives). WHO Technical Report Series, No. 806, 1991, and corrigenda.
95. Toxicological evaluation of certain food additives and contaminants. WHO Food Additives Series, No. 28, 1991.
96. Compendium of food additive specifications (Joint FAO/WHO Expert Committee on Food Additives (JECFA)). Combined specifications from 1st through the 37th meetings, 1956–1990. Rome, Food and Agriculture Organization of the United Nations, 1992 (2 volumes).
97. Evaluation of certain veterinary drug residues in food (Thirty-eighth report of the Joint FAO/WHO Expert Committee on Food Additives). WHO Technical Report Series, No. 815, 1991.
98. Toxicological evaluation of certain veterinary drug residues in food. WHO Food Additives Series, No. 29, 1991.
99. Residues of some veterinary drugs in animals and foods. FAO Food and Nutrition Paper, No. 41/4, 1991.
100. Guide to specifications – General notices, general analytical techniques, identification tests, test solutions, and other reference materials. FAO Food and Nutrition Paper, No. 5, Rev. 2, 1991.
101. Evaluation of certain food additives and naturally occurring toxicants (Thirty-ninth report of the Joint FAO/WHO Expert Committee on Food Additives). WHO Technical Report Series, No. 828, 1992.
145
Annex 1
102. Toxicological evaluation of certain food additives and naturally occurring toxicants. WHO Food Additives Series, No. 30, 1993.
103. Compendium of food additive specifications: addendum 1. FAO Food and Nutrition Paper, No. 52, 1992.
104. Evaluation of certain veterinary drug residues in food (Fortieth report of the Joint FAO/WHO Expert Committee on Food Additives). WHO Technical Report Series, No. 832, 1993.
105. Toxicological evaluation of certain veterinary drug residues in food. WHO Food Additives Series, No. 31, 1993.
106. Residues of some veterinary drugs in animals and food. FAO Food and Nutrition Paper, No. 41/5, 1993.
107. Evaluation of certain food additives and contaminants (Forty-first report of the Joint FAO/WHO Expert Committee on Food Additives). WHO Technical Report Series, No. 837, 1993.
108. Toxicological evaluation of certain food additives and contaminants. WHO Food Additives Series, No. 32, 1993.
109. Compendium of food additive specifications: addendum 2. FAO Food and Nutrition Paper, No. 52, Add. 2, 1993.
110. Evaluation of certain veterinary drug residues in food (Forty-second report of the Joint FAO/WHO Expert Committee on Food Additives). WHO Technical Report Series, No. 851, 1995.
111. Toxicological evaluation of certain veterinary drug residues in food. WHO Food Additives Series, No. 33, 1994.
112. Residues of some veterinary drugs in animals and foods. FAO Food and Nutrition Paper, No. 41/6, 1994.
113. Evaluation of certain veterinary drug residues in food (Forty-third report of the Joint FAO/WHO Expert Committee on Food Additives). WHO Technical Report Series, No. 855, 1995, and corrigendum.
114. Toxicological evaluation of certain veterinary drug residues in food. WHO Food Additives Series, No. 34, 1995.
115. Residues of some veterinary drugs in animals and foods. FAO Food and Nutrition Paper, No. 41/7, 1995.
116. Evaluation of certain food additives and contaminants (Forty-fourth report of the Joint FAO/WHO Expert Committee on Food Additives). WHO Technical Report Series, No. 859, 1995.
117. Toxicological evaluation of certain food additives and contaminants. WHO Food Additives Series, No. 35, 1996.
118. Compendium of food additive specifications: addendum 3. FAO Food and Nutrition Paper, No. 52, Add. 3, 1995.
119. Evaluation of certain veterinary drug residues in food (Forty-fifth report of the Joint FAO/WHO Expert Committee on Food Additives). WHO Technical Report Series, No. 864, 1996.
120. Toxicological evaluation of certain veterinary drug residues in food. WHO Food Additives Series, No. 36, 1996.
121. Residues of some veterinary drugs in animals and foods. FAO Food and Nutrition Paper, No. 41/8, 1996.
122. Evaluation of certain food additives and contaminants (Forty-sixth report of the Joint FAO/WHO Expert Committee on Food Additives). WHO Technical Report Series, No. 868, 1997.
123. Toxicological evaluation of certain food additives. WHO Food Additives Series, No. 37, 1996.

146
Joint FAO/WHO Expert Committee on Food Additives Eighty-third report W
HO
Tec
hnic
al R
epor
t Ser
ies,
No.
100
2, 2
017
124. Compendium of food additive specifications, addendum 4. FAO Food and Nutrition Paper, No. 52, Add. 4, 1996.
125. Evaluation of certain veterinary drug residues in food (Forty-seventh report of the Joint FAO/WHO Expert Committee on Food Additives). WHO Technical Report Series, No. 876, 1998.
126. Toxicological evaluation of certain veterinary drug residues in food. WHO Food Additives Series, No. 38, 1996.
127. Residues of some veterinary drugs in animals and foods. FAO Food and Nutrition Paper, No. 41/9, 1997.
128. Evaluation of certain veterinary drug residues in food (Forty-eighth report of the Joint FAO/WHO Expert Committee on Food Additives). WHO Technical Report Series, No. 879, 1998.
129. Toxicological evaluation of certain veterinary drug residues in food. WHO Food Additives Series, No. 39, 1997.
130. Residues of some veterinary drugs in animals and foods. FAO Food and Nutrition Paper, No. 41/10, 1998.
131. Evaluation of certain food additives and contaminants (Forty-ninth report of the Joint FAO/WHO Expert Committee on Food Additives). WHO Technical Report Series, No. 884, 1999.
132. Safety evaluation of certain food additives and contaminants. WHO Food Additives Series, No. 40, 1998.
133. Compendium of food additive specifications: addendum 5. FAO Food and Nutrition Paper, No. 52, Add. 5, 1997.
134. Evaluation of certain veterinary drug residues in food (Fiftieth report of the Joint FAO/WHO Expert Committee on Food Additives). WHO Technical Report Series, No. 888, 1999.
135. Toxicological evaluation of certain veterinary drug residues in food. WHO Food Additives Series, No. 41, 1998.
136. Residues of some veterinary drugs in animals and foods. FAO Food and Nutrition Paper, No. 41/11, 1999.
137. Evaluation of certain food additives (Fifty-first report of the Joint FAO/WHO Expert Committee on Food Additives). WHO Technical Report Series, No. 891, 2000.
138. Safety evaluation of certain food additives. WHO Food Additives Series, No. 42, 1999.
139. Compendium of food additive specifications, addendum 6. FAO Food and Nutrition Paper, No. 52, Add. 6, 1998.
140. Evaluation of certain veterinary drug residues in food (Fifty-second report of the Joint FAO/WHO Expert Committee on Food Additives). WHO Technical Report Series, No. 893, 2000.
141. Toxicological evaluation of certain veterinary drug residues in food. WHO Food Additives Series, No. 43, 2000.
142. Residues of some veterinary drugs in animals and foods. FAO Food and Nutrition Paper, No. 41/12, 2000.
143. Evaluation of certain food additives and contaminants (Fifty-third report of the Joint FAO/WHO Expert Committee on Food Additives). WHO Technical Report Series, No. 896, 2000.
144. Safety evaluation of certain food additives and contaminants. WHO Food Additives Series, No. 44, 2000.

147
Annex 1
145. Compendium of food additive specifications, addendum 7. FAO Food and Nutrition Paper, No. 52, Add. 7, 1999.
146. Evaluation of certain veterinary drug residues in food (Fifty-fourth report of the Joint FAO/WHO Expert Committee on Food Additives). WHO Technical Report Series, No. 900, 2001.
147. Toxicological evaluation of certain veterinary drug residues in food. WHO Food Additives Series, No. 45, 2000.
148. Residues of some veterinary drugs in animals and foods. FAO Food and Nutrition Paper, No. 41/13, 2000.
149. Evaluation of certain food additives and contaminants (Fifty-fifth report of the Joint FAO/WHO Expert Committee on Food Additives). WHO Technical Report Series, No. 901, 2001.
150. Safety evaluation of certain food additives and contaminants. WHO Food Additives Series, No. 46, 2001.
151. Compendium of food additive specifications: addendum 8. FAO Food and Nutrition Paper, No. 52, Add. 8, 2000.
152. Evaluation of certain mycotoxins in food (Fifty-sixth report of the Joint FAO/WHO Expert Committee on Food Additives). WHO Technical Report Series, No. 906, 2002.
153. Safety evaluation of certain mycotoxins in food. WHO Food Additives Series, No. 47/FAO Food and Nutrition Paper, No. 74, 2001.
154. Evaluation of certain food additives and contaminants (Fifty-seventh report of the Joint FAO/WHO Expert Committee on Food Additives). WHO Technical Report Series, No. 909, 2002.
155. Safety evaluation of certain food additives and contaminants. WHO Food Additives Series, No. 48, 2002.
156. Compendium of food additive specifications: addendum 9. FAO Food and Nutrition Paper, No. 52, Add. 9, 2001.
157. Evaluation of certain veterinary drug residues in food (Fifty-eighth report of the Joint FAO/WHO Expert Committee on Food Additives). WHO Technical Report Series, No. 911, 2002.
158. Toxicological evaluation of certain veterinary drug residues in food. WHO Food Additives Series, No. 49, 2002.
159. Residues of some veterinary drugs in animals and foods. FAO Food and Nutrition Paper, No. 41/14, 2002.
160. Evaluation of certain food additives and contaminants (Fifty-ninth report of the Joint FAO/WHO Expert Committee on Food Additives). WHO Technical Report Series, No. 913, 2002.
161. Safety evaluation of certain food additives and contaminants. WHO Food Additives Series, No. 50, 2003.
162. Compendium of food additive specifications: addendum 10. FAO Food and Nutrition Paper, No. 52, Add. 10, 2002.
163. Evaluation of certain veterinary drug residues in food (Sixtieth report of the Joint FAO/WHO Expert Committee on Food Additives). WHO Technical Report Series, No. 918, 2003.
164. Toxicological evaluation of certain veterinary drug residues in food. WHO Food Additives Series, No. 51, 2003.
165. Residues of some veterinary drugs in animals and foods. FAO Food and Nutrition Paper, No. 41/15, 2003.

148
Joint FAO/WHO Expert Committee on Food Additives Eighty-third report W
HO
Tec
hnic
al R
epor
t Ser
ies,
No.
100
2, 2
017
166. Evaluation of certain food additives and contaminants (Sixty-first report of the Joint FAO/WHO Expert Committee on Food Additives). WHO Technical Report Series, No. 922, 2004.
167. Safety evaluation of certain food additives and contaminants. WHO Food Additives Series, No. 52, 2004.
168. Compendium of food additive specifications: addendum 11. FAO Food and Nutrition Paper, No. 52, Add. 11, 2003.
169. Evaluation of certain veterinary drug residues in food (Sixty-second report of the Joint FAO/WHO Expert Committee on Food Additives). WHO Technical Report Series, No. 925, 2004.
170. Residues of some veterinary drugs in animals and foods. FAO Food and Nutrition Paper, No. 41/16, 2004.
171. Toxicological evaluation of certain veterinary drug residues in food. WHO Food Additives Series, No. 53, 2005.
172. Compendium of food additive specifications: addendum 12. FAO Food and Nutrition Paper, No. 52, Add. 12, 2004.
173. Evaluation of certain food additives (Sixty-third report of the Joint FAO/WHO Expert Committee on Food Additives). WHO Technical Report Series, No. 928, 2005.
174. Safety evaluation of certain food additives. WHO Food Additives Series, No. 54, 2005.
175. Compendium of food additive specifications: addendum 13. FAO Food and Nutrition Paper, No. 52, Add. 13 (with Errata), 2005.
176. Evaluation of certain food contaminants (Sixty-fourth report of the Joint FAO/WHO Expert Committee on Food Additives). WHO Technical Report Series, No. 930, 2005.
177. Safety evaluation of certain contaminants in food. WHO Food Additives Series, No. 55/FAO Food and Nutrition Paper, No. 82, 2006.
178. Evaluation of certain food additives (Sixty-fifth report of the Joint FAO/WHO Expert Committee on Food Additives). WHO Technical Report Series, No. 934, 2006.
179. Safety evaluation of certain food additives. WHO Food Additives Series, No. 56, 2006.
180. Combined compendium of food additive specifications. FAO JECFA Monographs 1, Volumes 1–4, 2005, 2006.
181. Evaluation of certain veterinary drug residues in food (Sixty-sixth report of the Joint FAO/WHO Expert Committee on Food Additives). WHO Technical Report Series, No. 939, 2006.
182. Residue evaluation of certain veterinary drugs. FAO JECFA Monographs 2, 2006.
183. Toxicological evaluation of certain veterinary drug residues in food. WHO Food Additives Series, No. 57, 2006.
184. Evaluation of certain food additives and contaminants (Sixty-seventh report of the Joint FAO/WHO Expert Committee on Food Additives). WHO Technical Report Series, No. 940, 2007.
185. Compendium of food additive specifications. FAO JECFA Monographs 3, 2006.
186. Safety evaluation of certain food additives and contaminants. WHO Food Additives Series, No. 58, 2007.
187. Evaluation of certain food additives and contaminants (Sixty-eighth report of the Joint FAO/WHO Expert Committee on Food Additives). WHO Technical Report Series, No. 947, 2007.

149
Annex 1
188. Safety evaluation of certain food additives and contaminants. WHO Food Additives Series, No. 59, 2008.
189. Compendium of food additive specifications. FAO JECFA Monographs 4, 2007.
190. Evaluation of certain food additives (Sixty-ninth report of the Joint FAO/WHO Expert Committee on Food Additives). WHO Technical Report Series, No. 952, 2009.
191. Safety evaluation of certain food additives. WHO Food Additives Series, No. 60, 2009.
192. Compendium of food additive specifications. FAO JECFA Monographs 5, 2009.
193. Evaluation of certain veterinary drug residues in food (Seventieth report of the Joint FAO/WHO Expert Committee on Food Additives). WHO Technical Report Series, No. 954, 2009.
194. Toxicological evaluation of certain veterinary drug residues in food. WHO Food Additives Series, No. 61, 2009.
195. Residue evaluation of certain veterinary drugs. FAO JECFA Monographs 6, 2009.
196. Evaluation of certain food additives (Seventy-first report of the Joint FAO/WHO Expert Committee on Food Additives). WHO Technical Report Series, No. 956, 2010.
197. Safety evaluation of certain food additives. WHO Food Additives Series, No. 62, 2010.
198. Compendium of food additive specifications. FAO JECFA Monographs 7, 2009.
199. Evaluation of certain contaminants in food (Seventy-second report of the Joint FAO/WHO Expert Committee on Food Additives). WHO Technical Report Series, No. 959, 2011.
200. Safety evaluation of certain contaminants in food. WHO Food Additives Series, No. 63/FAO JECFA Monographs 8, 2011.
201. Residue evaluation of certain veterinary drugs. FAO JECFA Monographs 9, 2010.
202. Evaluation of certain food additives and contaminants (Seventy-third report of the Joint FAO/WHO Expert Committee on Food Additives). WHO Technical Report Series, No. 960, 2011.
203. Safety evaluation of certain food additives and contaminants. WHO Food Additives Series, No. 64, 2011.
204. Compendium of food additive specifications. FAO JECFA Monographs 10, 2010.
205. Evaluation of certain food additives and contaminants (Seventy-fourth report of the Joint FAO/WHO Expert Committee on Food Additives). WHO Technical Report Series, No. 966, 2011.
206. Safety evaluation of certain food additives and contaminants. WHO Food Additives Series, No. 65, 2011.
207. Compendium of food additive specifications. FAO JECFA Monographs 11, 2011.
208. Evaluation of certain veterinary drug residues in food (Seventy-fifth report of the Joint FAO/WHO Expert Committee on Food Additives). WHO Technical Report Series, No. 969, 2012.
209. Toxicological evaluation of certain veterinary drug residues in food. WHO Food Additives Series, No. 66, 2012.
210. Residue evaluation of certain veterinary drugs. FAO JECFA Monographs 12, 2012.
211. Evaluation of certain food additives (Seventy-sixth report of the Joint FAO/WHO Expert Committee on Food Additives). WHO Technical Report Series, No. 974, 2012.
212. Safety evaluation of certain food additives. WHO Food Additives Series, No. 67, 2012.

150
WH
O T
echn
ical
Rep
ort S
erie
s, N
o. 1
002,
201
7Joint FAO/WHO Expert Committee on Food Additives Eighty-third report
213. Compendium of food additive specifications. FAO JECFA Monographs 13, 2012.
214. Evaluation of certain food additives and contaminants (Seventy-seventh report of the Joint FAO/WHO Expert Committee on Food Additives). WHO Technical Report Series, No. 983, 2013.
215. Safety evaluation of certain food additives and contaminants. WHO Food Additives Series, No. 68, 2013.
216. Compendium of food additive specifications. FAO JECFA Monographs 14, 2013.
217. Evaluation of certain veterinary drug residues in food (Seventy-eighth report of the Joint FAO/WHO Expert Committee on Food Additives). WHO Technical Report Series, No. 988, 2014.
218. Toxicological evaluation of certain veterinary drug residues in food. WHO Food Additives Series, No. 69, 2014.
219. Residue evaluation of certain veterinary drugs. FAO JECFA Monographs 15, 2014.
220. Evaluation of certain food additives (Seventy-ninth report of the Joint FAO/WHO Expert Committee on Food Additives). WHO Technical Report Series, No. 990, 2015.
221. Safety evaluation of certain food additives. WHO Food Additives Series, No. 70, 2015.
222. Compendium of food additive specifications. FAO JECFA Monographs 16, 2014.
223. Evaluation of certain food additives and contaminants (Eightieth report of the Joint FAO/WHO Expert Committee on Food Additives). WHO Technical Report Series, No. 995, 2016.
224. Safety evaluation of certain food additives and contaminants. WHO Food Additives Series, No. 71, 2015.
225. Compendium of food additive specifications. FAO JECFA Monographs 17, 2015.
226. Evaluation of certain veterinary drug residues in food (Eighty-first report of the Joint FAO/WHO Expert Committee on Food Additives). WHO Technical Report Series, No. 997, 2016.
227. Toxicological evaluation of certain veterinary drug residues in food. WHO Food Additives Series, No. 72, 2016.
228. Residue evaluation of certain veterinary drugs. FAO JECFA Monographs 18, 2016.
229. Safety evaluation of certain food additives and contaminants. Supplement 1: Non-dioxin-like polychlorinated biphenyls. WHO Food Additives Series, No. 71-1, 2016.
230. Evaluation of certain food additives (Eighty-second report of the Joint FAO/WHO Expert Committee on Food Additives). WHO Technical Report Series, No. 1000, 2016.
231. Compendium of food additive specifications. FAO JECFA Monographs 19, 2016.
232. Safety evaluation of certain food additives. WHO Food Additives Series, No. 73 (in preparation).

151
Annex 2
Toxicological and dietary exposure information on contaminants
Aflatoxins
Aspergillus flavus is a fungus that was first recognized to cause aflatoxicosis in domestic animals and is the most important aflatoxin-producing species in food on a global basis. It produces aflatoxin B1 (AFB1) and aflatoxin B2 (AFB2) and affects many commodities, but most human exposure comes from contaminated corn (also referred to as maize), peanuts (also referred to as groundnuts) and rice. Another important producer of aflatoxin, A. parasiticus, produces AFB1, AFB2, aflatoxin G1 (AFG1) and aflatoxin G2 (AFG2) and is primarily associated with peanuts in the Americas, but can also occur on corn, figs and pistachios. Of these four aflatoxins, AFB1 is most frequently present in contaminated samples; AFB2, AFG1 and AFG2 are generally not reported in the absence of AFB1. Aflatoxin M1 (AFM1) is the hydroxylated metabolite of AFB1; in areas of high aflatoxin exposure, humans are exposed to AFM1 more or less exclusively through milk and milk products, including breast milk. The aflatoxins were previously evaluated by JECFA at its thirty-first, forty-sixth, forty-ninth, fifty-sixth and sixty-eighth meetings. The Committee updated the aflatoxin risk assessment at the current meeting at the request of the Codex Committee on Contaminants in Foods (CCCF). The Committee reaffirmed the conclusions of the forty-ninth meeting of JECFA that aflatoxins are among the most potent mutagenic and carcinogenic substances known, based on studies in test species and human epidemiological studies, and that hepatitis B virus (HBV) infection is a critical contributor to the potency of aflatoxins in inducing liver cancer. The more recent information about human polymorphisms in metabolizing enzymes (e.g. cytochrome P450s, sulfotransferases) has described population variability in the balance between activation and detoxification processes for aflatoxins. This knowledge has been used in conjunction with biomarkers to evaluate the effectiveness of pharmacological and dietary interventions with the aim of reducing cancer risk. Increased reporting and identification of acute aflatoxicosis outbreaks, particularly in areas of Africa, led this Committee to consider the available data on acute exposure. Indeed, loss of lives attributed to aflatoxins was most recently reported in the United Republic of Tanzania during the summer of 2016. Ranges of AFB1 exposures between 20 and 120 µg/kg body weight (bw) per day for a period of 1–3 weeks or consumption of staple food containing concentrations of 1 mg/kg or higher would be suspected to cause acute aflatoxicosis and possibly
152
Joint FAO/WHO Expert Committee on Food Additives Eighty-third report W
HO
Tec
hnic
al R
epor
t Ser
ies,
No.
100
2, 2
017
death. The Committee did not assess acute dietary exposure, but noted that the estimates of chronic dietary exposure are at least 2–5 orders of magnitude lower than the doses associated with acute effects. Since the forty-ninth meeting of the Committee, epidemiological data have become available to support the hypothesis that aflatoxin exposure in utero and during early life has negative effects on growth; in particular, decreased height is the most frequently associated anthropometric parameter. The available data did not provide evidence for an exposure level at which there is a significant risk for growth faltering. The Committee considered that the development of analytical technologies based on aptamers may have relevance in remote areas, because of their inherent stability, ease of production and use. The Committee noted that there were limited contamination data from developing countries, which hindered a more comprehensive and global evaluation of aflatoxin occurrence and may have resulted in an underestimate of dietary exposure in these countries. Only five food commodities (maize, peanuts, rice, sorghum and wheat) each contribute more than 10% to international dietary exposure estimates for more than one Global Environment Monitoring System – Food Contamination Monitoring and Assessment Programme (GEMS/Food) cluster diet, for either total aflatoxins (AFT) or AFB1. The Committee noted that international dietary exposure estimates (AFT and AFB1) were generally higher than those reported at the sixty-eighth meeting. This was predominantly due to the availability of concentration data for rice, sorghum and wheat and their inclusion in the international dietary exposure estimates. Although overall concentrations of aflatoxins in rice and wheat are lower than concentrations in maize and groundnuts (a traditional focus for aflatoxin risk management), the high consumption of rice and wheat in some countries means that these cereals may account for up to 80% of dietary aflatoxin exposure for those GEMS/Food cluster diets. Mean AFB1 concentrations in sorghum from the GEMS/Food contaminants database are higher than those for maize; combined with high consumption levels of sorghum in some GEMS/Food clusters, this cereal contributes 16–59% of dietary exposure in six GEMS/Food clusters. The database on sorghum is considerably more limited than that on maize.
The Committee estimated the cancer potency per 100 000 population for exposure to AFB1 at 1 ng/kg bw per day. The resulting central estimates are 0.01 additional cancer cases per 100 000 for chronic hepatitis B virus surface antigen negative (HBsAg−) populations and 0.3 additional cancer cases per 100 000 for HBsAg+ populations. Upper-bound (UB) estimates are 0.049 additional cancer cases per 100 000 for HBsAg− populations and 0.562 additional cancer cases per 100 000 for HBsAg+ populations.

153
Annex 2
The Committee calculated global aflatoxin-related hepatocellular carcinoma (HCC) risk based on the new central and UB cancer potency estimates from the current dose–response analysis and international dietary exposures estimated at the current meeting. Aflatoxin-related cancer rates were calculated, accounting for prevalence of HBsAg positivity, by GEMS/Food clusters. The low end of the range refers to lower-bound (LB) estimates at the mean dietary AFB1 exposure, minimum HBsAg+ rates for countries in the cluster and the central cancer potency estimate. The high end of the range refers to UB estimates at the 90th percentile of dietary AFB1 exposure, maximum HBsAg+ rates for countries in the cluster and UB estimates of cancer potency. The lowest cancer risks were estimated for clusters G07 and G08 (European and other developed countries), with cancer risk estimates in the range <0.01–0.10 aflatoxin-induced cancers per year per 100 000 population, with wheat being the major contributing food commodity. For countries within these clusters, HBsAg+ rates were in the range 0.01–1.2%. The highest cancer risks were for cluster G13 (sub-Saharan African countries and Haiti), with cancer risk estimates in the range 0.21–3.94 aflatoxin-induced cancers per year per 100 000 population, with sorghum and maize being the major contributing food commodities. For countries within this cluster, HBsAg+ rates were in the range 5.2–19%. Other clusters with relatively high cancer risks were G03 (sub-Saharan African countries and Paraguay, with maize and sorghum being the major contributing food commodities), G05 (mainly Central and South American countries, with maize, rice, sorghum and wheat being the major contributing food commodities) and G16 (sub-Saharan African countries, with maize and sorghum being the major contributing food commodities). The Committee noted that the aflatoxin-related HCC risk rates calculated here are within the range of aflatoxin-related foodborne disease (HCC) incidences published by WHO. The Committee notes that a common background cancer rate was used in the cancer potency estimates. A sensitivity analysis showed that changing the background cancer rates has minimal impact on the analysis. Given the relative cancer potencies and international dietary exposure estimates for AFB1 and AFM1, AFM1 will generally make a negligible (<1%) contribution to aflatoxin-induced cancer risk for the general population. On request of the CCCF, the Committee performed an impact assessment of different MLs for ready-to-eat peanuts and concluded that enforcing a maximum limit (ML) of 10, 8 or 4 µg/kg for ready-to-eat peanuts would have little further impact on dietary exposure to AFT for the general population, compared with setting an ML of 15 µg/kg. At an ML of 4 µg/kg, the proportion of the world market of ready-to-eat peanuts rejected would be approximately double the proportion rejected at an ML of 15 µg/kg (about 20% versus 10%).

154
Joint FAO/WHO Expert Committee on Food Additives Eighty-third report W
HO
Tec
hnic
al R
epor
t Ser
ies,
No.
100
2, 2
017
Diacetoxyscirpenol
4,15-Diacetoxyscirpenol (4,15-DAS; (3α,4β)-3-hydroxy-12,13-epoxytricothec-9-ene-4,15-diyl diacetate; Chemical Abstracts Service [CAS] number 2270-40-8) or anguidine is a trichothecene mycotoxin. All trichothecenes have the same core 12,13-epoxytrichothec-9-ene structure, and trichothecene analogues have different patterns of substitution around this core structure. 4,15-DAS is a type A trichothecene, with similar structure to T-2 toxin and HT-2 toxin. Both T-2 toxin and HT-2 toxin have an ester function at the C-8 position, whereas HT-2 toxin additionally has a hydroxyl group at the C-4 position. 4,15-DAS is produced by Fusarium species: mainly F. langsethiae, F. poae and F. sambucinum. 4,15-DAS has not previously been evaluated by JECFA. The structurally related type A trichothecenes T-2 toxin and HT-2 toxin were evaluated by JECFA at the forty-seventh meeting. The Committee evaluated 4,15-DAS at the present meeting in response to a request from CCCF. The Committee concluded that there are insufficient toxicological data available to derive a point of departure for the risk assessment of 4,15-DAS alone. There are limitations in the available short-term toxicity studies and no data from chronic exposure and reproductive and developmental toxicity studies. 4,15-DAS and T-2/HT-2 toxin are structurally similar, and there is evidence that they cause similar effects at the biochemical and cellular levels, have similarities in toxic effects in vivo and have an additive dose effect when co-exposure occurs. Therefore, the evidence was considered sufficient by the Committee to support including 4,15-DAS in the group provisional maximum tolerable daily intake (PMTDI) for T-2 and HT-2 toxin established at the forty-seventh JECFA meeting. The PMTDI of 0.06 µg/kg bw for T-2 and HT-2 toxin, alone or in combination, was established based on a lowest-observed-adverse-effect level (LOAEL) of 0.03 mg/kg bw per day associated with changes in white blood cell counts following 3 weeks of dietary exposure in pigs and the application of an uncertainty factor of 500. The inclusion of 4,15-DAS in the group PMTDI of 0.06 µg/kg bw is considered to be a conservative approach when taking into consideration the observation that T-2 toxin was consistently more potent than 4,15-DAS when comparing similar in vitro and in vivo end-points. The Committee noted that there is a paucity of occurrence data on 4,15-DAS and that what data were available to the Committee frequently were left censored and had high limits of quantification (LOQs), thereby increasing the uncertainty in the dietary exposure assessment. In the 2001 JECFA evaluation, the total dietary exposure to T-2 and HT-2 toxins was estimated only from the GEMS/Food European diet due to the fact that data on these toxins were not available from regions other than Europe. The

155
Annex 2
total LB mean dietary exposure to T-2 plus HT-2 toxins was estimated to be 16.3 ng/kg bw per day, with wheat, barley and oats being the major dietary sources. The Committee noted that only LB dietary exposure estimates for Europe were available for the sum of T-2, HT-2 and 4,15-DAS. From these estimates, the sum of the LB dietary exposure estimates for 4,15-DAS of up to 0.0028 µg/kg bw per day and the total dietary exposures estimated for T-2 plus HT-2 of 0.016 µg/kg bw per day results in a LB mean dietary exposure of 0.019 and in a LB high dietary exposure estimated at 0.038 µg/kg bw per day (twice the mean). It was not possible to estimate the UB dietary co-exposure because of the lack of UB data reported for T-2 and HT-2 toxins in the previous 2001 JECFA evaluation together with the substantial uncertainty that is reported for UB estimates of dietary exposure to 4,15-DAS. The Committee concluded that these LB estimates for Europe do not exceed the group PMTDI for T-2, HT-2 and 4,15-DAS.
Fumonisins
Fumonisins are produced by Fusarium verticillioides (formerly F. moniliforme), F. proliferatum and F. fujikuroi, as well as some less common Fusarium species, such as F. anthophilum, F. dlamini, F. napiforme and F. thapsinum. Fumonisin B2 (FB2) and fumonisin B4 (FB4) are also produced by Aspergillus niger. Fumonisins are common contaminants of maize and have also been found in rice. Fumonisins were evaluated by JECFA for the first time at the fifty-sixth meeting and then re-evaluated at the seventy-fourth meeting. At the seventy-fourth meeting, the Committee used a short-term dose–response study of liver toxicity in male transgenic mice fed diets containing purified fumonisin B1 (FB1) to derive a group PMTDI for FB1, FB2 and fumonisin B3 (FB3), alone or in combination, of 2 µg/kg bw on the basis of a lower 95% confidence limit on the benchmark dose for a 10% response (BMDL10) of 0.165 mg/kg bw per day and an uncertainty factor of 100. Because the derived PMTDI at the seventy-fourth meeting of JECFA was the same as the group PMTDI established at the fifty-sixth meeting of JECFA, based on renal toxicity in a 90-day rat study, the group PMTDI for fumonisins B1, B2 and B3, alone or in combination, was retained at the seventy-fourth meeting. Fumonisins were evaluated by the present Committee in response to a request from CCCF for an updated exposure assessment. The Committee also evaluated toxicological and epidemiological studies that had become available since the previous evaluation in 2011. The Committee reaffirmed the conclusions of the seventy-fourth meeting that fumonisins are associated with a wide range of toxic effects and that the liver and kidney are the most sensitive target organs. The Committee reviewed the studies that have become available since the 2011 evaluation and concluded that

156
Joint FAO/WHO Expert Committee on Food Additives Eighty-third report W
HO
Tec
hnic
al R
epor
t Ser
ies,
No.
100
2, 2
017
the study by Bondy et al. (2010),4 subsequently published as Bondy et al. (2012),5 remained the most relevant for the evaluation. The Committee evaluated the updated Bondy et al. (2012) data and concluded that they would not change the overall toxicological assessment performed previously by the Committee. Thus, the previously established group PMTDI of 2 µg/kg bw for FB1, FB2 and FB3, alone or in combination, was retained by the current Committee. The Committee noted the paucity of new data on the occurrence of fumonisins in food submitted to the GEMS/Food contaminants database since 2011 by all WHO regions except for Europe, as opposed to the data used in the previous evaluation (2011). Owing to these differences in the data sets between 2011 and the current evaluation, a direct comparison was not possible. The Committee noted that there are limited data on the occurrence of bound fumonisins in different cereals, the impact of processing on these bound mycotoxins and their bioavailability after consumption. LB mean and high (90th percentile) chronic FB1 exposures in adults were maximally 0.56 and 1.1 µg/kg bw per day, respectively. For total fumonisins, the corresponding exposure estimates were 0.82 and 1.6 µg/kg bw per day. The UB mean and high exposures were estimated to be as high as 1.2 and 2.3 µg/kg bw per day for FB1, respectively, and as high as 2.1 and 4.3 µg/kg bw per day for total fumonisins, respectively. In children, the LB mean and high chronic FB1 exposures were maximally 0.8 and 1.6 µg/kg bw per day, respectively, and for total fumonisins, maximally 1.2 and 2.3 µg/kg bw per day, respectively. In this population group, the UB mean and high exposures were estimated to be as high as 1.6 and 3.9 µg/kg bw per day for FB1, respectively, and as high as 3.2 and 6.4 µg/kg bw per day for total fumonisins, respectively. Maize is the predominant source of LB exposure to FB1 and total fumonisins in most cluster diets. In the UB scenario, wheat was also an important contributor to the exposure to fumonisins in some clusters. Comparison of the estimates of exposure to FB1 and total fumonisins with the group PMTDI indicates no exceedance at the LB mean exposure level in both children and adults. Assuming that all non-detect samples contained fumonisins at the LOQ, the UB mean exposure to total fumonisins in children exceeded the PMTDI in several countries. This was also true for the high (90th percentile) exposure, independent of the fumonisin concentration assigned to the non-detect samples. For adults, only the UB high exposure exceeded the PMTDI.
4 Bondy GS, Mehta R, Caldwell D, Coady L, Armstrong C, Savard M et al. (2010). Effects of long term exposure to FB1 on p53+/− transgenic mice. Ottawa: Health Canada, Health Products and Food Branch, Food Directorate, Bureau of Chemical Safety, Toxicology Research Division (unpublished).
5 Bondy GS, Mehta R, Caldwell D, Coady L, Armstrong C, Savard M et al. (2012). Effects of long term exposure to the mycotoxin FB1 in p53 heterozygous and p53 homozygous transgenic mice. Food Chem Toxicol. 50:3604–13.

157
Annex 2
The Committee noted that, due to the high percentage of non-detect samples in the concentration database (around 70%) and the wide range of LOQs reported in the GEMS/Food contaminants database for fumonisins, the UB estimates may be interpreted as a worst-case estimate of exposure based on the data available. The Committee noted that the international exposure estimates for FB1 and total fumonisins were lower than those estimated by the Committee at its seventy-fourth meeting in 2011. In the current assessment, a larger part of the occurrence data was from countries belonging to the WHO European Region compared with 2011, resulting in lower overall fumonisin levels in maize. In the current assessment, no information on fumonisin levels in maize was available from countries belonging to the African, Eastern Mediterranean or South-East Asia regions, where higher fumonisin concentrations are typically detected. Given these limitations of the occurrence data used in the exposure assessment and high exposures reported in the literature in some countries, it is likely that the exposures to fumonisins in areas where maize is a staple food and high contamination with fumonisins can occur are higher than those estimated by the Committee at this meeting, as can be seen in the previous evaluation, which was based on a larger and more representative data set.
Glycidyl esters
Glycidyl esters are processing-induced contaminants primarily found in refined fats and oils and foods containing fats and oils. Initial research related to glycidyl esters was largely performed as part of the investigation into 3-monochloro-1,2-propanediol (3-MCPD) esters. During 3-MCPD ester analysis, variable 3-MCPD concentrations were obtained, leading to a proposal that additional compounds were present in edible oils and converted to 3-MCPD during sample analysis. The presence of additional processing-induced contaminants, glycidyl esters, in refined edible oils was later confirmed. Initially it was assumed that 3-MCPD esters and glycidyl esters were formed by similar processes, but it is now known that their mechanisms of formation are different, with glycidyl ester formation directly associated with elevated temperatures (>240 °C) and time at these elevated temperatures. Glycidyl esters are generally formed from diacylglycerols, with no requirement for the presence of chlorinated compounds. Formation of glycidyl esters occurs following intramolecular rearrangement, elimination of a fatty acid and epoxide formation. Glycidyl esters have not been evaluated previously by the Committee. The present evaluation was conducted in response to a request from CCCF. Experimental evidence indicates that glycidyl esters are substantially hydrolysed to glycidol in the gastrointestinal tract and elicit toxicity as glycidol. The Committee therefore based its evaluation on the conservative assumption of complete hydrolysis of glycidyl esters to glycidol. Whereas the experimental data

158
Joint FAO/WHO Expert Committee on Food Additives Eighty-third report W
HO
Tec
hnic
al R
epor
t Ser
ies,
No.
100
2, 2
017
supporting substantial hydrolysis are derived from studies with post-weaning animals, the Committee concluded that the capacity of the neonate to hydrolyse fatty acids in the gut is efficient, and therefore the same assumption of substantial hydrolysis could be extended to this age group. The Committee concluded that glycidol is a genotoxic compound and considered its carcinogenicity as the most sensitive end-point on which to base a point of departure. The lowest BMDL10 was 2.4 mg/kg bw per day for mesotheliomas in the tunica vaginalis/peritoneum in male rats observed in the NTP (1990)6 carcinogenicity study (doses adjusted for non-continuous dosing). The Committee noted that there are no published collaboratively studied methods for the determination of glycidyl esters in complex foods in contrast to the situation with fats and oils; therefore, caution should be applied when interpreting analytical data from complex foods. The Committee further noted that there was uncertainty in comparing the reported levels in the same foods from different regions because of the lack of interlaboratory comparisons and the absence of data arising from proficiency testing schemes. As it is not appropriate to establish a health-based guidance value for substances that are both genotoxic and carcinogenic, the margin of exposure approach is chosen. National estimates of dietary exposure were used for determining the margins of exposure. This was because they were considered to be the most representative of dietary exposure as they are based on consumption data from national dietary surveys. The majority of the surveys used include 2 or more days of data, which better estimate chronic dietary exposure. The national dietary exposures are considered to be reliable estimates, as they are based on a range of foods in the diet and include the key foods in which glycidol contamination is known to occur – namely, fats and oils. The concentrations in specific foods in the majority of cases have been able to be matched directly with consumption data for the same foods. The Committee considered that the lower ends of the ranges of the margins of exposure for infants, children and adults (Table A-1) were low for a compound that is genotoxic and carcinogenic and that they may indicate a human health concern.
6 NTP (1990). National Toxicology Program (NTP) technical report on the toxicology and carcinogenesis studies of glycidol (CAS no. 556-52-5) in F344/N rats and B6C3F1 mice (gavage studies). Research Triangle Park (NC): National Toxicology Program (NTP Technical Report 374).

159
Annex 2
Table A-1Dietary exposures and margins of exposure compared with the BMDL10
3-MCPD esters and 3-MCPD
3-Monochloro-1,2-propanediol (3-MCPD) esters are processing-induced contaminants found in various refined oils and fats and are formed from acylglycerols in the presence of chlorinated compounds during deodorization at high temperature. “3-MCPD esters” is a general term for 3-MCPD esterified with one (sn-1- and sn-2-monoesters) or two identical or different fatty acids (diesters). Depending on the fatty acid composition of the oil or fat, a variety of different 3-MCPD esters can be formed during processing. In foods that contain refined vegetable oils or fats, mainly diesters are found. Concentrations of 3-MCPD esters in refined oils increase incrementally in the following order: rapeseed oil < soya bean oil < sunflower oil < safflower oil < walnut oil < palm oil. 3-MCPD esters have not been previously evaluated by the Committee. The present evaluation was conducted in response to a request from CCCF for an evaluation of 3-MCPD esters. 3-MCPD has been evaluated at the forty-first, fifty-seventh and sixty-seventh meetings of JECFA. At the sixty-seventh meeting, the Committee reaffirmed a PMTDI for 3-MCPD of 2 μg/kg bw, based on a lowest-observed-effect level (LOEL) of 1.1 mg/kg bw per day for tubule hyperplasia in the kidney seen in a long-term carcinogenicity study in rats. An uncertainty factor of 500 was applied to allow for the absence of a clear no-observed-effect level (NOEL) and to account for the effects on male fertility and inadequacies in the studies of reproductive toxicity. Experimental evidence indicates that 3-MCPD esters are substantially hydrolysed to 3-MCPD in the gastrointestinal tract and elicit toxicity as free 3-MCPD. The Committee therefore based its evaluation on the conservative assumption of complete hydrolysis of 3-MCPD esters to 3-MCPD. Whereas the experimental data supporting substantial hydrolysis are derived from studies with post-weaning animals, the Committee concluded that the capacity of the
Population group
Range of estimated dietary exposures to glycidol (µg/kg bw per day)a Margins of exposureb
Mean High percentile Mean High percentile
Adults 0.1–0.3 0.2–0.8 8 000–24 000 3 000–12 000Children 0.2–1.0 0.4–2.1 2 400–12 000 1 100–6 000Infants 0.1–3.6 0.3–4.9 670–24 000 490–8 000
a Includes LB and UB estimates from a range of national estimates of dietary exposure.b Compared with a BMDL10 of 2.4 mg/kg bw per day. Margins of exposure are expressed as a range; the lower end of the range relates to UB mean and high-percentile
exposures, and the higher end of the range relates to LB mean and high-percentile exposures.

160
Joint FAO/WHO Expert Committee on Food Additives Eighty-third report W
HO
Tec
hnic
al R
epor
t Ser
ies,
No.
100
2, 2
017
neonate to hydrolyse fatty acids in the gut is efficient, and therefore the same assumption of substantial hydrolysis could be extended to this age group. The main target organs for 3-MCPD and its esters in rats and for 3-MCPD in mice are the kidneys and the male reproductive organs. 3-MCPD was carcinogenic in two rat strains, but not in mice. No genotoxic potential has been demonstrated in vivo for 3-MCPD. Two long-term carcinogenicity studies with 3-MCPD in rats7 were identified as pivotal studies, and renal tubular hyperplasia was identified as the most sensitive end-point. The lowest BMDL10 (restricted log-logistic model) for renal tubular hyperplasia was calculated to be 0.87 mg/kg bw per day for male rats. After application of a 200-fold uncertainty factor, the Committee established a group PMTDI of 4 µg/kg bw for 3-MCPD and 3-MCPD esters singly or in combination (expressed as 3-MCPD equivalents) (rounded to one significant figure). The overall uncertainty factor of 200 incorporates a factor of 2 related to the inadequacies in the studies of reproductive toxicity. The previous PMTDI of 2 μg/kg bw for 3-MCPD, established at the fifty-seventh meeting and retained at the sixty-seventh meeting, was withdrawn. The Committee noted that there are no published collaboratively studied methods for the determination of 3-MCPD esters in complex foods in contrast to the situation with fats and oils; therefore, caution should be applied when interpreting analytical data from complex foods. The Committee further noted that there was uncertainty in comparing the reported levels in the same foods from different regions because of the lack of interlaboratory comparisons and the absence of data arising from proficiency testing schemes. The Committee noted that estimated dietary exposures to 3-MCPD for the general population, even for high consumers (up to 3.8 µg/kg bw per day), did not exceed the new PMTDI. Estimates of mean dietary exposure to 3-MCPD for formula-fed infants, however, could exceed the PMTDI by up to 2.5-fold for certain countries (e.g. 10 μg/kg bw per day in the first month of life). While the current evaluation was specific to the request for an evaluation of 3-MCPD esters, the Committee was aware that 2-MCPD esters can be detected in some of the same foods as 3-MCPD esters. There are, however, currently limited food occurrence data for 2-MCPD and 2-MCPD esters available in the GEMS/Food contaminants database, and the toxicological database is currently insufficient to allow a hazard characterization.
7 Sunahara G, Perrin I, Marchesini M (1993). Carcinogenicity study on 3-monochloropropane-1,2-diol (3-MCPD) administered in drinking water to Fischer 344 rats. Unpublished report no. RE-SR93003 submitted to WHO by Nestec Ltd, Research & Development, Switzerland.
Cho WS, Han BS, Nam KT, Park K, Choi M, Kim SH et al. (2008). Carcinogenicity study of 3-monochloropropane-1,2-diol in Sprague-Dawley rats. Food Chem Toxicol. 46:3172–7.

161
Annex 2
Sterigmatocystin
Sterigmatocystin is a toxic fungal secondary metabolite (mycotoxin) that is mainly produced by more than a dozen species of Aspergillus as well as by a number of phylogenetically and phenotypically different fungal genera. It is a polyketide-derived mycotoxin with CAS No. 10048-13-2 and International Union of Pure and Applied Chemistry (IUPAC) name (3aR,12cS)-8-hydroxy-6-methoxy-3a,12c-dihydro-7H-furo[3′,2′:4,5]furo[2,3-c]xanthen-7-one. Sterigmatocystin has not previously been reviewed by JECFA. The Committee evaluated sterigmatocystin at the present meeting at the request of CCCF.
Taking account of the available information on genotoxicity, carcinogenicity and DNA adduct formation, the Committee concluded that sterigmatocystin is genotoxic and carcinogenic, and the critical effect was determined to be carcinogenicity. The Committee selected the BMDL10 of 0.16 mg/kg bw per day for hepatic haemangiosarcoma in male rats in a study by Maekawa et al. (1979)8 from the restricted log-logistic model as the point of departure for use in the risk assessment. As it is not appropriate to establish a health-based guidance value for substances that are genotoxic carcinogens, the Committee used a margin of exposure approach. The Committee noted that there is a paucity of occurrence data and what data were available to the Committee frequently were left censored, thereby increasing the uncertainty in the exposure assessment. The Committee calculated margins of exposure for mean and high estimates of dietary exposure to sterigmatocystin. The margins of exposure for adults range from 9400 to more than 530 000 for mean estimates based on UB and LB assumptions. For high estimates, margins of exposure for adults range from 4700 to 270 000. The lowest margins of exposure are observed for the African Region (from 4700 to 5000 for the high exposure UB–LB range, and from 9400 to 10 000 for the mean exposure UB–LB range). The Committee noted that these estimates, which are based only on adult populations and for which only one food commodity (sorghum) was considered, may indicate a human health concern. Margins of exposure were not calculated for Europe or Japan, as sterigmatocystin was not detected in any samples. For all other regions, the Committee considered that the margins of exposure were not of human health concern even at the UB high exposure. Overall, the Committee concluded that the data used for calculating the margins of exposure have considerable limitations, both for the dietary exposure
8 Maekawa A, Kajiwara T, Odashima S, Kurata H (1979). Hepatic changes in male ACI/N rats on low dietary levels of sterigmatocystin. Gann. 70:777–81.
162
Joint FAO/WHO Expert Committee on Food Additives Eighty-third report W
HO
Tec
hnic
al R
epor
t Ser
ies,
No.
100
2, 2
017
estimate and for the toxicological point of departure. Limited data on occurrence in food were available, and analytical detection limits were high in some countries. The only long-term carcinogenicity study suitable for dose–response modelling used an uncommon strain of rat (ACI/N) and, in view of the low incidence of liver tumours in this animal model, it may not be the most appropriate for human risk assessment. Consequently, the derived margins of exposure should be considered only as crude estimates. The Committee also noted that sterigmatocystin and AFB1 have the same main target organ (the liver). The comparative animal data on carcinogenicity are very limited, but indicate that sterigmatocystin is less potent than AFB1.
Co-exposure of fumonisins with aflatoxins
Fumonisins and aflatoxins are mycotoxins produced by fungi of Fusarium and Aspergillus species. Considering that fumonisins and aflatoxins are both frequent contaminants in cereal (especially maize, rice, sorghum and wheat) and cereal-based foods and that aflatoxins are common contaminants in groundnuts and tree nuts, co-exposure to both mycotoxins is likely in areas where these foods are consumed as part of the routine diet.
As part of the evaluation of fumonisins at the seventy-fourth meeting, the Committee evaluated the available data on the concurrent exposure to fumonisins and other mycotoxins. There were no human studies available showing co-exposure. There were co-exposure toxicological studies available using animal models. None of the co-exposure studies in animal models was considered adequate for use in the Committee’s evaluation for fumonisins; the Committee noted that the interaction between AFB1, a compound with known genotoxic and hepatocarcinogenic properties, and fumonisins, which have the potential to induce regenerative cell proliferation in the liver, would be of concern. The Committee has not performed a full evaluation for the co-exposure of fumonisins and aflatoxins previously. At the current meeting, the Committee evaluated updated toxicological and exposure data for fumonisins and aflatoxins separately (see above). At the request of CCCF, the Committee also evaluated co-exposure to aflatoxins and fumonisins. From the international estimates of dietary exposure, two GEMS/Food clusters (G05 and G13) have high dietary exposure to both AFB1 and FB1. The countries (Guatemala and the United Republic of Tanzania) where co-exposure has been confirmed using urinary or plasma exposure biomarkers of FB1 and AFB1 belong to these two clusters. Although evidence in laboratory animals from the previous and the present evaluations has suggested an additive or synergistic effect of fumonisin
163
Annex 2
and aflatoxin co-exposure in the development of preneoplastic lesions or hepatocellular carcinoma, currently no data are available on such effects in humans. Two prospective epidemiological studies do not support the hypothesis of an interaction between aflatoxins and fumonisins in childhood stunting. The Committee concluded that there are few data available to support co-exposure as a contributing factor in human disease. However, the interaction between AFB1, a compound with known genotoxic properties, and fumonisins, which have the potential to induce regenerative cell proliferation (particularly at exposures above the PMTDI), remains a concern. This is due to the fact that the incidences of chronic liver disease and stunting are high in the areas of the world where the exposures to both mycotoxins are high and the co-exposure has been confirmed with biomarkers.


165
Annex 3
Meeting agenda
83rd JOINT FAO/WHO EXPERT COMMITTEE ON FOOD ADDITIVES (JECFA) FAO Headquarters, Rome, 8 – 17 November
Opening: Philippine Room (C277) 8 November at 9.30h
Draft Agenda
1. Opening
2. Declarations of Interests (information by the Secretariat on any declared interests and discussion, update by experts).
3. Election of Chairperson and Vice-Chairperson, appointment of Rapporteurs
4. Adoption of Agenda
5. Matters of interest arising from previous Sessions of the Codex Committee on Contaminants in Foods (CCCF)
6. Critical issues and questions from Working Papers (first brief round of discussion on all subjects to inform the full Committee)
7. Evaluations
7.1 Aflatoxins 7.2 Diacetoxyscirpenol 7.3 Fumonisins (and co-exposure with aflatoxins) 7.4 Glycidyl esters 7.5 3-MCPD esters 7.6 Sterigmatocystin
8. Other matters to be considered (general considerations) - TTC decision tree (EFSA-WHO report) and relevance to work of JECFA on
166
WH
O T
echn
ical
Rep
ort S
erie
s, N
o. 1
002,
201
7Joint FAO/WHO Expert Committee on Food Additives Eighty-third report
contaminants http://www.efsa.europa.eu/sites/default/files/corporate_publications/files/1006e.pdf
- Update from IPCS on risk assessment work: chemical-specific adjustment factors (CSAF), mixtures
- Feedback on new WHO guidance to experts
Update of EHC 240: - Development of guidance on the evaluation of genotoxicity studies - Updated guidance on dose–response modelling for use in risk assessment - Guidance on handling of high percentage of left-censored occurrence data
9. Other matters as may be brought forth by the Committee during discussions at the
meeting. 10. Adoption of the report.

SELECTED WHO PUBLICATIONS OF RELATED INTEREST
Evaluation of Certain Food AdditivesEighty-second Report of the Joint FAO/WHO Expert Committee on Food AdditivesWHO Technical Report Series, No. 1000, 2016 (162 pages)
Safety Evaluation of Certain Food AdditivesEighty-second Meeting of the Joint FAO/WHO Expert Committee on Food AdditivesWHO Food Additives Series, No. 73, 2017, in preparation
Evaluation of Certain Veterinary Drug Residues in FoodEighty-first Report of the Joint FAO/WHO Expert Committee on Food AdditivesWHO Technical Report Series, No. 997, 2016 (110 pages)
Toxicological Evaluation of Certain Veterinary Drug Residues in FoodEighty-first Meeting of the Joint FAO/WHO Expert Committee on Food AdditivesWHO Food Additives Series, No. 72, 2016 (162 pages)
Evaluation of Certain Food Additives and ContaminantsEightieth Report of the Joint FAO/WHO Expert Committee on Food Additives WHO Technical Report Series, No. 995, 2016 (114 pages)
Safety Evaluation of Certain Food Additives and ContaminantsEightieth Meeting of the Joint FAO/WHO Expert Committee on Food AdditivesWHO Food Additives Series, No. 71, 2015 (132 pages)
Evaluation of Certain Food AdditivesSeventy-ninth Report of the Joint FAO/WHO Expert Committee on Food AdditivesWHO Technical Report Series, No. 990, 2015 (124 pages) Safety Evaluation of Certain Food AdditivesSeventy-ninth Meeting of the Joint FAO/WHO Expert Committee on Food Additives WHO Food Additives Series, No. 70, 2015 (369 pages)
Evaluation of Certain Veterinary Drug Residues in FoodSeventy-eighth Report of the Joint FAO/WHO Expert Committee on Food AdditivesWHO Technical Report Series, No. 988, 2014 (127 pages)
Toxicological Evaluation of Certain Veterinary Drug Residues in FoodSeventy-eighth Meeting of the Joint FAO/WHO Expert Committee on Food Additives WHO Food Additives Series, No. 69, 2014 (241 pages)
Further information on these and other WHO publications can be obtained from
WHO Press, World Health Organization 1211 Geneva 27, Switzerland www.who.int/bookorders
tel.: +41 22 791 3264; fax: +41 22 791 4857; email: [email protected]

Evaluation of certain contaminants in foodThis report represents the conclusions of a Joint FAO/WHO Expert Committee convened to evaluate the safety of various contaminants or groups of contaminants in food.
The first part of the report contains a brief description of general considerations addressed at the meeting, including updates on matters of interest to the work of the Committee. A summary follows of the Committee’s evaluations of technical, toxicological and/or dietary exposure data for six contaminants or groups of contaminants (aflatoxins, 4,15-diacetoxyscirpenol, fumonisins, glycidyl esters, 3-MCPD esters and 3-MCPD, sterigmatocystin) as well as an evaluation of co-exposure of fumonisins with aflatoxins.
Annexed to the report is a summary of the toxicological and dietary exposure information as well as the Committee’s recommendations on the contaminants and groups of contaminants considered at this meeting.
ISBN 978 92 4 121002 7