who owned citibank? familiarity bias and business network
TRANSCRIPT
NBER WORKING PAPER SERIES
WHO OWNED CITIBANK? FAMILIARITY BIAS AND BUSINESS NETWORKINFLUENCES ON STOCK PURCHASES, 1925-1929
Charles W. CalomirisElliot S.M. Oh
Working Paper 24431http://www.nber.org/papers/w24431
NATIONAL BUREAU OF ECONOMIC RESEARCH1050 Massachusetts Avenue
Cambridge, MA 02138March 2018
The authors are grateful to Lois Kauffman, Kerri Anne Burke, Shira Bistricer, and Richard Gomesof Citigroup, who patiently and graciously offered help and advice accessing materials at the CitibankArchive, and to Citigroup for its willingness to open its archive to researchers. The authors thank DanielMarcin for sharing the New York Times 1924 list of taxpayers, and the NBER and IPUSM for makingthe 100 Percent Federal Census data available. They thank Dora Costa, Shrihari Santosh, Pablo Slutzkyparticipants in the UCLA economics department conference on Organizations in History and participantsin the University of Maryland Brownbag seminar for comments on an earlier draft. They also thankWilliam Harvey, Anastasia De Pierro, Julie van den Kieboom, Julia Davidson, Dabin Moon, StevenYoon, Xiaoyu Sun, Palmer Lao, Pinank Shah, Atieh Ashkezari, Bryan Lee, Hyungbin Park, JennyYoo, and Craig Buckthorp for excellent research assistance, and Taeh-Hwan Kim, Ju-Heon Kang,Jin-Woo Huh, Hyun-Kyu Oh, Ji-Wang Ko, Do-Guen Lee, Tae-Hong Kim, Byung-Jun Song, Hee-JinSeo, Hae-Do Jeong, Gi-Wook Choi, and Hong-Sik Yoon for efforts in coding data. The views expressedherein are those of the authors and do not necessarily reflect the views of the National Bureau of EconomicResearch.
NBER working papers are circulated for discussion and comment purposes. They have not been peer-reviewed or been subject to the review by the NBER Board of Directors that accompanies officialNBER publications.
© 2018 by Charles W. Calomiris and Elliot S.M. Oh. All rights reserved. Short sections of text, notto exceed two paragraphs, may be quoted without explicit permission provided that full credit, including© notice, is given to the source.
Who Owned Citibank? Familiarity Bias and Business Network Influences on Stock Purchases, 1925-1929Charles W. Calomiris and Elliot S.M. OhNBER Working Paper No. 24431March 2018, Revised August 2019JEL No. G02,G11,G21,N12,N22
ABSTRACT
We study factors influencing individuals’ decisions to purchase Citibank stock during the 1920s. Ownershipwas encouraged by proximity to New York and higher wealth. Lack of familiarity was also an importantbarrier. The establishment of Citibank branches within a U.S. county or a foreign country was associatedwith a large increase in share ownership in that location, ceteris paribus. Within the New York Citymetropolitan area, individual characteristics related to wealth, knowledge, and one’s influence withinthe New York City Business network increased the probability of becoming a Citibank shareholder.Business associates in the network were an important influence on purchase decisions. Connectionswith Citibank officers and directors, or with people who had such connections, increased the probabilityof buying Citibank shares. Connections with other Citibank shareholders also increased the probabilityof buying Citibank shares. Connections with officers and directors of other large New York banksreduced the probability of owning Citibank, presumably because it increased familiarity with a closesubstitute for Citibank shares. Network influence reflected more than the transmission of inside information;executives imitated other’s stock buying behavior, which provides evidence of the importance of familiarityfor purchases. The role of some network influences, like other identifiable influences, became lessimportant during the price boom of 1928-1929, perhaps reflecting the rising importance of other meansof increasing familiarity during the price boom (i.e., media coverage).
Charles W. CalomirisColumbia Business School3022 Broadway Street, Uris HallNew York, NY 10027and [email protected]
Elliot S.M. OhDepartment of FinanceUniversity of MarylandCollege Park, [email protected]
A data appendix is available at http://www.nber.org/data-appendix/w24431
1
1. Introduction
There are large literatures documenting how familiarity bias affects investing decisions, and
the role of networks in influencing individual decision making. In this paper, we connect
those literatures in a study of the decisions of wealthy people to purchase Citibank stock in
the 1920s. This is the first study of which we are aware that uses the list of stockholders in
a firm to analyze who decides to buy the firm’s stock. We are able to do this because of
three unique features of this historical example that make this analysis possible. First, we
are able to access the information about the identity of stockholders. It generally is not
possible to analyze the identities of shareholders because such data are confidential.
Historical data on ownership remain confidential, but we were granted permission to use
historical Citibank shareholder lists because we found a way to match individuals’ names to
names from other sources without jeopardizing confidentiality. Second, the historical
context of our example (a large New York City bank, whose shares were owned only by the
rich) permits us to identify a list of individuals – members of the New York City business
network – that includes both those who chose to be stockholders and those that could have
been shareholders but were not. Third, the network’s structure allows us to trace how
business connections affect purchase decisions.
We begin by examining holdings across the U.S. counties and in other countries to
investigate whether the proximity of a Citibank branch affected ownership of Citibank
shares. Our county-level analysis also considers the effects of distance from New York and
various demographic characteristics. We then turn to our main, individual level analysis.
We construct a mapping of the network of business executives in New York City, and

2
investigate how the characteristics of executives – including income, influence within the
network, and familiarity with finance – mattered for determining who invested in Citibank.
We also investigate the extent to which members of the network influenced each other’s
investment decisions. Specifically, we explore how one’s proximity within the network to
Citibank officers and directors, or to those holding Citibank shares, influenced executives’
decisions to purchase Citibank stock. We believe ours is the first study of its kind; we are
not aware of other studies that examine individual stock purchase decisions by combining a
company’s list of stockholders with a list of individuals (New York City executives in our
case) who comprise the most relevant population of potential purchasers of that company’s
stock.
During our sample period, Citibank was rapidly growing its businesses, innovative
in transforming its business structure, and actively issuing new equity, all of which suggest
a ripe environment for amplifying the effect that differences in information (familiarity)
have on the individual share purchasing decisions of potential investors.
Citibank stock was not an investment option for everyone. It had a high price per
share. It also was sold mainly in the over-the-counter (OTC) market, where it was
uncommon for very small numbers of shares to be traded in any transaction.1 Furthermore,
mutual funds had not yet come into existence as a means of owning shares.2 Therefore,
1 As we discuss further below, for a brief time in 1927 and 1928, shares were transacted in much smaller blocs on the New York Stock Exchange. 2 Although this fact is widely known, we investigated whether Citibank shares were held by any entities during our period that might be regarded as similar to mutual funds. We found no evidence for such holdings. Specifically, there were no formal financial institutions operating funds that pooled individuals’ holdings in our data. Individuals who were members of the same family sometimes owned shares jointly, but shares never were owned by large groups of individuals.

3
Citibank shares could only be held by the wealthy. Consistent with evidence from today’s
markets, the willingness to own shares also was limited by distance: wealthy individuals
were less likely to own Citibank shares, ceteris paribus, the farther away from New York
City they lived.
We find that constraints related to wealth and location were not the only barriers to
purchasing Citibank shares. Despite the substantial expansion in the number of Citibank
shareholders during the 1920s (which we link, at least in part, to the frequent issuance of
shares by Citibank during the 1920s), only a tiny fraction of the wealthy business elite
living in the New York City metropolitan area owned Citibank shares (roughly 1% in
January 1925, and 2% in January 1929). In our county-level and country-level analysis, we
find that the presence of a Citibank branch substantially mitigated the effect of distance on
the propensity to own Citibank shares. In our analysis of individual shareholding within the
New York City metropolitan area, we find that individual characteristics related to wealth,
knowledge about financial services, and one’s influence within the network increased the
probability of becoming a Citibank shareholder. Those influences, however, were reduced
after 1927. In fact, highly influential people became less likely than others to purchase
Citibank shares during the price boom of 1927 and 1928. These results all point to the role
of familiarity in influencing stock purchase decisions. As Merton (1987) argues,
information costs can be a barrier to purchasing shares. Proximity to branches, knowledge
of the financial sector, and personal connections to Citibank shareholders all can be seen as
ways of increasing familiarity and reducing information costs.

4
Network connections were an important contributor to individuals’ purchase
decisions. Having business connections with Citibank officers and directors, even
indirectly, substantially increased the probability of buying Citibank shares. Furthermore,
having a business connection with a Citibank shareholder who was not a Citibank officer or
director also had an important positive effect on the decision to buy Citibank shares. The
fact that both kinds of network connections mattered for the decision to buy shares
indicates that influence reflected more than the transmission of inside information;
executives imitated each other’s behavior, perhaps because connections with existing
shareholders increased familiarity with Citibank stock. The role of some network
influences, like many other identifiable influences, became less important in explaining
who became a new shareholder during the price boom of 1928-1929. We conjecture that
this likely reflected the rising importance of other information and influences during the
price boom, which overcame barriers to familiarity (i.e., media coverage of the price
boom).
To identify network influences on purchases, we exploit two plausibly
unidirectional linkages. First, we assume that Citibank officers and directors influence the
share purchases of others in the network, but not vice versa. Second, when analyzing new
shareholders (those that have become shareholders in the past two years), we assume that
current shareholders (those who have owned Citibank shares two years before and still own
them) influence the share purchases of others in the network, but not vice versa. We
measure these two channels of influence separately by constructing variables that capture

5
either the network influence of current Citibank officers and directors, or that capture the
influence of current shareholders who are not Citibank officers and directors.
We also perform a placebo test to see whether network connections to Citibank
officers and directors had a different influence on Citibank shareholding than network
connections to other large banks’ officers and directors. This test investigates whether
contact with influential New York bankers produced a general sectoral interest in New
York bank stocks, of which Citibank was one. We find that network influences from
Citibank officers and directors remain unchanged after controlling for network influences
of other large New York banks’ officers and directors. Once-removed connections to those
people, however, did increase the probability of purchasing Citibank shares, which suggests
that once-removed connections via the network may have affected broader sectoral
perceptions. Interestingly, we also find that business connections to other large New York
banks reduced the probability of owning Citibank shares. Apparently, familiarity with a
close substitute for Citibank shares made the purchase of Citibank shares less likely.
Our discussion is divided as follows. Section 2 reviews the recent academic
literature on familiarity and home bias. Section 3 reviews trends in Citibank shareholding
during the 1920s, and provides relevant background relating to Citibank’s circumstances as
a national bank operating in New York City during the 1920s. Section 4 summarizes the
data sources that we employ in our analysis of the stock purchase decisions by business
executives residing in the New York City metropolitan area. Section 5 analyses county-
level and country-level data on the locational characteristics of Citibank shareholders, and
shows the influence of proximity to a Citibank branch, as well as distance from New York
6
and various demographic characteristics. Section 6 presents logit and tobit regression
analysis of individual shareholder purchase decisions and network influences of New York
business executives. Section 7 concludes.
2. Related Literature
Distance (i.e., positive home bias) is a well-recognized influence on investors (French and
Poterba 1991, Tesar and Werner 1995, Coval and Moskowitz 1999, Dahlquist et al. 2002,
Strong and Xu 2003, Speidell and Xing 2004, Craft 2006, Giannetti and Laeven 2012,
Philips et al. 2010, and Philips et al. 2012).
Home bias has been found to vary importantly with issuer and investor
characteristics. For example, political, economic, legal, and corporate governance
environments of issuers affect home bias (Kang and Stulz 1997, Stulz 2005). With respect
to investor characteristics, Graham, Harvey and Huang (2009) find that self-reported
investor competence is positively associated with investing internationally. Karlsson and
Norden (2007) find that home bias is negatively related to wealth and positively related to
age. Aside from home bias, other factors have been found to encourage investors to begin
to participate in equity markets. For example, Kaustia and Knupfer (2012) find that positive
stock returns for local firms tend to encourage investors to begin to invest in the stock
market. Keloharju, Knupfer and Linnainmaa (2012) find that consuming a firm’s product
increases the probability of investing in the firm. This builds on other research about factors
that influence investor interest as the result of greater familiarity, financial literacy, physical
proximity, and education (Huberman 2001, Coval and Moskowitz 1999, Hong, Kubik and

7
Stein 2004, Giannetti and Yafeh 2012, Hong and Kostovetsky, 2012, Okawa and van
Wincoop 2012, Bekaert et al. 2016). Still other studies seek to identify how strategies that
firms might undertake – related to disclosure or investor relations – can broaden their
investor bases (Busbee and Miller 2012, Liang, Lin and Chin 2012).
The literature suggests several factors that should be relevant in understanding
differences across investors and issuers in the identities of stockholders in the 1920s,
including the distance between the issuer and the investor, the economic and demographic
characteristics of the investor (wealth, education, consumption of issuer’s product),
previous returns on the issuer’s equity, and recent issuance activity (which may influence
the firm’s attempts to broaden its investor base, and investors’ familiarity with the issuer).
When analyzing investor behavior in the 1920s there are historical factors that
should be considered. In the early 20th century, and especially in the period 1917-1929, the
United States experienced a major shift in the distribution of shareholdings in publicly held
firms. On average, the number of shareholders in publicly traded firms doubled from 1900
to 1917, and then doubled again from 1917 to 1928. Judging from many firms’ experiences,
the number of shareholders appears to have continued to grow rapidly during the boom of
1928-1929 (comparable figures are not available for 1929).
As H.T. Warshow (1924) and Gardiner Means (1930) showed, the rapid average
growth in the number of shareholders over 1917-1928 differed dramatically across sub-
periods and across different industries and firms. According to Means, new financing needs

8
and tax policies during World War I (especially the highly progressive taxation of income)3
drove firms that had previously relied on wealthy investors to search out “persons of
moderate means.” While the income of the rich was subject to high taxation, on average,
per capita disposable income grew significantly (cumulatively by about 5%) from 1916 to
1919, which led issuers to target this “middle class” to fund growth. On average, 1923-
1928 saw a smaller rate of growth in the number of shareholders for the firms in Means’
sample (3.8% per year, compared to 11.3% per year for 1917-1923), and that led Means to
conclude that the increase in stockholders observed for the period 1917-1928 was mainly
due to special factors related to World War I, and “not the result of a permanent
[acceleration of the ownership dispersion] trend.”
Means’ view that shareholder ownership distribution was not shifting dramatically
in the 1920s was based on calculations of the average experience of 31 firms. But for some
firms (such as International Paper, which was included in Means’ sample, and Citibank,
which was not), during the 1920s, the number of shareholders increased by roughly an
order of magnitude. For Proctor and Gamble, the number of shareholders more than tripled,
while it doubled for American Telephone and Telegraph, and increased by about 50% for
Du Pont and General Electric. For many other firms, however, the number of shareholders
was static or declining: U.S. Rubber and U.S. Steel saw declines while Standard Oil and
Swift experienced slight increases. Firms in established industries – which were over-
represented in Means’ sample – saw little growth in shareholders. Firms in the most
3 For example, by 1919, someone earning $35,000 had to pay $6,000 to the federal government in income tax, while someone earning $100,000 had to pay $61,000.

9
technologically dynamic sectors saw higher growth in shareholders, and these were also the
sectors experiencing the biggest growth in equity capital, and much higher equity returns
(Nicholas 2007). From many high-growth firms’ perspective, the period 1923-1929 was the
one that most transformed their ownership structure.
New York City’s largest banks grew especially quickly by issuing stock in the
1920s. They also saw large increases in their number of shareholders. Citibank’s number of
shareholders increased by an order of magnitude from 1925 to 1930. Large New York
banks, like path-breaking non-financial firms such as General Electric and General Motors,
were highly innovative during the 1920s. Citibank dramatically changed its structure and
lines of business in the 1920s. It spread its branch network throughout the world, as well as
throughout the five Boroughs of New York, and it entered aggressively into the growth
areas of portfolio management and securities underwriting. Innovative, growing firms like
Citibank also needed to raise new capital repeatedly, which meant that they had an interest
in attracting new investors.
Limits on the expansion of shareholders in the 1920s likely reflected informational
barriers. Even rich New Yorkers may have lacked an understanding of stock valuation, and
may have been unfamiliar with Citibank’s changing structure and prospects. Disclosures by
public firms were quite limited. Basic balance sheet information was available (and was
required to be reported publicly for all national banks). Information about dividends and
stock prices (available in the form of “tear sheets” handed out by stock brokers) was also
available. But even the most basic information about Citibank’s revenues and profits from
various lines of businesses remained obscure, with the exception of selective tidbits

10
revealed in the annual letter from the President to the stockholders, or aggregate profits
reported annually in investment manuals such as Moody’s Finance Manual.
Networks of business relationships may have been an important source of
information transmission that wealthy New Yorkers relied upon when deciding on stock
investments. As we show below, it is possible to reconstruct the networks of corporate
executives – officers and directors of all corporations operating in New York City4 – and
trace potential influences related to network contacts. When doing so we can identify the
influence of Citibank officers and directors on executives with whom they had network
connections, as well as the influence of other banks’ officers and directors, and Citibank
shareholders, all of whom may have influenced business associates’ purchase decisions.
Sorting between those two influences can provide unique insight about why
network connections influence stock decisions. If someone is influenced only by contact
with a Citibank insider, that is more likely to reflect the communication of relevant private
information. In contrast, influence through network connections by stockholders who are
outsiders is more likely to reflect other kinds of communication, or possibly just simple
imitative behavior (Banerjee et al. 2013)..
To date, there are no studies analyzing which investors became stockholders in
which firms during the 1920s, or the possible influences of networks in encouraging stock
4 While the 1929-1930 volume mentions no explicit minimum capitalization requirements for inclusion, firms may have had to meet a certain capitalization threshold in order to be included. Starting in 1933, the Directory states that it only includes firms with a capitalization greater than or equal to $50,000 (which, adjusting for inflation, is roughly a million 2017 dollars). Even if such a capitalization requirement implicitly existed in 1929, this is not a very high hurdle, and would include virtually all firms whose executives had the purchasing power to become Citibank shareholders.

11
purchases.5 The reason is simple: data about the identities of stockholders are confidential,
and even historical data on stockholders’ identities are considered sensitive and proprietary.
Our study was made possible when we found a way to use confidential shareholder
data without compromising confidentiality. We thus are able to identify shareholders,
measure their relevant characteristics, and locate them within the New York business
network. This was accomplished by assembling the relevant pieces of the dataset at the
Citibank archive, with the active participation (and patience) of its staff, and then
anonymizing the data for use outside the archive.
3. Citibank Shares and Shareholders
Citibank’s formal name was National City Bank of New York. It was chartered under the
National Banking Act as a successor to a state-chartered bank whose charter began in 1812.
By the 1920s, Citibank was one of the leading commercial banks in the New York City and
in the world. In 1922, its President, Charles E. Mitchell, wrote that Citibank, “directly
through our own branches and those of our affiliates, The National City Company and the
International Banking Corporation, we are in daily touch with and giving service to banks
and individuals in every city and hamlet in every state of the Union. Spanning the world,
itself, we stand at the crossroads of the world’s commerce in contact with all nations…”
There are several factors that made bank stocks like that of Citibank different from
other publicly traded stocks. First, until 1927, national banks like Citibank were prohibited
5 Some closely related studies include Cohen, Frazzini, and Malloy (2008), which examines educational affiliation networks and their effects on mutual fund manager performance, and Cohen, Frazzini, and Malloy (2010), which examines how educational affiliation networks affect analyst stock recommendations.

12
from splitting their shares (Kane and Wilson 1998). That resulted in high share prices per
share, which limited Citibank’s shareholders to the wealthy. As Figure 1 shows, Citibank’s
price per share exceeded per capita national income during the 1920s (and grew to several
times national income per capita in 1929).6 Citibank did split its shares five-for-one in
January 1929 (Figure 1 maintains consistent pricing per share, as if the split had not
occurred). The split occurred just after our January 1929 observations of shareholders.
Two other factors may have influenced Citibank’s stockholder base. First, Citibank
– like other firms at this time – relied on rights offerings to sell new shares. Citibank issued
shares several times in the 1920s, as its growing capital stock indicates (Figure 2).
Citibank’s growth was similar to the growth rates of Chase, Chemical, and Manhattan.7
From 1920 to 1929, Citibank issued shares into the market six times (in 1920, 1925, 1927,
1928, and once in 1929).8 Those share issues supported the more than doubling of its total
assets from 1924 to 1929 (the capital stock shown in Figure 2 consists of roughly equal
amounts of “paid in capital” and accumulated “surplus plus undivided profits”). Existing
6 National income per capita was $252 in 1929 (the ratio of $86.8 billion in income for 1929, divided by a population of 34.4 million in 1930). See Historical Statistics of the United States, Vol. I, pp, 22, 237. 7 Chase, Chemical, and Manhattan all roughly doubled their asset size through the acquisition of other banks and trust companies and financed these acquisitions by more than doubling their capital stocks through rights offerings. Chase National Bank, which grew its asset size and capital stock most aggressively among the five banks (including Citibank), increased its number of shareholders by 37% between the end of 1927 and the end of 1928 (9203 to 12666 shareholders). Chemical National Bank, another active acquirer, increased the number of shareholders by 10% during the same period, while Citibank saw a 17% increase during that period. Other New York banks, which did not pursue acquisitions as actively, increased their asset size by 29.5% and capital stock by 10.2%. In fact, National Bank of Commerce, First National Bank of New York, and National Park Bank did not increase their capital stock during this period. Unsurprisingly, these banks experienced a modest 7% increase in the number of shareholders. All of these slow-growing banks except for First National Bank were either acquired by other banks or trust companies or were targets for acquisitions. (Data are from Moody’s Investment Manuals.) 8 Calomiris and Oh (2019) analyze the pricing of these rights and their implications for whether Citibank shares were over-valued in the market in 1927-1929.

13
stockholders had the option to buy new share offerings, although they could also transfer
the right to buy to others (and these rights to buy traded as assets in the market). Given that
Citibank was an active equity issuer during the 1920s, it is important to bear in mind that its
paid in capital was growing rapidly in this decade. It remains somewhat unclear how
widely traded the rights to buy new shares were, and it is possible that during the 1920s
new share issues may have been purchased initially mainly by preexisting stockholders,
although our analysis below of the growth in shares owned by preexisting shareholders
suggests that a large number of rights were purchased by new shareholders.
Second, bank shares were traded in the OTC market within a network of dealers
specializing in bank and insurance stocks (the prices plotted in Figure 1 are weekly OTC
quotations from the Commercial and Financial Chronicle). These markets appear not to
have been as liquid as the New York Stock Exchange (NYSE), with transactions occurring
infrequently (Loeser 1940, O’Sullivan 2007), in bundles of a few shares, and in small
volume. Some of that illiquidity reflected the high prices of bank shares and the selective
nature of their shareholder base (Forum 1925, Gorton and Tallman 2015).
Third, from 1926 to 1928, the largest New York banks actively resisted ownership
by small shareholders.9 Several New York banks delisted from the New York stock
9 In January 1929, Citibank made use of the right to split its shares (which was granted in the McFadden Act of 1927). Kane and Wilson (1998) conjecture that during the stock boom banks may have wanted to attract small investors so that wealthy bank stockholders could sell high-priced shares to people with less wealth who would have less potential loss from double liability. As we discuss further below, this conjecture is not valid for Citibank. Like other large New York banks, it delisted from the NYSE in January 1928 to resist the increase in small buyers. Furthermore, large blockholders rarely sold their Citibank shares from January 1925 to January 1929. From 1925 to 1930, officers, directors, and their families we have been able to identify, which owned about a fifth of the bank, very rarely sold any of their shares while they were officers or directors.

14
exchange simultaneously in January 1928 in reaction to what they regarded as
unsustainable increases in their stock prices, which they (wrongly) saw as the result of the
exchange’s new practice of executing and reporting small stock purchase transactions for
their shares.10 The New York banks did not return to the New York Stock Exchange for
decades after delisting in 1928. New York banks, like other U.S. banks, traded primarily in
the OTC market before that delisting, and exclusively in the OTC market after the delisting.
These regulatory and institutional factors made Citibank somewhat unusual as an
issuer, both during the 1920s, and in comparison to present issuers.11 The combination of
the prohibition on stock splits, the use of rights offerings to distribute shares, and the
reliance on OTC markets for trading in shares, should have limited the number of
shareholders in Citibank, compared both to other fast-growing issuers of the time and even
more with respect to current issuers.
4. Data
We collected the lists of Citibank stockholders for January 1925, January 1927, and
January 1929. These data contain the names, addresses, and number of shares owned by
more than 80% of all shares on those dates.12 Because the data list names and addresses, it
10 That belief was proven incorrect by the continuing rise in stock prices after the banks delisted. 11 Also, from 1863 to 1935, national bank shareholders were subject to double liability, meaning that if the bank were liquidated and existing assets were inadequate to pay debtholders, shareholders could be assessed an additional amount equal to their paid in capital contributions (which equals the amount of net worth per share that is not attributable to the accumulation of retained earnings over time into the bank’s surplus and undivided profits accounts). Double liability meant that there was downside risk to owning shares beyond the loss of the entire amount invested, and this may have made shares less attractive to low-income stockholders. 12 Our stockholder lists are derived from the voting shares at the annual stockholders’ meeting. These comprise 82% of shares in 1925, 83% in 1927, and 84% in 1929.

15
is possible to match these data with other sources to link names across data bases. Our
Online Data Appendix describes our sources in detail. Table 1 reports which data are
gathered from which sources. Table 2 defines the variables used in our empirical analyses.
The remainder of this section provides a brief summary.
In our country-level analysis, we use a list of countries from Wimmer and Min
(2006) and match it with the shareholding and branch location information obtained from
Citibank’s archive (from voting records and annual reports, respectively). We restrict our
list of countries to exclude those in Africa, given that no African country had any Citibank
shareholders. We define countries as both imperial colonies and sovereign nations. In our
county-level analysis, data on demographic characteristics are from various Censuses, taken
from the ICPSR database. We also use information from Security Dealers of North America
to identify the locations of securities dealers throughout the U.S.
In our logit and tobit analysis of individuals’ shareholdings, we focus our attention
on the sample of individuals contained in the Directory of Directors in the City of New York
for 1929-1930 and examine how individual characteristics and network influences can
explain which of those business executives became a Citibank shareholder. The analysis is
performed separately for 1925, 1927, and 1929. This source lists each director and officer
of each corporation based in the New York City metropolitan area. Summary statistics for
all the variables used in our individual regression analysis are reported in Online Appendix
Table A1. Correlations are reported in Online Appendix Table A2.
For the sample of names contained in the Directory of Directors, we matched names
with several other sources. We matched names with our list of Citibank stockholders, with

16
a list of federal income taxpayers, with Citibank Annual Reports (which list officers and
directors), and with lists of names appearing in Poor’s Register of Directors for 1928 and
Who’s Who In America for 1928. Similarly, for other large New York banks, we collect
names of their officers and directors from the Directory of Directors. Other large New
York banks are defined as Bank of Manhattan, Chase National Bank, Chatham-Phenix
National Bank & Trust Co., Chemical National Bank, Corn Exchange Bank, First National
Bank of the City of New York, National Bank of Commerce, and National Park Bank. We
also identify individuals who work for securities dealers. Those firms are identified using
the Securities Dealers of North America (1929).
In many cases, using exact address matches or distinctive names, or both, we were
able to verify matches immediately. In other cases, where matches were not immediately
obvious, we employed a variety of methods to obtain additional matches while ensuring the
accuracy of our matching procedure. We used a variety of sources to verify that matches
were correct, including Ancestry.com, phone books, Manuscript Census data, and other
information. Generally, we had very few uncertain matches (only 18 cases in our matching
of Citibank shareholders with the Directory of Directors, and similarly small percentages
for other data sets). If we were unable to be sure of a match, despite our efforts, in the case
of Citibank shareholder identity, we conservatively assumed that the individuals were not
matches. In the other matching, we conservatively assumed that ambiguous matches were
actual matches. (The reason for this difference in procedure is that one of these variables is
our dependent variable, the others are independent variables.) Alternative treatment of

17
ambiguous matches (such as dropping them) does not affect our results. The full description
of the methods used for matching are reported in the Online Data Appendix.
Our taxpayer information comes from a unique release of information by the
Internal Revenue Service (IRS). In 1925, the IRS made income tax information on all
taxpayers available to the public. Newspapers throughout the country published this
information, with varying levels of detail and completeness. Typically, the published data
list the name, address, and the amount of income tax paid. Coverage differs somewhat
across locations. In some cities, published names include only the highest-paying taxpayers,
while in other cities, the list is more comprehensive. Data for the country as a whole, with
particular emphasis on residents located in the New York area, were collected from the
New York Times, which provides the most comprehensive list of taxpayers for the New
York City area. Although the data are only available for 1924, this source provides a unique
window into the levels of income of individuals.
Data from other business network sources (Poor’s Register of Directors for 1928
and Who’s Who In America for 1928) are used as indicators that an individual is
sufficiently prominent to be listed in those directories.
5. Trends in Shareholder Participation and Locational Differences
As Figure 3 shows, the number of Citibank shareholders grew dramatically from 1925 to
1930. The use of shares in the June 1926 acquisition of Peoples Trust Co., the February
1925, February 1927, and June 1928 rights offerings of new shares, a five-for-one stock
split in January 1929, the February 1929 rights offerings of new shares, the use of shares to

18
acquire shares of Farmers’ Loan & Trust Co. in June 1929, and perhaps the continuing
price boom itself resulted in the more than tripling of the number of stockholders during
1929 alone. From January 1925 to January 1929 – the period studied here – the number of
shareholders nearly tripled, even in the absence of a stock split, and despite the rising price
per share. Between January 1925 and January 1927, 5,315 new shareholders bought one
share of Citibank stock and held it until January 1927. Between January 1927 and January
1929, the comparable number was 6,334. The numbers of new shareholders who bought
five or fewer shares were 3,489 for 1925-1927 and 3,045 for 1927-1929.
As Figure 4 shows, the size composition of shareholders changed from January
1925 to January 1929. In 1925, 5.7% of shares were held by those that owned only one
share, but by January 1929, that had risen to 11.6% despite the steep rise in the price per
share. Mostly shares were owned by individuals; companies and organizations accounted
for less than 5% of shareholders and less than 15% of shares in both 1925 and 1929.
Online Appendix Figure A1 provides a map of Citibank shareholding in the U.S. by
county. The Northeast (as defined by the Census) accounted for 85% of Citibank’s shares,
and more than 61% of its shareholders in 1925. In January 1929, the proportions of shares
and shareholders in the Northeast were 79% and 64%. The Midwest (which was the next
largest region) accounted for 15% of shareholders in 1925 and 14% in 1929, and 6% and
9% of shares, respectively, in 1925 and 1929. Shareholding was concentrated in cities. In
January 1925 and January 1929, respectively, Manhattan alone accounted for 71% and 62%
of all Citibank’s shares, and 20% and 24% of its shareholders. In both January 1925 and
January 1929, the 15 counties (including Manhattan) that contained the greatest number of

19
shareholders accounted for 42% of Citibank shares and 52% of its shareholders. In most
counties (2,474 counties in 1925 and 2,379 in 1929), no Citibank shares were held (there
were a total of 3,064 counties in the United States in 1930).
A minority of shareholders sold their shares in Citibank from 1925 to 1929. 1,416
shareholders (or 26% of all shareholders) sold some or all of their shares between January
1925 and 1927 (that is the number who either were no longer listed as shareholders, or who
reduced their number of shares). The number of sellers for the period January 1927 to
January 1929 was 3,590 (or 38% of all shareholders). A large majority of current officers or
directors, or their family members we have been able to identify (which accounted for
roughly a fifth of total shares in 1925), never sold shares from January 1925 until January
1930. This contradicts the conjecture by Kane and Wilson (1998) that the sharp increase in
the number of shareholders for New York banks may have represented a shareholder “run”
in which blockholders shed stock during the price boom.
The small number of shareholders who sold shares from 1925 to 1929 – a period
when the number of shareholder rose by roughly 12,000 – exemplifies the potentially
important relationship between the rise in shareholders and issuance of new shares. The
warrants to purchase new shares distributed via the several rights offerings could be
transferred from existing shareholders to new shareholders via the network of dealers.
Using our data on shareholders in 1925, 1927, and 1929, along with data on the
rights13 to purchase new shares offered to existing shareholders in February 1925, February
13 The February 1925 warrants provided existing shareholders with the right to purchase one share for every four shares at $200 per share. The February 1927 warrants provided existing shareholders with the right to
20
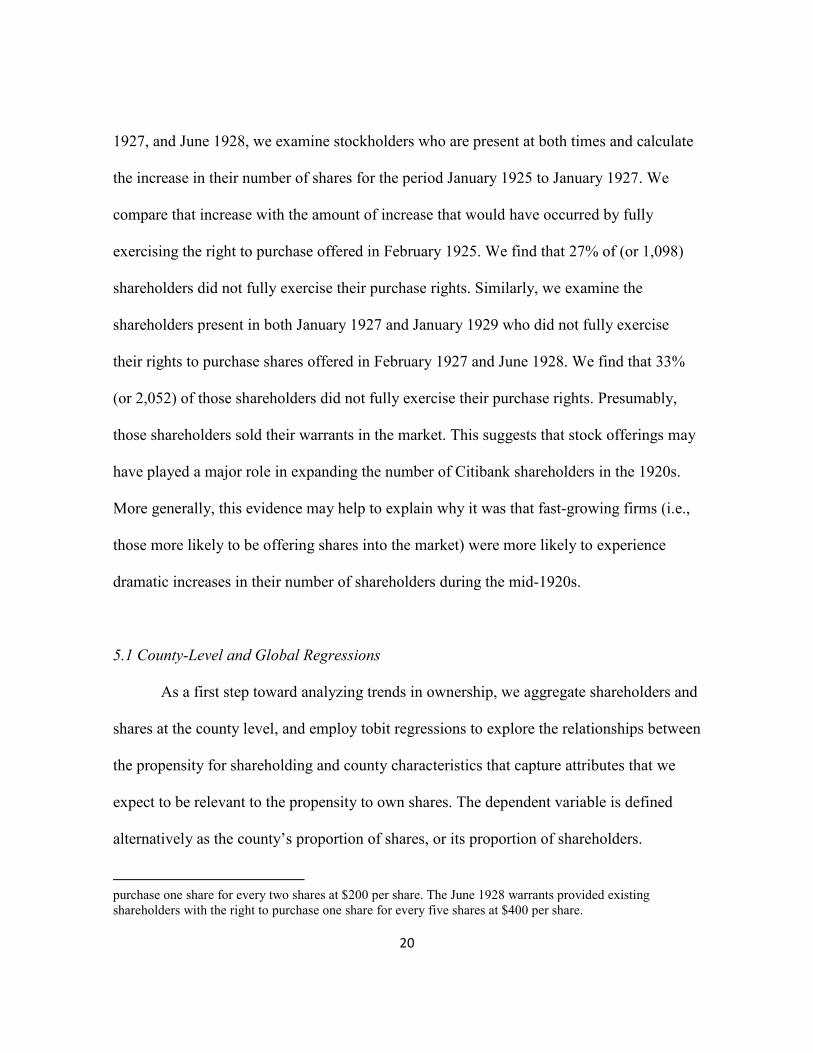
1927, and June 1928, we examine stockholders who are present at both times and calculate
the increase in their number of shares for the period January 1925 to January 1927. We
compare that increase with the amount of increase that would have occurred by fully
exercising the right to purchase offered in February 1925. We find that 27% of (or 1,098)
shareholders did not fully exercise their purchase rights. Similarly, we examine the
shareholders present in both January 1927 and January 1929 who did not fully exercise
their rights to purchase shares offered in February 1927 and June 1928. We find that 33%
(or 2,052) of those shareholders did not fully exercise their purchase rights. Presumably,
those shareholders sold their warrants in the market. This suggests that stock offerings may
have played a major role in expanding the number of Citibank shareholders in the 1920s.
More generally, this evidence may help to explain why it was that fast-growing firms (i.e.,
those more likely to be offering shares into the market) were more likely to experience
dramatic increases in their number of shareholders during the mid-1920s.
5.1 County-Level and Global Regressions
As a first step toward analyzing trends in ownership, we aggregate shareholders and
shares at the county level, and employ tobit regressions to explore the relationships between
the propensity for shareholding and county characteristics that capture attributes that we
expect to be relevant to the propensity to own shares. The dependent variable is defined
alternatively as the county’s proportion of shares, or its proportion of shareholders.
purchase one share for every two shares at $200 per share. The June 1928 warrants provided existing shareholders with the right to purchase one share for every five shares at $400 per share.

21
The vector of county characteristics, informed by the literature reviewed above,
includes 19 variables, which capture eight sets of influences: I. Distance from New York
City, II. Demography (total population, percentage white, percentage native white,
percentage rural, percentage of land in farmland, population per square mile, whether the
county contains a “megacity” – one of the 20 most populous cities as of 1930, the number
of manufacturing wage earners, and the percentage of population over age 45), III. Access
to Media (number of radios per family in the county), IV. Education (percentage illiterate,
percentage 16-17 year olds attending school), V. Wealth (the number of homes worth more
than $10,000 divided by the population, the total farm value per farm), VI. Presence of
Securities Dealers (number of dealers per capita in the county), VII. Economic Environment
(unemployment rate, rate of population growth from 1920 to 1930), and VIII. Presence of a
Citibank Branch (defined as any Citibank-affiliated office, exclusively consisting of
securities affiliate offices, located in that county). By 1928, there were 45 domestic
branches outside of New York City mostly located in the 50 largest cities based on the 1930
Census and 107 international branches, including both deposit-taking branches and
securities affiliate offices, in 28 countries in various regions such as Europe, Asia (China,
Japan, India, and Southeast Asia), and the Americas (Canada, Caribbean islands, Central
America, and South America).
Tobit regression results are reported in Table 3 for the percentage of Citibank
shareholders as a fraction of county population (Online Appendix Tables A3 and A4 report
similar regressions using percentage of shares held in the county, and the number of shares,

22
as alternative dependent variables). Counties closer to New York, with more expensive
homes, older residents, and higher population density all exhibit greater shareholding.
Table 3 reports tobit regressions for 1925, 1929, and the change from 1925 to 1929.
Distance from New York City, and several other county characteristics, are significant in
one or both years for explaining the propensity to own Citibank shares. All eight categories
of regressors capture important determinants of share ownership. Shareholding declines
with distance from New York (although this is less important in 1929 than in 1925), a
greater share of rural residents (also less important in 1929), and a higher proportion of
farmland. It increases with a higher share of expensive housing, greater population density,
megacity status, a greater share of older residents, total population size, and more radios per
family (which is less significant in 1929). Interestingly, the presence of manufacturing is
associated with a lower percentage of shareholders, but a larger number of shares (Online
Appendix Tables A3 and A4). It may be that manufacturing is associated with a greater
degree of inequality (capitalists hold more shares, workers do not). After controlling for all
these county characteristics, the presence of a Citibank branch significantly raises the
percentage of shareholders in both 1925 and 1929, although the effect is much larger in
1925. In Online Appendix Tables A3 and A4, we find it also is associated with a higher
percentage of shares and a higher number of shares in that county. Interestingly, the effect
of the presence of a Citibank branch is much more persistently large (in 1929 relative to
1925) in its effect on the percentage of shares or the number of shares 1929 than it is on the
percentage of shareholders. This suggests that over time, the availability of a Citibank

23
branch matters more for the intensive margin (more shares purchased by shareholders) than
the extensive margin (the number of new shareholders).
The results that examine the effects of these regressors on within-county changes in
shareholding from 1925 to 1929 tend to show smaller, and often insignificant, coefficients.
There are several possible interpretations of those findings. First, it could be that
stockholding adjusts slowly to changes in the environment. Second, it could be that the
observable county characteristics used in the regressions partly proxy for unchanging
unobservable characteristics. Under the latter interpretation, new branches are not as highly
correlated with changes in the important unobservable characteristics. Third, it may be that
there is structural change over time in the importance of some influences. For example, if
familiarity with shareholding increases over time for some segment of the population, that
could reduce the importance of other influences for explaining shareholding. In particular,
this could explain the reduced coefficients on distance from New York, and on Citi branch,
as well as some of the other coefficients. Finally, with respect to the Citi branch effect, the
number of new branches established between 1925 and 1929 outside of New York is small
(six), which also could explain the lack of significance of the estimate of the effect of
within-county change in branch presence.
Table 4 reports country-level tobit results that examine the effects of Citibank
branches on the percentage of shareholders in the population of each country (Online
Appendix Tables A5 and A6 report results for percentage of shares and number of shares).
We find that both the existence of a Citibank branch, and the number of branches, are
associated with substantially greater Citibank shareholding. As in the county-level

24
regressions, the within-country coefficient estimate (examining the effect of change from
1925 to 1929 in branch locations) tends to be small and statistically insignificant. As
before, there are four alternative explanations for that finding (including the fact that only
three countries saw Citibank enter between 1925 and 1929).
Thus, although the results in Tables 3 and 4 are suggestive of the importance of
familiarity, they are not conclusive. In particular, they do not allow us to discern whether
the small and insignificant coefficients related to the change in Citibank branches from
1925 to 1929 reflect adjustment lags, unobservable heterogeneity, changes in the
importance of the influence over time, or a small sample of new branches. Our analysis of
individual decisions in Section 6 is helpful in providing less ambiguous evidence of the
importance of familiarity.
6. Regression Analysis of New York City Business Network Influences on Share Purchases
6.1 Business Executives Sample, Variables and Methods
Here we analyze the determinants of New York City business executives’ decisions
to become Citibank shareholders. We analyze the decisions separately for each of our three
sample years: 1925, 1927, and 1929. We report both logit and tobit results, where the logits
predict whether an individual is a shareholder, and the tobits predict the number of shares
owned. For the 1927 and 1929 analysis, we are also able to identify “new” shareholders,
defined as those that were not present in the prior sample of shareholders.14
14 We also experimented with analyzing exits by stockholders, but the number of exits in our sample of New York business executives was small. Even using our broad definition of stockholders, which includes corporate holdings, the number of stockholders in 1925 who exited by 1927 was 31 out of 434, and the
25
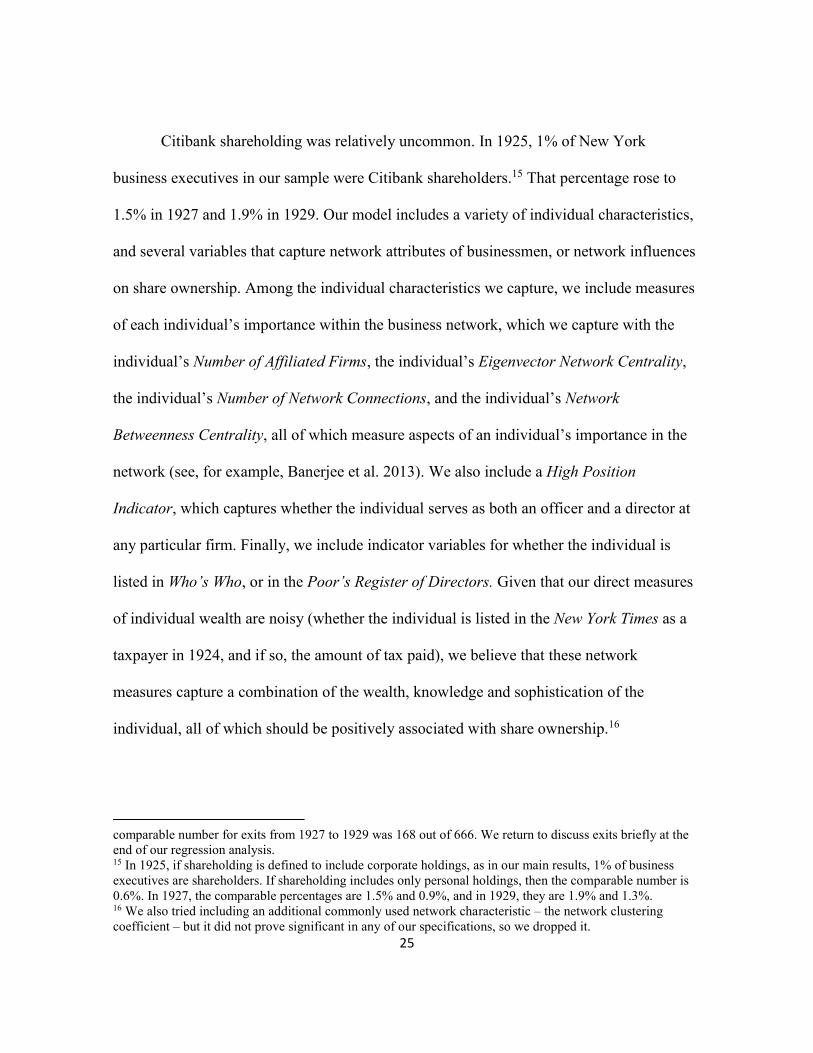
Citibank shareholding was relatively uncommon. In 1925, 1% of New York
business executives in our sample were Citibank shareholders.15 That percentage rose to
1.5% in 1927 and 1.9% in 1929. Our model includes a variety of individual characteristics,
and several variables that capture network attributes of businessmen, or network influences
on share ownership. Among the individual characteristics we capture, we include measures
of each individual’s importance within the business network, which we capture with the
individual’s Number of Affiliated Firms, the individual’s Eigenvector Network Centrality,
the individual’s Number of Network Connections, and the individual’s Network
Betweenness Centrality, all of which measure aspects of an individual’s importance in the
network (see, for example, Banerjee et al. 2013). We also include a High Position
Indicator, which captures whether the individual serves as both an officer and a director at
any particular firm. Finally, we include indicator variables for whether the individual is
listed in Who’s Who, or in the Poor’s Register of Directors. Given that our direct measures
of individual wealth are noisy (whether the individual is listed in the New York Times as a
taxpayer in 1924, and if so, the amount of tax paid), we believe that these network
measures capture a combination of the wealth, knowledge and sophistication of the
individual, all of which should be positively associated with share ownership.16
comparable number for exits from 1927 to 1929 was 168 out of 666. We return to discuss exits briefly at the end of our regression analysis. 15 In 1925, if shareholding is defined to include corporate holdings, as in our main results, 1% of business executives are shareholders. If shareholding includes only personal holdings, then the comparable number is 0.6%. In 1927, the comparable percentages are 1.5% and 0.9%, and in 1929, they are 1.9% and 1.3%. 16 We also tried including an additional commonly used network characteristic – the network clustering coefficient – but it did not prove significant in any of our specifications, so we dropped it.

26
We expect that, ceteris paribus, individuals that work in the financial industry may
be more likely to purchase Citibank shares, owing to their greater familiarity with banking.
We include an indicator variable that captures this effect.
To measure network influences on share purchases, we identify linkages that are
plausibly unidirectional. We do so in two ways. First, when analyzing all shareholders as of
a given date, we assume that Citibank officers and directors are a source of influence on the
share purchases of others in the network, but are not themselves influenced by others to buy
Citibank shares.17 For that reason, we drop Citibank officers and directors from the
dependent variables18 in our regressions (because their stock ownership was not a choice in
the same way as others’ decisions were), but we include them as influencers in the
measures of network influence. Second, when analyzing new shareholders (those that have
become shareholders in the past two years) we assume that, with respect to network
influences coming from non-Citibank officers and directors, those influences are causal
only if the presumed influencing shareholders had owned Citibank shares two years before,
and still own them. We regard this as a conservative assumption.
We measure these two channels of network influence separately by constructing
variables that capture either the network influence of current Citibank officers and
17 In 1925, 8 of the 36 Citibank officers and directors did not hold shares. In 1927, 18 out of 56 officers and directors did not hold shares. In 1929, 14 out of 54 officers and directors did not hold shares. The rising number of officers and directors from 1925 to 1929 reflected new reporting conventions after 1926 that included lower-level officers in the reported figures. As noted elsewhere, in robustness analysis, we find that restricting the definition of officers and directors to the earlier, higher standard does not affect our results. 18 We also drop seven individuals from our sample who we were able to identify as close relatives of Citibank officers and directors (cousins, nephews, or immediate family). Presumably, those individuals would have been influenced by their familial relations, not just their business contacts. In our 2018 NBER Working Paper draft of this paper, we had not removed those observations, which accounts for some differences from that version’s tobit coefficients.

27
directors, or that capture the influence of prior (and still holding) shareholders who are not
Citibank officers and directors.19 We allow both of those measures to influence stock
purchasing either through a direct network connection (where the subject and the
influencing party share an affiliation as officers or directors of the same firm) or through a
one-off connection (where they are each connected to a common person, but not connected
directly to each other). In various robustness tests we considered additional indirect
connections, but found no evidence of their importance.20
Our measure of share ownership includes shares owned by a corporation in which
the individual is an officer or director. We allocate those shares equally among officers and
directors. In cases where we lacked a complete list of officers and directors, we divided by
five when assigning shares to executives present in our sample. In Online Appendix Tables
A7-A16, we report results where we exclude corporate-owned shares and confine the
definition of shareholding to shares actually owned by individuals. Results are very similar.
If shares are owned by the spouse of a business executive present in our network,
and if that spouse is not listed in the Directory, we assign those shares to the spouse listed
19 In robustness tests, we also constrained the set of influencing Citibank officers and directors to those who had been officers or directors for at least two years. The results were nearly identical, although the size of marginal effects on the influence of Citibank officers and directors were somewhat larger in that alternative specification. We also limited our definition of Citibank officers and directors in several additional robustness checks. We experimented with excluding lower level officers and directors, or those whose status was the result of a merger with Peoples Trust; in both cases, results were very similar. 20 In robustness tests, we also weighted each member of the network’s influence by their importance in the network, measured in various alternative ways, such as Eigenvector Network Centrality, Number of Network Connections, Network Betweenness Centrality, the Poors Indicator, the IRS Tax Indicator, and the Who’s Who Indicator. In all cases, weighted results were very similar to our unweighted results reported below. We also experimented with weighting each network connection by the number of affiliated firms of each person with whom one is connected. Finally, we tried incorporating twice-removed network connections (one step further removed than once-removed). The results were very similar to those reported here, and there were no significant influences from twice-removed connections.

28
in the Directory. Concerned that very large shareholdings might distort our analysis, we
tried truncating the number of shares in the tobit regressions at the 95th percentile; tobit
results using truncated measures of numbers of shares are similar to those reported here.
Some shareholders managed their voting through a financial institution. Citibank
branches in New York were particularly common as addresses to which shareholder proxies
were sent. From 1925 to 1929, the number of shareholders whose proxies were sent to
Citibank branches in the New York area grew from 109 to 369, while the number of shares
associated with those shareholders more than quadrupled. For the New York area as a
whole, the rate of growth in the number of shareholders was similar, but the growth in the
number of shares merely doubled. It is possible that contact with New York branches may
have encouraged Citibank shareholding.
6.2 Logit Results for All Shareholders in 1925, 1927, and 1929
Online Appendix Table A1 provides summary statistics for all the variables used in
the regressions reported in subsequent tables. Logit results for all shareholders present in
the proxy list for January 1925 are reported in Table 5. Variables that capture income, and
whether the individual is employed in the financial sector – which provide a baseline
parsimonious specification (excluding network influences) – are reported in Column (4).
Those variables are highly statistically and economically significant. If an executive works
in the financial sector, that increases the probability of owning Citibank shares in 1925 by
1.95percent. Thus financial executives are nearly three times as likely to own Citibank
shares as other executives (the unconditional mean proportion of New York executives

29
owning shares is 0.94 percent). After controlling for other influences, the marginal effect
falls to 0.91 percent in column (8), which is still nearly equal to the unconditional mean.
Being wealthy enough to be on the reported IRS list raises the probability by 1.21 percent
in column (4) and by 0.80 percent in column (8). The amount of tax recorded is also highly
significant, but the magnitude of the effect is small. If an individual pays a standard
deviation more ($15,915) tax than the mean of $1,467, the marginal effect implies a 0.03
percentage point increase in the probability of being a shareholder in column (4), and third
that effect in column (8). The fact that the IRS payment coefficient declines in magnitude
as other measures of individuals’ characteristics are added to the model confirms the view
that these other measures capture aspects correlated with income or wealth.
One of the variables (the Poors Indicator) capturing individual status (reflecting
income, wealth, sophistication, or knowledge) is robustly statistically and economically
significant. The Poors Indicator marginal effect implies that being listed in Poor’s raises
the probability of being a shareholder by 0.28 percentage point in column (5), and by a bit
less in columns (6)-(8). These effects are large relative to the unconditional mean of nearly
1 percent. The No. of Affiliated Firms is highly significant statistically in column (5), but
not in the presence of other network controls, and the effect is small in magnitude, ceteris
paribus. At the mean, a standard deviation increase in the number of firm affiliations raises
the probability of being a shareholder by 0.05 percentage point in column (5) and 0.02
percentage point in the other columns. The No. of Network Connections is also an important
predictor of share ownership in 1925; a standard deviation increase raises the probability of

30
owning Citibank shares by 0.16 percent. Other individual characteristic variables are not
economically or statistically significant.
Contact with Citibank officers and directors influences share purchase decisions by
1925, and those influences are economically and statistically significant.21 Moreover, we
find that indirect network influences are large and statistically significant, not only direct
ones. Table 11 reports various approaches to gauging the importance of network influences,
using the estimated coefficients from the final columns of regressions reported in Tables 5-
9 and the estimated coefficients from each column in Table 10. For purposes of
comparison, Table 11 also gauges the importance for increasing the probability of being a
Citibank shareholder of being included in the IRS tax data.
The entry in the first column and first row of Table 11 calculates that, in 1925,
replacing a direct network connection that is a non-Citibank officer/director with a Citibank
officer/director raises the probability of being a Citibank shareholder by 0.51 percent,
which is more than half of the unconditional mean of 0.94 percent. We gauge the
importance of the effect of once-removed (indirect) network connections in two ways in
Table 11. First, we consider replacing one indirect connection that is not a Citibank
officer/director with one that is. This raises the probability of being a shareholder by 0.05
percent in 1925. Note, however, that the number of indirect connections is much larger than
21 When considering the influence of financial professionals, like Citibank officers and directors, within the network, it is important to bear in mind that, on average, finance professionals are more influential than others. Working in the financial industry is correlated 0.55 with the number of network connections, 0.36 with eigenvector centrality, and 0.31 with betweenness centrality. Financial executives also have higher than average once-removed business connections with other financial executives. This led us to consider whether to also construct a network analysis confined to a sample of financial professionals. We did so and found similar results to those reported here (see Online Appendix Tables A17-A27).

31
the number of direct connections. While the number of direct connections averages about
7.4, the number of indirect connections averages about 110.7. One way to compare the
magnitudes of the direct and indirect effects is to consider replacing non-Citibank
officer/director indirect connections with a 1/7.4 proportion of Citibank officer/director
indirect connections. The third column of numbers in Table 11 reports that marginal effect,
which is 0.4 percent (which is roughly comparable to the direct effect).
An individual’s importance in the network is gauged by three variables: No. of
Network Connections, Eigenvector Network Centrality, and Network Betweenness
Centrality. The first of these displays a robust positive and significant coefficient, while the
latter two are negative and not significant statistically in the final column of Table 5.
The Pseudo-R2 and AIC statistics show that adding network influence effects (the
first two variables in the table) improves the overall fit of the model, even after controlling
for other influences (the Pseudo-R2 rises from 0.137 in column (6) to 0.142 in column (8).
The results for Tables 6 and 7, which report identical models to those for Table 5,
but for the years 1927 and 1929, are broadly similar to Table 5, with some exceptions: the
two network centrality measures are more statistically significant in Tables 6 and 7 than
they were in Table.5, and the High Position Indicator is marginally significant for 1927.
Interestingly, the Pseudo R2 of the models in column (8) of the tables declines from 1927 to
1929 (it is 0.142 in 1925 and 0.142 in 1927, and falls to 0.108 in 1929). The incremental
effect of our network influences (the change in Pseudo R2 from column 6 to column 8) is
similar across the three years.
32
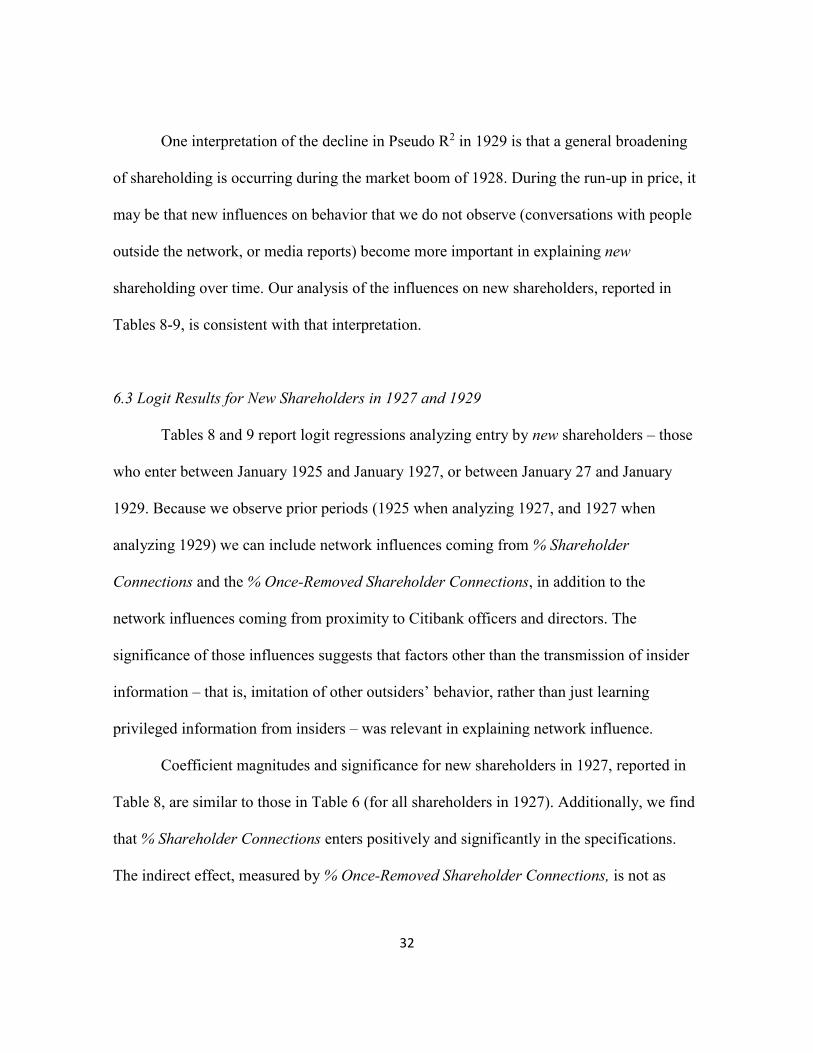
One interpretation of the decline in Pseudo R2 in 1929 is that a general broadening
of shareholding is occurring during the market boom of 1928. During the run-up in price, it
may be that new influences on behavior that we do not observe (conversations with people
outside the network, or media reports) become more important in explaining new
shareholding over time. Our analysis of the influences on new shareholders, reported in
Tables 8-9, is consistent with that interpretation.
6.3 Logit Results for New Shareholders in 1927 and 1929
Tables 8 and 9 report logit regressions analyzing entry by new shareholders – those
who enter between January 1925 and January 1927, or between January 27 and January
1929. Because we observe prior periods (1925 when analyzing 1927, and 1927 when
analyzing 1929) we can include network influences coming from % Shareholder
Connections and the % Once-Removed Shareholder Connections, in addition to the
network influences coming from proximity to Citibank officers and directors. The
significance of those influences suggests that factors other than the transmission of insider
information – that is, imitation of other outsiders’ behavior, rather than just learning
privileged information from insiders – was relevant in explaining network influence.
Coefficient magnitudes and significance for new shareholders in 1927, reported in
Table 8, are similar to those in Table 6 (for all shareholders in 1927). Additionally, we find
that % Shareholder Connections enters positively and significantly in the specifications.
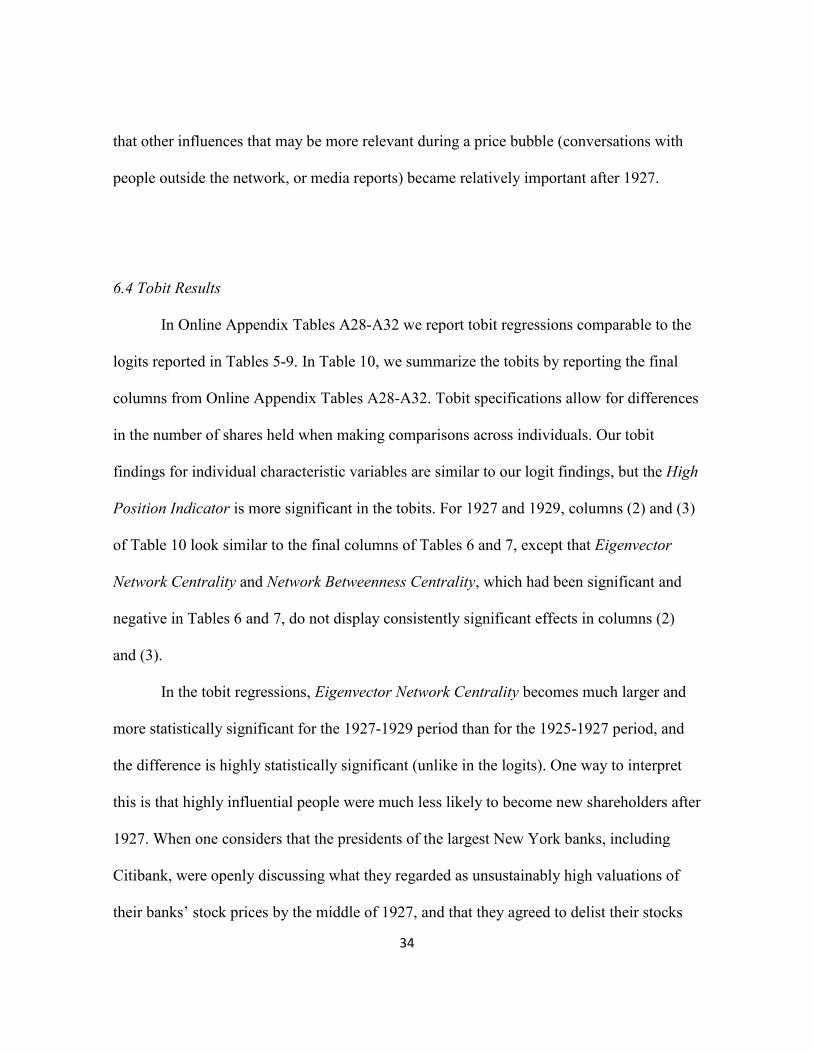
The indirect effect, measured by % Once-Removed Shareholder Connections, is not as

33
robustly significant (it is significant at only the ten percent level in 1927 in column (11) of
Table 8).
The importance of % Shareholder Connections is measured in Table 11. For the
1925-1927 period, replacing a non-Citibank shareholder as a direct connection with a
Citibank shareholder raises the probability of becoming a Citibank shareholder between
1925 and 1927 by 0.15 percent, which is a quarter of the mean probability of becoming a
Citibank shareholder during that period (0.59 percent). This is comparable in magnitude to
the effect of replacing a non-Citibank shareholder with a Citibank officer/director (which
raises the probability of becoming a shareholder by 0.25 percent in the period 1925-1927,
as shown in the first column and second row of numbers in Table 11).
The results for the period 1927-1929, in Table 9 and 11, are similar, but the
Officer/Director Connections marginal effect is larger (0.32 percent, as reported in Table
11), and the Shareholder Connections effect is smaller (0.15 percent).
Not only is the Pseudo-R2 of the 1929 models for new shareholders lower than for
new shareholders in 1927, the explanatory power of the once-removed network influences
of officers and directors, and of shareholders, are diminished relative to prior years,
although other network marginal effects remain similar for 1925-1927 and 1927-1929. The
incremental improvement in Pseudo-R2 (the increase from column 6 to column 11 of Table
9) is only 0.002, in comparison to the much greater 0.021 difference visible in Table 8. In
other words, the models, and network influences in particular, do not tell us as much about
becoming a new shareholder in 1929 as they did in 1927. This is consistent with the view
34
that other influences that may be more relevant during a price bubble (conversations with
people outside the network, or media reports) became relatively important after 1927.
6.4 Tobit Results
In Online Appendix Tables A28-A32 we report tobit regressions comparable to the
logits reported in Tables 5-9. In Table 10, we summarize the tobits by reporting the final
columns from Online Appendix Tables A28-A32. Tobit specifications allow for differences
in the number of shares held when making comparisons across individuals. Our tobit
findings for individual characteristic variables are similar to our logit findings, but the High
Position Indicator is more significant in the tobits. For 1927 and 1929, columns (2) and (3)
of Table 10 look similar to the final columns of Tables 6 and 7, except that Eigenvector
Network Centrality and Network Betweenness Centrality, which had been significant and
negative in Tables 6 and 7, do not display consistently significant effects in columns (2)
and (3).
In the tobit regressions, Eigenvector Network Centrality becomes much larger and
more statistically significant for the 1927-1929 period than for the 1925-1927 period, and
the difference is highly statistically significant (unlike in the logits). One way to interpret
this is that highly influential people were much less likely to become new shareholders after
1927. When one considers that the presidents of the largest New York banks, including
Citibank, were openly discussing what they regarded as unsustainably high valuations of
their banks’ stock prices by the middle of 1927, and that they agreed to delist their stocks

35
from the New York Stock Exchange in January 1928 to try to remedy that situation, this is
not surprising. This is reminiscent of the pattern described by Temin and Voth (2004)
regarding the actions of Hoare’s Bank during the South Sea Bubble. Hoare’s Bank (a very
informed market participant) sold its positions and profited from getting out before the
bubble burst.
The patterns of marginal effects for network influences in the tobit regressions
(reported in the bottom half of Table 11) are roughly comparable to those in the logits,
although their scaling is different (as these measure numbers of shares rather than
probability of being a shareholder).
We find that, as in the logit analyses of new shareholders, the statistical significance
and the size of the marginal effects of the once-removed network influences of officers and
directors are much smaller for the 1927-1929 period than for the 1925-1927 period,
however the same is not true for once-removed shareholder effects. Unlike the logits, the
marginal effect of once-removed shareholder influences remains similar to the earlier
period. As in the logits, the incremental importance of adding network influence for Pseudo
R2 declines in the 1927-1929 period (as shown in Online Appendix Tables A31 and A32).
22 We think these findings corroborate the view that during the price bubble other
influences on executives (conversations with people outside the network, or media reports)
became increasingly influential on the behavior of buyers, in general.
22 This pattern also holds when we exclude corporate holdings, as shown in the Online Appendix Tables A7-A16, but the magnitude of the decline in the importance of network linkages is less in that sample, and the statistical significance of networks effects is similar.

36
In the Online Appendix, we report additional logit and tobit regressions, which
either confine the sample to individual holdings (Online Appendix Tables A7-A16), or
which exclude from the sample firms that were not connected to other firms in the New
York City network of business executives (Online Appendix Tables A33-A42). As Online
Appendix Figure A2 shows, firms can be divided into two groups: connected firms those
that were part of the “main network,” which tended to employ executives employed by
other firms as officers and board members, and disconnected firms that did not (the “donut”
of disconnected firms shown in the full network panel of Online Appendix Figure A2). The
results for these sample variations are broadly comparable to those reported here. As Online
Appendix Table A43 shows, marginal effects related to network influences tend to be larger
for the restricted (main network) sample.
6.5 Exits
There are too few exits in our sample for us to analyze exits reliably using
regression analysis. Even using our broad definition of stockholders, which includes
corporate holdings, the number of stockholders in our sample in January 1925 who exited
by January 1927 was 29 out of 402, and the comparable number for exits from 1927 to
1929 was 164 out of 626. For the latter period we experimented with running logits and
tobits similar in structure to those reported in Tables 8 and 10. Given the small sample, we
found no significant effects for most variables, but we did find that % of Officer/Director
Connections is robustly negatively and significantly associated with the propensity to exit,
which is consistent with the opposite effect of that same variable in predicting new

37
shareholding. Interestingly, the IRS Tax Indicator is a negative predictor of exits (similar to
its opposite effect for predicting purchases), but the IRS Tax Indicator * Tax Payment is a
positive predictor. The latter effect indicates that very wealthy people were among those
exiting between January 1927 and January 1929.
6.6 Placebo Test of Citibank Officer and Director Network Influences
Our findings regarding the network influence of Citibank officers and directors is
subject to an alternative interpretation. It could be that network contact with any prominent
New York banker, not just with a Citibank officer and director, encourages someone to
purchase New York banks’ stock, including that of Citibank. If that were true, then it would
imply a somewhat different conception of the effect of network connections on fostering
familiarity, one that sees familiarity as a sectoral attribute, rather than firm-specific.23
To investigate this alternative view, we perform a placebo test. We include a
variable indicating that a person is an officer or directors of another large New York bank,
as of 1929 and test whether contact with this type of individual, as distinct from Citibank
officers and directors, influences people to purchase Citibank stock. (Because we are
unable to identify holders of other New York banks’ stock, we are unable to include a
similar variable to test for their network influence on the purchase of Citibank shares.) We
23 We also considered the possibility that network contact with anyone working at a securities dealer might make someone more likely to buy stock in general, including Citibank stock. In results not reported here, we investigated whether contact with dealer employees affected Citibank stock purchases and found that it was always insignificant.

38
summarize these findings for the logit regressions in Table 12 and report the full results in
Online Appendix Tables A44-53.24
We find that the coefficients on all the network influence variables related to
Citibank officers and directors, or Citibank shareholders, are unchanged. This is true of the
logit and tobit regressions in all the sample years. Interestingly, the % of Large Bank
Connections variables do enter significantly in most specifications. The % of Once-
Removed Large Bank Connections variable enters positively in columns (1)-(4) of Table
12, which supports the hypothesis of a general sectoral familiarity effect. However, the
direct effect, measured by the % of Large Bank Connections variable, enters negatively and
significantly in columns (1)-(4) of Table 12. Both direct and indirect (once-removed) Large
Bank Connections become insignificant in column (5), which captures the effects for new
shareholders in the 1977-1929 period. Replacing a direct (indirect) network connection that
is a non-Citibank officer/director with a Citibank officer/director raises by the probability
of being a Citibank shareholder by 0.49 (0.34) percent in 1925, roughly equal in magnitude
to the entry in the first column and first row (entry in the third column and first row) of
Table 11. Replacing a direct (indirect) network connection to an individual who is not an
officer/director of a large NYC bank other than Citibank with an officer/director of a large
NYC bank other than Citibank reduces (raises) the probability of becoming a Citibank
shareholder by a smaller magnitude of -0.2 (0.27) percent. We interpret these findings as
24 Additionally, as another test to distinguish between sectoral and firm-specific conceptions of familiarity, we performed an analysis to see whether Citibank officers and directors’ influence was also evident on other people in the financial sector. We did so by limiting the network to those in the financial sector and testing to see if Citibank officer and director network influences were still present. We found that they were, which further confirms our firm-specific familiarity interpretation (see Online Appendix Tables A17-A27).

39
indicating that direct connections to a non-Citibank New York bank officer or director
made someone less likely to buy Citibank stock because it made them more likely to be
interested in Citibank’s competitors. However, the fact that the sign is positive for once-
removed influences suggests that once-removed influences, including perhaps those related
to Citibank officers and directors’ influence, may reflect a sectoral familiarity effect. The
insignificance of both effects for explaining new shareholders in the 1927-1929 is
consistent with other results that point to the declining explanatory value of our model, and
of network influences in particular, for explaining who became a stockholder during that
period.
7. Conclusion
Citibank’s list of shareholders grew rapidly in the 1920s, which reflected its active issuance
of new shares, and the fact that a large proportion of existing Citibank shareholders elected
not to take full advantage of their option to purchase new offerings, which were offered to
existing shareholders on a pro-rata basis.
Citibank shares sold at a high price per share throughout the 1920s, and this limited
prospective stockholders to wealthy individuals and corporations. Home bias and
familiarity bias also limited share purchases, as indicated by an analysis of differences
across counties in their aggregate shareholdings, including distance from New York City,
and various demographic characteristics.
We believe ours is the first analysis of individual stockholding choice that combines
a list of candidate stockholders (New York City business executives), a list of a company’s
40
stockholders, and data about the attributes of the business executives. We analyze the
effects of Citibank branch presence on stockholding outside of New York, and find that
both within and outside the U.S. shareholding was positively associated with Citibank
presence, and negatively associated with distance and various demographic influences.
Our analysis of shareholdings by business executives working in New York City
reveals that for local, relatively wealthy individuals, the probability of being a Citibank
shareholder was roughly 1% in January 1925 and 2% in January 1929. We collect data on
individual characteristics of New York City business executives during our sample period
and construct a map of the New York City corporate network of officers and directors,
which we use to gauge the influences on share purchase decisions. We construct models to
predict which executives became Citibank stockholders by 1925, 1927, and 1929.
We find that financial sector executives were much more likely to become Citibank
shareholders than others. Proxies for income, wealth, and influence are also associated with
significantly probabilities of buying Citibank shares. However, that pattern reverses
somewhat during the price boom in Citibank shares, as the most influential executives
(measured by their position in the local business network) became less likely to become
shareholders. Furthermore, after January 1927, individual characteristics became weaker
predictors of shareholder status, indicating that other influences not captured by our model
became relatively more important in explaining the rising number of shareholders.
Members of the business network were influenced to become shareholders by others
with whom they had contact. Sharing a corporate affiliation with a Citibank officer or
director increased the probability of becoming a Citibank shareholder, as did sharing an
41
indirect, once-removed affiliate connection. Sharing a corporate affiliation with a prior (and
still holding) Citibank shareholder also increased the probability of becoming a shareholder
in 1927 and 1929. That evidence shows that network influence was not merely the result of
the transmission of inside information, but also reflected other kinds of learning and
imitation of outside investors with whom executives had contact. We interpret our findings
about the effects of stockholders who were not Citibank officers and directors on other
executives’ purchase decisions as evidence about familiarity bias. Business contacts with
existing Citibank stockholders helped to increase familiarity with Citibank shares.
By 1929, we find that network influences on new shareholding had lessened. By
1929, only direct connections with Citibank officers and directors or prior shareholders
continued to matter robustly for explaining new shareholding.
New York bankers that were officers and directors of competing banks also
influenced people in the network. Direct connections to these people reduced the propensity
to buy Citibank stock, while once-removed connections to them tended to increase it. This
evidence suggests that familiarity with competing institutions’ stocks may have reduced the
probability of buying Citibank shares, and that once-removed information may influence
familiarity more at the sectoral than firm-specific level.
Our findings have several implications for the literature on familiarity bias. Our
national and international findings are suggestive of the effects of the physical presence of a
firm on local willingness to buy its shares. We also confirm in our county-level regressions
that physical distance is a barrier to familiarity.

42
In our individual-level regressions, we find that knowledge of a specific industry
(finance, in our case) is an important contributor to familiarity. It is noteworthy that this is
true even within a sample of relatively sophisticated business executives. Our findings
about influence within the network also show how interactions among business executives
within a network can reduce barriers by making individuals more familiar with a
company’s stock. Finally, the evidence about changes in the importance of network
influences over time indicates that familiarity barriers are not constant. During the stock
price boom of the late 1920s, the increasing public visibility of Citibank shares seems to
have made investors increasingly familiar with Citibank stock, lessening the role of
network connections to overcome barriers from unfamiliarity.

43
References
Banerjee, Abhijit, Arun Chandrasekhar, Esther Duflo, and Matthew O. Jackson (2013). “The Diffusion of Microfinance,” Science 341.
Baskin, Jonathan Barron, and Paul J. Miranti, Jr. (1997). A History of Corporate Finance, Cambridge: Cambridge University Press.
Bekaert, Geert, K. Hoyem, W. Hu, and Enrichetta Ravina (2016). “Who Is Internationally Diversified: Evidence from 401(k) Plans of 296 Firms,” Columbia Business School.
Berle, Adolf A., Jr., and Gardiner C. Means (1932). The Modern Corporation and Private Property, New York: Macmillan.
Busbee, Brian J., and Gregory S. Miller (2012). “Investor Relations, Firm Visibility, and Investor Following,” Accounting Review 87, 867-897.
Calomiris, Charles W. (1995). "The Costs of Rejecting Universal Banking: American Finance in the German Mirror, 1870-1914," in The Coordination of Economic Activity Within and Between Firms, N. Lamoreaux and D. Raff, eds., 257-312, University of Chicago Press.
Calomiris, Charles W. (2002). “Banking and Financial Intermediation,” in Technological Innovation and Economic Performance, Benn Steil, David G. Victor, and Richard R. Nelson, eds., 285-313, Princeton: Princeton University Press.
Calomiris Charles W., and Elliot S. M. Oh (2019). “Using Citibank Rights Offering Prices to Gauge the 1929 Stock Market Bubble,” Working paper.
Calomiris, Charles W., and Daniel M.G. Raff (1995). "The Evolution of Market Structure, Information, and Spreads in American Investment Banking," in Anglo-American Finance: Financial Markets and Institutions in 20th-Century North America and the U.K., R. Sylla and M. Bordo, eds., Business One Irwin, 1995, 103-160.
Carosso, Vincent P. (1970). Investment Banking in America: A History, Cambridge: Harvard University Press.
Carosso, Vincent P. (1979). More than a Century of Investment Banking: the Kidder, Peabody & Co. Story, New York: McGraw Hill.

44
Cohen, L., A. Frazzini, C. Malloy (2008). “The Small World of Investing: Board Connections and Mutual Fund Returns,” Journal of Political Economy 116, 951–979.
Cohen, L., A. Frazzini, and C. Malloy (2010). “Sell-Size School Ties,” Journal of Finance 65, 1409-1437.
Coval, Joshua D., and Tobias J. Moskowitz (1999). “Home Bias at Home: Local Equity Preference in Domestic Portfolios,” Journal of Finance 54, 2045-2073.
Craft, Timothy M. (2006). “Home Bias Makes Sense for U.S. Pension Plans,” Journal of Portfolio Management Spring, 26-32.
Dahlquist, Magnus, Lee Pikowitz, Rene M. Stulz, and Rohan Williamson (2002). “Corporate Governance, Investor Protection, and the Home Bias,” Tuck-JFQA Contemporary Corporate Governance Issues II Conference.
Edwards, George W. (1938). The Evolution of Finance Capitalism, New York: Longmans Green & Co.
Forum (1925), “Bank Stocks as Investments,” Forum, July, p. 6.
French, Kenneth, and James Poterba (1991). “Investor Diversification and International Equity Markets,” American Economic Review 81, 222-226.
Friend, Irwin, G. Wright Hoffman, Willis J. Winn, Morris Hamburg, and Stanley Schor (1958). The Over-the-Counter Securities Markets, New York: McGraw Hill.
Friend, Irwin, James R. Longstreet, Morris Mendelson, Ervin Miller, and Arleigh P. Hess, Jr. (1967). Investment Banking and the New Issues Market, New York: World Publishing.
Giannetti, Mariassunta, and Luc Laeven (2012). “The Flight Home Effect: Evidence from the Syndicated Loan Market during Financial Crises,” Journal of Financial Economics 104, 23-43.
Giannetti, Mariassunta, and Yishay Yafeh (2012). “Do Cultural Differences Between Contracting Parties Matter: Evidence from Syndicated Bank Loans,” Management Science 58, 365-383.
Gorton, Gary, and Ellis Tallman (2015). “How Did Pre-Fed Banking Panics End?” Working Paper, Federal Reserve Bank of Cleveland, October 30.
45
Graham, John R., Campbell R. Harvey, and Hai Huang (2009). “Investor Competence, Trading Frequency, and Home Bias,” Management Science 55, 1094-1106.
Haines, Michael R., and Inter-university Consortium for Political and Social Research (2010). Historical, Demographic, Economic, and Social Data: The United States, 1790-2002 [Computer file]. ICPSR02896-v3. Ann Arbor, MI: Inter-university Consortium for Political and Social Research [distributor], 2010-05-21. doi:10.3886/ICPSR02896
Haven, T. Kenneth (1940). Investment Banking under the Securities and Exchange Commission, Ann Arbor: University of Michigan.
Hong, Harrison, and Leonard Kostovetsky (2012). “Red and Blue Investing: Values and Finance,” Journal of Financial Economics 103, 1-19.
Hong, Harrison, Jeffrey D. Kubik, and Jeremy C. Stein (2004). “Social Interaction and Stock-Market Participation,” Journal of Finance 59, 137-163.
Huberman, Gur (2001). “Familiarity Breeds Investment,” Review of Financial Studies 14, 659-680.
Kane, Edward J., and Berry K. Wilson (1998). “A Contracting-Theory Interpretation of the Origins of Federal Deposit Insurance,” Journal of Money, Credit and Banking 30, 573-595.
Kang, Jun-Koo, and Rene M. Stulz (1997). “Why Is There a Home Bias? An Analysis of Foreign Portfolio Equity Ownership in Japan,” Journal of Financial Economics 46, 3-28.
Karlsson, Anders, and Lars Norden (2007). “Home Sweet Home: Home Bias and International Diversification among Individual Investors,” Journal of Banking and Finance 31, 317-333.
Kaustia, Markku, and Samuli Knupfer (2012). “Peer Performance and Stock Market Entry,” Journal of Financial Economics 104, 321-338.
Keloharju, Matti, Samuli Knupfer and Juhani Linnainmaa (2012). “Do Investors Buy What They Know? Product Market Choices and Investment Decisions,” Review of Financial Studies 25, 2921-2958.
Liang, Jia-Wen, Mei-Feng Lin, Chen-Lung Chin (2012). “Does Foreign Institutional Ownership Motivate Firms in an Emerging Market to Increase Voluntary Disclosure? Evidence from Taiwan,” Review of Quantitative Finance and Accounting 39, 55-76.

46
Loeser, John C. (1940). The Over-the-Counter Securities Market: What It Is and How It Operates, New York: National Quotation Bureau.
Marcin, Daniel (2014). “Essays on the Revenue Act of 1924,” PhD Dissertation, University of Michigan.
Mason, Joseph R. (1996). “The Determinants and Effects of Reconstruction Finance Corporation assistance to Banks during the Great Depression,” Doctoral Dissertation, University of Illinois, Urbana-Champaign.
Mason, Joseph R. (2001a). “Reconstruction Finance Corporation Assistance to Financial Intermediaries and Commercial and Industrial Enterprises in the United States, 1932-37,” in Stijn Claessens, et al., eds., Resolution of Financial Distress: an International Perspective on the Design of Bankruptcy Laws, The World Bank Group, 167-204.
Mason, Joseph R. (2001b). “Do Lender of Last Resort Policies Matter? The effects of Reconstruction Finance Corporation Assistance to Banks during the Great Depression,” Journal of Financial Services Research 20, 77-95.
Mason, Joseph R. (2003). “The Political Economy of Reconstruction Finance Corporation Assistance during the Great Depression,” Explorations in Economic History 40, 101-21.
Means, Gardiner C. (1930). “The Diffusion of Stockownership in the United States,” Quarterly Journal of Economics 44, 561-600.
Merton, Robert C. (1987). “A Simple Model of Capital Market Equilibrium with Incomplete Information,” Journal of Finance 42 (3), 483-510.
Nicholas, Thomas (2007). “Stock Market Swings and the Value of Innovation, 1908-1929,” in N. Lamoreaux and K. Sokoloff, eds., Financing Innovation in the United States, 1870 to the Present, 217-245, Cambridge: MIT Press.
Okawa, Yohei, and Eric van Wincoop (2012). “Gravity in International Finance,” Journal of International Economics 87, 205-215.
O’Sullivan, Mary (2007). “The Expansion of the U.S. Stock Market, 1885-1939: Historical Facts and Theoretical Fashions,” Enterprise and Society 8, 489-542.
Philips, Christopher B., Francis M. Kinniry, Jr., and Yan Zilbering (2010). “Are Investors Truly Embracing International Diversification,” The Vanguard Group.

47
Philips, Christopher B., Francis M. Kinniry, Jr., and Scott J. Donaldson (2012). “The Role of Home Bias in Global Asset Allocation Decisions,” The Vanguard Group.
Speidell, Lawrence S., and Hongyu Xing (2004). “One World – The Case for Global Portfolios,” Journal of Investing Spring, 5-13.
Steven Manson, Jonathan Schroeder, David Van Riper, and Steven Ruggles. IPUMS National Historical Geographic Information System: Version 13.0 [Database]. Minneapolis: University of Minnesota. 2018. http://doi.org/10.18128/D050.V13.0
Strong, Norman, and Xinzhong Xu (2003). “Understanding the Equity Home Bias: Evidence from Survey Data,” Review of Economics and Statistics 85, 307-312.
Stulz, Rene M. (2005). “The Limits of Financial Globalization,” Journal of Finance 60, 1595-1638.
Temin, Peter, and Hans-Joachim Voth (2004). “Riding the South Sea Bubble,” American Economic Review 94, 1654-1668.
Tesar, Linda L., and Ingrid Werner (1995). “Home Bias and High Turnover,” Journal of International Money and Finance 14, 467-492.
Warshow, H.T. (1924). “The Distribution of Corporate Ownership in the United States,” Quarterly Journal of Economics 39, 15-38.
Wimmer, Andreas and Brian Min (2006). “From Empire to Nation-State: Explaining War in the Modern World, 1816-2001,” American Sociological Review 71 (6), 867-897.

Figure 1
Citibank’s Share Price
Source: Commercial & Financial Chronicle weekly quotations. Note: A five-for-one stock split occurred on January 12, 1929. The figure adjusts by multiplying share prices by five from January 12, 1929.
●●●●●●●●●●●●●●●●●●●●●●●●●●●●●●●●●●●●●●●●●●●●●●●●●●●●●●●●●●●●●●●●●●●●●●●●●●●●●●●●●●●●●●●●●●●●●●●●●●●●●●●●●●●●●●●●●●●●●●●●●●●●●●●●●●●●●●●●●●●●●●●●●●●●●●●●●●●●●●●●●●●●●●●●●●●●●●●●●●●●●●●●●●●●●●●●●●●●●●●●●●●●●●●●●●●●●●●●●●●●●●●●●●●●●●●●●●●●●●●●●●●●●●●●●●●●●●●●●●●●●●●●●●●●●●●●●●●●●●●●●●●●●●●●●●●●●●●●●●●●●●●●●●●●●●●●●●●●●●●●●●●●●●●●●●●●●●●●●●●●●●●●●●●●●●●●●●●●●●●●Stock SplitStock SplitStock SplitStock SplitStock SplitStock SplitStock SplitStock SplitStock SplitStock SplitStock SplitStock SplitStock SplitStock SplitStock SplitStock SplitStock SplitStock SplitStock SplitStock SplitStock SplitStock SplitStock SplitStock SplitStock SplitStock SplitStock SplitStock SplitStock SplitStock SplitStock SplitStock SplitStock SplitStock SplitStock SplitStock SplitStock SplitStock SplitStock SplitStock SplitStock SplitStock SplitStock SplitStock SplitStock SplitStock SplitStock SplitStock SplitStock SplitStock SplitStock SplitStock SplitStock SplitStock SplitStock SplitStock SplitStock SplitStock SplitStock SplitStock SplitStock SplitStock SplitStock SplitStock SplitStock SplitStock SplitStock SplitStock SplitStock SplitStock SplitStock SplitStock SplitStock SplitStock SplitStock SplitStock SplitStock SplitStock SplitStock SplitStock SplitStock SplitStock SplitStock SplitStock SplitStock SplitStock SplitStock SplitStock SplitStock SplitStock SplitStock SplitStock SplitStock SplitStock SplitStock SplitStock SplitStock SplitStock SplitStock SplitStock SplitStock SplitStock SplitStock SplitStock SplitStock SplitStock SplitStock SplitStock SplitStock SplitStock SplitStock SplitStock SplitStock SplitStock SplitStock SplitStock SplitStock SplitStock SplitStock SplitStock SplitStock SplitStock SplitStock SplitStock SplitStock SplitStock SplitStock SplitStock SplitStock SplitStock SplitStock SplitStock SplitStock SplitStock SplitStock SplitStock SplitStock SplitStock SplitStock SplitStock SplitStock SplitStock SplitStock SplitStock SplitStock SplitStock SplitStock SplitStock SplitStock SplitStock SplitStock SplitStock SplitStock SplitStock SplitStock SplitStock SplitStock SplitStock SplitStock SplitStock SplitStock SplitStock SplitStock SplitStock SplitStock SplitStock SplitStock SplitStock SplitStock SplitStock SplitStock SplitStock SplitStock SplitStock SplitStock SplitStock SplitStock SplitStock SplitStock SplitStock SplitStock SplitStock SplitStock SplitStock SplitStock SplitStock SplitStock SplitStock SplitStock SplitStock SplitStock SplitStock SplitStock SplitStock SplitStock SplitStock SplitStock SplitStock SplitStock SplitStock SplitStock SplitStock SplitStock SplitStock SplitStock SplitStock SplitStock SplitStock SplitStock SplitStock SplitStock SplitStock SplitStock SplitStock SplitStock SplitStock SplitStock SplitStock SplitStock SplitStock SplitStock SplitStock SplitStock SplitStock SplitStock SplitStock SplitStock SplitStock SplitStock SplitStock SplitStock SplitStock SplitStock SplitStock SplitStock SplitStock SplitStock SplitStock SplitStock SplitStock SplitStock SplitStock SplitStock SplitStock SplitStock SplitStock SplitStock SplitStock SplitStock SplitStock SplitStock SplitStock SplitStock SplitStock SplitStock SplitStock SplitStock SplitStock SplitStock SplitStock SplitStock SplitStock SplitStock SplitStock SplitStock SplitStock SplitStock SplitStock SplitStock SplitStock SplitStock SplitStock SplitStock SplitStock SplitStock SplitStock SplitStock SplitStock SplitStock SplitStock SplitStock SplitStock SplitStock SplitStock SplitStock SplitStock SplitStock SplitStock SplitStock SplitStock SplitStock SplitStock SplitStock SplitStock SplitStock SplitStock SplitStock SplitStock SplitStock SplitStock SplitStock SplitStock SplitStock SplitStock SplitStock SplitStock SplitStock SplitStock SplitStock SplitStock SplitStock SplitStock SplitStock SplitStock SplitStock SplitStock SplitStock SplitStock SplitStock SplitStock SplitStock SplitStock SplitStock SplitStock SplitStock SplitStock SplitStock SplitStock SplitStock SplitStock SplitStock SplitStock SplitStock SplitStock SplitStock SplitStock SplitStock SplitStock SplitStock SplitStock SplitStock SplitStock SplitStock SplitStock SplitStock SplitStock SplitStock SplitStock SplitStock SplitStock SplitStock SplitStock SplitStock SplitStock SplitStock SplitStock SplitStock SplitStock SplitStock SplitStock Split
300
400
500
600
700
800
900
1000
1100
1200
1300
1400
1500
1600
1700
1800
1900
2000
2100
2200
2300
2400
2500
2600
2700
2800
1924 1926 1928 1930Date
Pric
e
Citibank Share Price from 1924−1930

Figure 2
Citibank Assets and Paid in Capital
Source: Citibank Annual Reports. Note: All figures are for December of each year except for asset values in 1906 (June) and 1920 (February).
0
500
1000
1500
2000
1906 1920 1924 1925 1926 1927 1928 1929Year
Asse
ts in
Milli
ons
USD
Growth in Citibank Assets
0
30
60
90
1906 1920 1924 1925 1926 1927 1928 1929Year
Cap
italiz
atio
n in
Milli
ons
USD
Growth in Citibank Capitalization

Figure 3
Number of Citibank Shareholders
Source: Reports of Votes at Citibank Annual Meetings (Jan. 1925, Jan. 1927, and Jan. 1929). Moody’s Manual of Investments (Dec. 31, 1929 and Dec. 31, 1930).
6669
13267
18403
62868
68491
0
20000
40000
60000
Jan. 1925 Jan. 1927 Jan. 1929 Jan. 1930 Jan. 1931Year
Num
ber o
f Sha
reho
lder
s

Figure 4
Shareholding Size Distribution
Source: Reports of Votes at Citibank Annual Meetings (Jan. 1925 and Jan. 1929).
No. of Shares1 : 5.7%
2−5 : 31.4%
6−10 : 24.4%
Above 10 : 38.6%
1925
No. of Shares1 : 11.6%
2−5 : 25.6%
6−10 : 17.5%
Above 10 : 45.4%
1929

Figure 5 The Changing Size Distribution of Shareholders
Source: Reports of Votes at Citibank Annual Meetings (Jan. 1925, Jan. 1927, and Jan. 1929).
0
500
1000
1500
2000
2500
3000
3500
12−
56−
1011−2
021−4
041−8
081−1
6016
1−32
032
1−50
0ab
ove
500
Size of Holdings
No.
of S
hare
hold
ers
1925
0
500
1000
1500
2000
2500
3000
35001
2−5
6−10
11−2
021−4
041−8
081−1
6016
1−32
032
1−50
0ab
ove
500
Size of Holdings
No.
of S
hare
hold
ers
1927
0
500
1000
1500
2000
2500
3000
3500
12−
56−
1011−2
021−4
041−8
081−1
6016
1−32
032
1−50
0ab
ove
500
Size of Holdings
No.
of S
hare
hold
ers
1929

Table 1: Data Sources
Dataset Source Description Citibank Shareholder Data
Report of Vote at Annual Meeting for Jan. 1925, 1927, 1929 (Citibank Archive material)
The dataset represents a comprehensive database of voting Citibank shareholders and contains their names, addresses, and the number of shares owned.
Poors Data Poor’s Register of Directors for 1928 The dataset represents a comprehensive list of nationally influential businessmen in America.
Who’s Who Data Who’s Who in America for 1928 The dataset represents a comprehensive list of nationally prominent individuals across all fields in America.
IRS Income Tax Data IRS Income Tax data for 1924 returns published in the New York Times
The dataset represents a comprehensive list of wealthy individuals in the New York City metropolitan region.
Citibank Officers & Directors Data
Citibank Annual Reports for Dec. 1924, 1926, 1928
The dataset contains a list of Citibank officers and directors.
Individual Corporate Network Data
Directory of Directors in the City of New York for 1929-1930
The dataset represents a comprehensive list of businessmen in the New York City metropolitan region. To be included, an individual must serve as a director in at least one firm based in New York City.
ICPSR Data County-level Federal Censuses for 1920 and 1930
The dataset contains demographic and economic information at the county-level collected from the 1920 and 1930 Federal Censuses.
Dealer Data Security Dealers of North America, 1929 Edition
The dataset contains the names, addresses, and business descriptions of all securities dealers in North America.
Citibank Branch Data Citibank Annual Reports for Dec. 1924, 1926, 1928
The dataset contains a list of all Citibank branches (domestic and international) for each year.

Table 2: Variable Definitions
Name Definition Sources No. of Shares No. of shares voted by the individual at each Citibank annual meeting. Citibank
Shareholder Data
Shareholder Indicator
A binary variable indicating whether the individual voted in each Citibank annual meeting.
Citibank Shareholder Data
IRS Tax Indicator A binary variable indicating whether the individual is included in the IRS Income Tax data published by the New York Times.
IRS Income Taxes
IRS Tax Indicator * Tax Payment
IRS Tax indicator interacted with the actual income tax payment. IRS Income Taxes
Financial Industry Indicator
A binary variable indicating whether the individual is works in at least one financial services firm.
Directory of Directors
No. of Affiliated Firms
No. of firms the individual serves as an officer and/or director in. Directory of Directors
Poors Indicator A binary variable indicating whether the individual is included in the Poor’s Register.
Poors’ Directory
Who’s Who Indicator
A binary variable indicating whether the individual is included in the Who’s Who in America.
Who’s Who in America
High Position Indicator
A binary variable indicating whether the individual serves as both an officer and director in at least one firm.
Directory of Directors
Large Bank Indicator A binary variable indicating whether the individual is an officer/director in a large NYC bank (Bank of Manhattan, Chase National Bank, Chatham-Phenix National Bank & Trust Co., Chemical National Bank, Corn Exchange Bank, First National Bank of the City of New York, National Bank of Commerce, and National Park Bank).
Directory of Directors
Eigenvector Network Centrality
Network variable that measures how well-connected the individual is to other influential individuals within the network.
Calculated by Authors
Network Betweenness Centrality
Network variable that measures how ‘in-between’ the individual is among other individuals in the network.
Calculated by Authors
% of Officer/Director Connections
No. of network connections to Citibank officers/directors (who have served for at least two years) divided by the total no. of network connections.
Calculated by Authors
% of Once-Removed Officer/Director Connections
No. of once-removed network connections to Citibank officers/ directors (who have served for at least two years) divided by the total no. of once-removed network connections.
Calculated by Authors
% of Shareholder Connections
No. of network connections to Citibank shareholders (who have not served as a Citibank officer/director and have held shares for at least two years) divided by the total no. of network connections.
Calculated by Authors
% of Once-Removed Shareholder Connections
No. of once-removed network connections to Citibank shareholders (who have not served as a Citibank officer/director and have held shares for at least two years) divided by the total no. of once-removed network connections.
Calculated by Authors
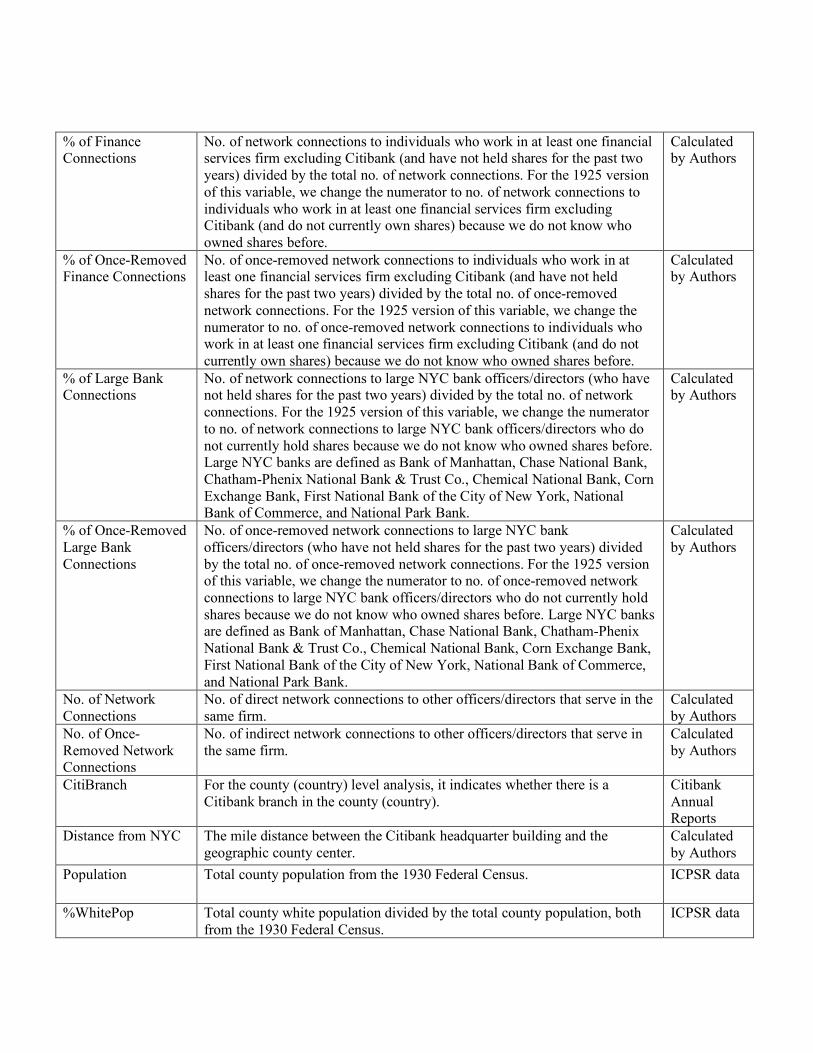
% of Finance Connections
No. of network connections to individuals who work in at least one financial services firm excluding Citibank (and have not held shares for the past two years) divided by the total no. of network connections. For the 1925 version of this variable, we change the numerator to no. of network connections to individuals who work in at least one financial services firm excluding Citibank (and do not currently own shares) because we do not know who owned shares before.
Calculated by Authors
% of Once-Removed Finance Connections
No. of once-removed network connections to individuals who work in at least one financial services firm excluding Citibank (and have not held shares for the past two years) divided by the total no. of once-removed network connections. For the 1925 version of this variable, we change the numerator to no. of once-removed network connections to individuals who work in at least one financial services firm excluding Citibank (and do not currently own shares) because we do not know who owned shares before.
Calculated by Authors
% of Large Bank Connections
No. of network connections to large NYC bank officers/directors (who have not held shares for the past two years) divided by the total no. of network connections. For the 1925 version of this variable, we change the numerator to no. of network connections to large NYC bank officers/directors who do not currently hold shares because we do not know who owned shares before. Large NYC banks are defined as Bank of Manhattan, Chase National Bank, Chatham-Phenix National Bank & Trust Co., Chemical National Bank, Corn Exchange Bank, First National Bank of the City of New York, National Bank of Commerce, and National Park Bank.
Calculated by Authors
% of Once-Removed Large Bank Connections
No. of once-removed network connections to large NYC bank officers/directors (who have not held shares for the past two years) divided by the total no. of once-removed network connections. For the 1925 version of this variable, we change the numerator to no. of once-removed network connections to large NYC bank officers/directors who do not currently hold shares because we do not know who owned shares before. Large NYC banks are defined as Bank of Manhattan, Chase National Bank, Chatham-Phenix National Bank & Trust Co., Chemical National Bank, Corn Exchange Bank, First National Bank of the City of New York, National Bank of Commerce, and National Park Bank.
Calculated by Authors
No. of Network Connections
No. of direct network connections to other officers/directors that serve in the same firm.
Calculated by Authors
No. of Once-Removed Network Connections
No. of indirect network connections to other officers/directors that serve in the same firm.
Calculated by Authors
CitiBranch For the county (country) level analysis, it indicates whether there is a Citibank branch in the county (country).
Citibank Annual Reports
Distance from NYC The mile distance between the Citibank headquarter building and the geographic county center.
Calculated by Authors
Population Total county population from the 1930 Federal Census. ICPSR data
%WhitePop Total county white population divided by the total county population, both from the 1930 Federal Census.
ICPSR data

%NativeWhitePop Total county native white population divided by the total county population, both from the 1930 Federal Census.
ICPSR data
%RuralPop Total county rural population divided by the total county population, both from the 1930 Federal Census.
ICPSR data
%Farmland Total acres in farms divided by the total acres of the county, both from the 1930 Federal Census.
ICPSR data
Pop/SqMile Total county population divided by the total square miles of the county, both from the 1930 Federal Census.
ICPSR data
Megacity A binary variable indicating whether the county contains one of the 20 most populous cities from the 1930 Federal Census.
ICPSR data
#ManufWorkers Average number of manufacturing wage earners over twelve months in the county, from the 1930 Federal Census.
ICPSR data
%Pop>45 Total county population over the age 45 divided by the total county population, both from the 1930 Federal Census.
ICPSR data
Radios/Families Total no. of families with radios divided by the total no. of families in the county, both from the 1930 Federal Census.
ICPSR data
%IlliteratePop Total county illiterate population divided by the total county population, both from the 1930 Federal Census.
ICPSR data
%16-17InSchool Total county population aged 16-17 in school divided by the total county population aged 16-17, both from the 1930 Federal Census.
ICPSR data
(HomeVal > 10K)/Pop
No. of county homes with home values exceeding $10,000 divided by the total county population, both from the 1930 Federal Census.
ICPSR data
FarmValue (Land value of farms + Value of farm buildings + Value of farm dwellings + Value of farm equipment) ×#$.$&&'()*(+,$(-./0
%23('45$,, all from the 1930 Federal
Census.
ICPSR data
#Dealers/Pop Number of securities dealers in the county divided by total county population. Securities dealers information and total county population each from the Security Dealers of North America and the 1930 Federal Census.
ICPSR data & Dealer data
%Unemp Total county unemployed population divided by total county population, both from the 1930 Federal Census.
ICPSR data
PopGrowth Percent change in total county population between the 1920 and 1930 Federal Censuses.
ICPSR data
No. of Citi Branches Number of Citibank branches in the country. Citibank Annual Reports

Table 3: County-level Regressions (% of Shareholders in County)
(1) (2) (3) (4) (5) (6)1925 1925 1929 1929 1929-25 1929-25
CitiBranch 0.7157∗∗∗ 0.2194∗∗∗ 0.5228∗∗∗ 0.0420∗∗ 0.0956∗∗∗ 0.0130(0.1266) (0.0293) (0.1012) (0.0069) (0.0072) (0.0008)
Distance from NYC -0.0322∗∗∗ -0.0155∗∗∗ -0.0031(-0.0043) (-0.0025) (-0.0002)
Population 0.0417∗∗∗ 0.0436∗∗∗ 0.0096∗
(0.0056) (0.0072) (0.0006)%WhitePop 0.0172 0.0163∗ -0.0045
(0.0023) (0.0027) (-0.0003)%NativeWhitePop -0.0137 -0.0147∗ -0.0059
(-0.0018) (-0.0024) (-0.0004)%RuralPop -0.0473∗∗∗ -0.0216∗∗∗ -0.0118∗∗∗
(-0.0063) (-0.0035) (-0.0007)%Farmland -0.0191∗∗∗ -0.0097∗∗∗ -0.0014
(-0.0026) (-0.0016) (-0.0001)Pop/SqMile 0.0097∗∗∗ 0.0142∗∗∗ -0.0026
(0.0013) (0.0023) (-0.0002)Megacity 0.0105 0.1428∗∗∗ 0.0063
(0.0014) (0.0235) (0.0004)#ManufWorkers -0.0247∗∗∗ -0.0108∗∗ 0.0031
(-0.0033) (-0.0018) (0.0002)%Pop>45 0.0223∗∗∗ 0.0191∗∗∗ 0.0130∗∗∗
(0.0030) (0.0031) (0.0008)Radios/Families 0.0273∗∗∗ 0.0094∗ 0.0029
(0.0036) (0.0016) (0.0002)%IlliteratePop 0.0113 0.0043 -0.0045
(0.0015) (0.0007) (-0.0003)%16-17InSchool -0.0167∗∗∗ -0.0070∗∗ -0.0001
(-0.0022) (-0.0012) (-0.0000)(HomeVal>10K)/Pop 0.0256∗∗∗ 0.0233∗∗∗ 0.0079∗∗∗
(0.0034) (0.0038) (0.0005)FarmValue 0.0043 0.0037 0.0052
(0.0006) (0.0006) (0.0003)#Dealers/Pop 0.0099∗∗ 0.0060∗∗∗ -0.0001
(0.0013) (0.0010) (-0.0000)%Unemp 0.0042 -0.0000 0.0021
(0.0006) (-0.0000) (0.0001)PopGrowth -0.0834∗∗ -0.0396∗∗ 0.0018
(-0.0111) (-0.0065) (0.0001)Observations 3059.0000 2534.0000 3059.0000 2534.0000 3059.0000 2534.0000Average % of Shareholders 1.9235 2.3078 1.4046 1.6831 -0.5189 -0.6247
Note: *, **, *** indicate statistical significance at the 10%, 5%, and 1% levels. Dependent variable is the % ofshareholders in the county multiplied by 100. All regressors are defined in Table 2. For 1929-1925, the dependent variableand CitiBranch variable is calculated as the difference between the values in 1929 and 1925. Marginal effects at the meanare reported in parentheses. For indicator variables, this captures the effect of a change from zero to one. For continuousvariables, this captures the effect of a standard deviation increase calculated at the mean. Average % of shareholders isalso multiplied by 100.
1

Table 4: Country-level Regressions (% of Shareholders)
(1) (2) (3) (4) (5) (6)1925 1925 1929 1929 1929-25 1929-25
CitiBranch 0.3990∗∗∗ 0.2469∗∗∗ 0.3888∗∗∗ 0.2367∗∗∗ 0.1437 0.0540(0.0479) (0.0334) (0.1202) (0.0788) (0.0355) (0.0132)
No. of Citi Branches 0.0228∗∗∗ 0.0283∗∗∗ 0.0799∗∗∗
(0.0031) (0.0094) (0.0196)Observations 73 73 73 73 73 73Average % of Shareholders 3.2865 3.2865 5.3297 5.3297 2.0432 2.0432
Note: *, **, *** indicate statistical significance at the 10%, 5%, and 1% levels. Dependent variable is the % ofshareholders in the country multiplied by 100. All regressors are defined in Table 2. CitiBranch is an indicatorthat is 1 if the country has a Citibank branch and 0 otherwise. For 1929-1925, the dependent variable and allindependent variables are calculated as the difference between the values in 1929 and 1925. Marginal effects at themean are reported in parentheses. For indicator variables, this captures the effect of a change from zero to one. Forcontinuous variables, this captures the effect of a standard deviation increase calculated at the mean. Average % ofshareholders is also multiplied by 100.
2

Table 5: Logit for All 1925 Shareholders
(1) (2) (3) (4) (5) (6) (7) (8)% of Officer/Director Connections 0.128∗∗∗ 0.115∗∗∗ 0.102∗∗∗ 0.093∗∗∗
(0.0012) (0.0010) (0.0006) (0.0005)% of Once-Removed Officer/Director Connections 0.127∗∗∗ 0.118∗∗∗ 0.072∗∗
(0.0012) (0.0011) (0.0004)Financial Industry Indicator 1.704∗∗∗ 1.444∗∗∗ 1.135∗∗∗ 1.115∗∗∗ 1.093∗∗∗
(0.0195) (0.0142) (0.0098) (0.0095) (0.0091)IRS Tax Indicator 1.267∗∗∗ 1.101∗∗∗ 1.015∗∗∗ 0.999∗∗∗ 0.988∗∗∗
(0.0121) (0.0094) (0.0085) (0.0082) (0.0080)IRS Tax Indicator * Tax Payment 0.053∗∗∗ 0.035∗∗∗ 0.024∗ 0.025∗ 0.025∗
(0.0003) (0.0002) (0.0001) (0.0001) (0.0001)No. of Affiliated Firms 0.088∗∗∗ 0.037 0.035 0.034
(0.0005) (0.0002) (0.0002) (0.0002)Poors Indicator 0.462∗∗∗ 0.415∗∗∗ 0.398∗∗∗ 0.388∗∗∗
(0.0028) (0.0025) (0.0024) (0.0023)Who’s Who Indicator 0.408∗∗ 0.062 0.046 0.041
(0.0027) (0.0004) (0.0003) (0.0002)High Position Indicator -0.190 -0.169 -0.160 -0.150
(-0.0011) (-0.0010) (-0.0009) (-0.0009)No. of Network Connections 0.274∗∗∗ 0.291∗∗∗ 0.289∗∗∗
(0.0015) (0.0016) (0.0016)Eigenvector Network Centrality -0.060 -0.081∗ -0.078
(-0.0003) (-0.0004) (-0.0004)Network Betweenness Centrality -0.048∗ -0.046∗ -0.044
(-0.0003) (-0.0003) (-0.0002)Observations 42986 42986 42986 42986 42986 42986 42986 42986No. of Shareholders 404 404 404 404 404 404 404 404No. of Individuals with Officer/Director Connections 1094 1094 1094 1094 1094 1094 1094 1094Pseudo R2 0.008 0.006 0.013 0.117 0.129 0.137 0.141 0.142AIC 4541.770 4550.459 4521.478 4048.293 3999.569 3968.315 3954.582 3953.427
Note: *, **, *** indicate statistical significance at the 10%, 5%, and 1% levels. Dependent variable is an indicator that equals one if the individual holds sharesand zero otherwise. All regressors are defined in Table 2. The number of shares includes shares owned by firms rather than individuals. Corporate holdings areequally distributed among the officers and directors of the shareholding firm. A firm lacking information on the number of officers and directors is assumed tohave five officers and directors. Sample includes all voting shareholders excluding Citibank officers and directors. Marginal effects at the mean are reportedin parentheses. For indicator variables, this captures the effect of a change from zero to one. For continuous variables, this captures the effect of a standarddeviation increase calculated at the mean.
3

Table 6: Logit for All 1927 Shareholders
(1) (2) (3) (4) (5) (6) (7) (8)% of Officer/Director Connections 0.127∗∗∗ 0.096∗∗∗ 0.098∗∗∗ 0.081∗∗∗
(0.0018) (0.0013) (0.0009) (0.0007)% of Once-Removed Officer/Director Connections 0.139∗∗∗ 0.113∗∗∗ 0.080∗∗∗
(0.0020) (0.0016) (0.0007)Financial Industry Indicator 1.564∗∗∗ 1.296∗∗∗ 0.958∗∗∗ 0.947∗∗∗ 0.928∗∗∗
(0.0270) (0.0190) (0.0123) (0.0119) (0.0115)IRS Tax Indicator 1.318∗∗∗ 1.150∗∗∗ 1.067∗∗∗ 1.058∗∗∗ 1.046∗∗∗
(0.0207) (0.0161) (0.0145) (0.0141) (0.0138)IRS Tax Indicator * Tax Payment 0.052∗∗∗ 0.035∗∗∗ 0.024∗ 0.024∗ 0.024∗
(0.0005) (0.0003) (0.0002) (0.0002) (0.0002)No. of Affiliated Firms 0.085∗∗∗ 0.028 0.026 0.025
(0.0007) (0.0003) (0.0002) (0.0002)Poors Indicator 0.577∗∗∗ 0.534∗∗∗ 0.519∗∗∗ 0.510∗∗∗
(0.0058) (0.0054) (0.0051) (0.0050)Who’s Who Indicator 0.330∗∗ 0.007 -0.025 -0.027
(0.0034) (0.0001) (-0.0002) (-0.0002)High Position Indicator -0.231∗∗ -0.198∗∗ -0.181∗ -0.172∗
(-0.0022) (-0.0019) (-0.0017) (-0.0016)No. of Network Connections 0.318∗∗∗ 0.334∗∗∗ 0.330∗∗∗
(0.0028) (0.0029) (0.0029)Eigenvector Network Centrality -0.084∗∗ -0.103∗∗ -0.099∗∗
(-0.0008) (-0.0009) (-0.0009)Network Betweenness Centrality -0.063∗∗ -0.061∗∗ -0.060∗∗
(-0.0006) (-0.0005) (-0.0005)Observations 42963 42963 42963 42963 42963 42963 42963 42963No. of Shareholders 623 623 623 623 623 623 623 623No. of Individuals with Officer/Director Connections 1071 1071 1071 1071 1071 1071 1071 1071Pseudo R2 0.008 0.008 0.013 0.114 0.128 0.136 0.140 0.142AIC 6464.393 6462.668 6434.716 5775.261 5694.458 5646.709 5621.931 5615.328
Note: *, **, *** indicate statistical significance at the 10%, 5%, and 1% levels. Dependent variable is an indicator that equals one if the individual holds sharesand zero otherwise. All regressors are defined in Table 2. The number of shares includes shares owned by firms rather than individuals. Corporate holdings areequally distributed among the officers and directors of the shareholding firm. A firm lacking information on the number of officers and directors is assumed tohave five officers and directors. Sample includes all voting shareholders excluding Citibank officers and directors. Marginal effects at the mean are reportedin parentheses. For indicator variables, this captures the effect of a change from zero to one. For continuous variables, this captures the effect of a standarddeviation increase calculated at the mean.
4

Table 7: Logit for All 1929 Shareholders
(1) (2) (3) (4) (5) (6) (7) (8)% of Officer/Director Connections 0.148∗∗∗ 0.118∗∗∗ 0.113∗∗∗ 0.100∗∗∗
(0.0025) (0.0020) (0.0014) (0.0012)% of Once-Removed Officer/Director Connections 0.157∗∗∗ 0.128∗∗∗ 0.077∗∗∗
(0.0027) (0.0022) (0.0009)Financial Industry Indicator 1.229∗∗∗ 1.020∗∗∗ 0.717∗∗∗ 0.697∗∗∗ 0.673∗∗∗
(0.0252) (0.0186) (0.0116) (0.0111) (0.0105)IRS Tax Indicator 1.334∗∗∗ 1.201∗∗∗ 1.137∗∗∗ 1.119∗∗∗ 1.107∗∗∗
(0.0290) (0.0239) (0.0221) (0.0213) (0.0208)IRS Tax Indicator * Tax Payment 0.026∗∗ 0.011 -0.005 -0.004 -0.003
(0.0003) (0.0001) (-0.0001) (-0.0000) (-0.0000)No. of Affiliated Firms 0.077∗∗∗ 0.025 0.023 0.022
(0.0010) (0.0003) (0.0003) (0.0003)Poors Indicator 0.504∗∗∗ 0.470∗∗∗ 0.459∗∗∗ 0.449∗∗∗
(0.0070) (0.0065) (0.0062) (0.0060)Who’s Who Indicator 0.169 -0.098 -0.112 -0.118
(0.0023) (-0.0012) (-0.0013) (-0.0014)High Position Indicator -0.102 -0.071 -0.049 -0.039
(-0.0013) (-0.0009) (-0.0006) (-0.0005)No. of Network Connections 0.294∗∗∗ 0.312∗∗∗ 0.304∗∗∗
(0.0037) (0.0038) (0.0037)Eigenvector Network Centrality -0.088∗∗ -0.116∗∗∗ -0.109∗∗
(-0.0011) (-0.0014) (-0.0013)Network Betweenness Centrality -0.049∗∗ -0.045∗ -0.043∗
(-0.0006) (-0.0006) (-0.0005)Observations 42960 42960 42960 42960 42960 42960 42960 42960No. of Shareholders 768 768 768 768 768 768 768 768No. of Individuals with Officer/Director Connections 1427 1427 1427 1427 1427 1427 1427 1427Pseudo R2 0.010 0.008 0.015 0.086 0.095 0.101 0.107 0.108AIC 7627.517 7642.987 7591.911 7050.960 6985.800 6946.556 6904.185 6899.104
Note: *, **, *** indicate statistical significance at the 10%, 5%, and 1% levels. Dependent variable is an indicator that equals one if the individual holds sharesand zero otherwise. All regressors are defined in Table 2. The number of shares includes shares owned by firms rather than individuals. Corporate holdings areequally distributed among the officers and directors of the shareholding firm. A firm lacking information on the number of officers and directors is assumed tohave five officers and directors. Sample includes all voting shareholders excluding Citibank officers and directors. Marginal effects at the mean are reportedin parentheses. For indicator variables, this captures the effect of a change from zero to one. For continuous variables, this captures the effect of a standarddeviation increase calculated at the mean.
5

Table 8: Logit for New 1927 Shareholders
(1) (2) (3) (4) (5) (6) (7) (8) (9) (10) (11)% of Officer/Director Connections 0.073∗∗∗ 0.071∗∗∗ 0.089∗∗∗ 0.071∗∗∗ 0.072∗∗∗ 0.071∗∗∗
(0.0004) (0.0004) (0.0003) (0.0003) (0.0003) (0.0003)% of Once-Removed Officer/Director Connections 0.116∗∗∗ 0.112∗∗∗ 0.098∗∗∗ 0.096∗∗∗ 0.094∗∗∗
(0.0007) (0.0006) (0.0004) (0.0003) (0.0003)% of Shareholder Connections 0.208∗∗∗ 0.206∗∗∗ 0.191∗∗∗ 0.203∗∗∗ 0.191∗∗∗
(0.0011) (0.0011) (0.0007) (0.0007) (0.0007)% of Once-Removed Shareholder Connections 0.133∗∗∗ 0.129∗∗∗ 0.087∗∗ 0.080∗
(0.0007) (0.0007) (0.0003) (0.0003)Financial Industry Indicator 1.217∗∗∗ 0.975∗∗∗ 0.614∗∗∗ 0.609∗∗∗ 0.588∗∗∗ 0.535∗∗∗ 0.528∗∗∗ 0.506∗∗∗
(0.0082) (0.0055) (0.0030) (0.0029) (0.0028) (0.0024) (0.0023) (0.0022)IRS Tax Indicator 1.390∗∗∗ 1.242∗∗∗ 1.166∗∗∗ 1.162∗∗∗ 1.144∗∗∗ 1.103∗∗∗ 1.102∗∗∗ 1.085∗∗∗
(0.0102) (0.0080) (0.0073) (0.0071) (0.0069) (0.0063) (0.0062) (0.0060)IRS Tax Indicator * Tax Payment 0.031∗ 0.024 0.015 0.016 0.016 0.011 0.012 0.012
(0.0001) (0.0001) (0.0001) (0.0001) (0.0001) (0.0000) (0.0000) (0.0000)No. of Affiliated Firms 0.048∗ 0.003 -0.000 -0.003 -0.002 -0.006 -0.008
(0.0002) (0.0000) (-0.0000) (-0.0000) (-0.0000) (-0.0000) (-0.0000)Poors Indicator 0.724∗∗∗ 0.684∗∗∗ 0.670∗∗∗ 0.659∗∗∗ 0.633∗∗∗ 0.629∗∗∗ 0.612∗∗∗
(0.0033) (0.0031) (0.0030) (0.0029) (0.0027) (0.0026) (0.0025)Who’s Who Indicator 0.041 -0.208 -0.257 -0.253 -0.249 -0.285 -0.291
(0.0002) (-0.0007) (-0.0009) (-0.0009) (-0.0008) (-0.0009) (-0.0009)High Position Indicator -0.368∗∗ -0.314∗∗ -0.289∗ -0.281∗ -0.245 -0.231 -0.214
(-0.0016) (-0.0014) (-0.0012) (-0.0012) (-0.0010) (-0.0009) (-0.0008)No. of Network Connections 0.370∗∗∗ 0.385∗∗∗ 0.381∗∗∗ 0.366∗∗∗ 0.384∗∗∗ 0.380∗∗∗
(0.0014) (0.0015) (0.0014) (0.0013) (0.0014) (0.0014)Eigenvector Network Centrality -0.119∗ -0.138∗∗ -0.134∗ -0.137∗ -0.157∗∗ -0.153∗∗
(-0.0005) (-0.0005) (-0.0005) (-0.0005) (-0.0006) (-0.0005)Network Betweenness Centrality -0.116∗∗ -0.114∗∗ -0.111∗∗ -0.101∗∗ -0.099∗∗ -0.096∗∗
(-0.0005) (-0.0004) (-0.0004) (-0.0004) (-0.0004) (-0.0003)Observations 42562 42562 42562 42562 42562 42562 42562 42562 42562 42562 42562No. of Shareholders 251 251 251 251 251 251 251 251 251 251 251No. of Individuals with Officer/Director Connections 988 988 988 988 988 988 988 988 988 988 988No. of Individuals with Shareholder Connections 3820 3820 3820 3820 3820 3820 3820 3820 3820 3820 3820Pseudo R2 0.012 0.030 0.041 0.076 0.088 0.094 0.098 0.101 0.109 0.114 0.115AIC 3045.991 2990.726 2962.298 2851.553 2823.582 2810.777 2799.498 2793.719 2768.389 2754.325 2753.427
Note: *, **, *** indicate statistical significance at the 10%, 5%, and 1% levels. Dependent variable is an indicator that equals one if the individual holds shares and zero otherwise. All regressors aredefined in Table 2. The number of shares includes shares owned by firms rather than individuals. Corporate holdings are equally distributed among the officers and directors of the shareholding firm. Afirm lacking information on the number of officers and directors is assumed to have five officers and directors. Sample includes new voting shareholders (those that have become shareholders in the pasttwo years) excluding Citibank officers and directors. Marginal effects at the mean are reported in parentheses. For indicator variables, this captures the effect of a change from zero to one. Forcontinuous variables, this captures the effect of a standard deviation increase calculated at the mean.
6

Table 9: Logit for New 1929 Shareholders
(1) (2) (3) (4) (5) (6) (7) (8) (9) (10) (11)% of Officer/Director Connections 0.070∗∗∗ 0.068∗∗∗ 0.078∗∗∗ 0.073∗∗∗ 0.073∗∗∗ 0.072∗∗∗
(0.0005) (0.0005) (0.0005) (0.0004) (0.0004) (0.0004)% of Once-Removed Officer/Director Connections 0.098∗∗∗ 0.067∗∗ 0.041 0.029 0.019
(0.0007) (0.0005) (0.0002) (0.0002) (0.0001)% of Shareholder Connections 0.121∗∗∗ 0.114∗∗∗ 0.093∗∗ 0.100∗∗∗ 0.090∗∗
(0.0009) (0.0008) (0.0005) (0.0006) (0.0005)% of Once-Removed Shareholder Connections 0.122∗∗∗ 0.110∗∗∗ 0.064 0.053
(0.0009) (0.0008) (0.0004) (0.0003)Financial Industry Indicator 0.753∗∗∗ 0.634∗∗∗ 0.381∗∗ 0.366∗∗ 0.354∗∗ 0.344∗∗ 0.338∗∗ 0.327∗∗
(0.0060) (0.0048) (0.0026) (0.0025) (0.0024) (0.0023) (0.0022) (0.0021)IRS Tax Indicator 1.219∗∗∗ 1.139∗∗∗ 1.085∗∗∗ 1.071∗∗∗ 1.065∗∗∗ 1.052∗∗∗ 1.047∗∗∗ 1.038∗∗∗
(0.0121) (0.0107) (0.0099) (0.0096) (0.0095) (0.0093) (0.0092) (0.0091)IRS Tax Indicator * Tax Payment 0.009 0.006 -0.000 0.001 0.001 0.000 0.001 0.001
(0.0001) (0.0000) (-0.0000) (0.0000) (0.0000) (0.0000) (0.0000) (0.0000)No. of Affiliated Firms 0.060∗∗ 0.035 0.034 0.034 0.032 0.032 0.031
(0.0004) (0.0002) (0.0002) (0.0002) (0.0002) (0.0002) (0.0002)Poors Indicator 0.413∗∗∗ 0.389∗∗∗ 0.384∗∗∗ 0.378∗∗∗ 0.365∗∗∗ 0.371∗∗∗ 0.361∗∗∗
(0.0027) (0.0025) (0.0024) (0.0024) (0.0023) (0.0023) (0.0023)Who’s Who Indicator -0.277 -0.355 -0.369 -0.374 -0.386 -0.391 -0.396
(-0.0014) (-0.0018) (-0.0018) (-0.0018) (-0.0019) (-0.0019) (-0.0019)High Position Indicator 0.011 0.045 0.061 0.067 0.074 0.080 0.088
(0.0001) (0.0003) (0.0003) (0.0004) (0.0004) (0.0005) (0.0005)No. of Network Connections 0.307∗∗∗ 0.321∗∗∗ 0.316∗∗∗ 0.292∗∗∗ 0.312∗∗∗ 0.306∗∗∗
(0.0018) (0.0019) (0.0018) (0.0017) (0.0018) (0.0018)Eigenvector Network Centrality -0.187∗∗ -0.211∗∗ -0.207∗∗ -0.191∗∗ -0.217∗∗ -0.213∗∗
(-0.0011) (-0.0012) (-0.0012) (-0.0011) (-0.0013) (-0.0012)Network Betweenness Centrality -0.047 -0.044 -0.042 -0.037 -0.036 -0.034
(-0.0003) (-0.0003) (-0.0002) (-0.0002) (-0.0002) (-0.0002)Observations 42308 42308 42308 42308 42308 42308 42308 42308 42308 42308 42308No. of Shareholders 309 309 309 309 309 309 309 309 309 309 309No. of Individuals with Officer/Director Connections 1253 1253 1253 1253 1253 1253 1253 1253 1253 1253 1253No. of Individuals with Shareholder Connections 4134 4134 4134 4134 4134 4134 4134 4134 4134 4134 4134Pseudo R2 0.006 0.008 0.012 0.040 0.045 0.048 0.050 0.050 0.050 0.052 0.052AIC 3641.169 3631.123 3621.340 3516.006 3506.674 3503.719 3497.015 3498.316 3499.503 3494.807 3495.739
Note: *, **, *** indicate statistical significance at the 10%, 5%, and 1% levels. Dependent variable is an indicator that equals one if the individual holds shares and zero otherwise. All regressors aredefined in Table 2. The number of shares includes shares owned by firms rather than individuals. Corporate holdings are equally distributed among the officers and directors of the shareholding firm. Afirm lacking information on the number of officers and directors is assumed to have five officers and directors. Sample includes new voting shareholders (those that have become shareholders in the pasttwo years) excluding Citibank officers and directors. Marginal effects at the mean are reported in parentheses. For indicator variables, this captures the effect of a change from zero to one. Forcontinuous variables, this captures the effect of a standard deviation increase calculated at the mean.
7
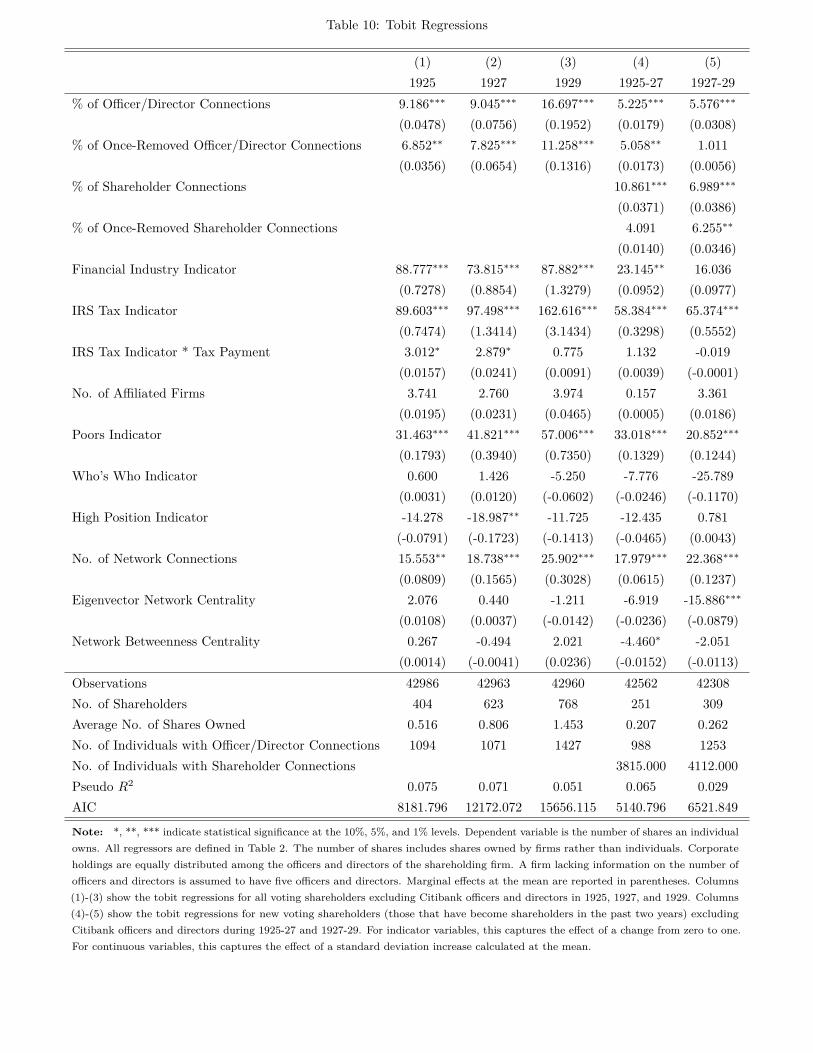
Table 10: Tobit Regressions
(1) (2) (3) (4) (5)1925 1927 1929 1925-27 1927-29
% of Officer/Director Connections 9.186∗∗∗ 9.045∗∗∗ 16.697∗∗∗ 5.225∗∗∗ 5.576∗∗∗
(0.0478) (0.0756) (0.1952) (0.0179) (0.0308)% of Once-Removed Officer/Director Connections 6.852∗∗ 7.825∗∗∗ 11.258∗∗∗ 5.058∗∗ 1.011
(0.0356) (0.0654) (0.1316) (0.0173) (0.0056)% of Shareholder Connections 10.861∗∗∗ 6.989∗∗∗
(0.0371) (0.0386)% of Once-Removed Shareholder Connections 4.091 6.255∗∗
(0.0140) (0.0346)Financial Industry Indicator 88.777∗∗∗ 73.815∗∗∗ 87.882∗∗∗ 23.145∗∗ 16.036
(0.7278) (0.8854) (1.3279) (0.0952) (0.0977)IRS Tax Indicator 89.603∗∗∗ 97.498∗∗∗ 162.616∗∗∗ 58.384∗∗∗ 65.374∗∗∗
(0.7474) (1.3414) (3.1434) (0.3298) (0.5552)IRS Tax Indicator * Tax Payment 3.012∗ 2.879∗ 0.775 1.132 -0.019
(0.0157) (0.0241) (0.0091) (0.0039) (-0.0001)No. of Affiliated Firms 3.741 2.760 3.974 0.157 3.361
(0.0195) (0.0231) (0.0465) (0.0005) (0.0186)Poors Indicator 31.463∗∗∗ 41.821∗∗∗ 57.006∗∗∗ 33.018∗∗∗ 20.852∗∗∗
(0.1793) (0.3940) (0.7350) (0.1329) (0.1244)Who’s Who Indicator 0.600 1.426 -5.250 -7.776 -25.789
(0.0031) (0.0120) (-0.0602) (-0.0246) (-0.1170)High Position Indicator -14.278 -18.987∗∗ -11.725 -12.435 0.781
(-0.0791) (-0.1723) (-0.1413) (-0.0465) (0.0043)No. of Network Connections 15.553∗∗ 18.738∗∗∗ 25.902∗∗∗ 17.979∗∗∗ 22.368∗∗∗
(0.0809) (0.1565) (0.3028) (0.0615) (0.1237)Eigenvector Network Centrality 2.076 0.440 -1.211 -6.919 -15.886∗∗∗
(0.0108) (0.0037) (-0.0142) (-0.0236) (-0.0879)Network Betweenness Centrality 0.267 -0.494 2.021 -4.460∗ -2.051
(0.0014) (-0.0041) (0.0236) (-0.0152) (-0.0113)Observations 42986 42963 42960 42562 42308No. of Shareholders 404 623 768 251 309Average No. of Shares Owned 0.516 0.806 1.453 0.207 0.262No. of Individuals with Officer/Director Connections 1094 1071 1427 988 1253No. of Individuals with Shareholder Connections 3815.000 4112.000Pseudo R2 0.075 0.071 0.051 0.065 0.029AIC 8181.796 12172.072 15656.115 5140.796 6521.849
Note: *, **, *** indicate statistical significance at the 10%, 5%, and 1% levels. Dependent variable is the number of shares an individualowns. All regressors are defined in Table 2. The number of shares includes shares owned by firms rather than individuals. Corporateholdings are equally distributed among the officers and directors of the shareholding firm. A firm lacking information on the number ofofficers and directors is assumed to have five officers and directors. Marginal effects at the mean are reported in parentheses. Columns(1)-(3) show the tobit regressions for all voting shareholders excluding Citibank officers and directors in 1925, 1927, and 1929. Columns(4)-(5) show the tobit regressions for new voting shareholders (those that have become shareholders in the past two years) excludingCitibank officers and directors during 1925-27 and 1927-29. For indicator variables, this captures the effect of a change from zero to one.For continuous variables, this captures the effect of a standard deviation increase calculated at the mean.
8

Tab
le11:Im
portan
ceof
Citiban
kNetworkCon
nections
Margina
leffe
ctfrom
replacingno
n-Citiban
kconn
ection
withCitiban
kconn
ection
(calculatedat
themean)
Margina
lEffe
ctfrom
beingon
tax
list(atthemean)
(7)
%of
Shareholders
(Logit)/No.
Shares
owned
(Tob
it)(8)
Officer&
Director
Shareholder
Replace
one
Replace
byEqu
alPropo
rtion
Replace
one
Replace
byEqu
alPropo
rtion
Direct(1)
Once-
Rem
oved
(2)
Once-
Rem
oved
(3)
Direct(4)
Once-
Rem
oved
(5)
Once-
Rem
oved
(6)
Logit1925
0.0051
***
0.0005
**0.0040
**0.0080
***
0.0094
1925-27
0.0025
***
0.0005
***
0.0032
***
0.0020
***
0.0002
*0.0011
*0.0060
***
0.0059
1927-29
0.0032***
0.0001
0.0008
0.0015
**0.00
020.0011
0.0091***
0.0073
Tobit1925
0.4804
***
0.0483
**0.3540
**0.7474
***
0.5158
1925-27
0.1726
***
0.0235
**0.1651
**0.1112
***
0.00
780.0517
0.3298
***
0.2068
1927-29
0.2394
***
0.0062
0.0429
0.1113
***
0.0199
**0.1287
**0.5552
***
0.2619
Not
e:Margina
leff
ects
arede
rivedfrom
thecoeffi
cients
repo
rted
inthelast
columns
ofTab
les5-9,
andin
allcolumns
ofTab
le10
.*,
**,**
*indicate
statisticalsign
ificanc
eat
the10%,5%
,an
d1%
levels.Fo
rlogits,(1)measurestheincrease
intheprob
ability
ofbeing
aCitiban
kshareholderin
1925,or
becom
ingon
eeither
during
1925
-1927or
1927-1929,
ifon
eof
your
direct
netw
orkconn
ection
s(tho
seservingas
anoffi
ceror
director
inthesamefirm
that
youalso
servein)chan
gesfrom
beingano
n-Citiban
koffi
ceror
director
tobe
ingaCitiban
koffi
ceror
director.(2)isthesameas
(1)bu
tuses
aon
ce-rem
oved
boardconn
ection
.(3)isthesameas
(2)bu
tuses
(110.66/7.41)of
theon
ce-rem
oved
boardconn
ection
s.(4)-(6)arean
alogou
sto
(1)-(3),
butreplacetheoffi
cer/director
withaCitiban
kshareholderwho
hasheld
shares
forat
leasttw
oyearsan
dis
notan
officeror
director
ofCitiban
k.(7)calculates
theincrease
inprob
ability
ofbe
ingaCitiban
kshareholderfrom
beinglistedon
theIR
Staxp
ayer
list.
(8)repo
rtsun
cond
itiona
lmeans
ofthe
percentage
ofvo
ting
shareh
olde
rsan
dnu
mbe
rsof
shares.Fo
rTob
its,
margina
leff
ects
areexpressedin
increasednu
mbe
rsof
shares.
9
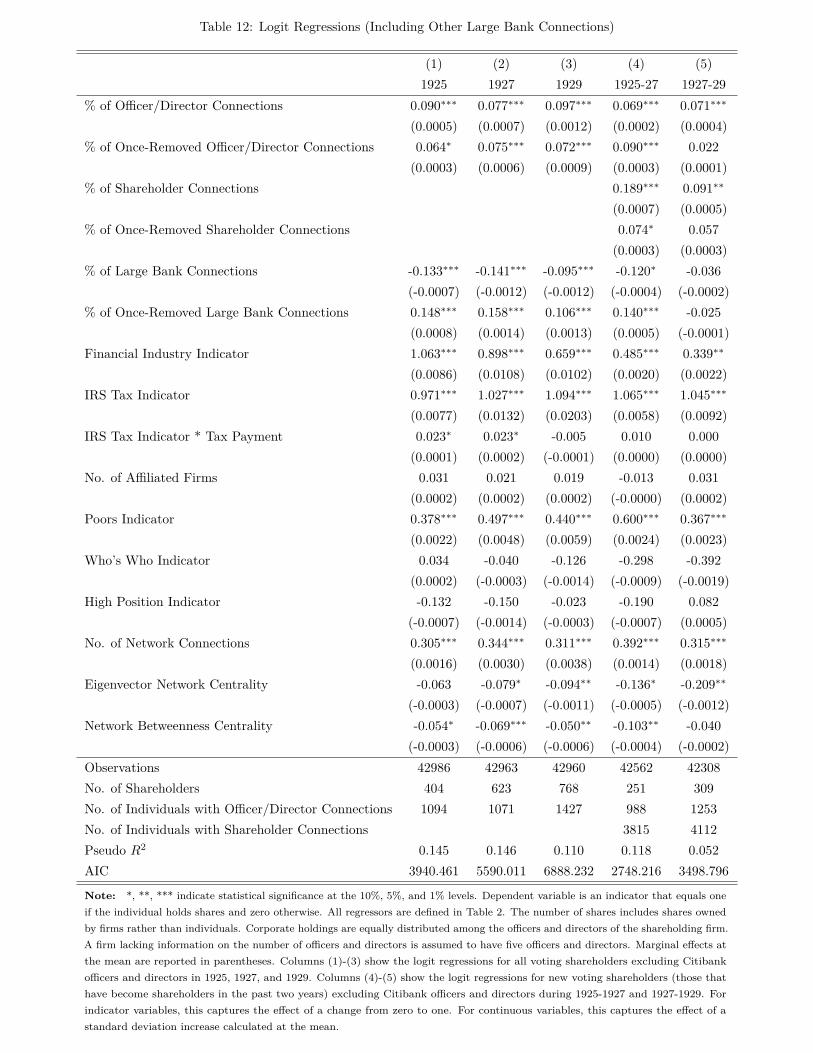
Table 12: Logit Regressions (Including Other Large Bank Connections)
(1) (2) (3) (4) (5)1925 1927 1929 1925-27 1927-29
% of Officer/Director Connections 0.090∗∗∗ 0.077∗∗∗ 0.097∗∗∗ 0.069∗∗∗ 0.071∗∗∗
(0.0005) (0.0007) (0.0012) (0.0002) (0.0004)% of Once-Removed Officer/Director Connections 0.064∗ 0.075∗∗∗ 0.072∗∗∗ 0.090∗∗∗ 0.022
(0.0003) (0.0006) (0.0009) (0.0003) (0.0001)% of Shareholder Connections 0.189∗∗∗ 0.091∗∗
(0.0007) (0.0005)% of Once-Removed Shareholder Connections 0.074∗ 0.057
(0.0003) (0.0003)% of Large Bank Connections -0.133∗∗∗ -0.141∗∗∗ -0.095∗∗∗ -0.120∗ -0.036
(-0.0007) (-0.0012) (-0.0012) (-0.0004) (-0.0002)% of Once-Removed Large Bank Connections 0.148∗∗∗ 0.158∗∗∗ 0.106∗∗∗ 0.140∗∗∗ -0.025
(0.0008) (0.0014) (0.0013) (0.0005) (-0.0001)Financial Industry Indicator 1.063∗∗∗ 0.898∗∗∗ 0.659∗∗∗ 0.485∗∗∗ 0.339∗∗
(0.0086) (0.0108) (0.0102) (0.0020) (0.0022)IRS Tax Indicator 0.971∗∗∗ 1.027∗∗∗ 1.094∗∗∗ 1.065∗∗∗ 1.045∗∗∗
(0.0077) (0.0132) (0.0203) (0.0058) (0.0092)IRS Tax Indicator * Tax Payment 0.023∗ 0.023∗ -0.005 0.010 0.000
(0.0001) (0.0002) (-0.0001) (0.0000) (0.0000)No. of Affiliated Firms 0.031 0.021 0.019 -0.013 0.031
(0.0002) (0.0002) (0.0002) (-0.0000) (0.0002)Poors Indicator 0.378∗∗∗ 0.497∗∗∗ 0.440∗∗∗ 0.600∗∗∗ 0.367∗∗∗
(0.0022) (0.0048) (0.0059) (0.0024) (0.0023)Who’s Who Indicator 0.034 -0.040 -0.126 -0.298 -0.392
(0.0002) (-0.0003) (-0.0014) (-0.0009) (-0.0019)High Position Indicator -0.132 -0.150 -0.023 -0.190 0.082
(-0.0007) (-0.0014) (-0.0003) (-0.0007) (0.0005)No. of Network Connections 0.305∗∗∗ 0.344∗∗∗ 0.311∗∗∗ 0.392∗∗∗ 0.315∗∗∗
(0.0016) (0.0030) (0.0038) (0.0014) (0.0018)Eigenvector Network Centrality -0.063 -0.079∗ -0.094∗∗ -0.136∗ -0.209∗∗
(-0.0003) (-0.0007) (-0.0011) (-0.0005) (-0.0012)Network Betweenness Centrality -0.054∗ -0.069∗∗∗ -0.050∗∗ -0.103∗∗ -0.040
(-0.0003) (-0.0006) (-0.0006) (-0.0004) (-0.0002)Observations 42986 42963 42960 42562 42308No. of Shareholders 404 623 768 251 309No. of Individuals with Officer/Director Connections 1094 1071 1427 988 1253No. of Individuals with Shareholder Connections 3815 4112Pseudo R2 0.145 0.146 0.110 0.118 0.052AIC 3940.461 5590.011 6888.232 2748.216 3498.796
Note: *, **, *** indicate statistical significance at the 10%, 5%, and 1% levels. Dependent variable is an indicator that equals oneif the individual holds shares and zero otherwise. All regressors are defined in Table 2. The number of shares includes shares ownedby firms rather than individuals. Corporate holdings are equally distributed among the officers and directors of the shareholding firm.A firm lacking information on the number of officers and directors is assumed to have five officers and directors. Marginal effects atthe mean are reported in parentheses. Columns (1)-(3) show the logit regressions for all voting shareholders excluding Citibankofficers and directors in 1925, 1927, and 1929. Columns (4)-(5) show the logit regressions for new voting shareholders (those thathave become shareholders in the past two years) excluding Citibank officers and directors during 1925-1927 and 1927-1929. Forindicator variables, this captures the effect of a change from zero to one. For continuous variables, this captures the effect of astandard deviation increase calculated at the mean.
10