who is getting it done - csr asia · who is getting it done the role of csr professionals in asia...
TRANSCRIPT

Who Is Getting It DoneTHE ROLE OF CSR PROFESSIONALS IN ASIA
2016 edition

THE BIG PICTURE SPOTLIGHT ON CSR LEADERS SPOTLIGHT ON HONG KONG,MALAYSIA & SINGAPORE
SPOTLIGHT ON CONSULTANTS CSR PROFESSIONALS IN
ASIASPOTLIGHT ON NGOs
THE BIG PICTUREThis is the seventh year of the WIGID report which continues to expand and explore the status and activities of CSR professionals in Asia.
This report, available to CSR Asia Strategic Partners and respondents, enables CSR professionals to understand how roles compare across Asia.
Over 350 professionals responded to the survey. Figures are reported by respondents in industry, providing consulting services and working in NGOs.
We have included a spotlight on professionals working in Hong Kong, Singapore and for the first time, Malaysia.
CSR professionals were also asked about involvement in development issues, Sustainable Development Goals, Inclusive Business and Shared Value Models.
SPOTLIGHT ON CSR LEADERS
Top 3 APAC based HQ companies1. Tata Group2. MTR Corporation 3. City Developments Limited
Top 3 Non-APAC based HQ companies1. Unilever2. Patagonia3. Nestle
THE PROFESSION
Location• Most respondents from Hong Kong
and Singapore• Steady climb in the number of
respondents from Australia and China year-on-year
• Head office mostly located in Hong Kong, Singapore, America and Europe
• More than half operate globally
Industry• Top 2 industries are manufacturing
and consumer goods
CSR Department• Number of companies with CSR
departments remains unchanged at 63%
• Those without CSR departments have CSR managed by Communications and Human Resources
Governance• 70% of CSR governance at senior
levels • 71% of senior management are
highly committed
Disclosure and materiality• Top 2 disclosure channels are
company website and annual reports• Increasing trend to use social media
to disclose information• Material issues assessed mostly
through internal and external stakeholder engagement and laws or regulations
Gender• 51% male in 2016• Majority of males are in middle
management positions and above• Majority of females are in middle
management positions and belowSalary• As a generalisation professionals in
Asia have higher pay compared to 2015
• Number of male CSR professionals paid more than USD$100,000 is double that of their female counterparts
• Increase in respondents who reported equal or higher salaries than their colleagues in other departments
What are the challenges?
What’s needed?
Inclusive Business/Shared Value Models • More than half are engaged in one or
both of these models• Motivations include improving quality
and production of raw materials, direct access to exporters, processors and access to the bottom of the pyramid
Sustainable Development Goals (SDGs)• 50% are planning to engage
in SDGs• 37% are not engaging due to
lack of budget and knowledge• Top 3 SDGs: Good health and
well-being, quality education and partnerships for the goals
Engaging third parties• 64% engage third parties to
deliver a CSR strategy• 65% engage local NGOs and
50% engage consultancies
Role of business in development issues• 98% reported that companies
will benefit from engaging in development issues
• Motivation to engage includes engaging with stakeholders, reducing business risks and access to new markets
• Types of support businesses require includes awareness on specific development issues, building capacity of staff to align the business with development issues and support from governments, NGOs and development organisations
1. Manpower deficiency 2. Lack of budget3. Lack of knowledge
1. Research relevant to industry2. Training and seminars3. Networking opportunities

THE BIG PICTURE
Industry • Financial services and retail industry has
the highest number of CSR professionals in Hong Kong
• Manufacturing industry has the highest number in Malaysia
• Consumer services has the highest number in Singapore
Disclosure• GRI G4 Sustainability Reporting Guidelines
are most commonly used• One-fifth from each country disclose to
sustainability indices
Salary• Most Hong Kong and Singapore CSR
professionals receive higher salaries compared to Malaysia and their peers in Asia
Governance• More than half of companies’ highest CSR
decision making body is at senior level
SPOTLIGHT ON HONG KONG, MALAYSIA AND SINGAPORE
Location • Majority in Hong Kong, India and Singapore• Head offices are mostly located in Hong
Kong, India and Europe
Size of consultancy firm• 51% have less than 5 consultants• Consultancy firms with between 10 to 100
people have increased
Which sectors want advice?• 32% financial services
Salary• 43% are paid US$50,000 or less and an
increase from last year to 13% for those paid US$100,000 – US$150,000
SPOTLIGHT ON CONSULTANTS
Location • Majority in Hong Kong, India, Thailand and
Singapore
Private sector engagement• Most engage with Asian based MNCs, and
domestic companies• Partnerships involve corporate providing
funds and NGO providing expertise such as leadership development initiatives, social impact measurements and research
SPOTLIGHT ON NGOs
THE BIG PICTURE SPOTLIGHT ON CSR LEADERS SPOTLIGHT ON HONG KONG,MALAYSIA & SINGAPORE
SPOTLIGHT ON CONSULTANTS CSR PROFESSIONALS IN
ASIASPOTLIGHT ON NGOs
DEFINITION
THE BIG PICTURE SPOTLIGHT ON CSR LEADERS SPOTLIGHT ON HONG KONG,MALAYSIA & SINGAPORE
SPOTLIGHT ON CONSULTANTS CSR PROFESSIONALS IN
ASIASPOTLIGHT ON NGOs
In this report the term “CSR professional” is used as a generic term to describe any person employed to manage corporate social responsibility within an organisation. This may include employees with a range of job titles, including but not limited to CSR, CR, sustainability and corporate relations amongst others. The term “CSR consultant” is used to describe any person providing CSR consulting services to another organisation.
METHODOLOGY
The data for this research was collected using an online survey tool. The survey was open for a 4 month period: January 2016 – April 2016. Data from this survey has been compared to the data collected in similar surveys in 2014 and 2015 where past data is available. This survey will be repeated and updated for 2017 in order to further explore the development of the CSR professional role in Asia.
RESPONSE
360 respondents from Asia participated in this year’s survey – 184 industry professionals, 71 consultants and 105 NGOs.
SURVEY DESIGN
In 2016, more options were provided in the survey questions to better capture the broad range of opinions and reflect the increasing scope of work undertaken by CSR Professionals. The survey’s scope has increased to include involvement in Inclusive Business and Shared Value models, engaging in the Sustainable Development Goals (SDGs) and role of private sector on development issues. The data analysis has also expanded to include detailed analysis of responses from Malaysia on top of Hong Kong and Singapore.
FeedbackPlease send any feedback or comments about this report to:
Erin Lyon Executive DirectorCSR Asia [email protected]
THE BIG PICTURE SPOTLIGHT ON CSR LEADERS SPOTLIGHT ON HONG KONG,MALAYSIA & SINGAPORE
SPOTLIGHT ON CONSULTANTS CSR PROFESSIONALS IN
ASIASPOTLIGHT ON NGOs
SPOTLIGHT ONCSR LEADERS

CSR LEADERSThis is the second year we’ve asked respondents which companies they think are sustainability leaders. Among the Asia-Pacific headquartered companies, the Tata Group continues to be top among survey respondents and sits apart from the other companies. New companies frequently mentioned in 2016 include Energy Development Corporation, Indian Railways, Aboitiz, Sansiri, The Mahindra Group and Wipro.
For the non-Asia-Pacific headquartered companies, Unilever came top by a considerable distance. New companies this year include Danone and Intel.
THE BIG PICTURE SPOTLIGHT ON CSR LEADERS SPOTLIGHT ON HONG KONG,MALAYSIA & SINGAPORE
SPOTLIGHT ON CONSULTANTS CSR PROFESSIONALS IN
ASIASPOTLIGHT ON NGOs
TOP 10 COMPANIES (APAC AND NON-APAC BASED HQ)
Asia-Pacific Based HQ Companies
Tata Group
MTR Corporation
City Developments Limited
Swire Group
Siam Cement Group
Energy Development CorporationIndian Railways
AboitizCLP PowerMacquarie Group Sansiri Public Co., LtdTech Mahindra Foundation/Mahindra GroupWipro
1
2
3
4
5
66
777777
Non-Asia-Pacific Based HQ Companies
Unilever
Patagonia
Nestle
IKEA
H&MInterfaceMicrosoft
DanoneGoogleIntelNike
1
2
3
4
555
6666

CSRPROFESSIONALS
IN ASIA
THE BIG PICTURE SPOTLIGHT ON CSR LEADERS SPOTLIGHT ON HONG KONG,MALAYSIA & SINGAPORE
SPOTLIGHT ON CONSULTANTS CSR PROFESSIONALS IN
ASIASPOTLIGHT ON NGOs

4%
1% 1%
8%
25%
7%
3%
5%
8%
2%
0%
2%
4%
21%
3%
2%1%
4%
3%
LOCATIONCountries with most responses continue to be from Hong Kong and Singapore at 25% and 21% respectively. Responses from Singapore have increased since 2014 with the largest increase this year by 9%. This is followed by China and Malaysia both at 8%. The number of responses from Australia and China continues to increase steadily year-on-year.
Respondents from outside of the Asia Pacific region are separated from the data to ensure the accurate reporting of CSR professionals in the region.
LOCATION OF CSR PROFESSIONALS
THE BIG PICTURE SPOTLIGHT ON CSR LEADERS SPOTLIGHT ON HONG KONG,MALAYSIA & SINGAPORE
SPOTLIGHT ON CONSULTANTS CSR PROFESSIONALS IN
ASIASPOTLIGHT ON NGOs

LOCATION OF HEAD OFFICE AND COMPANY OPERATIONSThis year, we asked respondents where the location of their head office is and where their company operates. Head offices are mostly located in Hong Kong at 19% followed by the Americas at 14% and Europe and Singapore at 12%. A sizeable number of respondents’ head offices are in India and Japan at 6%.
60% of respondents reported that their companies operate globally while 11% reported that they operate in Asia and 11% in the country of the head office.
LOCATION OF HEAD OFFICE
COMPANY OPERATIONS
THE BIG PICTURE SPOTLIGHT ON CSR LEADERS SPOTLIGHT ON HONG KONG,MALAYSIA & SINGAPORE
SPOTLIGHT ON CONSULTANTS CSR PROFESSIONALS IN
ASIASPOTLIGHT ON NGOs
2%
3%
2%
3%
12%
3%
2%
2%
5%
6%
1%
6%
19%
12%
3%
1%
2%
14%
1%
Vietnam
Thailand
Taiwan
South Korea
Singapore
Philippines
Pakistan
Myanmar
Malaysia
Japan
Indonesia
India
Hong Kong
Europe
China
Cambodia
Australia
America
Africa
0%5%60% 11%11% 8%
Pacific Region
Southeast Asia
Asia and Pacific Region
Asia
Globally
Country of head office only

INDUSTRYThis year we revised industry categories to capture more granular detail. Most respondents (19%) are from the manufacturing sector. The consumer goods industry has doubled to 16% compared to 2015. This is followed by the retail and energy industries at 13% each. Construction, consumer services, education and training industries have decreased by more than 5% each. Other respondents are from logistics, waste management, luxury, pulp and paper and equity investment fund industries.
INDUSTRY OF CSR PROFESSIONALS
COMPANYThere is little change in the type of company that respondents are employed by compared to 2015. Non-Asian multinational companies (MNCs) and domestic companies held steady at 31% and 13% respectively. Respondents in Asian MNCs decreased by 5% giving rise to Small and Medium Enterprises (SMEs) at 13% and GLC/SOE at 6%.
Again it is important to note the low number of respondents from Government Linked Companies (GLC) and State Owned Enterprises (SOE). The GLC and SOE companies are not leading the drive towards sustainable business practices in Asia.
TYPE OF COMPANY
SME (less than 250 employees)SOEs - State Owned EnterprisesGLC - Government Linked Companies
THE BIG PICTURE SPOTLIGHT ON CSR LEADERS SPOTLIGHT ON HONG KONG,MALAYSIA & SINGAPORE
SPOTLIGHT ON CONSULTANTS CSR PROFESSIONALS IN
ASIASPOTLIGHT ON NGOs
32%
31%
6%
18%
13%
MNC - Asia HQ
MNC - non-Asia HQ
GLC/SOE
Domestic Company
SME
19%16%
13%13%
12%10%10%10%
9%8%8%
7%7%
6%6%6%
5%5%5%
4%4%
3%3%
2%
0% 2% 4% 6% 8% 10% 12% 14% 16% 18% 20%
ManufacturingConsumer goods
RetailEnergy
Financial serviceTechnology
Food & beverageConsulting services
ConstructionTourism & hospitality
Real estate (and REIT)Industrial goods and services
HealthcareTelecommunications
ExtractiveEducation and training
AgricultureTransportation
Consumer servicesUtilities
MediaAviation
Marine and offshoreInsurance
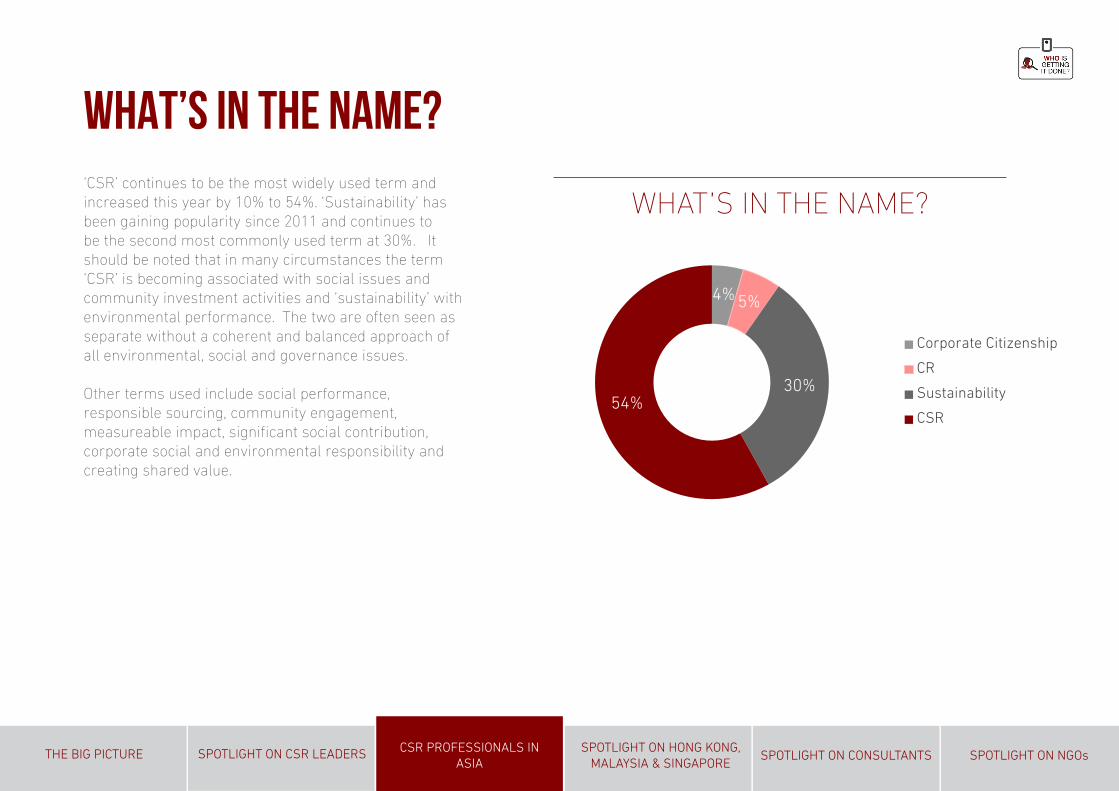
WHAT’S IN THE NAME?‘CSR’ continues to be the most widely used term and increased this year by 10% to 54%. ‘Sustainability’ has been gaining popularity since 2011 and continues to be the second most commonly used term at 30%. It should be noted that in many circumstances the term ‘CSR’ is becoming associated with social issues and community investment activities and ‘sustainability’ with environmental performance. The two are often seen as separate without a coherent and balanced approach of all environmental, social and governance issues.
Other terms used include social performance, responsible sourcing, community engagement, measureable impact, significant social contribution, corporate social and environmental responsibility and creating shared value.
WHAT’S IN THE NAME?
THE BIG PICTURE SPOTLIGHT ON CSR LEADERS SPOTLIGHT ON HONG KONG,MALAYSIA & SINGAPORE
SPOTLIGHT ON CONSULTANTS CSR PROFESSIONALS IN
ASIASPOTLIGHT ON NGOs
4% 5%
30%54%
Corporate Citizenship
CR
Sustainability
CSR
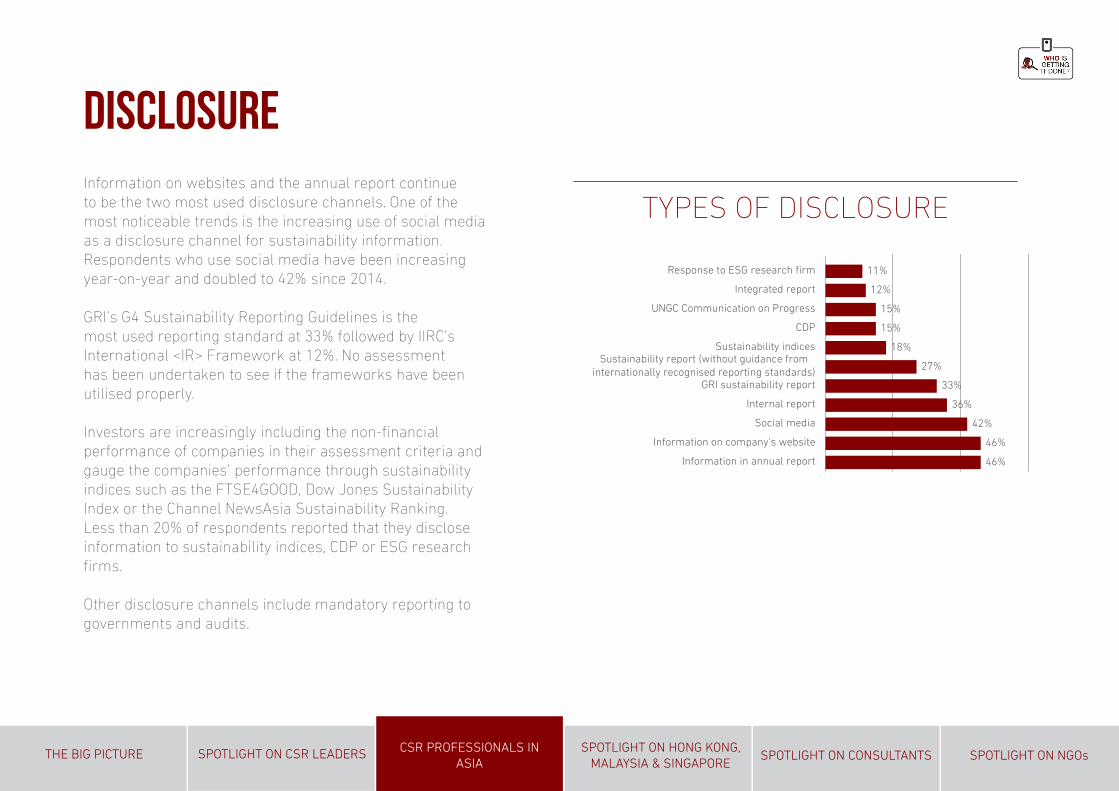
DISCLOSUREInformation on websites and the annual report continue to be the two most used disclosure channels. One of the most noticeable trends is the increasing use of social media as a disclosure channel for sustainability information. Respondents who use social media have been increasing year-on-year and doubled to 42% since 2014.
GRI’s G4 Sustainability Reporting Guidelines is the most used reporting standard at 33% followed by IIRC’s International <IR> Framework at 12%. No assessment has been undertaken to see if the frameworks have been utilised properly.
Investors are increasingly including the non-financial performance of companies in their assessment criteria and gauge the companies’ performance through sustainability indices such as the FTSE4GOOD, Dow Jones Sustainability Index or the Channel NewsAsia Sustainability Ranking. Less than 20% of respondents reported that they disclose information to sustainability indices, CDP or ESG research firms.
Other disclosure channels include mandatory reporting to governments and audits.
TYPES OF DISCLOSURE
THE BIG PICTURE SPOTLIGHT ON CSR LEADERS SPOTLIGHT ON HONG KONG,MALAYSIA & SINGAPORE
SPOTLIGHT ON CONSULTANTS CSR PROFESSIONALS IN
ASIASPOTLIGHT ON NGOs
46%
46%
42%
36%
33%
27%
18%
15%
15%
12%
11%
0
0
0
0
0
0
0
0
Information in annual report
Information on company's website
Social media
Internal report
GRI sustainability report
Sustainability report (without guidance frominternationally recognised reporting standards)
Sustainability indices
CDP
UNGC Communication on Progress
Integrated report
Response to ESG research firm

MATERIALITY
ASSESSING MATERIALITY ISSUESCompanies should disclose material sustainability information. This year, we asked respondents how material issues are determined.
More than two-thirds of respondents engage internal and external stakeholders to determine materiality. 65% reference the law, regulations and norms relevant to their business. 63% determine material issues as part of the enterprise risk management (ERM) process. Voluntary agreements and NGO campaigns also have an impact with a third and just less than a quarter respectively referencing these when determining material issues.
A small number of respondents reported that they are unsure of how issues are assessed as material.
THE BIG PICTURE SPOTLIGHT ON CSR LEADERS SPOTLIGHT ON HONG KONG,MALAYSIA & SINGAPORE
SPOTLIGHT ON CONSULTANTS CSR PROFESSIONALS IN
ASIASPOTLIGHT ON NGOs
72% 67% 65% 63%
NG
O c
ampa
ign
issu
es
Indu
stri
al r
esea
rch
Volu
ntar
y ag
reem
ents
Conc
erns
rai
sed
thro
ugh
grie
vanc
e an
d fe
edba
ck c
hann
els
Ris
k as
sess
men
t
Law
s or
reg
ulat
ions
Exte
rnal
sta
keho
lder
en
gage
men
t
Inte
rnal
sta
keho
lder
en
gage
men
t
42% 40% 33% 24%

DEPARTMENTThe number of respondents who work in a dedicated CSR department remains almost unchanged at 63% as compared to 2015.
For companies without a dedicated department, CSR falls under the responsibility of a number of different departments. Communications and Human Resources departments continue to be the top two departments managing CSR. Respondents who selected Government Relations and Legal departments have increased most significantly by 5% and 4% as compared to 2015. Respondents who reported that the CEO’s office manages CSR has dropped by half to 14%.
WHICH DEPARTMENT MANAGES CSR FOR COMPANIES WITHOUT DEDICATED CSR DEPARTMENT?
THE BIG PICTURE SPOTLIGHT ON CSR LEADERS SPOTLIGHT ON HONG KONG,MALAYSIA & SINGAPORE
SPOTLIGHT ON CONSULTANTS CSR PROFESSIONALS IN
ASIASPOTLIGHT ON NGOs
30%21%
18%17%
16%14%
13%11%
9%7%7%
6%4%
3%1%
000000000
0% 5% 10% 15% 20% 25% 30% 35%
CommunicationsHuman resourcesCorporate affairs
CSR committeeMarketing and PR
CEO's officeEnvironment
Health and safetyStrategy
LegalGovernment relations
PurchasingCompany foundation
FinanceTechnical services

CORPORATE GOVERNANCE LEVEL
SENIOR MANAGEMENT COMMITMENT LEVEL
GOVERNANCERespondents were asked to identify the highest decision making body responsible for CSR. 70% of respondents reported that CSR strategy is managed at senior levels within the organisation. CSR committee at Business Unit level has held steady at 7% since 2014. Respondents whose companies do not have a CSR committee have been steadily declining from 18% in 2014 to 13% in 2016.
This year, we also asked respondents about the level of commitment from senior management. 71% of respondents reported high levels of commitment while 23% are moderately committed. With governments and regulators increasingly emphasising the importance of non-financial performance, we expect to see more senior management with high levels of commitment in the future.
THE BIG PICTURE SPOTLIGHT ON CSR LEADERS SPOTLIGHT ON HONG KONG,MALAYSIA & SINGAPORE
SPOTLIGHT ON CONSULTANTS CSR PROFESSIONALS IN
ASIASPOTLIGHT ON NGOs
0%
5%
10%
15%
20%
25%
30%
35%
40%
Board Seniormanagement
committee
Business unit Voluntary Not applicable(your companydoes not have aCSR committee)
0%
5%
10%
15%
20%
25%
30%
35%
40%
45%
Very low Low Moderate High Very high

CAPACITY AND GENDER57% of respondents hold full time CSR appointments and 32% manage CSR along with other responsibilities. The percentage of full time staff has decreased from 70% in 2014 to 57%. The percentage of staff managing CSR with other responsibilities has increased from 23% in 2014 to 32% in 2016. 6% of respondents sit on the board and 22% have senior management positions. 55% are middle management, an increase by 10% from 2015.
CSR is becoming a more senior appointment, perhaps this is why the number of full time staff has decreased, senior staff have more responsibilities but crucially can also influence strategy at more senior levels.
THE BIG PICTURE SPOTLIGHT ON CSR LEADERS SPOTLIGHT ON HONG KONG,MALAYSIA & SINGAPORE
SPOTLIGHT ON CONSULTANTS CSR PROFESSIONALS IN
ASIASPOTLIGHT ON NGOs
Board 6%
Senior management 22%
Middle management 55%
Junior management 13%
Administration 4% 25% 75%
50%
44% 56%
63% 37%
50%
83% 17%
11%57% 32%
CSR along with otherresponsibilities
Full time appointment
Voluntary
The gender profile of CSR professionals is almost equivalent however the percentage of men is slowly increasing year-on-year from 48% in 2014 to 51% in 2016.
A larger proportion of female CSR professionals are holding up to middle management positions and are higher than male CSR professionals in the administration and middle management levels by 50% and 12%.
On the other hand, the number of male CSR professionals compared to female CSR professionals holding senior management positions is almost double and Board level positions, quadruple. This reflects broader gender trend in companies and should be a red flag for business.
51%
49%

CAREER BACKGROUNDCSR professionals have diverse backgrounds and experience. The top 2 career backgrounds continue to be in CSR and corporate communications. Marketing rose by 10% to be the third highest career background followed by health, safety and environment (HSE) which declined by 4%.
Other career backgrounds include public relations, training & development, assurance, risk management and inspection and assessment.
Companies recruiting CSR talent internally and externally have both increased to 68% and 78% respectively. While this indicates the increasing need for talent to manage CSR, it may be managed together with other responsibilities as shown in the “Department” section of the report.
THE BIG PICTURE SPOTLIGHT ON CSR LEADERS SPOTLIGHT ON HONG KONG,MALAYSIA & SINGAPORE
SPOTLIGHT ON CONSULTANTS CSR PROFESSIONALS IN
ASIASPOTLIGHT ON NGOs
CAREER BACKGROUND
38%29%
24%17%
14%11%11%11%11%
10%9%
8%6%
4%4%4%4%
2%000000
0% 10% 20% 30% 40%
Corporate social responsibilityCorporate communications manager
MarketingHealth, safety and environmental manager
AdministrationHuman resource manager
AcademiaNGO manager
Quality managementFinance
EngineeringOperations manager
Supply chain managementDevelopment agency
GovernmentInvestor relations
LawPurchasing

SALARYThe number of respondents in the lowest salary bracket has been declining since 2014 from 44% to 30% in 2016 which indicates that CSR professionals are increasingly paid higher salaries. Respondents with salaries in the second lowest bracket and second highest bracket have increased significantly by 6% and 7% respectively.
This year we have broken down the salaries by gender and the results are similar to seniority by gender. The proportion of female CSR professionals being paid within the first three salary brackets is larger than male CSR professionals by 10%. The number of male CSR professionals being paid in the top two salary brackets doubles that of females.
The salaries of CSR professionals in this survey are relative to the cost of living in the different markets responding to the survey and cannot be taken as an absolute indicator. Compared to the previous year, 59% of respondents stated that they received salaries equal to their peers, an increase of 4%. 28% of respondents reporting lower salaries in comparison to other departments saw a decrease of 7% compared to 2015. There was an increase of 5% from respondents with salaries higher than their peers.
SALARY
COMPARED TO OTHER DEPARTMENTS, THE SALARY OF A CSR MANAGER IS:
THE BIG PICTURE SPOTLIGHT ON CSR LEADERS SPOTLIGHT ON HONG KONG,MALAYSIA & SINGAPORE
SPOTLIGHT ON CONSULTANTS CSR PROFESSIONALS IN
ASIASPOTLIGHT ON NGOs
US$50,000or less
US$50,000 –US$75,000
US$75,000 – US$100,000
US$100,000 – US$150,000
US$150,000 or above
0%
5%
10%
15%
20%
25%
30%
35%
US$50,000 or less US$50,000 –US$75,000
US$75,000 –US$100,000
US$100,000 –US$150,000
US$150,000 orabove
Male Female
0%
5%
10%
15%
20%
25%
30%
35%
US$50,000 or less US$50,000 –US$75,000
US$75,000 –US$100,000
US$100,000 –US$150,000
US$150,000 orabove
Male Female
0%
10%
20%
30%
40%
50%
60%
70%
<< < high > >>=< ><< >>

CHALLENGESThe top two challenges faced by CSR professionals have remained the same since 2014 with just above half reporting that they had insufficient manpower and 42% reporting a lack of budget – this is an increase of 7%. Challenges that have increased for 2016 are - lack of knowledge (by 9%), scope of responsibilities too wide (by 2%) and sustainability reporting (by 4%).
Other challenges cited by CSR professionals include cascading CSR targets to operations globally and lack of incentive from government.
CHALLENGES
SUPPORT REQUIREDThe support that most CSR professionals need has remained the same since 2014 – research relevant to industry, training and seminars and networking opportunities. Requested areas for support that have increased this year are budget (by 4%) and Asia-specific voluntary agreements (2%).
Other support requested includes capacity building for the CSR team, aligning CSR with the country’s development needs, impact measurement, more research or outcome reports from credible NGOs, future-oriented research and the business case for CSR.
SUPPORT REQUIRED
THE BIG PICTURE SPOTLIGHT ON CSR LEADERS SPOTLIGHT ON HONG KONG,MALAYSIA & SINGAPORE
SPOTLIGHT ON CONSULTANTS CSR PROFESSIONALS IN
ASIASPOTLIGHT ON NGOs
14%
24%
25%
28%
28%
33%
35%
49%
52%
Scope of responsibilities toonarrow
Lack of support/buy-in fromemployees
Sustainability reporting
Lack of leadership support
Scope of responsibilities too wide
Finding suitable partners
Lack of knowledge
Lack of budget
Team too small
18%
38%
39%
39%
47%
49%
55%
More Asia-specific voluntaryagreements
Relevant professional qualifications
More supporting governmentlegislation
More budget
More networking opportunities
Training and seminars
More research relevant to yourindustry

INCLUSIVE BUSINESS/SHARED VALUE MODELSWe asked respondents if their companies are looking at Inclusive Business (IB) or Shared Value (SV) business models. IB is defined as commercially viable and scalable incorporation of low-income populations into an organisation’s value chain. SV is defined as generating economic value in a way that also produces value for society by addressing its challenges.
59% of respondents reported that they are engaged in IB and 21% report they are highly engaged. 72% are engaged in SV of which just less than a third are highly engaged. Close to 50% of respondents were unsure of the potential for their company in IB or SV models.
The reasons given for engaging in IB and SV include: improving quality and production of raw materials, direct access to exporters and processors, access to Bottom of the Pyramid (BoP) markets, better engagement with stakeholders and relations with local communities and strengthening brand reputation.
COMPANIES ENGAGED IN IB AND CSV MODELS POTENTIAL OF IB AND SV MODELS
THE BIG PICTURE SPOTLIGHT ON CSR LEADERS SPOTLIGHT ON HONG KONG,MALAYSIA & SINGAPORE
SPOTLIGHT ON CONSULTANTS CSR PROFESSIONALS IN
ASIASPOTLIGHT ON NGOs
0%
10%
20%
30%
40%
50%
60%
Inclusive Business Creating Shared Value
Not sure Yes No
0%
5%
10%
15%
20%
25%
30%
35%
40%
45%
Inclusive Business Creating Shared Value
Not sure Not engaged at all Moderately engaged Very engaged

SUSTAINABLE DEVELOPMENT GOALS (SDGs)The Sustainable Development Goals (the SDGs or Global Goals) were adopted by the United Nations Summit in September 2015. The Global Goals are a set of ambitious goals for the next 15 years to end poverty, protect the planet and ensure prosperity. The private sector is explicitly mentioned and there is an expectation that businesses will use their resources, capabilities and creativity in delivering solutions to these global challenges.
50% of respondents reported that their companies plan to deliver the SDGs. The top 5 SDGs that companies plan to deliver are: good health and well-being (61%), quality education (58%), partnerships for the goals (56%), decent work and economic growth (54%) and clean water and sanitation (54%).
37% of respondents reported that their companies are not planning to engage with the SDGs due to the lack of budget (38%), lack of knowledge (33%) or because they are unsure how to begin working with the SDGs (33%).
Other reasons for not delivering the SDGs include focusing on accountability to stakeholders, fulfilling requirements of other signatory requirements and waiting for parent company’s directions.
COMPANIES PLAN TO FOCUS ON THESE SDGS
THE BIG PICTURE SPOTLIGHT ON CSR LEADERS SPOTLIGHT ON HONG KONG,MALAYSIA & SINGAPORE
SPOTLIGHT ON CONSULTANTS CSR PROFESSIONALS IN
ASIASPOTLIGHT ON NGOs
15%
15%
19%
20%
25%
31%
41%
45%
50%
53%
53%
53%
54%
54%
56%
58%
61%
Zero hunger
Life below water
Peace and justice, strong institutions
Life on land
Reduced inequalities
No poverty
Affordable and clean energy
Responsible consumption and production
Sustainable cities and communities
Gender equality
Industry, innovation and infrastructure
Climate action
Clean water and sanitation
Decent work and economic growth
Partnerships for the goals
Quality education
Good health and well-being
REASONS FOR NOT ENGAGING THE SDGS
38%
33%33%
24%
19% Lack of budget
Unsure of how to beginengaging the SDGsLack of knowledge
Lack of support fromsenior managementLack of manpower
38%
33%33%
24%
19% Lack of budget
Unsure of how to beginengaging the SDGsLack of knowledge
Lack of support fromsenior managementLack of manpower
38%
33%33%
24%
19% Lack of budget
Unsure of how to beginengaging the SDGsLack of knowledge
Lack of support fromsenior managementLack of manpower
38%
33%33%
24%
19% Lack of budget
Unsure of how to beginengaging the SDGsLack of knowledge
Lack of support fromsenior managementLack of manpower

ENGAGING THIRD PARTIES64% of respondents engage with third party organisations, unchanged from 2015. Local NGOs remain the top third party organisation engaged at 65%. 50% of respondents engage with consulting firms, a new option included this year. The percentage of respondents engaging all other categories of third party organisations listed in the chart has declined from 1-7%. The largest decline has been with engaging universities at 7%.
Other third party organisations engaged include governments, chamber of commerce, industry associations and social enterprises.
THE BIG PICTURE SPOTLIGHT ON CSR LEADERS SPOTLIGHT ON HONG KONG,MALAYSIA & SINGAPORE
SPOTLIGHT ON CONSULTANTS CSR PROFESSIONALS IN
ASIASPOTLIGHT ON NGOs
THIRD PARTY ORGANISATIONS ENGAGED
25%28%
42%
44%47%
50%
65%
United Nations
Think tank
University
CSR membershiporganisationInternational NGO's
Consulting firm
Local NGO's
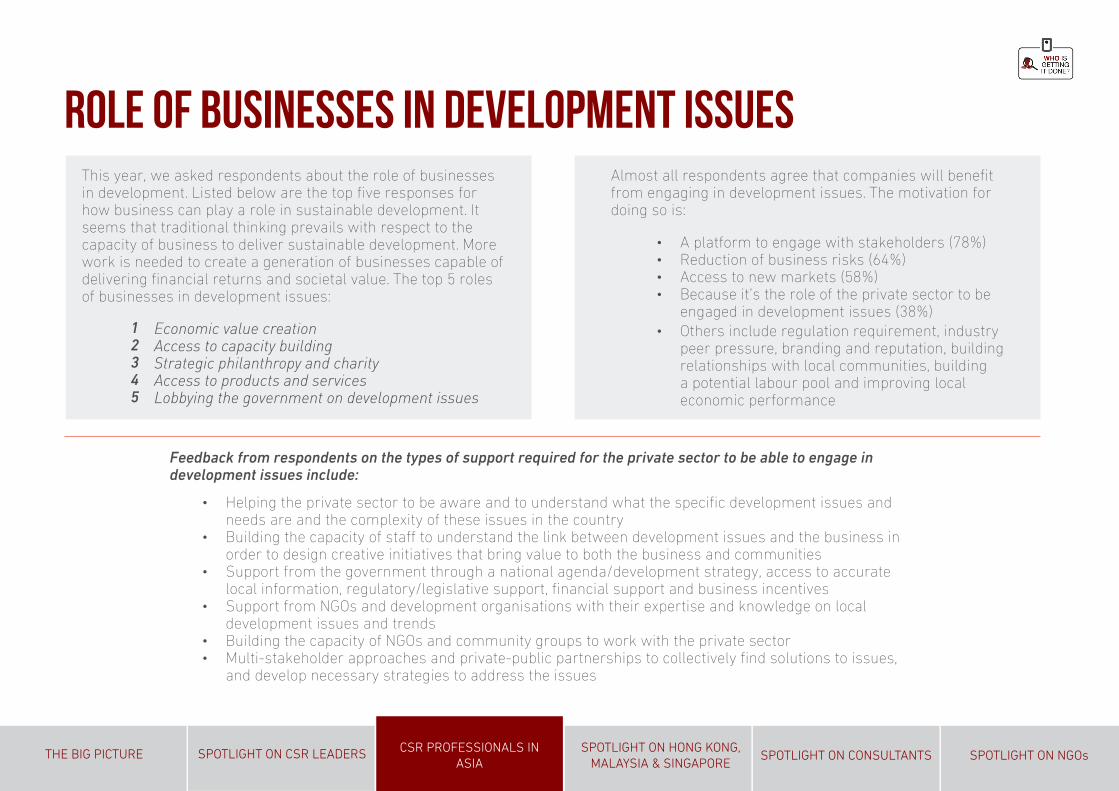
ROLE OF BUSINESSES IN DEVELOPMENT ISSUESThis year, we asked respondents about the role of businesses in development. Listed below are the top five responses for how business can play a role in sustainable development. It seems that traditional thinking prevails with respect to the capacity of business to deliver sustainable development. More work is needed to create a generation of businesses capable of delivering financial returns and societal value. The top 5 roles of businesses in development issues:
12345
Economic value creationAccess to capacity buildingStrategic philanthropy and charityAccess to products and servicesLobbying the government on development issues
Almost all respondents agree that companies will benefit from engaging in development issues. The motivation for doing so is:
• A platform to engage with stakeholders (78%)• Reduction of business risks (64%)• Access to new markets (58%)• Because it’s the role of the private sector to be
engaged in development issues (38%)• Others include regulation requirement, industry
peer pressure, branding and reputation, building relationships with local communities, building a potential labour pool and improving local economic performance
Feedback from respondents on the types of support required for the private sector to be able to engage in development issues include:
• Helping the private sector to be aware and to understand what the specific development issues and needs are and the complexity of these issues in the country
• Building the capacity of staff to understand the link between development issues and the business in order to design creative initiatives that bring value to both the business and communities
• Support from the government through a national agenda/development strategy, access to accurate local information, regulatory/legislative support, financial support and business incentives
• Support from NGOs and development organisations with their expertise and knowledge on local development issues and trends
• Building the capacity of NGOs and community groups to work with the private sector• Multi-stakeholder approaches and private-public partnerships to collectively find solutions to issues,
and develop necessary strategies to address the issues
THE BIG PICTURE SPOTLIGHT ON CSR LEADERS SPOTLIGHT ON HONG KONG,MALAYSIA & SINGAPORE
SPOTLIGHT ON CONSULTANTS CSR PROFESSIONALS IN
ASIASPOTLIGHT ON NGOs

BUDGETThe number of respondents reporting budget increases was up by 8% compared to 2015. 42% of respondents’ budgets were unchanged this year. More than half of all professionals are optimistic that their budgets will increase in the next 5 years.
BUDGET 2016 VS BUDGET 2015
5-YEAR BUDGET OUTLOOK
THE BIG PICTURE SPOTLIGHT ON CSR LEADERS SPOTLIGHT ON HONG KONG,MALAYSIA & SINGAPORE
SPOTLIGHT ON CONSULTANTS CSR PROFESSIONALS IN
ASIASPOTLIGHT ON NGOs
0%
10%
20%
30%
40%
50%
60%
<< < high > >>
0%
5%
10%
15%
20%
25%
30%
35%
40%
45%
<< < high > >>=
=

SPOTLIGHT ON HONG KONG, MALAYSIA & SINGAPORE
THE BIG PICTURE SPOTLIGHT ON CSR LEADERS SPOTLIGHT ON HONG KONG,MALAYSIA & SINGAPORE
SPOTLIGHT ON CONSULTANTS CSR PROFESSIONALS IN
ASIASPOTLIGHT ON NGOs

THE BIG PICTURE SPOTLIGHT ON CSR LEADERS SPOTLIGHT ON HONG KONG,MALAYSIA & SINGAPORE
SPOTLIGHT ON CONSULTANTS CSR PROFESSIONALS IN
ASIASPOTLIGHT ON NGOs
LOCATION OF HEAD OFFICE AND COMPANY OPERATIONSIn Hong Kong and Malaysia, more than 60% of respondents are working in head office, while less than half of Singapore respondents’ head offices are local. The result from respondents in Singapore is that a higher percentage of head offices are located in America and Europe compared to respondents from Hong Kong and Malaysia.
More than 60% of respondents from all 3 countries reported that their companies operate globally.
COMPANY OPERATIONS
0%
10%
20%
30%
40%
50%
60%
70%
80%
Globally Asia and Pacificregion
Asia Southeast Asia Pacific region Country of head officeonly
Hong Kong Singapore Malaysia
HONG KONG MALAYSIA SINGAPORE
Local Market
60%
AustraliaEurope
America
China
Japan
0%17%
2%
17%
4%Local Market
69%
AmericaAustralia
Europe
China
Japan
0%8%
0%
23%
0%
Local Market
46%
AustraliaEurope
America
China
Japan
0%22%
2%
20%
5%
24%
5%

0%
10%
20%
30%
40%
50%
60%
70%
Hong Kong Singapore Malaysia
INDUSTRYFinancial services and Retail are the top sectors in Hong Kong at 21% each. The manufacturing (40%) sector has the largest number of respondents in Malaysia and the consumer services sector for Singapore at 17%.
INDUSTRY OF CSR PROFESSIONALS
DISCLOSUREMore than 40% of respondents from all 3 countries disclose information in an annual report. The GRI G4 Sustainability Reporting Guidelines are the most commonly used standard compared to IIRC’s International <IR> Framework in all 3 countries. Approximately one-fifth of respondents from each country disclose information to sustainability indices.
40% of respondents in Malaysia produce sustainability reports without guidance from internationally recognised reporting standards. Slightly more than half of the respondents in Singapore disclose through social media platforms.
TYPES OF DISCLOSURE
0% 5% 10% 15% 20% 25% 30% 35% 40%
Agriculture
Aviation
Consulting services
Consumer goods
Consumer services
Construction
Education and Training
Energy
Extractive
Financial Service
Food & Beverage
Health Care
Industrial goods and services
Insurance
Manufacturing
Marine and Offshore
Media
Real Estate (and REIT)
Retail
Technology
Telecommunications
Tourism & Hospitality
Transportation
Utilities
Hong Kong Singapore Malaysia
0%
10%
20%
30%
40%
50%
60%
70%
Hong Kong Singapore Malaysia
Sustainab
ility r
epor
t (with
out
guidance
from
repor
ting st
andar
ds)
THE BIG PICTURE SPOTLIGHT ON CSR LEADERS SPOTLIGHT ON HONG KONG,MALAYSIA & SINGAPORE
SPOTLIGHT ON CONSULTANTS CSR PROFESSIONALS IN
ASIASPOTLIGHT ON NGOs
Inform
ation
in an
nual re
port
GRI susta
inabilit
y rep
ort
Integra
ted re
port (
IR)
Intern
al re
port
Social
med
ia
UNGC Com
munica
tion in
Pro
gress
CDP
ESG rese
arch
firms
Sustainab
ility i
ndices

THE BIG PICTURE SPOTLIGHT ON CSR LEADERS SPOTLIGHT ON HONG KONG,MALAYSIA & SINGAPORE
SPOTLIGHT ON CONSULTANTS CSR PROFESSIONALS IN
ASIASPOTLIGHT ON NGOs
GOVERNANCE85% of respondents in Hong Kong, 78% in Singapore and 60% in Malaysia reported that CSR is managed at a senior level. While 78% of respondents in Singapore reported that CSR is managed at a senior level, only 23% manage at board level in stark contrast to Hong Kong and Malaysia where 47% manage at board level. We can expect an increase in the number of respondents from Singapore reporting that CSR is managed at board level with Singapore Exchange’s (SGX) mandatory sustainability reporting requirement in effect from financial year 2017. SGX’s sustainability reporting requirement requires listed companies to produce a statement from the Board stating that it has considered sustainability issues as part of its strategic formulation, determined the material sustainability issues and overseen the management and monitoring of those issues. In Malaysia, the number of companies where CSR is managed at senior management level is significantly lower than Singapore and Hong Kong and nearly a third of respondent companies in Malaysia have no governance body managing CSR at all.
Most of the Hong Kong respondents (77%) report high levels of management commitment which supports the governance findings where 85% reported that CSR is managed at a senior level.
CSR GOVERNANCE LEVEL
SENIOR MANAGEMENT COMMITMENT LEVEL
0%
10%
20%
30%
40%
50%
60%
Board Seniormanagement
committee
Business unit Voluntary No governancebody
Hong Kong Singapore Malaysia
0%
10%
20%
30%
40%
50%
60%
Very low Low Moderate High Very high
Hong Kong
Singapore
Malaysia

THE BIG PICTURE SPOTLIGHT ON CSR LEADERS SPOTLIGHT ON HONG KONG,MALAYSIA & SINGAPORE
SPOTLIGHT ON CONSULTANTS CSR PROFESSIONALS IN
ASIASPOTLIGHT ON NGOs
SALARYCSR professionals in Hong Kong and Singapore command higher salaries in comparison to Malaysia or their counterparts in Asia – most likely due to higher living costs. Three quarters of respondents in Hong Kong are paid between US$50,000 – US$150,000 and 82% reported that their salaries are competitive (equal) or more than their colleagues in other departments.
In Singapore, almost 40% are paid between US$50,000 – US$75,000. 80% reported that their salaries are competitive (equal) or more than their colleagues in other departments.
In Malaysia, 87% of respondents are paid up to US$75,000 and only 60% reported that their salaries are competitive (equal) or more than their colleagues in other departments.
SALARY OF CSR PROFESSIONAL
COMPARED TO OTHER DEPARTMENTS, THE SALARY OF A CSR MANAGER IS:
US$50,000or less
US$50,000 –US$75,000
US$75,000 – US$100,000
US$100,000 – US$150,000
US$150,000 or above
0%
10%
20%
30%
40%
50%
60%
70%
Hong Kong Singapore Malaysia Asia
0%
10%
20%
30%
40%
50%
60%
70%
80%
<< < = > >>
Hong Kong
Singapore
Malaysia

THE BIG PICTURE SPOTLIGHT ON CSR LEADERS SPOTLIGHT ON HONG KONG,MALAYSIA & SINGAPORE
SPOTLIGHT ON CONSULTANTS CSR PROFESSIONALS IN
ASIASPOTLIGHT ON NGOs
CHALLENGESThe top 2 challenges faced by CSR professionals in Hong Kong and Singapore are insufficient manpower and lack of budget. In Malaysia, lack of budget and lack of knowledge are the top 2 challenges.
The challenge specific to Hong Kong is that the scope of responsibilities is too wide, while in Malaysia, the country specific challenge is sustainability reporting.
CHALLENGES0% 10% 20% 30% 40% 50% 60% 70% 80%
Finding suitable partners
Lack of budget
Lack of knowledge
Lack of leadership support
Lack of support/buy in from employers
Scope of responsibilities too narrow
Scope of responsibilities too wide
Sustainability reporting
Team too small
Hong Kong Singapore Malaysia
0% 10% 20% 30% 40% 50% 60% 70% 80%
Finding suitable partners
Lack of budget
Lack of knowledge
Lack of leadership support
Lack of support/buy in from employers
Scope of responsibilities too narrow
Scope of responsibilities too wide
Sustainability reporting
Team too small
Hong Kong Singapore Malaysia

SPOTLIGHT ON CONSULTANTS
THE BIG PICTURE SPOTLIGHT ON CSR LEADERS SPOTLIGHT ON HONG KONG,MALAYSIA & SINGAPORE
SPOTLIGHT ON CONSULTANTS CSR PROFESSIONALS IN
ASIASPOTLIGHT ON NGOs
THE BIG PICTURE SPOTLIGHT ON CSR LEADERS SPOTLIGHT ON HONG KONG,MALAYSIA & SINGAPORE
SPOTLIGHT ON CONSULTANTS CSR PROFESSIONALS IN
ASIASPOTLIGHT ON NGOs
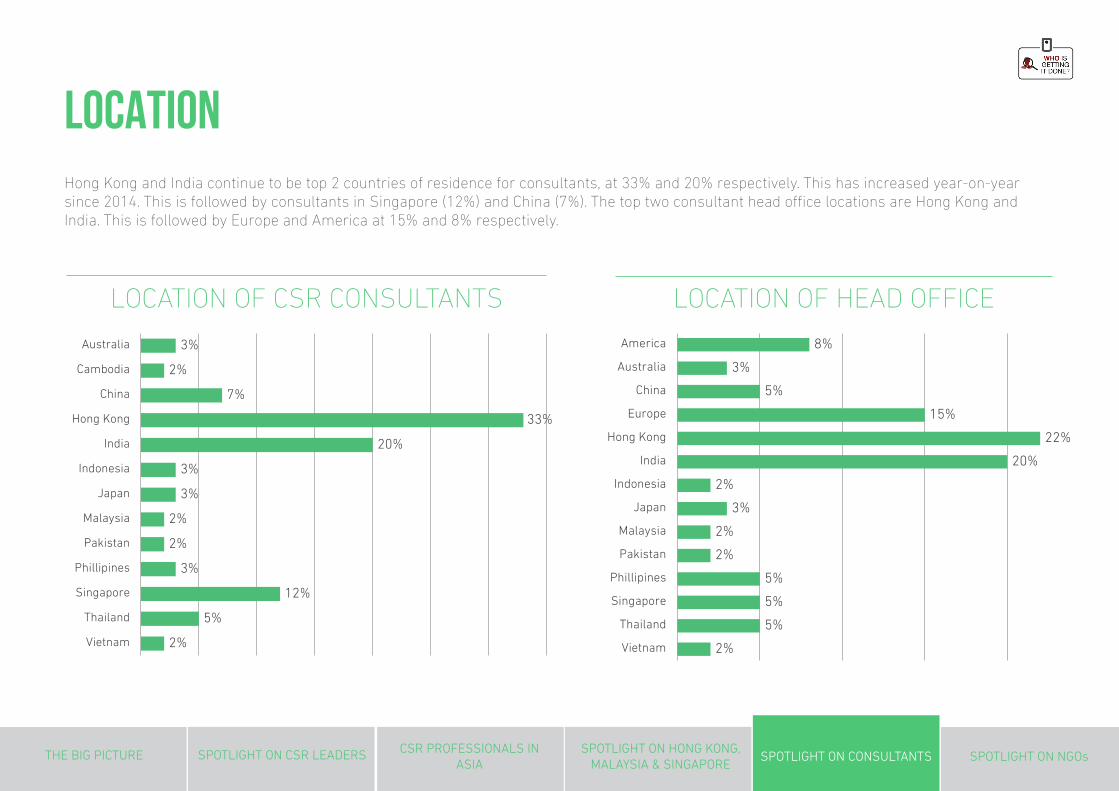
LOCATIONHong Kong and India continue to be top 2 countries of residence for consultants, at 33% and 20% respectively. This has increased year-on-year since 2014. This is followed by consultants in Singapore (12%) and China (7%). The top two consultant head office locations are Hong Kong and India. This is followed by Europe and America at 15% and 8% respectively.
LOCATION OF CSR CONSULTANTS LOCATION OF HEAD OFFICE
2%
5%
5%
5%
2%
2%
3%
2%
20%
22%
15%
5%
3%
8%
Vietnam
Thailand
Singapore
Phillipines
Pakistan
Malaysia
Japan
Indonesia
India
Hong Kong
Europe
China
Australia
America
Series 1
2%
5%
12%
3%
2%
2%
3%
3%
20%
33%
7%
2%
3%
Vietnam
Thailand
Singapore
Phillipines
Pakistan
Malaysia
Japan
Indonesia
India
Hong Kong
China
Cambodia
Australia
Series 1

THE BIG PICTURE SPOTLIGHT ON CSR LEADERS SPOTLIGHT ON HONG KONG,MALAYSIA & SINGAPORE
SPOTLIGHT ON CONSULTANTS CSR PROFESSIONALS IN
ASIASPOTLIGHT ON NGOs
CONSULTANCY SIZEMore than half of the consultants’ firms have a headcount of less than 5. However as compared to 2015, consultancies with 10-20 people increased by 4% to 8%, 20-50 people increased by 7% to 13%.
52%
18%
8%
13%
3%5%
Less than 5
5 to 10
10 to 20
20 to 50
50 to 100
More than 100
SIZE OF CONSULTANCY
CLIENTSThe financial services and NGO sectors are most frequently serviced by consultants at 32% and 30% respectively. Compared to 2015, we have also observed a significant increase in consulting services provided to the technology sector (22%) which increased by 12%, consumer services sector (25%) which increased by 10% and healthcare and transportation sectors which increased by 6% each to 23%.
CONSULTING SERVICES FREQUENTLY PROVIDED TO
52%
18%
8%
13%
3%5%
Less than 5
5 to 10
10 to 20
20 to 50
50 to 100
More than 100
52%
18%
8%
13%
3%5%
Less than 5
5 to 10
10 to 20
20 to 50
50 to 100
More than 100
5%
8%
12%
13%
13%
13%
15%
17%
18%
22%
22%
22%
23%
23%
25%
25%
28%
28%
28%
30%
32%
Marine and offshore
Media
Insurance
Extractive
Industrial goods and services
Tourism and hospitality
Real estate (and REIT)
Telecommunications
Construction
Food and beverage
Technology
Utilities
Health care
Transportation
Consumer goods
Consumer services
Education and training
Energy
Manufacturing
NGO
Financial services

THE BIG PICTURE SPOTLIGHT ON CSR LEADERS SPOTLIGHT ON HONG KONG,MALAYSIA & SINGAPORE
SPOTLIGHT ON CONSULTANTS CSR PROFESSIONALS IN
ASIASPOTLIGHT ON NGOs
CONSULTANCY28% of respondents provide dedicated CSR consulting services only, whilst the remaining provide other consulting services with management and research being the most common. Consultancy firms that provide management, investor relations and legal services in addition to CSR continue to increase year-on-year suggesting that professional services firms are increasingly providing CSR consultancy services.
Other consulting services provided include communications, auditing, environmental management and procurement.
OTHER TYPES OF CONSULTING SERVICES PROVIDED
53%
40%33%
28%
18%15%
Management
Research
Investor relations
Only CSR
Information technology
Legal
SALARY FOR CONSULTANTSConsultants are generally paid more than in 2015. We see a decline of 4% in the lowest salary bracket and 5% decline in the middle salary bracket giving a bump of 7% to the US$100,000 – US$150,000 bracket and 1% increase to the second lowest and the highest salary brackets.
SALARY
US$50,000or less
US$50,000 –US$75,000
US$75,000 – US$100,000
US$100,000 – US$150,000
US$150,000 or above
53%
40%33%
28%
18%15%
Management
Research
Investor relations
Only CSR
Information technology
Legal
0%
5%
10%
15%
20%
25%
30%
35%
40%
45%
50%
US$50,000 or less US$50,000 –US$75,000
US$75,000 –US$100,000
US$100,000 –US$150,000
US$150,000 orabove
2015 2016
SPOTLIGHT ON NGOs
THE BIG PICTURE SPOTLIGHT ON CSR LEADERS SPOTLIGHT ON HONG KONG,MALAYSIA & SINGAPORE
SPOTLIGHT ON CONSULTANTS CSR PROFESSIONALS IN
ASIASPOTLIGHT ON NGOs

4%
4%
2%
2%
20%
11%
6%
4%
5%
1%
4%
8%
13%
2%
11%
2%
Australia
Bangladesh
Cambodia
China
Hong Kong
India
Indonesia
Japan
Malaysia
Myanmar
Pakistan
Philippines
Singapore
South Korea
Thailand
Vietnam
10%
3%
2%
1%
1%
8%
15%
11%
4%
4%
4%
1%
4%
8%
9%
2%
5%
1%
America
Australia
Bangladesh
Cambodia
China
Europe
Hong Kong
India
Indonesia
Japan
Malaysia
Myanmar
Pakistan
Philippines
Singapore
South Korea
Thailand
Vietnam
THE BIG PICTURE SPOTLIGHT ON CSR LEADERS SPOTLIGHT ON HONG KONG,MALAYSIA & SINGAPORE
SPOTLIGHT ON CONSULTANTS CSR PROFESSIONALS IN
ASIASPOTLIGHT ON NGOs
LOCATIONNGO respondents in Hong Kong make up the bulk of respondents at 20%. For the first time we have respondents in Cambodia and Japan at 2% and 4% respectively. The Philippines saw the largest increase from 5% to 8% this year.
LOCATION OF NGO EMPLOYEES LOCATION OF HEAD OFFICE
Australia
Bangladesh
Cambodia
China
Hong Kong
India
Indonesia
Japan
Malaysia
Myanmar
Pakistan
Philippines
Singapore
South Korea
Thailand
Vietnam
America
Australia
Bangladesh
Cambodia
China
Europe
Hong Kong
India
Indonesia
Japan
Malaysia
Myanmar
Pakistan
Philippines
Singapore
South Korea
Thailand
Vietnam
4%
4%
2%
2%
11%
20%
6%
4%
5%
1%
4%
8%
13%
2%
11%
2%
2%
2%
1%1%
1%
1%
4%
4%4%
4%
5%
8%
9%
8%
3%
11%
10%
15%

THE BIG PICTURE SPOTLIGHT ON CSR LEADERS SPOTLIGHT ON HONG KONG,MALAYSIA & SINGAPORE
SPOTLIGHT ON CONSULTANTS CSR PROFESSIONALS IN
ASIASPOTLIGHT ON NGOs
NGO SIZEThis year, we have seen a significant increase in respondents from larger NGOs in the 50-100 staff and more than 100 staff brackets at 45% and 12% as compared to 2015 at 30% and 8% respectively. Slightly less than half of the respondents are from NGOs with up to 50 staff.
SIZE OF NGO
8% 8%
16%
11%12%
45%
Less than 5 5-10 10-20 20-50 50-100 More than 100

THE BIG PICTURE SPOTLIGHT ON CSR LEADERS SPOTLIGHT ON HONG KONG,MALAYSIA & SINGAPORE
SPOTLIGHT ON CONSULTANTS CSR PROFESSIONALS IN
ASIASPOTLIGHT ON NGOs
PRIVATE SECTOR ENGAGEMENTRespondents are still most likely to engage with Asia based MNCs at 61% with a small 3% decline this year. This is followed by engagement with domestic companies at 56%. Engagements with SMEs and non-Asia based MNCs saw a decline of 7% to 45% and decline of 5% to 54% respectively.
Other organisations NGOs engage with include governments, education institutions, foundations and social enterprises.
NGOs partner with the private sector on leadership development, volunteering, sponsorship, fundraising, joint-campaigns, reporting, research, training and pro-bono consultancy. Topics include conservation, public health, education, labour, human rights, transparency, women’s empowerment, hygiene and sanitation, climate change mitigation, energy management, water and disaster response.
NGO respondents report that corporates are most involved in providing funds (64%). This is followed by the NGO providing expertise to the corporate and working with corporates through multi-stakeholder initiatives at 61% each.
Other involvement includes working with media partners to raise awareness, profiling issues, mobilising resources, leadership development initiatives, knowledge creation and sharing, government policy advocacy and corporate providing market demand for local enterprises.
NGO respondents reported the following organisations to demonstrate good NGO/private sector engagement practices: Myanmar Centre for Responsible Business, Philippine Business for Social Progress, CDP, Ethical Trading Initiative, Oxfam, UNICEF, CARE, Doctors Without Borders, The Women’s Foundation, CSR Asia, Tech Mahindra Foundation, TATA, Unilever, Nestle, Intel, Siam Cement Group, YTL, Coca-Cola, Credit Suisse, Microsoft and Marks & Spencer.
PRIVATE SECTOR ORGANISATIONS ENGAGED
61% 56% 54% 48% 45% 35%
100%
75%
50%
0%
25%
CORPORATE INVOLVEMENT WITH NGOS
64% 61%
61% 52%
MNCAsia HQ
Domesticcompany
MNCNon-Asia
HQ
Government-linked
company
SME State-ownedenterprise
Corporate providing funds
The NGO providingexpertise to the
corporate
Working with corporate through multi-stake holder
initiatives
Corporate providing in-kind support