who holds what? new information on securities …...72 ecb economic bulletin issue 2 / 2015 who...
TRANSCRIPT

72ECBEconomic BulletinIssue 2 / 2015
who holds what? new inFormation on seCUrities holdingsThe financial crisis of 2008-09 highlighted the need for granular information on holdings of individual securities. This article introduces new statistics – securities holdings statistics – which have been collected by the European System of Central Banks since the beginning of 2014 and significantly help to close the information gap on securities holdings both within the euro area and between the euro area and the rest of the world. In particular, since the data are collected on a security-by-security basis, they provide a vast range of new breakdowns. This article describes the scope, content and coverage of the new statistics. In addition, it illustrates the value added of these new data on the basis of a few specific examples and outlines the future potential uses of the data.
1 introdUCtion
When Lehman Brothers collapsed in September 2008, policy-makers, including central banks, had very limited information about who was exposed to the securities at stake. In particular, mostofthethenavailableofficialstatisticsonlyprovidedaggregatedinformation,therebymakingit difficult to identify exposures of market participants or sectors to a particular issuer or to capture theextentofcontagionthatsuchaneventcouldtrigger.1
This and similar experiences, where a lack of detailed data hindered swift policy action, pointed to the need for highly granular information on securities holdingsandacceleratedthepreparatoryworkof theEuropeanSystemofCentralBanks(ESCB)on thedevelopmentofnewstatistics to help fill this informationgap.2Thiswork resulted in two legal texts3 that provide asoundlegalbasisforthecollectionofacomprehensivedatasetonsecuritiesholdingsfortheeuroarea.Theactualdatacollectionofthenewsecuritiesholdingsstatistics(SHS)startedinearly2014,withthefirstdatareferringtoholdingsattheendofDecember2013.
The rest of this article is organised as follows. Section 2 introduces SHS data collection,includingscope,contentandcoverage.Section3illustratesthepossibleuseofSHSdatabymeansof examples. Finally, Section 4 concludes.
2 the main FeatUres oF seCUrities holdings statistiCs
SHS data have been collected quarterly since the fourth quarter of 2013 and cover the two main types of security: debt securities and equity securities(includinginvestmentfundshares).Themainfeatureofthesedataisthatholdinginformationiscollectedonthelevelofeachindividualsecurity, i.e. security by security.
1 SeeHarford,T.,“Let’shavesomereal-timeeconomics”,Financial Times,7March2014.2 SeeSola, P. andStrobbeF., “Addressing data gaps revealed by the financial crisis:EuropeanCentralBank statistics on holdings of
securities”,IrvingFisherCommitteeonCentralBankStatistics,IFC Bulletin,No.34:ProceedingsoftheIFCConferenceon“Initiativestoaddressdatagapsrevealedbythefinancialcrisis”,BankforInternationalSettlements,Basel,August2010.
3 RegulationoftheEuropeanCentralBankof17October2012concerningstatisticsonholdingsofsecurities(ECB/2012/24)andGuidelineoftheEuropeanCentralBankof22March2013concerningstatisticsonholdingsofsecurities(ECB/2013/7).

73ECB
Economic BulletinIssue 2 / 2015
Who holds what? New information
on securities holdings
articles
2.1 data ColleCtion
The collection of data on securities holdings on a security-by-security basis has gained considerable ground in recent years given its advantages.4Beforetheintroductionofsecurity-by-security data collection, reporting agents were required to aggregate data according to breakdownsdefinedbythestatisticalauthoritybeforereportingthem(the“aggregatemethod”).Thismethod requires, on the one hand, reporting agents to understand statistical codes and tousethemtoaggregatethedata.Ontheotherhand,statisticalcompilershavetoensurethateachreporting agent implements the aggregation and applies the statistical standards in the same(harmonised)way.Additionally,whenever changes are necessary, all reporting agents have toadapttheirsystemsaccordingly.
In security-by-security data collection, the aggregation step is eliminated on the side of the reporting agents.Theagentsonlyhavetoreportafewessentialitems,suchastheInternationalSecuritiesIdentificationNumber(ISIN),whichiswidelyusedinthefinancialmarkets,andthecorrespondingmonetary amounts (positions and/or transactions). The statistical compiler thenuses the ISIN and reference data on securities to calculate the necessary aggregates centrally. Thisinturnensuresaharmonisedtreatmentofthedataofeachreportingagentandthusallowsthe compiler tomanage data quality accurately.Moreover, the availability of highly granulardata enables the calculation of a wide range of breakdowns even retrospectively (whenevernecessary),withoutplacinganadditionalburdenonreportinginstitutions.Whilethecostsbornebyreportingagentsarereduced,thecoststothestatisticalauthorityincreaseduetothegranulardatacollection,extensivedatamanipulationandreferencedatamaintenance.Nevertheless, thenumerousbenefitsmorethanoutweighthecosts.Inparticular,recentadvancesinITsolutions,infrastructure and related communication channels havemade suchwide-scale data collectionconsiderably easier.
2.2 sCope
The SHS project contains two data modules (the SHS Sector and the SHS Group), which differ on account of the granularity of the information on the holder’s side (see Chart 1). TheSHSSectormodule provides aggregate information on the holdings of institutional sectorsresidentinindividualcountries,whiletheSHSGroupmodulecurrentlycontainsinformationontheindividualholdingsofthe25largestbankinggroupswithheadofficesintheeuroarea(i.e.holder-by-holderinformation).
Furthermore, the SHS Sector module encompasses two main distinct sets of data: (i)holdingsofsecuritiesbyinvestorsresidentintheeuroarea,suchashouseholdsinGermanyor monetary financial institutions (MFIs)5inFrance,and(ii)non-residentinvestors’holdingsofeuroareasecuritiesthataredepositedwithaeuroareacustodian,suchasUSinvestors’holdings
4 In the United States, for instance, the collection of Treasury International Capital (TIC) data on foreign holdings of US securitiesandUSholdings of foreign securities relies on thismethod.Formore informationon theTICdata set, see http://www.treasury.gov/resource-center/data-chart-center/tic/Pages/index.aspx.SeveralotherstatisticalseriespublishedbytheECB,suchasbalanceofpaymentsor investmentfundstatistics,alsorelyonthismethod.TheSHSdatabaseis,however, theonlyexampleofanintegratedinternationaldatabasecoveringsecurity-by-securitydataonholdingsofsecurities(i.e.coveringdatacollectedfrommanycountries).
5 Forthepurposesofthisarticle,theMFIsectorcomprisesdeposit-takingcorporationsandmoneymarketfunds,excludingcentralbanks,unlessindicatedotherwise.

74ECBEconomic BulletinIssue 2 / 2015
of German securities deposited in Luxembourg. In addition, most non-euro area EU countries (namelyBulgaria, theCzechRepublic,Denmark,Hungary, Poland andRomania) also collectSHSSectordata.
The magnitudes of the collected holdings are rather substantial, particularly of those in the SHS Sector module. Total holdings by euro area investors amounted to some €23.4 trillion attheendofJune2014,6coveringholdingsofbothsecuritiesissuedbyeuroarearesidents(around€18.3trillion)andthoseissuedbynon-euroarearesidents(around€5.1trillion).Theholdingsbynon-euroareainvestorsreportedbyeuroareacustodiansareofasignificantlysmallermagnitude– around€8.5trillion–andonlyrefertoholdingsofsecuritiesissuedbyeuroarearesidents.Datareported by non-euro area EU countries cover holdings of around €1.2 trillion; the rest of thisarticle,however,focusesonthedatafromeuroareacountries.7
The SHS Group module includes significantly smaller amounts. Itcoversholdings of around €3.2 trillion reported by a limited sample of large banking groups with their head offices inthe euro area (the 25 largest banking groups at the end of the second quarter of 2014). TheSHSGroupmodulecomprises theholdingsofsecuritiesby thewholegroup, includingby thegroup’s subsidiariesandbranches residentoutside theeuroarea.Holdingsof securities issued
6 ThefigurespresentedinthisarticlerefertotheendofJune2014,unlessstatedotherwise.7 Thereisacertainoverlapbetweenbothtypesofdata.ThepartoftheholdingsoftheeuroareasecuritiesreportedbyEUcountriesnot
belongingtotheeuroareacanalsobefoundinthedatacollectedfromtheeuroareacustodians,althoughwithalimitedsectorbreakdowninthelatter.
Chart 1 overview of the two shs modules
(EUr trillion, market values)
SHS module Type of data Magnitude 1)
SHS Sector moduleHoldings by country and sector
of the investor
SHS Group moduleHoldings by individual banking group
(additional level of detail available for some groups, e.g. individual entities)
Euro area investors
Non-euro area investorsReported by euro area custodians
Non-euro area EU investorsReported by some non-euro area
EU countries
Current reporting:25 largest banking groups
with head office in the euro area (includes holdings of subsidiaries and
branches outside the euro area)
Total = 23.4 (of which holdings of non-euro area securities2) = 5.1)
Total = 8.5 (holdings of non-euro area securities2) are not collected)
Total = 1.2 (of which holdings of non-euro area securities2) = 1.1)
Total = 3.2 (of which holdings of non-euro area securities2) = 0.8)
Sources:ECB(SHSSectorandSHSGroup)andECBcalculations.1)SHSSectorthird-partyholdingsbynon-financialinvestorsandholdingsofsecuritieswithoutISINsareexcluded.2) Non-euro area securities refer to securities issued by non-euro area residents.

75ECB
Economic BulletinIssue 2 / 2015
Who holds what? New information
on securities holdings
articles
bybotheuroarearesidents(€2.4trillion)andnon-euroarearesidents(€0.8trillion)arecoveredinthismodule.
It is worth noting that, in many cases, SHS data help to fill long-standing statistical gaps–evenonanaggregatedbasis–withinformationnotpreviouslyavailablefromanyotherdatasource.For instance, the SHS Sectormodule also contains data that refer to holdings by non-financialsectors in other euro area countries reported by euro area custodians (e.g. holdings byGermanhouseholdsdepositedwith,andthusalsoreportedby,custodiansinLuxembourg).Theseholdingsamounttosome€0.4trillion.
2.3 Content
The collection of holdings data on a highly granular, security-by-security level provides the possibility to link SHS data with other databases,notablythosewithreferencedataonindividualsecurities,typicallyusinganISINasthematchingelement.InthecaseofSHSdata,anintegralpartofthedatacompilationisthelinktoinformationfromtheCentralisedSecuritiesDatabase(CSDB)8, jointlyoperatedby theESCB,which is amulti-purposeplatformcurrently containing referenceinformation(suchasprice,issuernameandoutstandingamount)onoversixmillionoutstandingdebtsecurities,equitiesandinvestmentfundshares.
As a result, SHS data enriched by CSDB information contain a high number of attributes, whichcanbefreelycombinedtoderivevariousbreakdownsand/oraggregationsonboththeissuerandholdersides(seeTable1forsomeofthemainattributes).Forinstance,theSHSSectormodulecanbeusedtoobtaininformationonthemarketvalueofholdingsbytheFrenchMFIsectorofdebtsecuritiesmaturinginthreeyearsandissuedbyaspecificnon-financialinstitution.
8 Formoreinformation,seethepublicationentitled“TheCentralised Securities Databaseinbrief”ontheECB’swebsite.
table 1 selected attributes from the shs dataset enriched by CsdB information
SHS data collection CSDB reference dataHolder data Who is the holder?
Holding value How much is it worth?
Security data What is held?
Issuer data Who is the issuer?
SHSSectormodule 1) Market value Security identifier (ISIN) Issuername/code–Sector Nominal value Instrument type Issuer sector–Country Notional flows 3) Price Issuer country
Accrued income Maturity date NACEclassificationMarket capitalisation
SHSGroupmodule 2) Outstanding amount–Individualbankinggroups Currency
Eligibility for Eurosystem operations
1) Information about holders is only available on an aggregate (by institutional sector and/or country) level, i.e. not by individualholder. The main holding sectors available are (i) deposit-taking corporations, (ii) money market funds, (iii) investment funds,(iv) financial vehicle corporations, (v) insurance corporations, (vi) pension funds, (vii) other financial corporations, (viii) generalgovernment,(ix)non-financialcorporations,(x)householdsand(xi)non-profitinstitutionsservinghouseholds.Forholdingsbynon-euroareainvestors,thesectorbreakdownisrestrictedto(i)generalgovernmentandcentralbanksand(ii)otherinvestors.2)Informationavailablebyindividual(group)holder.3)Notional flows refer toestimatedvaluesof transactions (i.e. they reflectchanges inpositionsadjusted forpriceandexchange ratevariation,aswellasforotherchangesinvolumeduetoreclassifications,adjustments,etc.).

76ECBEconomic BulletinIssue 2 / 2015
2.4 Coverage
SHS data are regularly checked against comparable data sources in order to ensure sufficient quality and coverage. In particular, they are compared with other ECB statistics, such as theintegrated euro area financial and non-financial accounts (EAA), MFI balance sheet statistics,insurance corporation and pension fund statistics, investment fund statistics and securities issues statistics, aswell aswith consolidatedbankingdata.Suchcomparisonexercises and subsequentinvestigations provide valuable insights into the reasons for possible discrepancies, includingpossible conceptual and measurement differences.
Box 1 describes in detail the various aspects that can be the source of differences between SHS data and other available statistics on securities holdings.Inparticular,ithighlightsthattheSHSSectordataonholdingsbyeuroareainvestorsareofahigherqualityandcoverage(aswellasbeingmoredetailed) thanthoseonholdingsbynon-euroareainvestorsreportedbyeuroareacustodians.Themainreasonforthisisthattheformerareoftencollectedthroughdirectreportingby theactualholders,whereas the latteronly relyon indirect reportingbyeuroareacustodians,presumablycoveringonlypartofthetotalholdingsbynon-euroarearesidents.
Box 1
diFFerenCes Between shs data and other seCUrities statistiCs
A number of features of SHS data have to be taken into account when reconciling the main aggregates derived from these data with other available (aggregate) statistics on securities holdings. SHS data collection focuses on securities about which detailed information can beprovided inahighlystandardisedmanner, i.e.debtsecurities, investmentfundsharesand listedshares(unlistedsharesarenotcovered).Furthermore,holdingsofsecuritieswithoutISINsareonlycollectedinsomecountriesandhavenot,atthetimeofwriting,beenincorporatedintheregularSHSaggregates(reporteddataamounttoalmost€1trillion,mainlyissuedbyinvestmentfunds).
More importantly, one of the main aspects that influence the coverage and quality of SHS data is the collection method, i.e.whether thedataarecollected throughdirect reportingbytheactualinvestorsorindirectlythroughcustodiansthathold(forsafekeeping)thesecuritiesonbehalfoftheactualinvestors.Theindirect,custodianmethodallowsthecollectionofdatafromarelativelylownumberofspecialisedreportingagents.ThemaindisadvantageisthatsecuritiesheldbyacustodianthatisnotsubjecttoSHSreporting1 are not covered. Moreover, a custodian may not know the final investor and thus the data are likely to suffer from “custodial bias”(especially if thecustodian’scustomersare institutions transactingonbehalfof a thirdparty/customer),affectingthegeographicalandsectorbreakdownontheinvestorside.
The custodian method is typically used if the investor is located outside the respective jurisdiction or if the costs to collect the data directly from the investors are too high (e.g. forholdingsbyhouseholdsorbysmallnon-financialcorporations). In thecaseofSHS,
1 Custodiansnotresidentintheeuroarea,forinstance,giventhattheECB’sregulationscanonlybeappliedtoresidentsoftheeuroarea.

77ECB
Economic BulletinIssue 2 / 2015
Who holds what? New information
on securities holdings
articles
The SHS Sector module covers around 83% of the total outstanding amount of securities issued by euro area residents (see Table 2). Putdifferently, theholdingsectorandcountryareknownforaround€27trillionoftheamountoutstandingof€32trillionobtainedfromtheECB’s EAAdata,whichmeasureboththeholdingsandoutstandingissuancebyalleuroareasectorsatanaggregatedlevelandthusprovideacomprehensivebenchmarkfortheSHSSectordata(seealsoBox2). Thecoverageofdebtsecurities(92%)isfoundtobehigherthanthatofshares(73%).
A more detailed comparison can be carried out with the EAA data on holdings by each sector in the euro area (seeTable3).Overall,theSHSSectordatacoveraround83%oftheaggregatesintheEAAdata,buttherearedifferencesacrosstheholdingsectors.Forinstance,SHScoveragetendstoreachnearly90%fortheMFIsectorandforotherfinancialintermediariesandauxiliaries,whichinmostcasesaresubjecttodirectreporting.Bycontrast,coverageliesbelow80%foreuroareanon-financialinvestors,whicharegenerallynotsubjecttodirectreporting.
SHS coverage of holdings by non-euro area investors reported by euro area custodians is also relatively high,around81%,comparedwithliabilitiesfromtheEAAdata,whichamounttosome€10.6 trillion.Coverage ishigh fordebt securitiesandquotedsharesbut rather lowforinvestmentfundsshares.Inadditiontothecaveatsofindirectreportingbycustodians(seeBox1for moredetails), thequalityofSHSdataonholdingsbynon-euroarea investors isstill improving,giventhatthecollectionofthesedatahasonlyrecentlystartedintheeuroarea.9
9 SHSSectorholdingsbydomestic investorshavebeencollectedbytheESCBonavoluntaryand“best-effort”basissinceearly2009.Moreover,evenpriorto2009,someeuroareacountrieshadnationalcollectionsystemsforsecuritiesholdingsbydomesticinvestorsinplace.
custodialreportingisusedtocollectinformationonholdingsbynon-euroareainvestorsofeuroareasecurities(e.g.USholdingsofeuroareagovernmentdebt)andonholdingsbynon-financialsectorsintheeuroarea(e.g.holdingsbyGermanhouseholds).
Another conceptual difference is caused by the treatment of derogations.While the leastrelevant reporting agents are subject to derogations in almost all official statistics, the finalaggregatesusuallyaccountfortheeffectofthederogationsbyestimatingthem.However,thisiscurrentlynotthecaseforSHSdataas,owingtothefocusonsecurity-by-securitydata,allSHSaggregatesarebuiltinsuchawaythattheycanbedisaggregateduptotheindividualholding.
Other differences may exist, including valuation and measurement differences, depending on the selected benchmark data.For instance,while theSHSholdingsareavailableinbothmarket and nominal values, the other data sources may rely on a combination of differentvaluationmethodsappliedtodifferentsub-setsoftheoverallholdings.
table 2 shs sector holdings of securities issued by euro area residents at the end of the second quarter of 2014(EUr trillion, market values)
Debt securities Shares Total
Amountoutstandingofsecuritiesissuedintheeuroarea(EAA) 17.7(100%) 14.5(100%) 32.2(100%)OfwhichcoveredbySHSSectorholdings 16.2(92%) 10.7(73%) 26.9(83%)
Held by euro area investors 10.6 7.7 18.3Held by non-euro area investors 5.6 2.9 8.5
Sources:ECB(SHSSectorandEAA)andECBcalculations.

78ECBEconomic BulletinIssue 2 / 2015
3 some examples oF how seCUrities holdings statistiCs data Can Be Used
Given the richness of SHS data, it is not feasible to present a comprehensive overview of their possible uses. Nevertheless,thefollowingcasestudiesatleastattempttogiveaflavourofpotentialuses,suchasformonetarypolicy,financialstabilityandfinancialintegration.Box2alsoexplainsthebenefitthatthenewSHSdatamaybringtootherstatistics,usingtheexampleofthefutureuseoftheSHSSectordatatoenhancetheEAA.
3.1 Case stUdy 1: analyses oF investment patterns By eUro area seCtor
SHS data can be used to investigate the differences in investment patterns by euro area sector by analysing, for example, the residual maturity profile of sectors’ holdings of debt securities (see Chart 2). Thedatahighlightthegreatershareofholdingsof short-term securities in the portfolios ofnon-financial sectors (i.e. households, non-financial corporations and general government). Conversely,holdingsby insurancecorporationsand pension funds include the lowest share ofsecurities with a short maturity. The profileof holdings by MFIs may reflect the differentfunctions of that sector (e.g. investment inshort-termmoneymarketfundsandcommercialpaper on the one hand, and, on the other,market-making with a need for holdings of abroad maturity spectrum and the underwritingof securities issuances as a part of investment banking,whichcan lead to thewarehousingoflong-term debt).
table 3 securities holdings by euro area sectors at the end of the second quarter of 2014
(EUr billion, market values)
SHS Sector EAA SHS coverage (in percentages)
Euro area financial sectors 18,316 21,700 84Monetary financial institutions 6,152 6,914 89Otherfinancialintermediariesandauxiliaries 7,488 8,705 86Insurance corporations and pension funds 4,676 6,081 77
Euro area non-financial sectors 5,036 6,408 79Non-financial corporations 1,434 1,955 73General government 746 982 76Households 2,856 3,471 82
Total 23,352 28,108 83
Sources:ECB(SHSSectorandEAA)andECBcalculations.
Chart 2 maturity profile of holdings of debt securities by euro area sector
(percentageoftotalholdingsattheendofthesecondquarterof 2014)
0
5
10
15
20
25
30
35
0
5
10
15
20
25
30
35
<0 2 4 6 8 10 12 14 16 18 20
monetary financial institutionsinsurance corporations and pension fundsother financial institutionsgeneral governmentnon-financial corporationshouseholds and NPISH
x-axis: residual maturity in years
Sources:ECB(SHSSector)andECBcalculations.Notes: Negative residual maturity represents holdings ofsecurities past their scheduled maturity date following thebankruptcyoftheissuer.NPISHstandsfornon-profitinstitutionsservinghouseholds.

79ECB
Economic BulletinIssue 2 / 2015
Who holds what? New information
on securities holdings
articles
Knowing the exact maturity profile of securities holdings can prove useful when, inter alia, analysing the balance sheet channel of the monetary transmission mechanism, monitoring vulnerabilities related to the liquidity positions on the side of the issuers and measuring mismatches in the maturity of assets and liabilities. Moreover, changes in the holdings ofvarioussectorsarerelevantinthecontextofassessingnon-standardmonetarypolicymeasureslikesecurities purchasing programmes. In particular, such information helps to assess the respectiveannouncement andbalance sheet effects and togaugepotential crowding-out effects. If needed,moregranulardataarealsoavailable,bothontheinvestorside(acountry-sectorbreakdown)andontheissuerside(uptotheleveloftheindividualissuer/security).
3.2 Case stUdy 2: interConneCtedness oF the main eUro area seCtors
One of the benefits of SHS data is that they provide information on securities holdings by main euro area sector, with the same sector on the issuer side.As this informationwas notpreviouslyavailablefromotherdatasourcesforalleuroareasectors,SHSdatacanbeespeciallyuseful from the perspective of financial system stability in the euro area. In particular, the newinformationallowsabetterassessmentoftheinterconnectednessofsectors,thelevelofsystemicriskandthestrengthofpossiblecontagionchannels(bothdirectandindirect)inthesystem.
Direct exposures owing to securities issued by one euro area sector being held by another sector differ significantly, according to the type of security. Thenotablefeatureoftheeuroareadebtmarket(seeChart3,panela)isthatallthreefinancialsectorsaresignificantlyexposedtoasovereigncreditrisk,withthelargestchunkofgovernmentdebtsecuritiesheldbytheMFIsector.Bycontrast, theeuroareamarket for investment fund shares isdominatedby the investmentofhouseholdsandinsurancecorporations,aswellaspensionfunds,insharesissuedbyotherfinancialinstitutions(seeChart3,panelc).Inturn,otherfinancialinstitutionstendtoinvestheavilyinlistedsharesissuedbynon-financialcorporations(seeChart3,panelb).However,itisalsothecasethat
Chart 3 interconnectedness of euro area sectors at the end of the second quarter of 2014
(EUr trillion)
a) Debt securities b) Listed shares c) Investment fund shares
ICPFs (2.4)
general government (5.0)households (0.6)
NFCs (1.0)
OFIs (4.1)MFIs (7.9)
ICPFs(0.2)
general government (0.2)households (0.7)
NFCs (3.3)
OFIs (1.2)
MFIs (0.6)
ICPFs (1.5)
general government (0.2)households (1.3)
NFCs (0.3)
OFIs (5.3)
MFIs (0.6 )
Sources:ECB(SHSSector)andECBcalculations.Notes:Eachnoderepresentsoneeuroareasector(NFCs=non-financialcorporations,MFIs=monetaryfinancialinstitutions,OFIs=otherfinancialinstitutions,ICPFs=insurancecorporationsandpensionfunds,andhouseholds=householdsandnon-profitinstitutionsservinghouseholds).Thearrowsshowtheholdingsbythecorrespondingsectorofsecurities issuedbyanothereuroareasector, their thicknessbeingproportionaltothevalueoftheseholdings.Thesizeofthenodesisproportionaltothesumof(i)themarketvalueofholdingsbytherespectivesectorofsecuritiesissuedbyeuroarearesidentsand(ii)thevalueofsecuritiesissuedbytherespectivesectorandheldbyeuroareainvestors.Thissumisalsoreportedinbrackets(EURtrillion).

80ECBEconomic BulletinIssue 2 / 2015
otherfinancialinstitutionspartiallychanneltheinitialinvestmentininvestmentfundsharesfromothersectors(e.g.fromhouseholds)togovernmentdebtsecurities.Infact,theshareofgovernmentdebtholdingsintotalholdingsbyinvestmentfundsisaround47%.
3.3 Case stUdy 3: Cross-Border seCUrities holdings By eUro area and non-eUro area investors
Besides the detailed information on intra-euro area holdings, SHS data contain useful information on securities holdings between the euro area and the rest of the world. In this way, they contribute to a better understanding of the degree and nature of financial integration worldwide.10
10 TheuseofSHSdataforthedevelopmentoffinancialintegrationindicatorsisalsoillustratedinFacheRousová,L.andRodríguezCaloca,A., “TheuseofSecuritiesHoldingsStatistics(SHS)fordesigningneweuroareafinancialintegrationindicators”,Irving Fisher Committee on Central-Bank Statistics: Proceedings of the Seventh IFC Conference, Basel, September 2014.
Chart 4 share of debt securities in total securities holdings by each country/region at the end of the second quarter of 2014(percentages)
no holdings0 - 2020 - 4040 - 60
60 - 8080 - 100euro area
a) holdings of euro area securities by non-euro area investors
b) holdings of non-euro area securities by euro area investors
Sources:ECB(SHSSector)andECBcalculations.Notes:Owing to confidentiality restrictions, thedata of a fewcountries are not shown (selected countrieswithholdingsof less than€1billionorcountrieswithaverysmallgeographicalarea)andsomecountrieswereaggregatedintoregions.Inpanela),thesixaggregatedregions comprise the following countries: (i) China, Macau and Japan; (ii) Albania, Croatia and Macedonia; (iii) Turkmenistan,KazakhstanandUzbekistan;(iv)SaudiArabia,Oman,Qatar,theUnitedArabEmiratesandYemen;(v)Libya,TunisiaandAlgeria;and(vi)Angola,NamibiaandCongo.Inpanelb),theonlyaggregatedregionconsistsofCostaRica,Ecuador,PanamaandVenezuela.
81ECB
Economic BulletinIssue 2 / 2015
Who holds what? New information
on securities holdings
articles
Chart 4 shows the difference between holdings of euro area securities by non-euro area investors (see Chart 4, panel a) and holdings of non-euro area securities by euro area investors (see Chart 4, panel b).Firstofall,whenonlydistinguishingbetweencountriesshowninwhite(i.e.noholdings)andthoseshowninvaryingshadesofblue(positiveholdings),thechartshowsthatinvestmentintheeuroareaisaworldwidephenomenon,asnearlyeverycountryintheworldholdssomeeuroareasecurities(seeChart4,panela).Thisisnotthecaseforeuroareainvestmentin securities issued by the rest of theworld (seeChart 4, panel b). In particular, someAfricancountriesdonotseemtoreceiveanysecuritiesinvestmentfromtheeuroarea.
Second, the chart highlights that non-euro area investors from most countries, particularly the Asian ones, invest substantially more in euro area debt securities than in euro area shares(theshadeofbluereflects theratioofdebtsecurities in total investment, i.e. thedarker thecolour, themore investment in debt securities as opposed to equities). A similar pattern is not found for euro area investmentabroad,sincetheratioofdebtsecuritiesintotalinvestmentismuchmorebalanced.
3.4 Case stUdy 4: holdings oF deBt seCUrities issUed By eUro area governments
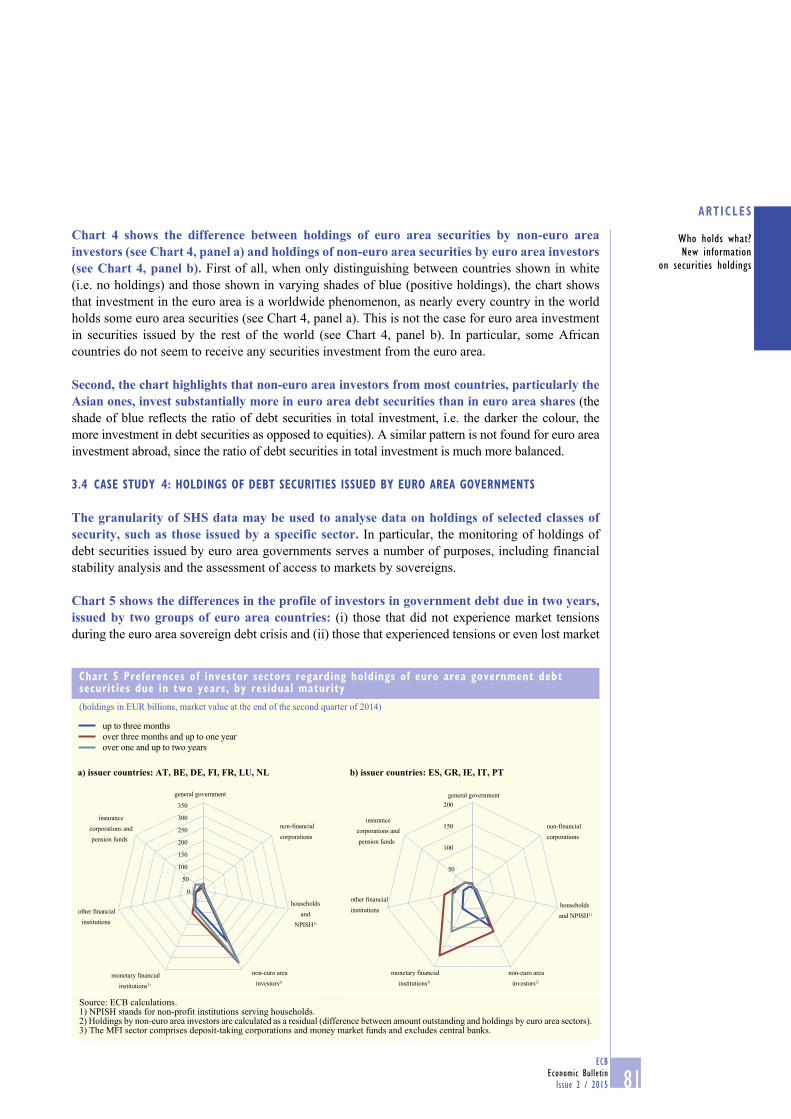
The granularity of SHS data may be used to analyse data on holdings of selected classes of security, such as those issued by a specific sector. Inparticular, themonitoringofholdingsofdebt securities issued by euro area governments serves a number of purposes, including financial stabilityanalysisandtheassessmentofaccesstomarketsbysovereigns.
Chart 5 shows the differences in the profile of investors in government debt due in two years, issued by two groups of euro area countries: (i) those thatdidnot experiencemarket tensionsduringtheeuroareasovereigndebtcrisisand(ii)thosethatexperiencedtensionsorevenlostmarket
Chart 5 preferences of investor sectors regarding holdings of euro area government debt securities due in two years, by residual maturity(holdingsinEURbillions,marketvalueattheendofthesecondquarterof2014)
up to three monthsover three months and up to one yearover one and up to two years
a) issuer countries: AT, BE, DE, FI, FR, LU, NL b) issuer countries: ES, GR, IE, IT, PT
0
50
100
150
200
250
300
350
general government
non-financialcorporations
households and
NPISH1)
non-euro areainvestors2)
monetary financialinstitutions3)
other financialinstitutions
insurancecorporations andpension funds
0
50
100
150
200general government
non-financialcorporations
households and NPISH1)
non-euro areainvestors2)
monetary financialinstitutions3)
other financialinstitutions
insurancecorporations andpension funds
Source:ECBcalculations.1)NPISHstandsfornon-profitinstitutionsservinghouseholds.2)Holdingsbynon-euroareainvestorsarecalculatedasaresidual(differencebetweenamountoutstandingandholdingsbyeuroareasectors).3)TheMFIsectorcomprisesdeposit-takingcorporationsandmoneymarketfundsandexcludescentralbanks.

82ECBEconomic BulletinIssue 2 / 2015
access.Theshareofholdingsbynon-euroareainvestorsissignificantlylargerforsecuritiesissuedbytheformergroupofcountries,whilethelattergroupreliesmuchmoreonfundsfromtheeuroareaMFIsector.Thisisparticularlystrikingfordebtsecuritieswithmaturitiesofoverthreemonths.
SHS Sector data also indicate that a disproportionally large share of government debt issued by the countries that experienced market tensions is held by the domestic MFI sector.11 For instance, in the case of government debt due in two years, the domesticMFI sector holdsaround48%ofthetotalamountoutstanding,comparedwitharound34%thereofintheothergroupof countries.Thishighlightsthestronginterdependencebetweenthesesovereignsandtheirdomestic banking sectors.
3.5 Case stUdy 5: the eFFeCt oF interest rate Changes on the market valUe oF government deBt holdings
The aim of this case study is to calculate the (accounting) effect of interest rate changes on the market value of the portfolio of actual bond holdings. Quantifying thiseffect is relevant both from the monetarypolicy standpoint, particularly as an element of the balance sheet channel of the monetarytransmission mechanism (see, for instance,Bernanke and Gertler, 1995, and Constâncio,2014),12 and from the financial stabilityperspective,asameasureofthevulnerabilityofthemarketvalueofholdingstointerestraterisk.
To calculate the effect, information on the modified duration of each security is needed.13AsitisnotdirectlyavailableinSHSdata, it has to be taken from another source,suchastheiBoxxdatabase.Subsequently,thisinformation is matched to the SHS holdingsusing ISINs as identifiers. Given the scarcityof the data on modified duration, this studyfocuses on a portfolio of government debt securities issued by selected euro area countries (Spain,Ireland,AustriaandtheNetherlands)andheldbyeuroareasectors.
11 SeeFacheRousová,L.andRodríguezCaloca,A.,op.cit.12 See,forinstance,Bernanke,B.andGertler,M.,“InsidetheBlackBox:TheCreditChannelofMonetaryPolicyTransmission”,Journal
of Economic Perspectives,AmericanEconomicAssociation,Vol.9(4),pp.27-48,Fall,1995andConstâncio,V.,“AnewphaseoftheECB’smonetarypolicy”,ECB workshop on non-standard monetary policy measures, Frankfurt am Main, October 2014.
13 Modifieddurationmeasuresthepercentagechangeinthebondpriceinresponsetoa100-basispointchangeinthereferenceinterestrate(i.e.thesemi-elasticityofabondpricetotheinterestrate).Inparticular,itallowsacomparisonofthepropertiesofbondswithdifferentmaturitiesandwithorwithoutcoupons.
Chart 6 percentage change in market value of selected euro area government debt securities after a 100-basis point decline in the reference interest rate, by euro area holder sector(percentages, second quarter of 2014)
general government
non-financial corporations
households and NPISH
monetary financial institutions
other financial institutions
insurance corporations and
pension funds
0123456789
10
IrelandNetherlands
AustriaSpain
Sources:iBoxxandECBcalculations.Notes: NPISH stands for non-profit institutions servinghouseholds. The chart reflects theweightedmodified durationof the portfolio of specific government debt securities held bydifferent euro area institutional sectors.

83ECB
Economic BulletinIssue 2 / 2015
Who holds what? New information
on securities holdings
articles
The calculations imply that, for holdings by euro area financial investors, the weighted modified duration of securities issued by Spain and Ireland (both affected by the sovereign debt crisis) is lower than for securities issued by Austria and the Netherlands. More precisely, theresultspresentedinChart6meanthat,followingadecreaseof1percentagepoint(100basispoints) inthereferenceinterestrate,14 themarketvalueof theholdingsofIrishgovernmentdebtbyeuroareaotherfinancialinstitutionswouldincreasebyapproximately6%.Bythesametoken,thecorrespondingincreaseinthemarketvalueofholdingsofAustriangovernmentdebtwouldbesomewhathigher,ataround8%.
14 Moreprecisely,giventhattheholdingscoversecuritieswithdifferentmaturities,thescenarioconsideredisaparallelshiftintheyieldcurve.
Box 2
Use oF shs For the enhanCement oF the integrated eUro area FinanCial and non-FinanCial aCCoUnts By institUtional seCtor
The integrated euro area financial and non-financial accounts (EAA), published quarterly by the ECB since June 20071, provide a comprehensive overview of the economic and financial transactions by all institutional sectors in the euro area.Sectoralbalancesheets,includingaggregateinformationontheholdingsofsecuritiesandthetotalamountsoutstandingof securities issued, are also available from the accounts. When available with sufficientcounterparty detail, the financial accounts provide the links between the holders of financialassetsandtheissuersofthoseassets.Thus,thenewstatisticaldataontheholdingsofsecuritiesareavaluablesourceofinformationthatwillbeusedtoenhancetheEAA.
In the financial accounts, “who-to-whom” data refer to financial transactions and/or positions for which both the creditor and debtor sectors can be simultaneously identified and presented in a fully consistent manner, i.e. without double-counting or gaps.Aschematicoverviewofawho-to-whompresentationcanbefound in the tablebelow.The tableshows thefinancial claims that the sectors in the rowshave against the sectors in the columns.Thus, forloans,thecellcorrespondingtothethirdrowandthesecondcolumn(markedwithan“X”)wouldshowlendingintheformofloansfromthefinancialsectortothenon-financialcorporationssector.Who-to-whomdataserveamultiplicityofpurposes,suchasriskanalysisfromamacro-prudential
1 For the EAA publication, see, for example, the Report section of the ECB’s Statistical Data Warehouse, which also includes who-to-whomtablesfordepositsandloans(http://sdw.ecb.europa.eu/reports.do?node=1000002340).
a who-to-whom presentation of the financial accounts for a financial instrument
Debtor sectorHouseholds Non-financial
corporationsFinancial
corporationsGovernment Rest of the
world
Creditor sector
HouseholdsNon-financial corporationsFinancial corporations XGovernmentRest of the world

84ECBEconomic BulletinIssue 2 / 2015
4 ConClUsions
This article has introduced the new quarterly security-by-security data on securities holdings. Thisnewdatacollectionsignificantlyhelpstoclosepreviouslyexistingdatagapsonholdingsofsecuritiesandthussubstantiallyimprovestheinformationavailableforpolicydecision-makingintheeuroarea.
The granularity and comprehensiveness of the data mean they can be used for a wide range of purposes, includinginthemonetarypolicyandfinancialstabilityareas,aswellasinmarketandfinancialintegrationanalyses.Boththeregularmonitoringofmarketconditionsandadhocstudiesonvarioustopicsareexpectedtobenefitfromtheavailabilityofthesedatafromnowon.
Selected aggregates derived from the SHS data will also be made available for public use in theECB’sStatisticalDataWarehouse.15Theywill includeholdingsbyeuroarea investorsofsecuritiesissuedbyEUcountriesandothermainissuingcountries.
Although the new SHS data are already a significant improvement on the information available on securities holdings, further enhancements are envisaged.Forinstance,theimplementationoftherecentECBregulationoninsurancestatistics(ECB/2014/50)willleadtoimprovementsinSHSdataqualityregardingholdingsbytheinsurancecorporationssector,asmoredatawillbereportedby the insurance corporations themselves rather thancollected throughcustodians.Furthermore,given the new supervisory function assumed by the ECB, further extensions of SHS are underconsideration.
15 TheStatisticalDataWarehousecanbeaccessedathttp://sdw.ecb.europa.eu
perspective,amorerefinedanalysisofthemonetarytransmissionmechanism(e.g.byfocusingonthesourcesoffundingforaspecificsector)andtheestimationofinterestflowsbetweensectors.
The compilation of the financial accounts on a who-to-whom basis requires primary sources containing information on the institutional sector of the counterparty,whichareoften difficult to obtain for all sectors of the economy.A fullwho-to-whom presentation oftheEAAhasbeencompiledandpublishedsinceOctober2010forloansanddeposits,astheirlimited tradability makes it easier to obtain counterparty information from primary data sources.
An extension of the who-to-whom coverage to all marketable instruments, namely debt securities, quoted shares and investment fund shares, will now be possible thanks to the detailed information contained in the SHS.2Asaresult,amuchlargerproportionofallassetsandliabilitiesofthemainsectorsintheEAAwillbecomeavailableonawho-to-whombasis.Inturn,thisextensionoftheEAAwillalsohelpusersoftheSHSwhowishtointerpretaggregatefigures within a comprehensive framework, by encompassing all forms of indebtednesstogetherwith theunderlyingfinancialandnon-financial flows.Theseenhancementsrepresenta significant improvement in the availability of statistics formonetary policy purposes. It isenvisagedthatthefirst publication of the EAA with extended who-to-whom coverage will take place in early 2016.
2 See alsoLavrador, I., Peronaci,R. andSilva,N., “Security-by-securitydataonholdingsof securities: the importance for nationaland euro area accounts”, IrvingFisherCommitteeonCentralBankStatistics, IFC Bulletin,No. 36:Proceedingsof theSixth IFCConferenceon“Statisticalissuesandactivitiesinachangingenvironment”,BankforInternationalSettlements,Basel,August2012.