who gains and who loses from unilateral and concerted ...€¦ · we illustrate the practical...
TRANSCRIPT

Asia Pacific Schoolof Economics and Management
WORKING PAPERS
development issues
W ho gains and who losesfrom unilateral andconcerted tradeliberalisation?
Yongzheng Yang, RonDuncan, and DavidVines
2000-3
Asia Pacific Press at theAUSTRALIAN NATIONAL UNIVERSITY
http://ncdsnet.anu.edu.au
Who gains and who loses from unilateral and concerted trade liberalisation?, DI00-3 2© Asia Pacific Press 2000
Abbreviations
APEC Asia Pacific Economic Cooperation
ASEAN Association of Southeast Asian Nations
CAP Common Agricultural Policy
CDE constant difference of elasticities
EU European Union
GTAP Global Trade Analysis Project
MFA Multi-fibre Arrangement
MFN most favoured nation
NIE newly industrialised economy
TOT terms of trade
VER Voluntary Export Restraint
© Asia Pacific Press 2000
This work is copyright. Apart from those uses which may be permitted under theCopyright Act 1968 as amended, no part may be reproduced by any process withoutwritten permission from the publisher.
The contribution of the Australian Agency for International Development (AusAID) to thisseries is gratefully acknowledged. The opinions contained in the series are those of theauthors, and not necessarily of the National Centre for Development Studies or ofAusAID.
ISSN 1441–984X
ISBN 0 7315 3630 4
Acknowledgments
We would like to thank Tom Hertel and Robert McDougall for making the GTAP modelavailable for this study and for their helpful discussions of the research leading to thispaper. Thanks are also due to Rod Tyers, Simon Grant, Ben Smith, Sherman Robinson,Neil Vousden and Tony Lawson for their helpful comments.
Yongzheng Yang is Senior Lecturer at the National Centre for Development Studies, AsiaPacific School of Economics and Management, The Australian National University.
Ron Duncan is Professor of Economics at the National Centre for Development Studies,Asia Pacific School of Economics and Management, The Australian National University.
David Vines is Fellow in Economics at Balliol College, Oxford.
Who gains and who loses from unilateral and concerted trade liberalisation?, DI00-3 3© Asia Pacific Press 2000
Abstract
This paper presents an empirical study of trade liberalisation. It focuses on the terms oftrade deterioration which results from unilateral liberalisation, and on the extent to whichthe APEC strategy of concerted unilateral liberalisation can offset this source of welfareloss. Using the GTAP computable general equilibrium model, it is shown how the welfareeffects of unilateral and concerted liberalisation depend on country size, protectionstructure and commodity composition of trade. This is done by examining tradeliberalisation from the perspective of four countries/regions with distinctivecharacteristics: Australasia, Japan, ASEAN and North America.
Introduction: unilateral and concerted trade liberalisation
This paper presents an empirical study of trade liberalisation. We focus on the terms oftrade deterioration which results from unilateral liberalisation, and on the extent to whichthe APEC strategy of concerted unilateral liberalisation can solve this problem. Using theGTAP computable general equilibrium model, we show how the welfare effects ofunilateral and concerted liberalisation depend on country size, protection structure, andcommodity composition of trade. We do this by examining trade liberalisation from theperspective of four countries/regions with distinctive characteristics: Australasia, Japan,ASEAN and North America. Our aim is both to obtain detailed quantification and to seewhat general features emerge.
There are two sets of issues. First, when a region unilaterally liberalises it experiencesefficiency gains—output increases in sectors where, prior to liberalisation, marginalvaluation was greater than marginal cost. By increasing the region’s demand for importsand increasing its supply of exports, however, liberalisation worsens the region’s terms oftrade. Because of this terms of trade loss, the overall gains from unilateral liberalisationare less than the efficiency gains. Indeed, unilateral liberalisation may not be welfare-increasing.
Second, when other regions liberalise at the same time as the first region, demands forthe first region’s exports will normally increase, mitigating its terms of trade loss. Thisidea has underpinned the Asia Pacific Economic Cooperation (APEC) process which haspromoted a new form of regional trade liberalisation (Bergsten 1997; Drysdale and Vines1998; Garnaut 1996). The objective of APEC is to promote sub-global trade liberalisation,without creating a regional preferential free trade area. Trade is to be liberalised butliberalisations are to be based on the most favoured nation (MFN) principle, so that thereis no preference and thus no trade diversion. The idea underlying the APEC approach is topromote concerted unilateral MFN trade liberalisation with a group of countries that islarge enough so that participants can avoid the terms of trade losses associated withunilateral liberalisation.

Who gains and who loses from unilateral and concerted trade liberalisation?, DI00-3 4© Asia Pacific Press 2000
We would expect the welfare effects of both unilateral and concerted liberalisation tobe influenced by regional characteristics. The extent to which the terms of trade deterioratefollowing unilateral liberalisation will be larger the lower the elasticity of demand forimports and the lower the elasticity of supply of imports. These elasticities will depend oncommodity type; primary commodity exporters will generally face lower elasticities thanexporters of manufactures. The terms of trade loss will also depend on whether the regionis large, and on the extent to which its exports are concentrated in markets in which it is asignificant supplier.
Similarly, the extent to which concerted liberalisation will mitigate terms of trade lossfrom unilateral liberalisation will depend on a number of factors. Clearly, size will beimportant; small partners in concerted liberalisation will not be able to undo negativeterms of trade effects. The nearness of partners will also matter; this may be a reason forgeographically-based trade initiatives. Trade structures will also be crucial. Liberalisationby another region with a complementary trade structure will improve the region’s terms oftrade by increasing the demand for its exports, but liberalisation by another region with asimilar trade structure will lead to increased competition in the first region’s export andimport markets, and so to a further worsening of its terms of trade.
We illustrate the practical importance of these different factors by investigatingliberalisation from the perspective of four regions with very different characteristics.Australasia is a small and primarily natural resource exporting region; Japan is a largemanufacturing region; ASEAN is a developing region with heavy concentration in labour-intensive exports; and North America is a large, mainly high-tech and services exportingregion. We perform a series of experiments in each of which we compute the welfareeffects of unilateral trade liberalisation by the initiating region, and then let other regionsprogressively join the trade liberalisation until global free trade is accomplished.
We are able to use a welfare decomposition technique in the GTAP model whichseparates the welfare effects of trade liberalisation into two parts. Efficiency effects arethose which would result if the terms of trade were to remain constant, and theconsequential terms of trade effects redistribute these efficiency effects amongst countries.The redistribution of efficiency gains occurs through changes in the price of exportsrelative to those of imports. Whether a region experiences a terms of trade improvement ordeterioration depends on the regional characteristics outlined earlier.
Welfare decomposition and model closure
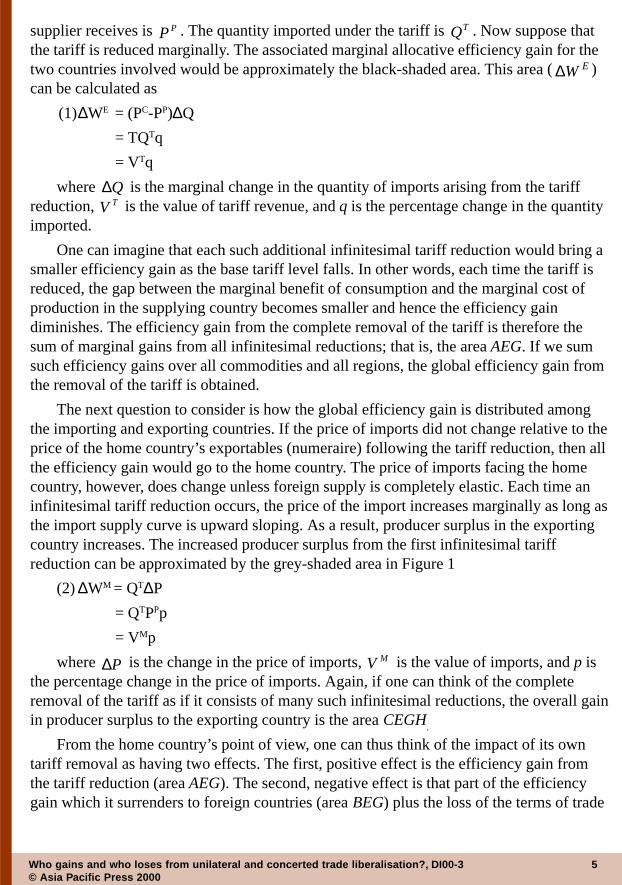
The allocative efficiency and terms of trade effects of trade liberalisation can be illustratedfor the liberalising country in Figure 1. D is the demand for the imports of a product froma particular source of supply, and S is the supply of that product. Let us use a tariffreduction as an example. (The impact of other trade reforms can be similarly illustrated.)Suppose that the initial tariff is T dollars per unit of imports. With this tariff, the pricefacing consumers in the home (importing) country is CP , and the price the overseas
Who gains and who loses from unilateral and concerted trade liberalisation?, DI00-3 5© Asia Pacific Press 2000
supplier receives is PP . The quantity imported under the tariff is TQ . Now suppose thatthe tariff is reduced marginally. The associated marginal allocative efficiency gain for thetwo countries involved would be approximately the black-shaded area. This area (EW∆ )can be calculated as
(1)∆WE = (PC-PP)∆Q
= TQTq
= VTq
where Q∆ is the marginal change in the quantity of imports arising from the tariffreduction, TV is the value of tariff revenue, and q is the percentage change in the quantityimported.
One can imagine that each such additional infinitesimal tariff reduction would bring asmaller efficiency gain as the base tariff level falls. In other words, each time the tariff isreduced, the gap between the marginal benefit of consumption and the marginal cost ofproduction in the supplying country becomes smaller and hence the efficiency gaindiminishes. The efficiency gain from the complete removal of the tariff is therefore thesum of marginal gains from all infinitesimal reductions; that is, the area AEG. If we sumsuch efficiency gains over all commodities and all regions, the global efficiency gain fromthe removal of the tariff is obtained.
The next question to consider is how the global efficiency gain is distributed amongthe importing and exporting countries. If the price of imports did not change relative to theprice of the home country’s exportables (numeraire) following the tariff reduction, then allthe efficiency gain would go to the home country. The price of imports facing the homecountry, however, does change unless foreign supply is completely elastic. Each time aninfinitesimal tariff reduction occurs, the price of the import increases marginally as long asthe import supply curve is upward sloping. As a result, producer surplus in the exportingcountry increases. The increased producer surplus from the first infinitesimal tariffreduction can be approximated by the grey-shaded area in Figure 1
(2)∆WM = QT∆P
= QTPPp
= VMp
where P∆ is the change in the price of imports, MV is the value of imports, and p isthe percentage change in the price of imports. Again, if one can think of the completeremoval of the tariff as if it consists of many such infinitesimal reductions, the overall gainin producer surplus to the exporting country is the area CEGH
.
From the home country’s point of view, one can thus think of the impact of its owntariff removal as having two effects. The first, positive effect is the efficiency gain fromthe tariff reduction (area AEG). The second, negative effect is that part of the efficiencygain which it surrenders to foreign countries (area BEG) plus the loss of the terms of trade

Who gains and who loses from unilateral and concerted trade liberalisation?, DI00-3 6© Asia Pacific Press 2000
gain which it extracted from the exporting country through the tariff (CBGH). The netresult of these two effects is that the home country gains area AEB and loses area CBGH.The home country gains from its own tariff removal only if area AEB is greater than areaCBGH.
The rest of the world is unambiguously better off by area CEGH. Part of the increasein welfare comes from the transfer due to the terms of trade improvement (CBGH), andpart comes from its share in the overall efficiency gain (AEG).
In unilateral liberalisation, these effects are all that happen. For the home country thetriangular area AEB may not be larger than the rectangular area CBGH unless the importsupply curve is very elastic. It is therefore possible that the liberalising country loses fromunilateral liberalisation if it is a large economy, that is, if it faces an upward-sloping importsupply curve.
In concerted liberalisation, the home country is also an exporter into partner countriesand so benefits there from the equivalent of area CEGH in its export markets. Thepotential loss from being a ‘home’ country can thus be offset by the gain fromliberalisations in ‘partner’ countries which occur at the same time. The greater the increasein the demand for each other’s exports (which implies greater complementarity amongparticipating countries), the more likely it is that concerted liberalisation will be mutuallybeneficial, thus overcoming the potential problem of prisoners’ dilemma arising fromunilateral liberalisation.
In order to compute the change in welfare corresponding to the magnitudes shown inequations (1) and (2) we use the version of the GTAP model which has welfaredecomposition. In this model, the change in welfare from an infinitesimal change iscomputed from the following sum (see Huff and Hertel, 1996, for details)
HIpSppVpVqVW ISm
i
Xi
Xi
m
i
Mi
Mi
m
ii
Ti ++−+−=∆ ∑∑∑
=== 111
(3)
iq is the percentage change in the level of economic activity i (such asproduction, exporting and importing).
TiV is the initial level of revenue obtained from any tax distortions associated
with that activity (the effects of subsidies are captured by negative taxrevenues).
Mip is the percentage change in the price of import i.M
iV is the initial value of the import.Xip is the percentage change in the price of export i.X
iV is the initial value of that export.Sp is the percentage change in the price of savings.
Who gains and who loses from unilateral and concerted trade liberalisation?, DI00-3 7© Asia Pacific Press 2000
S is the initial value of savings.Ip is the percentage change in the price of capital goods.
I is the initial value of the capital goods.
H is a term correcting the change in welfare for nonhomothetic CDE (constantdifference of elasticities) preferences of private household consumption.
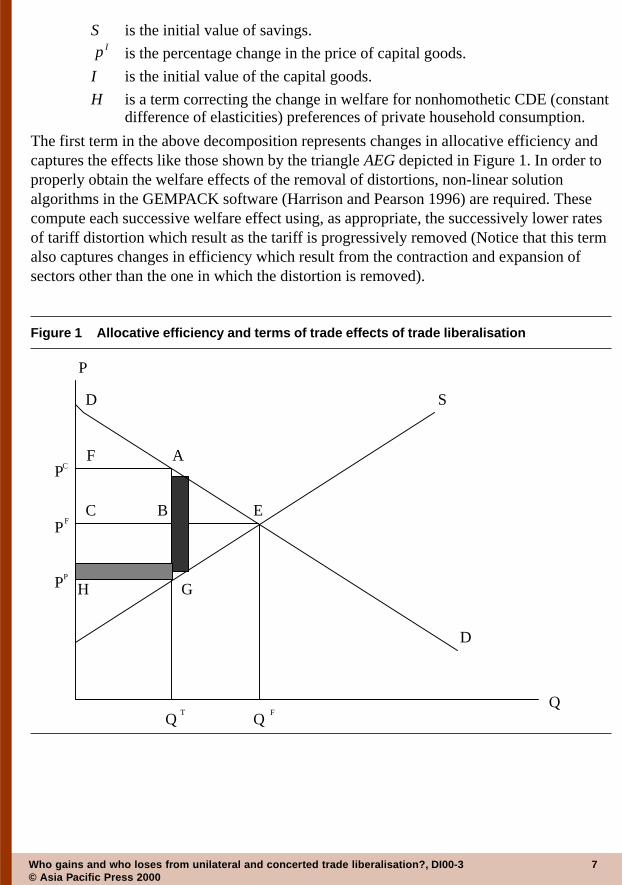
The first term in the above decomposition represents changes in allocative efficiency andcaptures the effects like those shown by the triangle AEG depicted in Figure 1. In order toproperly obtain the welfare effects of the removal of distortions, non-linear solutionalgorithms in the GEMPACK software (Harrison and Pearson 1996) are required. Thesecompute each successive welfare effect using, as appropriate, the successively lower ratesof tariff distortion which result as the tariff is progressively removed (Notice that this termalso captures changes in efficiency which result from the contraction and expansion ofsectors other than the one in which the distortion is removed).
S
D
E
D
A
B C
F
G H
P
Q
P
P P
P C
F
Q Q T F
Figure 1 Allocative efficiency and terms of trade effects of trade liberalisation

Who gains and who loses from unilateral and concerted trade liberalisation?, DI00-3 8© Asia Pacific Press 2000
The second term represents the terms of trade effect arising from any change in importprices and is the analogue of area CEGH in Figure 1. The third term captures theanalogous effects on the terms of trade arising from changes in export prices. The fourthand fifth terms capture the terms of trade effects in the capital account. In the GTAPmodel, investment across regions is allocated through a ‘global bank’ to ensure that theglobal demand for savings equals the global demand for investment in the post-liberalisation equilibrium. The global bank uses receipts from the sale of savings topurchase (at prices of regional savings) shares in a portfolio of regional investment goods(Hertel and Tsigas 1997). Thus, these transactions are similar to trade transactions andchanges in the price of savings relative to the price of investment goods have terms oftrade implications.1
In the presentation of simulation results in the following sections, terms two to five arecombined and referred to as the terms of trade effect. In addition, we add the last term inEquation 3, H, to the allocative efficiency effect. Since the H is normally small, therelative size of allocative efficiency and the terms of trade effect are not greatly affected bythis simplification.
Based on the evidence provided by Gehlhar (1994) in his validation of the GTAPmodel, the magnitude of trade elasticities in the GTAP model is doubled in all simulationsin the central scenarios. Gehlhar found that structural changes in the Asia Pacificeconomies over time would be best replicated if the trade elasticities are doubled. Fulldetails of the GTAP elasticities and other data can be found in McDougall (1997), and thecentral scenario elasticities used in this study are reported in Appendix Table A1.
In all simulations undertaken in this study, the numeraire is the global price of factorsof production. Thus, any price changes in the simulations are relative to this factor price.Land, labour, and capital endowments are all exogenous and fixed. Labour and capital areperfectly mobile across industries, while land is only partially mobile and specific toagricultural industries. This means that expanding sectors can easily draw labour andcapital away from contracting sectors. The elasticity of transformation between sectoralland uses is unity. Savings are a fixed share of income, whereas investment is determinedby how the ‘global bank’ allocates global investment. In the central scenarios of thesimulations we assume that the volume of investment changes at the same (global) rateacross all regions, so that the expected rate of return on capital changes at varying ratesacross regions. This fixed shares mechanism could be interpreted as a kind of partial longrun equilibrium, with international capital reallocation left out (Hertel et al. 1998). As wesee in the simulation results, this effectively constrains the trade account balance. Analternative assumption is to distribute global savings across regions in such a way that allregional expected rates of return change by the same percentage. This would essentiallyrepresent the short run equilibrium in the international capital market. The alternativeassumption allows larger changes in the trade account and is applied as part of thesensitivity analysis.

Who gains and who loses from unilateral and concerted trade liberalisation?, DI00-3 9© Asia Pacific Press 2000
The determinants of welfare outcomes
In carrying out trade liberalisation, we assume that liberalising regions remove all theirtariffs, anti-dumping duties, price undertakings, voluntary export restraints (including theMFA quotas), export subsidies and taxes, and output subsidies. The latter two categoriesof distortions are primarily used in agricultural industries. To simplify the simulations, wefurther assume that countries which do not participate in concerted trade liberalisationalways maintain existing distortions at their present levels of restrictiveness as measuredby their ad valorem equivalents.
From the perspective of a primary commodity exporter
In this sub-section, we start with unilateral trade liberalisation by Australasia (Australiaand New Zealand). In the first scenario, Australasia unilaterally removes all its traderestrictions and output subsidies. As can be seen in Column 1 of Table 1, Australasiasuffers an net welfare loss, because the terms of trade loss is slightly larger than theassociated allocative efficiency gain.
As Australasia is a small economy, one would think that the terms of trade effectwould be small when it liberalises. Australasia is, however, a large trader in a number ofprimary commodities, especially crops, livestock products, and resource commodities (seeAppendix Table A4).2 Trade liberalisation leads to a considerable export expansion ofthese primary commodities and consequently drives down their prices. The prices of otherexports also fall, but these commodities are not so important to Australasia’s total exports.At the same time, import prices change little. Australasia’s overall terms of trade falls by2.6 per cent.
The strong terms of trade effect results partly from the assumption about the capitalaccount. In this simulation, we have assumed that the expected rate of return to investmentvaries across regions so that investment in all regions changes proportionally at a globalrate. Given that Australia is a small country, its unilateral liberalisation leads to littlechange in global or Australian investment in real terms. Real savings are also littleaffected. Thus, the assumption of limited capital mobility effectively ties down the tradebalance. This restraint on the trade balance means that exports have to grow to a similarextent as imports. As a result, export prices fall. Had we allowed the trade deficit to growfollowing trade liberalisation, exports would not have grown as much, and thereforeexport prices would have been more favourable (see Section 4).
Unilateral trade liberalisation by Australia benefits all other regions except for thenegative effect in North America and the negligible effect on the rest of the world (seeColumn 1, Table 1). Most of these benefits come from favourable terms of trade effects onthese regions.
For North America, both allocative efficiency and the terms of trade deteriorate. Theseeffects result primarily from developments in the automobile market. North America facesmuch lower import barriers than Japan and the EU in the Australasian automobile market.

Who gains and who loses from unilateral and concerted trade liberalisation?, DI00-3 10© Asia Pacific Press 2000
Once all trade barriers are eliminated, the competitiveness of North American automobileexports declines relative to that of Japanese and EU products. At the same time, theexpansion of imports in Australasia makes automobiles more expensive to import intoNorth America from Japan and Europe, the two largest sources of North Americanimports, resulting in a decline in these imports. Less important negative effects on NorthAmerica emerge for similar reasons; North America’s exports of textiles and clothingdecline, because Australasia’s pre-liberalisation tariff structure discriminates against Asiandeveloping economies. Other negative effects on North America emerge because of effectsin Asian markets: exports of livestock and resource products decline because of theincrease in Australia’s exports, and Australasia’s trade liberalisation makes textile andclothing imports from Asia slightly more expensive for North America. These outcomesillustrate how liberalisation in one region can harm another if the regions have tradestructures which are more similar than they are different. They also show how thespillovers involved can work through effects in third markets.
Once ASEAN joins Australasia in MFN liberalisation, Australasia’s welfare loss isreduced considerably (see Column 2, Table 1). This outcome results almost exclusivelyfrom the more favourable terms of trade effect arising from ASEAN’s trade liberalisation.Australasia’s terms of trade continues to improve as more regions join in concerted tradeliberalisation (see Columns 3, 4 and 5, Table 1). The rest of Asia and the rest of the worldregions have the largest favourable impact on Australasia’s terms of trade, but the way inwhich trade liberalisation in these two regions helps improve Australasia’s terms of tradeis different. When the rest of Asia liberalises, the prices of Australasian imports decline,especially those of processed food, textiles, and other manufactured goods. On the otherhand, when the rest of the world region liberalises, Australasia benefits most from increasesin the prices of exports, particularly those of crops, livestock products, and processed food.
The boost to Australasia’s terms of trade by trade liberalisation in the Asiandeveloping economies is clearly related to the very different trade and protection structurebetween the two regions. The two regions’ trade patterns are by and large complementary.In addition, the structure of protection in both regions tends to reduce trade resulting fromsuch complementarity. Trade liberalisation is therefore mutually beneficial. The same isalso generally true for trade between Australasia and the rest of the world.
The most striking result emerging from concerted trade liberalisation in NorthAmerica and Japan is the substantial welfare loss suffered by the EU. As can be seen fromColumn 4 of Table 1, this loss results predominantly from a decline in allocative efficiencyin the EU. This is a second-best outcome of trade liberalisation and the key tounderstanding it is to note the implications of the Common Agricultural Policy (CAP).Without Japan and North America liberalising, agricultural exports from the EU increaseonly moderately as a result of trade liberalisation in Australasia, ASEAN, and the rest ofAsia. Once the Japan and North America region liberalises, however, agricultural exportsfrom the EU increase substantially. As the EU subsidises its agricultural exports, increases

Who gains and who loses from unilateral and concerted trade liberalisation?, DI00-3 11© Asia Pacific Press 2000
in exports mean greater welfare losses. Unlike in previous scenarios where welfare gainsfrom the expansion of other exports more than offset the losses from moderate increases inagricultural exports, the losses from increased agricultural exports in this scenariodominate the outcome.
The last scenario represents global trade liberalisation achieved when the rest of theworld (including the EU) liberalises its trade. The welfare gain for this region is boostedsubstantially by its own trade liberalisation, despite a considerable terms of trade loss (seeColumn 5, Table 1). All other regions also gain. In fact, global trade liberalisationgenerates maximum benefits to every region, even though some regions continue to sufferfrom an adverse terms of trade effect. The benefits of improved allocative efficiencydominate the overall outcome.
Table 1 Welfare effects of unilateral and concerted trade liberalisation: Australasia takesthe lead, 1992 (US$ billion)
Australasia ASEAN Rest Japan and Rest ofof Asia N. America the world
(1) (2) (3) (4) (5)Australasia Total -0.1 0.3 2.1 2.9 5.8
Allocative 1.8 1.8 2.1 1.9 2.1ToT -1.9 -1.5 0.0 1.0 3.8
North America Total -0.6 -1.3 6.4 33.9 33.6Allocative -0.4 -2.5 -3.8 37.6 25.7ToT -0.2 1.1 10.2 -3.7 7.9
Japan Total 1.1 2.9 9.9 77.7 98.7Allocative 0.0 0.6 1.0 60.5 78.8ToT 1.0 2.3 8.9 17.2 19.9
ASEAN Total 0.2 21.2 18.4 16.7 21.7Allocative 0.1 34.0 30.6 31.5 34.6ToT 0.1 -12.8 -12.2 -14.7 -12.9
Rest of Asiaa Total 0.9 2.8 43.7 42.0 55.4Allocative 0.3 -3.9 63.9 64.5 72.8ToT 0.5 6.7 -20.2 -22.4 -17.4
European Union Total 0.4 6.4 12.6 -8.0 132.9Allocative 0.0 3.7 5.0 -20.6 121.2ToT 0.4 2.7 7.6 12.6 11.8
Rest of world Total 0.0 2.7 11.9 15.4 28.3Allocative 0.1 1.4 6.7 5.8 41.4ToT -0.1 1.3 5.2 9.5 -13.1
World Total 1.8 34.9 104.9 180.6 376.4Allocative 1.9 35.1 105.5 181.2 376.6ToT 0.0 -0.2 -0.6 -0.6 -0.1
Notes: a Includes Hong Kong, Korea, Taiwan, China and South Asia. Together with the other six coun-tries/regions listed in this table, there are nine countries/regions in the model. For commodity (industry)details, see Appendix Table A1.Source: Simulations of the GTAP model, database version 3.

Who gains and who loses from unilateral and concerted trade liberalisation?, DI00-3 12© Asia Pacific Press 2000
In the case of the EU, the increased allocative efficiency is so significant that theregion becomes the largest beneficiary of global trade liberalisation after Japan. One majorsource of allocative efficiency for the EU is the reduction in its agricultural exports.Associated with the export reduction is a fall in agricultural production, following theremoval of output subsidies. This also brings welfare benefits. Another major source ofwelfare gain is the removal of the MFA and the extensive non-tariff barriers to the importsof automobiles and some other manufactured goods. The strong expansion of the basicmanufactures sector also helps improve allocative efficiency.
From the perspective of a developed manufactures exporter
Unlike Australasia, Japan is a large exporter of sophisticated manufactures. In this sub-section we examine the outcome of concerted trade liberalisation from Japan’sperspective. When Japan unilaterally removes all trade barriers, its allocative efficiencyimproves substantially while its terms of trade deteriorates, as expected of any unilateralliberalisation (Table 2). Unlike Australasia, however, the efficiency gain dominates theterms of trade effect.
One wonders how important trade structure is in explaining the difference in theresults of unilateral liberalisation between Japan and Australasia, especially with respect tothe terms of trade effect. For both Japan and Australasia, increased imports are the primarysource of allocative efficiency improvement. Whereas for Australasia, the efficiencyimprovement comes largely from reductions in tariffs on textiles, automobiles, and basicmanufactures, Japan’s efficiency improvement occurs primarily in agriculture. For bothregions, efficiency gains from export expansion are small, because there are fewrestrictions on exports.
When Japan liberalises unilaterally, its overall export expansion (21 per cent) issimilar to that of Australasia (23 per cent) when Australasia does the same. At the sametime, Japan’s import expansion (26 per cent) is significantly larger than Australasia’s (19per cent). From these comparisons, one would expect that Japan’s terms of trade woulddeteriorate to a greater extent than Australasia’s, because Japan is a much larger economy.It turns out, however, that the decline in Japan’s terms of trade is 15 per cent smaller thanthat for Australasia.
Part of this difference appears to come from trade structure. Australasia’s exports areconcentrated heavily in livestock, resources, and basic manufactures (62 per cent of totalexports; see Appendix Table A2). Japan’s exports, however, are even less diversified.Automobiles alone account for 66 per cent, and basic manufactures account for another 15per cent. In terms of their shares in the world export market, Australasia is a smallerexporter in every market except livestock (23 per cent), natural resources (5 per cent), andcrops (4 per cent). In contrast, Japan has a market share of 23 per cent for both automobilesand other manufactures. Nevertheless, Australasia suffers a larger fall in the prices of itskey exports than Japan does. The reason is that the elasticities of substitution for keyAustralasian exports are significantly smaller than those for key Japanese exports (seeTable A1).3

Who gains and who loses from unilateral and concerted trade liberalisation?, DI00-3 13© Asia Pacific Press 2000
When Australasia and ASEAN join Japan in concerted trade liberalisation, Japan doesnot gain in terms of efficiency, but its terms of trade loss from unilateral tradeliberalisation is reduced considerably (see Column 2, Table 2). When the rest of Asiabecomes part of the concerted trade liberalisation, Japan benefits more. Although itsefficiency gain declines marginally as agricultural imports do not expand as much, theterms of trade loss from unilateral liberalisation is eliminated completely. The increaseddemand for Japanese capital goods in the rest of Asia drives up the export prices forJapanese manufactured goods.
Two points here are worth noting from the perspective of Japan when North Americaand the rest of the world joins the concerted trade liberalisation. When North Americaliberalises, Japan’s allocative efficiency declines slightly further. This results from thediversion of Japan’s automobile exports from the EU to North America. In the EU, VERs(Voluntary Export Restraints) and price undertakings against Japanese automobiles aremore important than tariffs. The reduction in the exports to the EU leads to a loss whichoutweighs the gain from the increased exports to North America. When the rest of theworld liberalises, however, in addition to a considerable terms of trade improvement,Japan’s allocative efficiency improves significantly. A substantial increase in the exportsof automobiles improves Japan’s allocative efficiency as well as its terms of trade. Theremoval of tariffs, VERs, and other forms of restrictions, on automobile exports to the EUis mostly responsible for this outcome.
One persistent result in all scenarios of concerted trade liberalisation is that Japanconsistently benefits from every other region’s trade liberalisation. Three factors seem tobe important: Japan’s trade pattern, its protection structure, and the trade barriers it faces.The largest export item for Japan is automobiles. Most countries, especially Asiandeveloping countries and Australia, tend to have higher tariffs on automobiles than onother manufactured goods. As these countries remove their protection, Japan’s automobileexports expand. In the EU and North America, Japan faces higher protection than othercountries because of non-tariff barriers and the VERs imposed against its automobiles. Asa result, Japan’s competitiveness increases vis-à-vis other major automobile exporterswhen trade barriers in the EU and North America are removed. This also explains why
Table 2 Welfare effects on Japan of unilateral and concerted trade liberalisation, 1992(US$ billion)
Japan Australasia Rest North Rest of& ASEAN of Asia America the world
(1) (2) (3) (4) (5)Total 53.6 55.8 61.8 77.7 98.7Allocative 62.9 62.3 61.7 60.5 78.8ToT -9.3 -6.5 0.1 17.2 19.9
Source: Simulations of the GTAP model, database version 3.
Who gains and who loses from unilateral and concerted trade liberalisation?, DI00-3 14© Asia Pacific Press 2000
export prices for Japan’s manufactured goods do not decline as much as other countries’,or even increase, when trade liberalisation occurs in other countries. On the import side,Japan has high agricultural protection, but its trade barriers mainly take the form of hightariffs and import quotas; there are no export subsidies. As a result, whenever tradeexpands as a result of trade liberalisation, either by itself or other countries, Japan’sallocative efficiency improves.
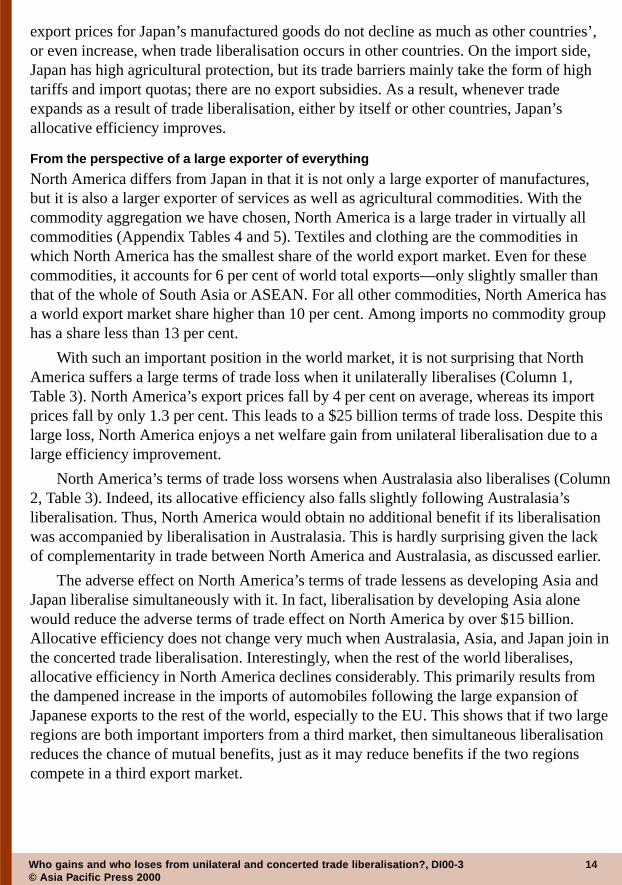
From the perspective of a large exporter of everything
North America differs from Japan in that it is not only a large exporter of manufactures,but it is also a larger exporter of services as well as agricultural commodities. With thecommodity aggregation we have chosen, North America is a large trader in virtually allcommodities (Appendix Tables 4 and 5). Textiles and clothing are the commodities inwhich North America has the smallest share of the world export market. Even for thesecommodities, it accounts for 6 per cent of world total exports—only slightly smaller thanthat of the whole of South Asia or ASEAN. For all other commodities, North America hasa world export market share higher than 10 per cent. Among imports no commodity grouphas a share less than 13 per cent.
With such an important position in the world market, it is not surprising that NorthAmerica suffers a large terms of trade loss when it unilaterally liberalises (Column 1,Table 3). North America’s export prices fall by 4 per cent on average, whereas its importprices fall by only 1.3 per cent. This leads to a $25 billion terms of trade loss. Despite thislarge loss, North America enjoys a net welfare gain from unilateral liberalisation due to alarge efficiency improvement.
North America’s terms of trade loss worsens when Australasia also liberalises (Column2, Table 3). Indeed, its allocative efficiency also falls slightly following Australasia’sliberalisation. Thus, North America would obtain no additional benefit if its liberalisationwas accompanied by liberalisation in Australasia. This is hardly surprising given the lackof complementarity in trade between North America and Australasia, as discussed earlier.
The adverse effect on North America’s terms of trade lessens as developing Asia andJapan liberalise simultaneously with it. In fact, liberalisation by developing Asia alonewould reduce the adverse terms of trade effect on North America by over $15 billion.Allocative efficiency does not change very much when Australasia, Asia, and Japan join inthe concerted trade liberalisation. Interestingly, when the rest of the world liberalises,allocative efficiency in North America declines considerably. This primarily results fromthe dampened increase in the imports of automobiles following the large expansion ofJapanese exports to the rest of the world, especially to the EU. This shows that if two largeregions are both important importers from a third market, then simultaneous liberalisationreduces the chance of mutual benefits, just as it may reduce benefits if the two regionscompete in a third export market.
Who gains and who loses from unilateral and concerted trade liberalisation?, DI00-3 15© Asia Pacific Press 2000
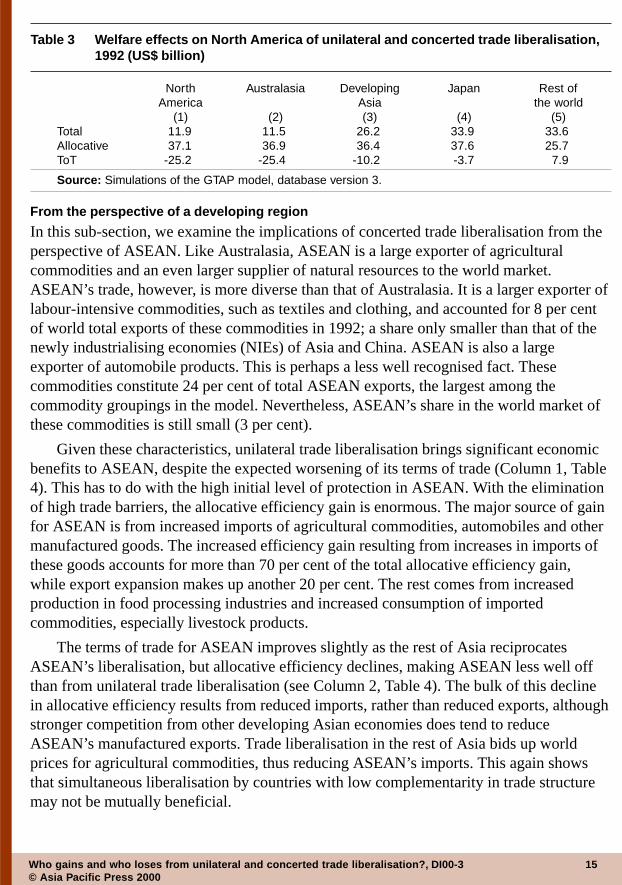
From the perspective of a developing region
In this sub-section, we examine the implications of concerted trade liberalisation from theperspective of ASEAN. Like Australasia, ASEAN is a large exporter of agriculturalcommodities and an even larger supplier of natural resources to the world market.ASEAN’s trade, however, is more diverse than that of Australasia. It is a larger exporter oflabour-intensive commodities, such as textiles and clothing, and accounted for 8 per centof world total exports of these commodities in 1992; a share only smaller than that of thenewly industrialising economies (NIEs) of Asia and China. ASEAN is also a largeexporter of automobile products. This is perhaps a less well recognised fact. Thesecommodities constitute 24 per cent of total ASEAN exports, the largest among thecommodity groupings in the model. Nevertheless, ASEAN’s share in the world market ofthese commodities is still small (3 per cent).
Given these characteristics, unilateral trade liberalisation brings significant economicbenefits to ASEAN, despite the expected worsening of its terms of trade (Column 1, Table4). This has to do with the high initial level of protection in ASEAN. With the eliminationof high trade barriers, the allocative efficiency gain is enormous. The major source of gainfor ASEAN is from increased imports of agricultural commodities, automobiles and othermanufactured goods. The increased efficiency gain resulting from increases in imports ofthese goods accounts for more than 70 per cent of the total allocative efficiency gain,while export expansion makes up another 20 per cent. The rest comes from increasedproduction in food processing industries and increased consumption of importedcommodities, especially livestock products.
The terms of trade for ASEAN improves slightly as the rest of Asia reciprocatesASEAN’s liberalisation, but allocative efficiency declines, making ASEAN less well offthan from unilateral trade liberalisation (see Column 2, Table 4). The bulk of this declinein allocative efficiency results from reduced imports, rather than reduced exports, althoughstronger competition from other developing Asian economies does tend to reduceASEAN’s manufactured exports. Trade liberalisation in the rest of Asia bids up worldprices for agricultural commodities, thus reducing ASEAN’s imports. This again showsthat simultaneous liberalisation by countries with low complementarity in trade structuremay not be mutually beneficial.
Table 3 Welfare effects on North America of unilateral and concerted trade liberalisation,1992 (US$ billion)
North Australasia Developing Japan Rest ofAmerica Asia the world
(1) (2) (3) (4) (5)Total 11.9 11.5 26.2 33.9 33.6Allocative 37.1 36.9 36.4 37.6 25.7ToT -25.2 -25.4 -10.2 -3.7 7.9
Source: Simulations of the GTAP model, database version 3.

Who gains and who loses from unilateral and concerted trade liberalisation?, DI00-3 16© Asia Pacific Press 2000
As noted earlier, trade liberalisation in North America improves allocative efficiencyin ASEAN, but at the expense of its terms of trade. When North America abolishes MFAquotas and reduces its high tariffs on textiles and clothing, the terms of trade for ASEANdeteriorates. This unfavourable terms of trade effect is partially offset when the rest of theworld joins in concerted trade liberalisation. Allocative efficiency in ASEAN alsoimproves significantly. Overall, ASEAN’s welfare is boosted by nearly one-third as aresult trade liberalisation in the rest of the world.
Choosing partners in concerted liberalisation
We noted earlier that concerted trade liberalisation with ASEAN would reduceAustralasia’s welfare loss by improving its terms of trade. This makes Australasia onlymarginally better off, however, because ASEAN is a relatively small market forAustralasia. One wonders what would happen if Australasia’s trade liberalisation is firstreciprocated by a region as large as North America, which is 60 per cent larger thanASEAN as an export market for Australasia. Column 2 in Table 5 shows the results ofsuch an experiment. It turns out that concerted trade liberalisation in North America doesimprove Australasia’s terms of trade more than ASEAN could, but this occurs at theexpense of some of the efficiency gain from unilateral trade liberalisation. Overall, NorthAmerica is not a more desirable first partner for Australasia than ASEAN in concertedtrade liberalisation, despite its much larger size.4
The impact on Australasia of trade liberalisation in North America and ASEAN comesprimarily from the import side. The differences in the impact on Australasia’s allocativeefficiency result from the different trade structure of North America and ASEAN. WhenNorth America liberalises, it bids up world agricultural prices more than when ASEANdoes so, especially for crops. This does not explain much of the difference in the welfareimpact as Australasia is a very small importer of primary commodities. The impact ismore significant for processed food, of which Australasia is a much larger importer. Thelargest differences in the impact are in the imports of manufactures; especially textiles,clothing, and automobiles, as these are Australasia’s major imports. Australasia importsconsiderably less of these commodities when North America liberalises than whenASEAN does.
Table 4 Welfare effects on ASEAN of unilateral and concerted trade liberalisation, 1992(US$ billion)
ASEAN Rest of Japan North Rest ofAsia America the world
(1) (2) (3) (4) (5)Total 21.0 18.2 19.5 16.7 21.7Allocative 34.0 30.6 31.2 31.5 34.6ToT -13.0 -12.4 -11.6 -14.7 -12.9
Source: Simulations of the GTAP model, database version 3.

Who gains and who loses from unilateral and concerted trade liberalisation?, DI00-3 17© Asia Pacific Press 2000
When Japan joins in reciprocating Australasia’s trade liberalisation, Australasia’swelfare continues to improve as a result of an improvement in the terms of trade. Criticalchange in Australasia’s welfare position occurs when the rest of Asia liberalises, as notedearlier. The favourable terms of trade effect on Australasia of trade liberalisation in the restof Asia is greater than that of North America, ASEAN, and Japan combined. In addition,allocative efficiency also improves significantly. The bulk of the efficiency gain comesfrom increased imports, especially manufactures, including processed food. Even the importsof primary agricultural commodities increase more when the rest of Asia liberalises. Thismay seem paradoxical since higher world prices for agricultural commodities resultingfrom increased demand in the rest of Asia should force Australasia to import less. Asnearly 60 per cent of Australasia’s crop exports and nearly half of its livestock exports goto Asia, however, domestic prices of local agricultural commodities are bid upsubstantially relative to the prices of imports when Asia liberalises. This, in turn, generatesgreater demand for imported agricultural commodities from other regions, including Asia.
As noted earlier, the biggest boost to Australasia’s welfare comes from tradeliberalisation in the rest of the world. Increases in the exports of agricultural commoditiesto the EU are the most significant, especially for crops. At the same time, exports of manymanufactured exports are also boosted. For Australia, the rest of the world is a market ofalmost equal importance to that of the EU. In terms of agricultural commodities, this partof the world is twice as important as the EU. The expansion of exports per se does notincrease Australasia’s welfare very much, because there are few export restrictions inAustralasia, but increases in the demand for exports greatly improve Australasia’s terms oftrade. As can be seen in Table 5, the bulk of Australasia’s welfare benefits from tradeliberalisation in the rest of the world comes from the improvement in its terms of trade.
Sensitivity analysis
As seen in the previous section, the terms of trade effects are critical in determining thewelfare outcomes of trade liberalisation. Two aspects of the model’s specification areparticularly important to these terms of trade effects. As noted earlier, the way in which theglobal banking sector allocates investment among regions has a significant impact onregional trade balances, and hence on the regional terms of trade. Changes in export andimport prices also depend on the elasticities of demand which are, in turn, a function of theelasticities of substitution between imports and domestic goods and between imports fromdifferent sources of supply. While the outcomes of trade balances largely determine theexpansion of exports relative to imports, the elasticities of substitution determine themagnitude of changes in export and import prices at a given level of export and importexpansion. Normally, changes in export prices are larger than changes in import prices.This is, in general, because countries are more specialised in exports than in imports. It isalso partly due to the asymmetrical treatment of demand and supply in the GTAP model.While imports are assumed to be imperfect substitutes for domestic products, exports anddomestic sales are assumed to be homogenous.5

Who gains and who loses from unilateral and concerted trade liberalisation?, DI00-3 18© Asia Pacific Press 2000
Testing the alternative capital account assumption
Here, we explore how a more flexible capital account might affect the welfare outcome oftrade liberalisation. We repeat the first four sets of simulations in the previous section,while allowing the regional expected rate of return to investment to be equalised acrossregions. This leads to larger changes in regional investment than when regional investmentchanges at the same global rate. An outcome of this alternative specification is thatregional trade balances tend to change to a greater extent following trade liberalisation.
This alternative specification of the capital allocation mechanism has a dramaticimpact on the welfare results for Australasia (Table 6). Instead of losing US$100 millionfrom unilateral trade liberalisation as in the previous experiment, Australasia benefits byUS$800 million. The difference between the two sets of results comes not only from theterms of trade, but also from allocative efficiency, though the terms of trade effect explainsnearly twice as much of the difference. The increased allocative efficiency is a direct resultof increased import expansion. The smaller terms of trade effect is largely due to thedampened export expansion. When the capital account is given more room to adjust, tradeliberalisation leads to greater import expansion and smaller export expansion. This reducesthe downward pressure on export prices more than it increases the upward pressure onimport prices.
The mechanism outlined above also explains the results in the subsequent threescenarios (Columns 2–5, Table 6). When it comes to global trade liberalisation, however,there is little difference between the two sets of the results. When all countries liberalise,the advantage of having a more flexible capital account is eroded completely. That is, it isno longer necessary to have such a capital account to mitigate the terms of trade effectwhen external demand is strong. In fact, Australasia ends up having a slightly lessfavourable terms of trade than in the case of the less accommodating capital account.Allocative efficiency gains are also slightly smaller because of smaller import expansion.This is very much in line with the global welfare gain. When all regional capital accountsare more flexible, global exports—and hence imports—tend to be slightly smaller, and as aresult the global welfare gains are also smaller.
Table 5 Welfare effects on Australasia of unilateral and concerted trade liberalisation withdifferent sequencing, 1992 (US$ billion)
Australasia North ASEAN Japan Developing Rest ofAmerica Asia the world
(1) (2) (3) (4) (5) (6)Total -0.1 0.3 0.7 1.0 2.9 5.8Allocative 1.8 1.5 1.6 1.6 1.9 2.1ToT -1.9 -1.2 -0.9 -0.6 1.0 3.8
Source: Simulations of the GTAP model, database version 3.

Who gains and who loses from unilateral and concerted trade liberalisation?, DI00-3 19© Asia Pacific Press 2000
The alternative specification of the capital account has a similar impact on Japan. Ascan be seen in Table 7, Japan would enjoy a small terms of trade gain even when itundertakes unilateral trade liberalisation. This more favourable terms of trade continues asmore regions join Japan in concerted trade liberalisation. Japan ends up with both a higherefficiency gain and more favourable terms of trade in every step of concerted tradeliberalisation under the more accommodating capital account.
The impact of a more flexible capital account on North America looks similar untilJapan and the rest of the world region participate in concerted trade liberalisation (Table8). When other regions begin to liberalise, the return to investment in these regionsincreases relative to that in North America. In contrast, when capital mobility is limited,investment increases slightly in North America and the existing trade account position ismaintained. When capital is more mobile, investment moves out of North America owingto the decline in investment returns. As a result, the real exchange rate depreciates and netexports surge. Gross exports increase more than when capital mobility is less restricted.Increased export expansion leads to lower export prices, exacerbating North America’sterms of trade effect. Furthermore, as most industrial and service exports are subject tovirtually no taxes, there is little efficiency gain, but, at the same time, increases inagricultural exports and production expansion result in a welfare loss because of exportsubsidies. On the import side, domestic absorption contracts as exports expand, leading toconsiderable welfare losses in domestic consumption and production. Thus, as moreregions join North America, allocative efficiency suffers even though the terms of tradeimproves.
Table 6 Welfare effects on Australasia of trade liberalisation under the alternative capitalaccount assumption, 1992 (US$ billion)
Australasia ASEAN Developing Japan and Rest ofAsia North America the world
(1) (2) (3) (4) (5)Total 0.8 1.2 3.0 3.2 5.5Allocative 2.2 2.2 2.5 2.0 1.9ToT -1.3 -1.0 0.5 1.2 3.7
Source: Simulations of the GTAP model, database version 3.
Table 7 Welfare effects on Japan of trade liberalisation under the alternative capitalaccount assumption, 1992 (US$ billion)
Japan Australasia Developing North Rest ofand ASEAN Asia America the world
(1) (2) (3) (4) (5)Total 61.2 63.4 68.3 84.6 99.8Allocative 59.7 59.5 59.2 59.2 77.9ToT 1.5 3.9 9.1 25.4 21.9
Source: Simulations of the GTAP model, database version 3.

Who gains and who loses from unilateral and concerted trade liberalisation?, DI00-3 20© Asia Pacific Press 2000
There is, however, one thing missing. In this version of the GTAP model, it is assumedthat all returns to capital are intra-regional. When capital moves out of North America intoother regions, one would expect that North America would benefit from the higher capitalreturns in those regions. Although failing to take this into account may not understatewelfare results for North America in the current period, because the welfare measure inGTAP is based on income (consumption plus savings) and not on consumption alone, itfails to capture the higher capital returns in subsequent periods, because this version of theGTAP model is a one-period model and has no cross-ownership of capital.
The absence of cross-ownership of capital has another consequence. If, say, NorthAmerica is a net exporter of capital in the base period, even if there is no capital outflowfollowing trade liberalisation, the welfare result for the region would still be biaseddownward, albeit to a lesser extent. In this sense, assuming limited capital mobility leadsto more accurate welfare results. This assumption is also consistent with the fact that manygovernments do target the balance of payments.
The story for ASEAN when greater capital mobility is allowed is similar to those forAustralasia and Japan (Table 9). The terms of trade for ASEAN is more favourable whencapital mobility is allowed. Allocative efficiency gains increase slightly. The welfare gainthus improves all the way with concerted trade liberalisation. As in the case of limitedcapital mobility, trade liberalisation in North America worsens the terms of trade forASEAN.
Table 8 Welfare effects on North America of trade liberalisation under the alternativecapital account assumption, 1992 (US$ billion)
North Australasia Developing Japan Rest ofAmerica Asia the world
(1) (2) (3) (4) (5)Total 15.1 14.5 25.6 25.4 19.4Allocative 38.6 38.3 36.7 32.5 18.7ToT -23.5 -23.8 -11.0 -7.1 0.7
Source: Simulations of the GTAP model, database version 3.
Table 9 Welfare effects on ASEAN of trade liberalisation under the alternative capitalaccount assumption, 1992 (US$ billion)
ASEAN Rest Japan North Rest ofof Asia America the world
(1) (2) (3) (4) (5)Total 22.5 19.3 19.7 17.4 22.7Allocative 33.5 30.0 30.0 30.6 34.2ToT -11.0 -10.7 -10.4 -13.2 -11.5
Source: Simulations of the GTAP model, database version 3.

Who gains and who loses from unilateral and concerted trade liberalisation?, DI00-3 21© Asia Pacific Press 2000
Testing the elasticities of substitution
In testing the sensitivity of welfare results to the elasticities of substitution, we consideronly uniform changes to the elasticities. Systematic sensitivity tests on changes in themagnitude of elasticities would require a daunting amount of computing. In varying theelasticities of substitution, we first halve their magnitude and then double them. Limitedcapital mobility is assumed in all the simulations.
Table 10 reports the results of sensitivity tests for Australasia. Clearly, the broadpattern of the welfare effects of trade liberalisation is retained. Generally, lower elasticitiesresult in greater welfare losses or smaller gains to Australasia. With higher elasticities,even unilateral trade liberalisation leads to a welfare improvement. Not surprisingly, thelargest differences are found in scenarios where fewer regions join Australasia inconcerted trade liberalisation. When the regional coverage of trade liberalisation becomessufficiently large, the magnitude of trade elasticities matters less.
Interestingly, the bulk of the welfare difference between the lower and higher elasticityassumptions comes from differences in allocative efficiency, not from the terms of tradeeffect. Lower elasticities mean smaller trade responses to liberalisation and hence smallerallocative efficiency gains. The small efficiency gains can be easily dominated by adverseterms of trade effects when not enough regions participate in concerted trade liberalisation.
The results for Japan differ from those for Australasia in that Japan benefitssubstantially even when the elasticities are halved (Table 11). Again, allocative efficiencygains explain the main difference in welfare gains between the lower and higher elasticityscenarios.
Because of North America’s size, one would expect that the terms of trade effectswould explain a larger part of the differences in welfare gains. This turns out to be thecase, but even here allocative efficiency differences are much larger than the terms of tradedifferences (Table 12). In the case of unilateral trade liberalisation, for example, adifference in the elasticities by a factor of four makes a US$10 billion difference to theterms of trade effect, but a US$68 billion difference to the allocative efficiency effect.
Table 10 Welfare results for Australasia with different elasticities of substitution, 1992(US$ billion)
Elasticities Australasia ASEAN Rest Japan and Rest ofof Asia North America the world
(1) (2) (3) (4) (5)EV Low -1.2 -0.6 0.8 2.5 5.1
High 1.7 1.7 5.3 5.3 8.0
Allocative Low 0.9 0.9 1.2 1.2 1.3High 3.4 3.4 3.8 3.3 3.5
TOT Low -2.1 -1.5 -0.3 1.3 3.8High -1.7 -1.7 1.6 2.0 4.5
Source: Simulations of the GTAP model, database version 3.

Who gains and who loses from unilateral and concerted trade liberalisation?, DI00-3 22© Asia Pacific Press 2000
The impact of the changed elasticities on the terms of trade effects in ASEAN isconsiderably smaller than in North America (Table 13). The difference that the elasticitiesmake to allocative efficiency is accordingly disproportionately larger. As a smallereconomy, ASEAN’s trade is more responsive to the change in the elasticities ofsubstitution. While larger elasticities result in smaller percentage changes in the ratio ofexport to import prices (the terms of trade), they also lead to larger changes in tradevolumes. As a result, larger elasticities can give rise to greater terms of trade effects interms of welfare impact. Such an impact is more pronounced for ASEAN than for otherregions. In all cases, however, efficiency gains from larger trade volumes dominate thesometimes increased terms of trade losses.
Conclusion
In this paper, the GTAP model is used to trace the welfare impacts of unilateral andconcerted trade liberalisation. The simulation results show that country size is important indetermining the welfare effect of unilateral trade liberalisation. While a large country islikely to suffer a significant terms of trade loss from unilateral trade liberalisation, ‘small’regions such as Australasia may also suffer a noticeable terms of trade effect if it is a largetrader in certain commodities, especially primary commodities. Even with adverse termsof trade effects, countries may still enjoy an overall gain from unilateral trade liberalisation.
The results also suggest that concerted MFN trade liberalisation can substantiallyalleviate the adverse terms of trade effect of unilateral trade liberalisation. Even for acountry which suffers a net loss from unilateral trade liberalisation, it takes only a few majortrading partners in concerted MFN trade liberalisation before every country can gain. Thesepartners do not have to be large, but they need to be complementary to each other. Forinstance, Australia is better off from concerted trade liberalisation with Asian developingeconomies than with North America. Indeed, while Australasia enjoys a small gain fromNorth America’s liberalisation, the latter loses out from trade liberalisation in Australasia,because Australasia increases its competition with North America in the world agriculturalmarket and its increased imports of automobiles push up import costs for North America.
Table 11 Welfare results for Japan with different elasticities of substitution, 1992(US$ billion)
Elasticities Japan Australasia Rest North Rest & ASEAN of Asia America of world
(1) (2) (3) (4) (5)EV Low 27.4 29.3 34.2 46.4 60.4
High 84.3 87.7 93.1 121.1 157.1
Allocative Low 37.0 36.7 36.5 35.2 43.2High 97.2 95.6 89.9 91.8 133.2
TOT Low -9.5 -7.4 -2.3 11.3 17.2High -12.9 -7.9 3.2 29.3 23.9
Source: Simulations of the GTAP model, database version 3.

Who gains and who loses from unilateral and concerted trade liberalisation?, DI00-3 23© Asia Pacific Press 2000
The welfare outcome of trade liberalisation also depends on what forms of protectionprevail in the liberalising country and its major trading partners. Countries which use onlyimport restrictions tend to gain more than countries which use both import restrictions andsubsidies on exports and production. When there are only import restrictions, tradeliberalisation always improves allocative efficiency by increasing imports in the liberalisingcountry. The adverse terms of trade effects resulting from the concomitant trade expansioncan be easily offset by the improved allocative efficiency, or by concerted trade liberalisationin partner countries. In contrast, if export and production subsidies are important in acountry’s overall protection structure, such as in the United States, allocative efficiencygains from increased imports can be more easily outweighed by the efficiency losses fromincreased exports. Furthermore, concerted trade liberalisation in partner countries mayexacerbate the efficiency losses by generating greater export demand.
This second-best outcome also applies to countries which do not participate inconcerted trade liberalisation. Our simulations show that the European Union sometimesstands to lose from concerted trade liberalisation in the APEC region, especially whenmajor agricultural importing countries, the United States and Japan, participate in theprocess. Export and production subsidies under the CAP policy are responsible for thisoutcome. Only when the EU itself undertakes to remove agricultural protection can it toobenefit from liberalisation in other regions.
This study also highlights the importance of the macroeconomic response to tradeliberalisation. Trade liberalisation tends to increase trade deficits or reduce trade surpluses,at least in the short run. If the policy response is to maintain the existing trade balance, theadverse terms of trade effect from unilateral trade liberalisation is exacerbated by largerexpansions of exports than otherwise. A macroeconomic policy which is moreaccommodating to changes in the trade account can substantially reduce the adverse termsof trade effect. Of course, such a policy is only feasible if the fall in the balance of tradedoes not pose a macroeconomic problem, or the problem can be addressed in due coursewhen the potential dynamic effects of trade liberalisation address the trade accountimbalance.
Table 12 Welfare results for North America with different elasticities of substitution, 1992(US$ billion)
Elasticities North Australasia Developing Japan Rest ofAmerica Asia the world
(1) (2) (3) (4) (5)EV Low -6.2 -6.5 4.1 11.0 16.5
High 51.3 50.7 83.7 94.2 79.3
Allocative Low 16.3 16.2 15.9 16.4 11.9High 83.8 83.3 84.6 87.3 54.3
TOT Low -22.5 -22.6 -11.8 -5.4 4.5High -32.5 -32.6 -0.9 6.9 25.0
Source: Simulations of the GTAP model, database version 3.

Who gains and who loses from unilateral and concerted trade liberalisation?, DI00-3 24© Asia Pacific Press 2000
Trade elasticities are important to the terms of trade effect of trade liberalisation, butthey are even more important to the allocative efficiency effect—an outcome that is oftenneglected. When the magnitude of the elasticities of substitution is increased, for example,a country undertaking unilateral trade liberalisation gains more or loses less not onlybecause the adverse terms of trade effect is alleviated, but also more importantly becausethe efficiency gain becomes much larger. In other words, when demand is more elastic, thecost of protection is higher. When it comes to concerted or global trade liberalisation, themagnitude of trade elasticities matters less or little to most countries, especially the smallones. In such cases, the distribution of global welfare gains from trade liberalisationremains insensitive for most countries. While one can debate the ‘true’ magnitude of theelasticities of substitution, it seems that few countries might expect qualitatively differentwelfare outcomes from different elasticities.
An obvious conclusion from this research is that concerted trade liberalisation is muchmore beneficial to liberalising countries than if they act individually. Concerted action hasanother advantage; as the benefits of trade liberalisation tend to come in the long runwhereas the adjustment costs tend to occur quickly, unilateral trade liberalisation oftenfaces strong resistance from domestic interest groups. Concerted trade liberalisation canreduce this resistance by lowering the adjustment costs, with stronger export demandeasing the pain of structural change.
This analysis may be limited by the adopted framework of constant returns to scaleand perfect competition. Welfare gains which may arise from increasing returns to scaleand pro-competitive effects of trade liberalisation are not captured. These gains have beenshown to be important (Francois et al. 1997; Harrison et al. 1996). The standard GTAPframework adopted here, however, has the advantage of being simple. The welfaredecomposition technique applied also enables interpretation of simulation results inaccordance with the insights of standard trade theory. The technique proves to beparticularly useful in evaluating the terms of trade effect of trade liberalisation; an issuewhich has been prominent in the debate over the virtues of unilateral and concerted tradeliberalisation in the context of APEC.
Table 13 Welfare results for ASEAN with different elasticities of substitution (US$ billion)
Elasticities ASEAN Developing Japan North Rest of theAsia America world
(1) (2) (3) (4) (5)EV Low 4.2 3.3 4.3 2.7 5.0
High 22.5 48.9 50.2 44.1 56.9
Allocative Low 14.4 13.4 13.5 13.4 14.1High 33.5 66.7 67.0 68.8 77.0
TOT Low -10.3 -10.1 -9.3 -10.7 -9.1High -11.0 -17.8 -16.9 -24.7 -20.1
Source: Simulations of the GTAP model, database version 3.

Who gains and who loses from unilateral and concerted trade liberalisation?, DI00-3 25© Asia Pacific Press 2000
Overall, the results are broadly sympathetic to the APEC strategy of concertedunilateral liberalisation, whilst pointing out its difficulties. It is shown that even though aregion may experience a terms of trade deterioration from unilateral trade liberalisation,this can be avoided if there is concerted liberalisation by a sufficiently large number ofcountries/regions. Alleviation of the terms of trade problem is also helped by choosingliberalisation partners with a complementary rather than a competitive trade structure. Thestudy has not, however, explicitly examined the ‘free-rider’ problem identified by Bergsten(1997), namely the possibility that outsiders will gain more than participants fromconcerted liberalisation. Large welfare gains to non-participating regions in the simulationresults and research elsewhere suggest that such a problem is important (Sinclair andVines 1997; Yang et al. 1998). In most cases, however, a large proportion of the benefitfrom concerted trade liberalisation does seem to accrue to participating economies. Thus,incentives to participate in concerted liberalisation remain in spite of the free-rider problem.
Notes1 These terms tend to be unimportant in this version of the model, which to a large extent links the price ofregional savings to that of regional investment.2 Basic manufactured goods account for a large proportion of Australasia’s exports, but their volumes aresmall by world standards (Table A1)3 On the import side, even though Japan is a large importer of crops and livestock products (Appendix TableA5), its trade liberalisation leads to only moderate increases in the import prices of these products.4 North America’s GDP was 18 times that of ASEAN in 1992 on the basis of a market exchange rate comparison.5 The symmetrical treatment is often found in models associated with James de Melo, Sherman Robinson andtheir colleagues (see, for example, de Melo and Robinson (1989)). An alternative approach to such treatmentwould be product differentiation involving economies of scale and imperfect competition. See Helpman andKrugman (1985) for a synthesis of various models following this approach. For a useful survey of modelsincorporating economies of scale and perfect competition see Francois and Roland-Holst (1997).
References
Armington, P.S., 1969. ‘A theory of demand for products distinguished by place ofproduction’, IMF Staff Papers, 14:159–78.
Bergsten, C.F., 1997. ‘Open regionalism’, Institute of International Economics,Washington, DC (mimeo).
de Melo, J. and Robinson, S., 1989. ‘Product differentiation and the treatment of foreigntrade in computable general equilibrium models of small economies’, Journal ofInternational Economics, 27(1–2):47–67.
Drysdale, P. and Vines, D. (eds), 1998. Europe, East Asia and APEC: a shared globalagenda?, Cambridge University Press, Cambridge.
Francois, J.F. and Roland–Holst, D.W., 1997. ‘Scale economies and imperfectcompetition’, in J.F. Francois and K.A. Reinert (eds), Applied Methods for TradePolicy Analysis, Cambridge University Press, Cambridge:331–63.

Who gains and who loses from unilateral and concerted trade liberalisation?, DI00-3 26© Asia Pacific Press 2000
Francois, J.F., McDonald, B. and Nordstrom, H., 1997. ‘The Uruguay Round: a globalgeneral equilibrium assessment’, in D. Robertson (ed.), East Asian Trade afterthe Uruguay Round, Cambridge University Press, Cambridge:101–30.
Garnaut, R., 1996. Open regionalism and trade liberalisation, Allen and Unwin, Sydney.
Gehlhar, M., 1994. Economic growth and trade in the Pacific rim: an analysis of tradepatterns, Doctoral dissertation, Purdue University, West Lafayette, USA.
Harrison, W.J. and Pearson, K.R., 1996. ‘Computing solutions for large generalequilibrium models using GEMPACK’, Computational Economics, 9:83–27.
Harrison, G.W., Rutherford, T.F. and Tarr, D., 1996. ‘Quantifying the Uruguay Round’, inW. Martin and A.L. Winters (eds), The Uruguay Round and the DevelopingCountries, Cambridge University Press, Cambridge:216–54.
Helpman, E. and Krugman, P.R., 1985. Market Structure and Foreign Trade: increasingreturns, imperfect competition, and the international economy, MIT Press,Cambridge, Massachusetts.
Hertel, T.W. (ed.), 1997. Global Trade Analysis: modeling and applications, CambridgeUniversity Press, Cambridge.
—— and Tsigas, M.E., 1997. ‘The structure of the GTAP model’ in T.W. Hertel (ed.),Global Trade Analysis Using the GTAP Model, Cambridge University Press,Cambridge:13–73.
——, Ianchovichina E. and McDonald, B., 1998. ‘Multiregion general equilibriummodeling’, in: J.F. Francois and K.A. Reinert (eds.), Applied Methods for TradePolicy Analysis, Cambridge University Press, Cambridge:258–99.
Huff, K.M. and Hertel, T.W., 1996. Decomposing welfare change in the GTAP model,GTAP Technical Paper 5, Center for Global Trade Analysis, Purdue University,West Lafayette, USA.
McDougall, R.A. (ed.), 1997. Global Trade, Assistance, and Protection: the GTAP 3 database, Centre for Global Trade Analysis, Purdue University, West Lafayette, USA.
Sinclair, P. and Vines, D., 1997. Asia-Pacific open regionalism and the free rider problem:can a free trade club be both promising and attractive?, Paper presented at aseminar in the Department of Economics, Research School of Pacific and AsianStudies, Australian National University, Canberra.
Yang, Y., Duncan, R.C. and Lawson, T., 1998. ‘Trade liberalisation in the European Unionand APEC: what if the approaches were exchanged?’, in P. Drysdale and D. Vines(eds), Europe, East Asia and APEC: a shared global agenda?, CambridgeUniversity Press, Cambridge:161–94.

Who gains and who loses from unilateral and concerted trade liberalisation?, DI00-3 27© Asia Pacific Press 2000
Appendix: statistical tables
Table A1 The Armington elasticities of substitution in the central scenario
Between imports Among sourcesand domestic products
Crops 4.4 8.8Livestock 4.9 9.3Natural resources 5.6 11.2Processed food 4.9 9.9Textiles 6.6 14.0Basic manufactures 4.5 9.0Automobiles 7.1 14.0Other manufactures 5.6 11.2Services 3.9 7.6
Source: Modified GTAP elasticities based on database version 3.
Table A2 Export composition of the model economies, 1992 (percentage of total)
AUS NAM JPN NIE ASN CHN SAS EU ROW WorldCrops 6 4 0 1 6 4 9 1 5 3Livestock 18 1 0 1 1 2 1 1 1 1Natural resources 24 4 0 1 17 6 13 2 30 10Processed food 4 3 0 2 7 4 4 3 4 3Textiles 2 2 2 18 14 34 39 5 6 7Basic manufactures 20 21 15 19 16 14 10 25 22 21Automobiles 7 40 66 38 24 15 5 33 14 33Other manufactures 1 2 6 6 4 8 2 2 1 3Services 17 22 10 15 12 13 18 27 16 19Total 100 100 100 100 100 100 100 100 100 100
Notes: AUS–Australasia; NAM–North America; JPN–Japan; NIE–Newly Industrialised Economies;ASN–ASEAN; CHN–China; SAS–South Asia; EU–European Union 15; ROW–Rest of WorldSource: GTAP database version 3.
Table A3 Import composition of the model economies, 1992 (percentage of total)
AUS NAM JPN NIE ASN CHN SAS EU ROW WorldCrops 1 2 4 3 3 3 5 3 4 3Livestock 0 1 3 2 1 1 2 1 2 2Natural resources 4 9 23 10 5 4 20 12 5 10Processed food 3 2 4 3 2 2 3 3 4 3Textiles 6 8 6 7 5 14 6 8 7 8Basic manufactures 24 19 17 22 26 30 27 21 23 21Automobiles 36 41 14 37 40 38 23 27 33 32Other manufactures 3 4 2 2 2 2 1 3 2 3Services 22 14 26 14 15 6 13 22 19 18Total 100 100 100 100 100 100 100 100 100 100
Source: GTAP database version 3.

Who gains and who loses from unilateral and concerted trade liberalisation?, DI00-3 28© Asia Pacific Press 2000
Table A4 World export market shares of the model economies, 1992 (percentage of worldexports)
AUS NAM JPN NIE ASN CHN SAS EU ROW WorldCrops 4 32 0 2 9 4 4 11 34 100Livestock 23 22 0 3 2 4 0 24 20 100Natural resources 5 10 0 1 7 2 2 6 67 100Processed food 2 21 1 5 9 4 1 28 28 100Textiles 1 6 4 22 8 14 7 20 19 100Basic manufactures 2 22 8 8 3 2 1 32 23 100Automobiles 0 26 23 10 3 1 0 27 9 100Other manufactures 0 14 23 18 7 9 1 20 9 100Services 2 24 6 7 3 2 1 38 18 100Total 2 21 11 9 4 3 1 27 21 100
Source: GTAP database version 3.
Table A5 World import market shares of the model economies, 1992 (percentage of worldimports)
AUS NAM JPN NIE ASN CHN SAS EU ROW WorldCrops 1 13 12 9 4 3 2 27 31 100Livestock 1 14 17 11 3 2 1 21 30 100Natural resources 1 20 21 9 2 1 3 32 12 100Processed food 2 17 10 9 3 2 1 25 32 100Textiles 2 24 7 8 3 5 1 28 22 100Basic manufactures 2 20 7 9 5 4 2 27 24 100Automobiles 2 28 4 10 5 3 1 23 24 100Other manufactures 2 33 7 7 3 2 0 28 18 100Services 2 17 13 7 3 1 1 32 24 100Total 2 22 9 9 4 3 1 27 23 100
Source: GTAP database version 3.