whither the click? how oniine advertising works · whither the click? how oniine advertising works...
TRANSCRIPT

Whither the Click?
How Oniine Advertising Works
GIAN M. FULGONI
comScore, Inc.
MARIE PAULINE MORN
comScore, Inc.
Online advertising spending In the United States exceeds $20 billion annually.
However, click rates on display advertisements average oniy 0.1 percent. Are iow
ciick rates evidence that display advertisements have no impact on consumer
behavior? Or, does dispiay advertising work in a manner simiiar to traditional
"branding" advertising, with multiple exposures being required to effect a change
in consumer behavior? This article shows that the click is not an accurate indicator
of the effectiveness of online display advertisements. Even when click rates are
minimal, display advertisements can generate meaningfui increases in site visitation,
trademark search, and both oniine and offline sales.
BACKGROUND
In today's economically challenging times, adver-
tisers and their agencies appear to be moving
their online display advertising dollars from cus-
tomer relationship management campaigns that
require payment based on the number of people
exposed to the campaign to "pay-for-performance"
programs {"CPC" or "CPA") that require payment
when the consumer performs some desired action
such as clicking on an advertisement.
At the same time, however, research is showing
that a click may not be a relevant measure of the
impact of display advertising. Click rates on static
display advertisements fell dramatically in recent
years, to average levels of only 0.2 percent in
2006. The comScore studies referenced in this ar-
ticle show that average click rates on display
advertisements in 2008 fell even further, to less
than 0.1 percent. Other research conducted in Eu-
rope has shown similar very low click rates (eMar-
keter, 2009). Further research has shown that 6
percent of the online population accounts for 50
percent of all clicks and that heavy clickers are not
representative of the total online population, skew-
ing heavily toward the 25-44 age group and to
households with an income less than $40,000
(Starcom Media Vest Group Press Release, 2008).
Are low click rates evidence that an advertise-
ment has not had any impact on consumer behav-
ior? Or, does online display advertising work in a
similar manner to traditional offline advertising,
with multiple exposures over time being needed
to effect a change in consumer behavior?
The results presented in this article will show
the manner in which online display advertise-
ments work in affecting consumer behavior, re-
vealing that there are, indeed, latency effects,
branding effects, and sales lifts—even when click
rates are minimal.
DESCRIPTION OF DATA SOURCES AND STUDIES
CONDUCTED
This article references results from more than 170
online advertising effectiveness studies conducted
by comScore. comScore has built a unique market-
research database consisting of two million global
internet users (one million of whom are residents
in the United States) who have explicitly agreed
to the tracking of their orüine behavior. For each
panelist, software was installed on his/her com-
puter to unobtrusively capture the details of their
internet activities, including every site visited, con-
tent viewed, content entered, time spent, product
or service bought, and price paid. Every display
1 3 4 JDUHnHL DF HDUEHTISIHG RiSEReCIJ June 2 o o g DOI: 10.2501/S0021849909090175

HO\N ONLINE ADVERTISING WORKS
EMPIRICAL GENERALIZATIONSEven with no clicks or minimal clicks, online display advertisements can generate
substantial lift in site visitation, trademark search queries, and lift in both online and
offline sales.
and search advertisement that was re-
ceived by the panelists was also captured,
including whether the advertisement was
clicked on or not.
The panel was statistically weighted and
projected using a variety of demographic
•ind behavioral variables to represent the
internet user population, and the data
have been validated through comparisons
to third-party data. (One such compari-
son is to the U.S. Department of Com-
merce quarterly estimates of e-commerce
sales, see Figure 1.)
The database was encrypted for com-
plete privacy protection, and no person-
ally identifiable information was released.
The data were matched (using name
and address) with third-party offline
databases producing a "single-source"
datamart that contained both online and
offline behavior. Panelists had the option
of completing customized surveys deliv-
ered to them either via email or by a
"contextual pop" on their computer screen
during their time in the panel triggered
by their online behavior—such as visit-
Q2 2008 comScore: $34.8 BillionQ2 2008 DOC: $34.6 Billion
$45.0
$40.0
$35.0-
$30.0
I $25.0
^ $20.0
r •
rnim i l I
iiiiiiiii I
lQ 3Q lQ 3Q lQ 3Q lQ 3Q lQ 3Q lQ 3Q lQ 3Q lQÜl '01 '02 '02 '03 '03 '04 '04 '05 '05 '06 '06 '07 '07 '08
I U.S. Department of Commerce • comScore
comScore Estimate = (Total Nontravel - Event Tickets + Estimated Auction Fees)
Figure 1 Validation of comScore Sales Data: Comparison ofcomScore Data to U.S. Department of Commerce
ing a certain site or viewing specificcontent.
RESEARCH DESIGN
To maximize accurate identification of a
specific campaign that was being tracked
as part of a study, advertising agencies
and/or publishers that were involved in
online advertising were provided with a
tag, which was appended to the display
advertisement. This allowed for the sys-
tematic and accurate identification of the
consumers who were exposed to a spe-
cific advertisement. Depending on the spe-
cific requirements of the project, the tag
also may have included parameters for
segmentation purposes, such as an iden-
tification of the site that published the
advertisements and the type of creative
message used.
Test groups: Based on passively ob-served exposure to an advertisement, atest group of panelists exposed to thecampaign was generated. Test cells couldvary depending on the specific objectivesof the campaign and could be mixed andmatched accordingly.
Control group: A control group of pan-elists not exposed to the campaign alsowas generated. This group had no expo-sure to the advertisements, but exhibitedthe following characteristics when com-pared to the test group(s):
• similar historical usage of the internet
overall;
• similar historical visitation to the sites
where the advertisements were in
rotation;
• similar historical total search behavior
online;
• similar distribution on the following
household demographics: age, income,
census region or residence, and connec-
tion speed;
• similar historical offline buying behav-
ior (if relevant to the study at hand).
June 2 0 0 9 J Q H L OF eDOERTISlOG BESEHIICH 1 3 5
HOW ONLINE ADVERTISING WORKS
With the exception of the exposure to the
online display advertising test campaign,
the test and control groups were virtually
identical, including their exposure to other
forms of media.
Passively collected behavioral data cap-
tured the view-through value of the over-
all campaign by measuring consumers'
internet activity across key behavioral met-
rics, This behavior was measured irrespec-
tive of whether an advertisement was
clicked on or not.
The database contains data and analysis
on more than 200 studies, of which certain
subsets are available for various types of
analysis. Results included in the database
were tested at a 90 percent confidence level
using a one-tail t-test. Reportable mea-
sures must also have minimum sample size
requirements, which vary depending on the
type of behavior being analyzed.
DETAILED RESULTS
The impact of display advertisements on
visitation to an advertiser's site
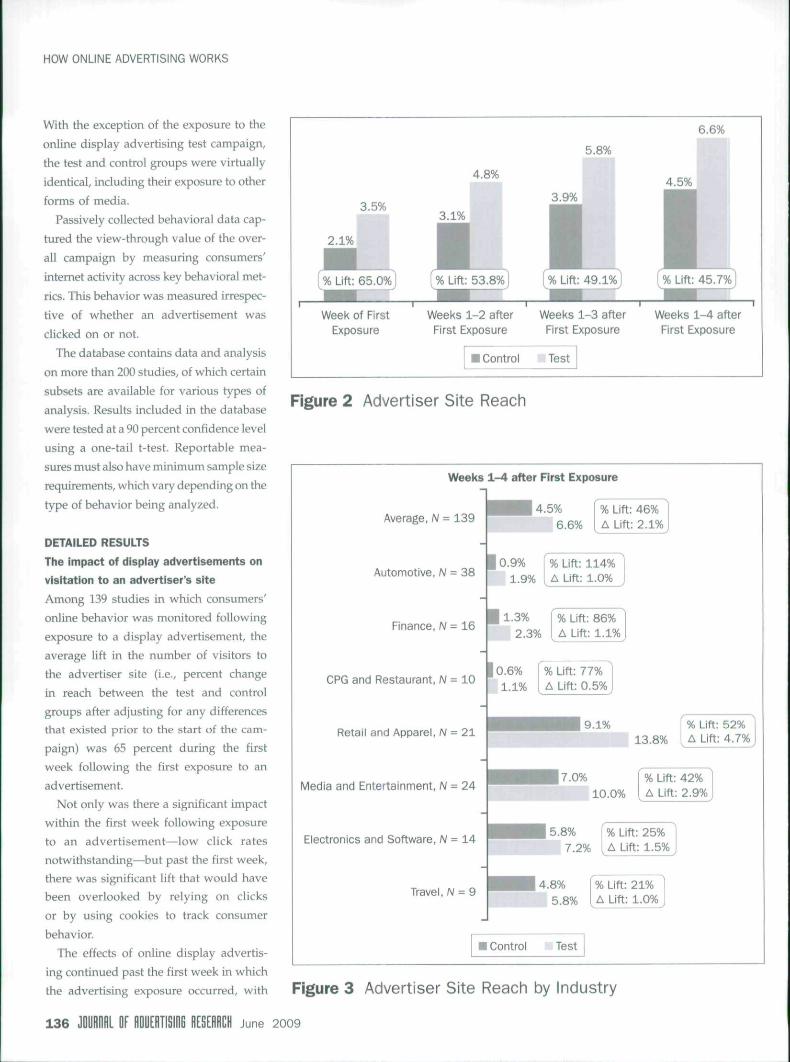
Among 139 studies in which consumers'online behavior was monitored followingexposure to a display advertisement, theaverage lift in the number of visitors tothe advertiser site (i.e., percent changein reach between the test and controlgroups after adjusting for any differencesthat existed prior to the start of the cam-paign) was 65 percent during the firstweek following the first exposure to anadvertisement.
Not only was there a sigrüficant impactwithin the first week following exposureto an advertisement—low click ratesnotwithstanding—but past the first week,there was significant lift that would havebeen overlooked by relying on clicksor by using cookies to track consumerbehavior.
The effects of online display advertis-ing continued past the first week in whichthe advertising exposure occurred, with
3.5%
2.1%
í% Lift: 65.0%^ '
1 ^ ^ ^
Week of FirstExposure
5.8%
4.8%
3.9%
1 1[%Uft: 53.8%] {% Lift: 49.1%]
1 ^ ^ ^ 1 1
Weeks 1-2 after Weeks 1-3 after \First Exposure First Exposure
• Control Test
6.6%1
4.5%•^% Lift: 45.7%]
A/eeks 1-4 afterFirst Exposure
Figure 2 Advertiser Site Reach
Weeks 1-4 after First Exposure
Average, N = 1394.5%
6.6%% Lift: 46%A Lift: 2.1%
Automotive. N = 38
Finance, N = lQ
CPG and Restaurant, N = 10
Retail and Apparel, N = 21
Media and Entertainment, N = 24
Electronics and Software, N = 14
Travel, N = 9
0.9% I % Lift: 114%1.9% A Lift: 1.0%
1.3% % Lift: 86%2.3% A Lift: 1.1%
0.6% % Lift: 77%1.1% A Lift: 0.5%
9.1%13.8%
% Lift: 52%A Lift: 4.7%
7.0% % Lift: 42%10.0% A Lift: 2.9%
5.8% % Lift: 25%7.2% A Lift: 1.5%
4.8% % Lift: 21%5.8% A Lift: 1.0%
I Control Test
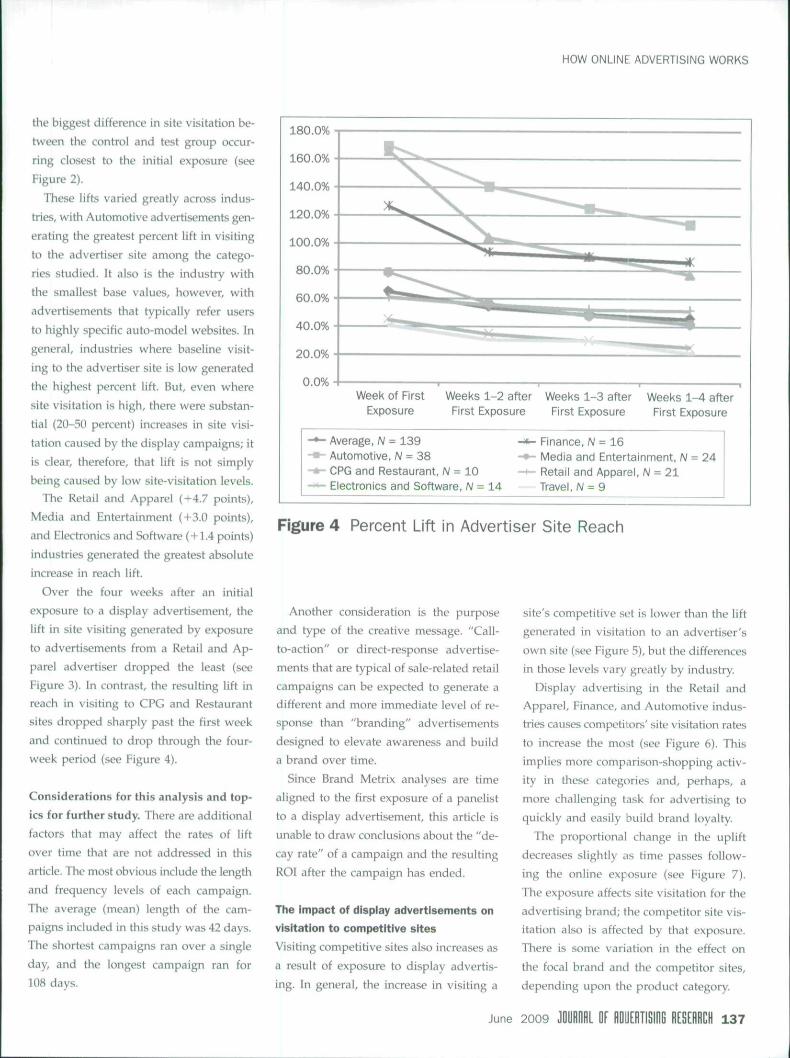
Figure 3 Advertiser Site Reach by Industry
1 3 6 JQUmiHL Oí HDUEßllSlOB June 2009
HOW ONLINE ADVERTISING WORKS
the higgest difference in site visitation be-
tween the control and test group occur-
ring closest to the initial exposure (see
Figure 2).
These lifts varied greatly across indus-
tries, with Automotive advertisements gen-
erating the greatest percent lift in visiting
to the advertiser site among the catego-
ries studied. It also is the industry with
the smallest base values, however, with
advertisements that typically refer users
to highly specific auto-model websites. In
general, industries where baseline visit-
ing to the advertiser site is low generated
the highest percent lift. But, even where
site visitation is high, there were substan-
tial (20-50 percent) increases in site visi-
tation caused by Ihe display campaigns; it
is clear, therefore, that lift is not simply
being caused by low site-visitation levels.
The Retail and Apparel (+4.7 points).
Media and Entertainment {+3.0 points),
and Electronics and Software (+1.4 points)
industries generated the greatest absolute
increase in reach lift.
Over the four weeks after an initial
exposure to a display advertisement, the
lift in site visiting generated by exposure
to advertisements from a Retail and Ap-
parel advertiser dropped the least {see
Figure 3). In contrast, the resulting lift in
reach in visiting to CPG and Restaurant
sites dropped sharply past the first week
.ind continued to drop through the four-
week period (see Figure 4).
Considerations for this analysis and top-
ics for further study. There are additional
factors that may affect the rates of lift
over time that are not addressed in this
article. The most obvious include the length
and frequency levels of each campaign.
The average (mean) length of the cam-
paigns included in this study was 42 days.
The shortest campaigns ran over a single
day, and the longest campaign ran for
108 days.
180.0%
160.0%
20.0%
0.0%Week of First Weeks 1-2 after Weeks 1-3 after Weeks 1-4 after
Exposure First Exposure First Exposure First Exposure
- ^ Average, iV = 139•«- Automotive, N = 38-•*- CPG and Restaurant, N = 10— Electronics and Software, N =
Finance. W = 16Media and Entertainment, N = 24Retail and Apparei, N = 21Travel, N = 9
Figure 4 Percent Lift in Advertiser Site Reach
Another consideration is the purposeand type of the creative message. "Call-to-action" or direct-response advertise-ments that are typical of sale-related retailcampaigns can be expected to generate adifferent and more immediate level of re-sponse than "branding" advertisementsdesigned to elevate awareness and builda brand over time.
Since Brand Metrix analyses are timealigned to the first exposure of a panelistto a display advertisement, this article isunable to draw conclusions about the "de-cay rate" of a campaign and the resultingROI after the campaign has ended.
The impact of display advertisements on
visitation to competitive sites
Visiting competitive sites also increases as
a result of exposure to display advertis-
ing. In general, the increase in visiting a
site's competitive set is lower than the liftgenerated in visitation to an advertiser'sown site (see Figure 5), but the differencesin those levels vary greatly by industry.
Display advertising in the Retail andApparel, Finance, and Automotive indus-tries causes competitors' site visitation ratesto increase the most (see Figure 6). Thisimplies more comparison-shopping activ-ity in these categories and, perhaps, amore challenging task for advertising toquickly and easily build brand loyalty.
The proportional change in the upliftdecreases slightly as time passes follow-ing the online exposure (see Figure 7).The exposure affects site visitation for theadvertising brand; Ihe competitor site vis-itation also is affected by that exposure.There is some variation in the effect onthe focal brand and the competitor sites,depending upon the product category.
June 2009 M M l OF fiOOEflTISIIlG RESÍñflCH 1 3 7
HOW ONLINE ADVERTISING WORKS
16.6%14.9%
12.Í13.5%
12.1%
9.7% 10.3%
7.7% LWeek of First
ExposureWeeks 1-2 after
First ExposureWeeks 1-3 after
First ExposureWeeks 1-4 afterFirst Exposure
I Control Test
Figure 5 Competitive Site Reach
10.0%
0.0%Week of First
ExposureWeeks 1-2 afterFirst Exposure
Weeks 1-3 afterFirst Exposure
Weeks 1-4 afterFirst Exposure
Average, N = 117Automotive. N = 40CPG and Restaurant, N = 7Electronics and Software, N = 16
Finance, N = lAMedia and Entertainment. N = 12Retail and Apparel, N = 16Travel, N = 6
Figure 6 Percent Lift in Competitive Site Reach
The impact of display advertisements on
brand, generic, and competitive searches
A relatively small percentage of users ex-posed to an online display advertisement
subsequently conduct a search using anadvertiser's Trademark/Brand term (seeFigure 8). This dynamic is important, how-ever, because of the synergy between dis-
play advertisements and search (see below)
and because a trademark or a brand search
can be a significant indicator of purchase
intent (Google and comScore, 2006).
Exposure to a display advertisement
generated a greater average lift in search
reach (percent of users conducting a search
query) using generic terms rather than
trademark/brand searches (see Figure 9).
This may seem counterintuitive, but it
does not necessarily follow that display
advertising is ineffective or inefficient in
generating searches that may eventually
lead to a purchase. Research has shown
that the majority of prepurchase search
activity (both in terms of searches and
clicks) actually involved generic terms,
not the merchants' brands (DoubleClick
Research, 2005). The percent lift in the
percent of users who searched using a
competitive brand term typically tracked
well below that of brand and generic
searches (see Figure 10).
Over the studies where these types of
searches were tracked after exposure to a
display advertisement, we see that the
largest lifts in reach were among users
who made a search using a generic term
related to the category of the display
advertiser.
The impact of display advertisements
on sales
For eCommerce sites, it has long been achallenge to quantify the impact of onlineadvertising on sales. Because click ratesare so low, it is commonly known that apurchase rarely takes place during thesame session as an exposure to an adver-tisement, and even more rarely as a resultof a click. It is therefore critical to observethe latent effects of advertising exposureon purchasing, which often extend to daysor even weeks beyond the exposure. Thishas historically been difficult to measurebecause the deletion of cookies by inter-net users (30 percent per month) means
1 3 8 JOUHUHL or flDUERTISHlG fttSEHRCII June 2 0 0 9

HOW ONLINE ADVERTISING WORKS
200.0%
150.0%
100.0%
50.0%
0.0%
200.0%
150.0%
100.0%
50.0%
0.0%
70.0%60.0%50.0%40.0%30.0%20.0%10.0%
0.0%
Average
A 39%29%
25% 22%
Week1
Week1-2
Week Week1-3 1-4
70.0%60.0%50.0%40.0%30.0%20.0%10.0%
0.0%
Retail and Apparel
A 4% 4% 6%Week
1Week Week Week
1-3 1-4
Automotive
i.132%-102%
79%
Week1
Week1-2
Week1-3
Week1-4
140.0%120.0%100.0%
80.0%60.0%40.0%20.0%
0.0%
Finance Travei
6C%
41.%
Week1
Week1-2
Week Week1-3 1-4
140%
Food
: ^
and
3%*
CPG Media and Entertainment Eiectronics and Software
Week1
Week1-2
Week1-3
Week1-4
Week1
Week1-2
Week Week1-3 1-4
Advertiser Comp Set Points Difference
Figure 7 Advertiser versus Competitive Set Percent Lift in Site Reach
0.3%
0.2%
%üf t : 52.3%]
r ^Week of First
Exposure
0.5%
n(% Lift: 46.0%'
T ^ rWeeks 1-2 after
First Exposure
• Oontrol
0.7%
0.5%
1[% Lift: 40.3%]
— ^ 1Weeks 1-3 after
First Exposure
Test
0.9%
0.6%
[% Lift; 38.1%]
1 ^ 1Weeks 1-4 after
First Exposure
Figure 8 Percent Making a Trademark or Brand Search
that cookies cannot be used to accuratelytrack the behavior of computers over time(comScore Press Release, 2007).
For bricks-and-mortar retailers, the chal-lenge extends even further, to the necessityof quantifying the effects of online adver-tising on offline sales. The magnitude ofthe lift in offline sales generated by onlineadvertising is significant and would cer-tainly not be captured by a pay-per-clickcookie-based measurement approach. Thecurrent lack of visibility into offline pur-chasing consistently leads to dramatic un-derestimation of display advertising ROL
In examining the impact of displayadvertisements on buyer penetration
June 2 0 0 9 JQUROIJL OF HDUERTiSiHG RESEHHCIJ 1 3 9

HOW ONLINE ADVERTISING WORKS
0.6%
0.3%
[% Lift: 68.7%J
r — ^Week of First
Exposure
0.9%
0.6%
[% Lift: 58.0%)
1 ^ r
Weeks 1-2 afterFirst Exposure
• Control
1.3%
0.8%••(%Üft:52.7%J
— ^ ^ ^ — — 1
Weeks 1-3 afterFirst Exposure
Test
1.5%
1.0%
H[% Lift: 47.4%J
1 ^ ,
Weeks 1-4 afterFirst Exposure
Figure 9 Percent Making a Generic Search
1.2% ^'^°'^°
, ^ .%L in : 13.6%
••r—1 — ^
Week of FirstExposure
2.1%1.9%
1,^M ,%Lift: 10.2%
• • 1—1 ^ rWeeks 1-2 afterFirst Exposure
• Control
2.7%2.4%
IIr ^ .[%Lift: 10.5%J
— ^ 1Weeks 1-3 after
First Exposure
Test
3.2%2.9%
1I( % Lift: 9^9%)
1 ^ rWeeks 1-4 afterFirst Exposure
Figure 10 Percent Making a Competitive Search
(see Figures 11 and 12), we see that the
percentage lift is much higher online
than offline, with an average onUne
buyer penetration lift of 42.1 percent,
compared to a lift of 10.1 percent in
offline buyer penetration. However,
because the bases are larger for offline
purchasing, the net impact in new or
additional buyers is larger offline than
online.
Per-buyer purchasing both on- and off-
line show minimal gains (see Figure 13).
The synergistic Impact of display and
search advertisements on saies
In this series of studies, we examined
the impact of search and display sepa-
rately as well as in combination. The im-
pact of search advertisements alone on
consumers' buying behavior was found
to be clearly greater than that of display
advertisements alone. This is true both
in terms of the advertisements' impact
on online buying as well as the impact
on offline sales. This is not surprising
(% Lift: 42.1%)
1.0% ^-^^
^ - ^ r-
Online
• Control
(%
JLift: 10.1%)
. , «
Offline
Test
Figure H Buyer Penetration
(% Lift: 27.1%)
$994$1,263. ^ r-
Online
• Control
(%
$9
JLift: 16.6%)
$11.550,905•L
OfflineTest
Figure 12 Dollars perThousand Exposed
( % Lift: 1.4% )
$105 $106
Online
• Control
' % Lift: 3.5% )
$130$134
Offline
Test
Figure 13 Dollars per Buyer
because consumers responding to search
advertisements are much more likely to
be "in the market" for buying the adver-
tised product.
1 4 0 JOÜRflfiL OF flOyERTISIflG (lESEflflCH June 2 0 0 9
HOW ONLINE ADVERTiSiNG WORKS
It must be remembered, however, that
the reach of display advertisements is typ-
ically much higher than that of search
advertisements. For example, in the stud-
ies conducted, approximately 81 percent
of the consumers who saw an advertise-
ment received only a display advertise-
ment, while a much lower 8 percent
received only a search advertisement.
When the lift factors are weighted by the
reach of a campaign, display advertise-
ments typically emerge as being able to
generate a higher total lift in sales.
Conventional wisdom says that media
work best when multiple programs are
used together, and we do indeed see clear
synergies between search and display (see
Figure 14). Both in terms of the impact on
buyer penetration and dollar sales (per
thousand consumers exposed), it is clear
that the combination of search and dis-
play together is greater than the sum of
the impact of display and search adver-
tisements separately.
The effects of the combination of search
and display on in-store sales are equally
dramatic (see Figure 15). The incremen-
tal lift in buyer penetration generated by
the combination of search and display
advertisements is 4.8 points in-store,
compared to 3.2 points online. In terms
of dollars spent on a per-exposed user
basis, the combination's impact on off-
line sales clearly has the potential to make
a larger impact on a retailer's bottom
line.
EMPfRICAL GENERALIZATIONS AND
CONCLUSIONS
The empirical generalizations establishedin this research are as follows:
EGl: Even with no clicks or a mini-
mal click rate of 0.1 percent,
online display advertisements
can generate substantial lift in
site visitation, trademark search
%
1.0% ^-^^
Display Only
( % Lift: +42% )
$994 $1,263
Display Only
( % Lift: +27% )
Making a Purchase on the Advertiser(Retail Only)
2.4%1.1%
Search Only
(% Lift: +121%)
Online $$ per 000 Exposed(Retail Only)
$2,724$1,548
Search Only
[ % Lift: +76% ]
• Control Test
Site
5.1%
1.9%
Search and Display
[% Lift: +173%]
$6,107
$2,723
Search and Display
[% Lift; +124%]
Figure 14 Search and Display Synergies Online
% Making a Purchase Offline(Retail Only)
14.0%
6.3% 6.9% 6.2%8.3% 9.2%
Display Only Search Only
% Lift:+10% 1 i% Lift:+35%
Search and Display
1 % Lift: +52%
Online $$ per 000 Exposed(Retail Oniy)
$23,597
$9,905 $11,550$14,371
$7,889 $10,783
Display Only
% Lift: +17%
Search Only
% Lift: +82%
Search and Display
Lift: +119%
I Control Test
Figure 15 Search and Display Synergies Offline
June 2009 L DF eDUERTISlOG RESeHRCH 1 4 1
HOW ONLINE ADVERTiSING WORKS
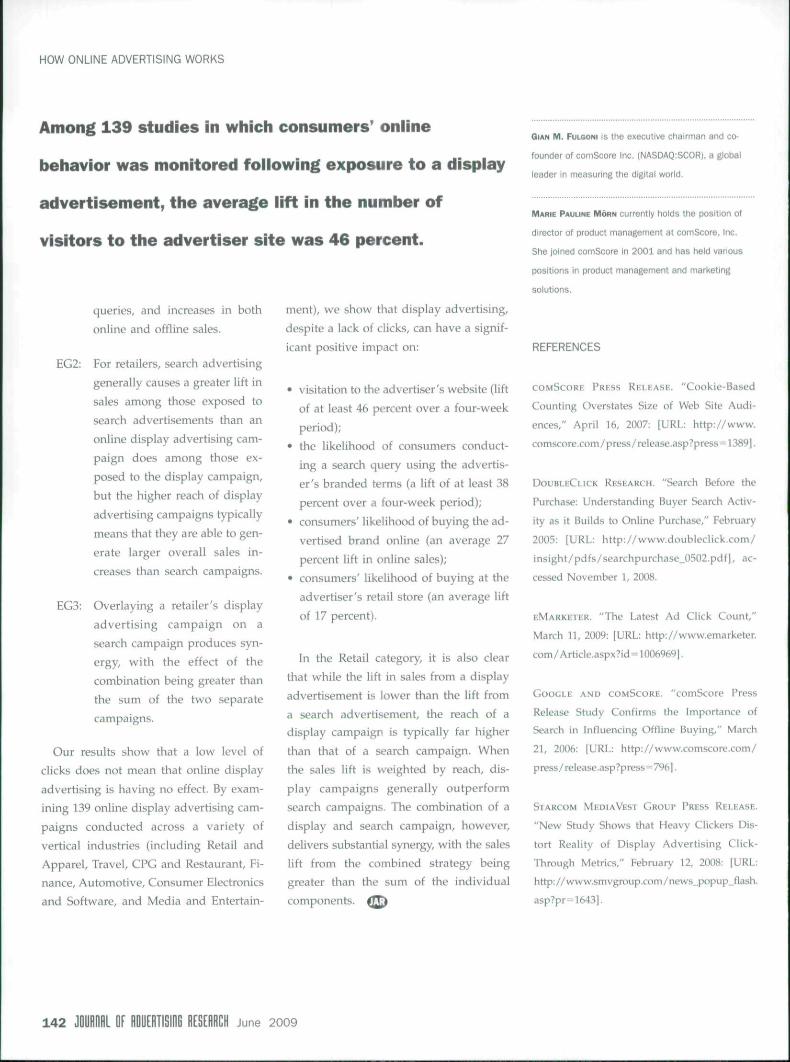
Among 139 studies in which consumers' oniine
behavior was monitored foiiowing exposure to a dispiay
advertisement, the average iift in the number of
visitors to the advertiser site was 46 percent.
queries, and increases in both
online and offline sales.
EG2: For retailers, search advertising
generally causes a greater lift in
sales among those exposed to
search advertisements than an
online display advertising cam-
paign does among those ex-
posed to the display campaign,
but the higher reach of display
advertising campaigns typically
means that they are able to gen-
erate larger overall sales in-
creases than search campaigns.
EG3: Overlaying a retailer's display
advertising campaign on a
search campaign produces syn-
ergy, with the effect of the
combination being greater than
the sum of the two separate
campaigns.
Our results show that a low level of
clicks does not mean that online display
advertising is having no effect. By exam-
ining 139 online display advertising cam-
paigns conducted across a variety of
vertical industries {including Retail and
Apparel, Travel, CPG and Restaurant, Fi-
nance, Automotive, Consumer Electronics
and Software, and Media and Entertain-
ment), we show that display advertising,
despite a lack of clicks, can have a signif-
icant positive impact on;
• visitation to the advertiser's website (lift
of at least 46 percent over a four-week
period);
• the likelihood of consumers conduct-
ing a search query using the advertis-
er's branded terms (a lift of at least 38
percent over a four-week period);
• consumers' likelihood of buying the ad-
vertised brand online (an average 27
percent lift in online sales);
• consumers' likelihood of buying at the
advertiser's retail store (an average lift
of 17 percent).
In the Retail category, it is also clear
that while the lift in sales from a display
advertisement is lower than the lift from
a search advertisement, the reach of a
display campaign is typically far higher
than that of a search campaign. When
the sales lift is weighted by reach, dis-
play campaigns generally outperform
search campaigns. The combination of a
display and search campaign, however,
delivers substantial synergy, with the sales
lift from the combined strategy being
greater than the sum of the individual
components,
GiAN M. FuLGONi is the executive chairman and co-
founder of comScore Inc. (NASDAQiSCOR). a global
leader in measuring the digital world,
MARIE PAUUNE MORN currently holds the position of
director of product management at comScore, Inc.
She joined comScore in 2001 and has held various
positions in product management and marketing
solutions.
REFERENCES
COMSCORE PRESS RELEASE. "Cookie-Based
Counting Overstates Size of Web Site Audi-
ences," April 16, 2007: [URL: http://www.
comscore.com/press/release.asp?press=1389I.
DOUBLECLICK RESEARCH. "Search Before the
Purchase: Understanding Buyer Search Activ-
ity as it Builds to Online Purchase," February
2005: [URL: http://www.doubleclick.com/
insight/pdfs/searchpurchase_0502.pdf], ac-
cessed November 1, 2008.
EMARKETER. "The Latest Ad Click Count,"
March U, 2009: [URL: http://www.emarketer.
com/Article.aspx?id = 1006969].
GOOGLE AND COMSCORE. "comScore Press
Release Study Confirms the Importance of
Search in Influencing Offline Buying," March
21, 2006: [URL: http://www.comscore.com/
press/release.asp?press=796].
STARCOM MEDIAVEST GROUP PRESS RELEASE.
"New Study Shows that Hea\y Clickers Dis-
tort Reality of Display Advertising Click-
Through Metrics," February 12, 2008: [URL:
http://www.smvgroup.com/news_popup_flash.
asp?pr=1643].
1 4 2 JDUROHL OF HDUEHÎI510G HESEaRCIJ June 2 0 0 g