which districts get into financial trouble and why: … · which districts get into financial...
TRANSCRIPT

WORKING PAPER #51
Which Districts Get Into Financial Trouble and Why: Michigan’s Story
David Arsen
Michigan State University
Thomas A. DeLuca Univeristy of Kansas
Yongmei Ni University of Utah
Michael Bates University of California, Riverside
November 2015
The content of this paper does not necessarily reflect the views of The Education Policy Center or Michigan State University

Author Information
David Arsen Professor, Department of Educational Administration College of Education, Michigan State University Thomas A. DeLuca Assistant Professor, Department of Educational Leadership & Policy Studies School of Education, University of Kansas Yongmei Ni Associate Professor, Department of Education Leadership & Policy College of Education, University of Utah Michael Bates Assistant Professor, Department of Economics University of California, Riverside
Abstract Like other states, Michigan has implemented a number of policies to change governance and administrative arrangements in local school districts deem to be in financial emergency. This paper examines two questions: (1) Which districts get into financial trouble and why? and (2) Among fiscally distressed districts, are there significant differences in the characteristics of districts in which the state does and does not intervene? We analyze factors influencing district fund balances utilizing fixed effect models on a statewide panel dataset of Michigan school districts from 1995 to 2012. We evaluate the impact of state school finance and choice policies, over which local districts have limited control, and local district resource allocation decisions (e.g., average class size, teacher salaries, and spending shares devoted to administration, employee health insurance, and contracted services). Our results indicate that 80% of the explained variation in district fiscal stress is due to changes in districts’ state funding, to enrollment changes including those associated with school choice policies, and to the enrollment of high-cost, special education students. We also find that the districts in which the state has intervened have significantly higher shares of African-American and low-income students than other financially troubled Michigan districts, and they are in worse financial shape by some measures.
Acknowledgments The work reported here was partially supported by the American Civil Liberties Union of Michigan (Arsen and Ni) and by the Institute of Education Sciences, U.S. Department of Education, through Grant R305B090011 to Michigan State University for a doctoral training program in the economics of education (Bates). We received excellent research assistance from Dongsook Han. The views expressed are those of the authors and not necessarily those of the Education Policy Center, Michigan State University, the ACLU or the U.S. Department of Education. An earlier version of this paper was presented at the 2015 annual conference of the Association for Education Finance and Policy.

1
Which Districts Get Into Financial Trouble and Why: Michigan’s Story
David Arsen Professor, Department of Educational Administration
College of Education, Michigan State University
Thomas A. DeLuca Assistant Professor, Department of Educational Leadership & Policy Studies
School of Education, University of Kansas
Yongmei Ni Associate Professor, Department of Education Leadership & Policy
College of Education, University of Utah
Michael Bates Assistant Professor, Department of Economics
University of California, Riverside
The work reported here was partially supported by the American Civil Liberties Union of Michigan (Arsen and Ni) and by the Institute of Education Sciences, U.S. Department of Education, through Grant R305B090011 to Michigan State University for a doctoral training program in the economics of education (Bates). We received excellent research assistance from Dongsook Han. The views expressed are those of the authors and not necessarily those of the Education Policy Center, Michigan State University, the ACLU or the U.S. Department of Education. An earlier version of this paper was presented at the 2015 annual conference of the Association for Education Finance and Policy.

2
Which Districts Get Into Financial Trouble and Why: Michigan’s Story
ABSTRACT
Like other states, Michigan has implemented a number of policies to change governance
and administrative arrangements in local school districts deem to be in financial emergency. This
paper examines two questions: (1) Which districts get into financial trouble and why? and (2)
Among fiscally distressed districts, are there significant differences in the characteristics of
districts in which the state does and does not intervene? We analyze factors influencing district
fund balances utilizing fixed effect models on a statewide panel dataset of Michigan school
districts from 1995 to 2012. We evaluate the impact of state school finance and choice policies,
over which local districts have limited control, and local district resource allocation decisions
(e.g., average class size, teacher salaries, and spending shares devoted to administration,
employee health insurance, and contracted services). Our results indicate that 80% of the
explained variation in district fiscal stress is due to changes in districts’ state funding, to
enrollment changes including those associated with school choice policies, and to the enrollment
of high-cost, special education students. We also find that the districts in which the state has
intervened have significantly higher shares of African-American and low-income students than
other financially troubled Michigan districts, and they are in worse financial shape by some
measures.
INTRODUCTION
Legislation in a growing number of states authorizes state governments to take over local
school districts experiencing financial emergencies (Anderson, 2012; Bowman, 2013 and 2011).

3
While the design and implementation of takeover statutes vary across states, school districts
often emerge from takeovers with increased fiscal stability (Oluwole & Greene, 2009), but they
seldom produce academic gains (Bowman, 2011).
In 2011, Michigan passed the Local Government and School District Accountability Act,
Public Act 4, which attracted national attention because of its strong provisions. For districts
deemed to be in financial emergencies, PA 4 empowered the governor to appoint an emergency
manager (EM). All powers and duties of the district superintendent and school board transfer to
the EM, who has authority to reshape academic programs, to nullify labor contracts, to open and
close schools, and to sell district assets (Arsen & Mason, 2013).1 In 2013, Michigan passed PA
96 which authorizes state officials to dissolve local districts deemed to be financially unviable. In
2015, the state passed “early warning” legislation (Public Acts 109-114) that increases local
education agencies’ financial reporting requirements and the state’s powers to intervene in the
budgeting of school districts with low fund balances. It also broadens the circumstances under
which an emergency manager may be appointed (Summers, 2015).
An underlying premise of Michigan’s recent laws to guide state intervention in instances
of local district financial distress is that the financial problems are due to poor or misguided
decision making by local district officials. The laws presume that local officials—central office
administrators and the elected board—fail to take necessary though perhaps difficult steps that
are needed to place their districts on sound financial footing. In order to resolve this problem, the
1 PA 4 supplanted PA 72 of 1990. The earlier act authorized the appointment of emergency financial managers with much more restricted powers. Michigan voters overturned PA 4 in the November 2012 general election in a referendum on the EM law. The state legislature responded quickly, passing a replacement law without holding hearings in either chamber. The governor signed PA 436 into law in December 2012. The new EM law preserves most of PA 4’s features, and includes an appropriation which under the Michigan Constitution makes it immune to repeal by referendum.

4
state must exercise more forceful oversight or supplant these local officials with better and more
empowered, state-appointed administrators.
Michigan offers an interesting case of a state with a highly centralized school finance
system in which the state sets per pupil funding levels for each district, and most operating
revenues follow students when they move among districts or charter schools. Districts have very
limited authority to raise additional tax revenues for school operations from local sources.
Consequently local responses to financial stress focus primarily on efforts to reduce spending.
Roughly ten percent of Michigan’s 550 districts had operating deficits at the end of each
fiscal year from 2012 to 2014. Thus far, three districts, each predominantly African-American
and urban, have been placed under an emergency manager’s control, including the state’s largest
district, Detroit Public Schools. Two more predominantly African-American districts were
dissolved soon after PA 96’s passage. State review teams have recently declared financial
emergency in two additional predominantly African-American, urban districts that are currently
operating under consent decrees.2 These recent laws and their implementation provide state
officials with much greater authority to reshape not only the finances and operations, but also the
educational programs in districts serving many of Michigan’s highest-need students. They
simultaneously greatly diminish the power of local citizens and educators in these districts to
shape education service provision.
This paper seeks to determine why some school districts fall into financial trouble. We
evaluate in particular the impact of a range of variables corresponding to state school finance and
school choice policies, on the one hand, and local district resource allocation decisions on the
2 Michigan’s emergency management law (PA 436 of 2012) permits school districts to negotiate agreements with the state treasurer to resolve financial emergencies, in lieu of, or before, an emergency manager’s appointment. This provision provides broad powers to the state treasurer and enhanced financial reporting and compliance conditions for the local district.

5
other. We also analyze whether among the state’s fiscally distressed districts there are
significant patterns in the demographic and financial characteristic of districts in which the state
does and does not initiate emergency intervention.
Although it has received limited attention, financial accountability could assume growing
prominence in the accountability movement. Legislation such as Michigan’s emergency
management law changes the politics of state intervention and governance reforms by providing
state officials greater legitimacy to intervene in local districts (Arsen & Mason, 2013). To be
viewed as legitimate, it is necessary to define the heart of the educational problem as
administrative incompetence or the failure of local democratic governance structures. The
legitimacy of state takeovers on academic grounds is sometimes undermined by concerns that
test-based accountability penalizes schools for failing to overcome disadvantages related to
students’ poverty over which they have little control. State takeovers of “academically failing”
districts might be criticized, therefore, as unfairly targeting districts that face the greatest
educational challenges or “blaming the victims” (McDermott, 2007).
In contrast, administrators and elected representatives in any local community, rich or
poor, can be expected to handle public funds honestly and competently. If local officials lack the
basic administrative competence to balance their budgets (like everyone else), it is hardly
surprising that they also lack the capability to educate their students. By framing school failure
in terms of financial accountability, state policy makers may undercut traditional education
actors’ legitimacy over academic affairs and establish more politically salient grounds for
changes in the control and operation of local schools.
Previous researchers have used a wide variety of concepts and measures to represent the
financial condition or stress of municipal governments (e.g., Trussel & Patrick, 2009 and Kloha,

6
Weissert, & Kleine, 2005) and school districts (e.g., Ammar, et al., 2005; Berney, 1982; DeLuca,
2006 and Smith, 1986). There is no consensus in the literature, however, about either how to
define fiscal stress or how to measure it. A primary object of past studies has been to identify
variables capable of predicting insolvency or serious financial imbalances so that corrective
actions might be taken.
This paper differs from past research in two key respects. First, we utilize fixed effects
methods to identity the causes of local fiscal stress, rather than factors that are correlated with it.
Second we apply them to an institutional context—one that is becoming more common
nationally--in which school funding is highly centralized at the state level and local districts have
limited discretion to raise operational revenue from local tax sources.3
MICHIGAN CONTEXT
Since the passage of Proposal A in 1994, Michigan has maintained one of the nation’s
most centralized funding systems for K-12 schools. Proposal A established a foundation system
which constitutes the primary source of discretionary operating revenues for all districts and
charter schools. Nearly all funding moves with students when they transfer to other districts or
charter schools, and local districts have very little discretion to raise additional tax revenues.
The horizontal equity of funding has improved under Proposal A; 80 percent of pupils are in
districts and charter schools that receive a foundation allowance at or within $500 of the state’s
minimum foundation allowance of $7,076 in 2014.4 State funding, however, is poorly adjusted
to compensate for the additional local costs of educating high-cost students, so the funding
system fares less well in terms of vertical equity (Addonizio & Kearney, 2012; Michigan State
3 In contrast to previous literature on local fiscal stress, changes in local district fiscal capacity (for instance, changes in taxable property value per pupil) have no direct bearing on operating revenues available to Michigan districts. 4 Throughout this paper, we refer to fiscal and academic years by the latter year, so, for example, the 2013-14 fiscal year is noted as 2014.

7
Board of Education, 2014).5 Funding for school facilities, by contrast, is unusually
decentralized; the state provides local districts with no state aid for facilities. They are funded
entirely by local property taxes (Arsen and Davis, 2006).
Michigan has high and growing participation rates in its two school choice programs--
charter schools and inter-district choice--especially in urban areas. Over 8 percent of Michigan’s
public K-12 students are enrolled in charter schools and over 7 percent participate in inter-district
choice. In a state-by-state review of conditions that are favorable to charter school growth, the
National Alliance for Public Charter Schools (2014) ranked Michigan third among states--after
Washington, DC and Louisiana--in its 2014 Health of the Public Charter School Movement
Rankings. The Alliance ranks Detroit second only to New Orleans among communities in terms
of its share of students attending charter schools (2013). Other Michigan cities are also among
the nation’s highest in local market charter participation. In recent years, the state’s charter
school policy implementation has been sharply criticized for poorly regulating the supply,
business operations, and quality of schools (Education Trust-Midwest, 2015; Detroit Free Press,
2014)
TRENDS IN FISCAL STRESS
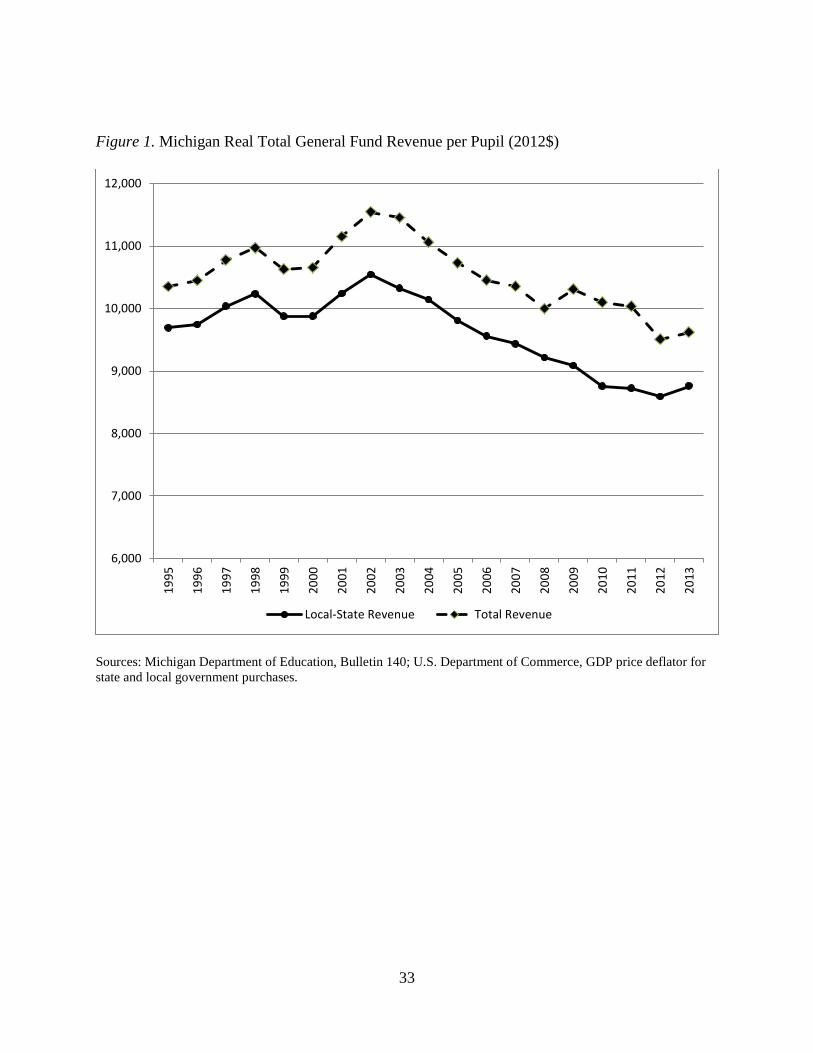
After rising for several years following Proposal A’s passage, real per-pupil funding for
Michigan schools has declined sharply since 2002. As indicated in Figure 1, adjusted for
inflation, statewide general fund revenue per-pupil has declined by roughly 25 percent since
2002.
[Figure 1 about here]
5 For example, the state reimburses only 28.6 percent of approved special education spending by local education agencies. The state, however, counts the general education per-pupil foundation grant for students with disabilities towards its special education funding obligation (Citizen’s Research Council of Michigan, 2012).

8
Whereas Figure 1 includes foundation and categorical funding, Table 1 displays changes
in foundation revenue alone since 2002. Foundation revenue is of particular interest since it
constitutes the primary source of discretionary funding available to Michigan districts and
charter schools. Categorical grants, by contrast, typically entail spending obligations and
restrictions on how these funds can be used. Table 1 displays changes in enrollment, per-student
foundation grants, and total foundation revenue by school district type.6 Most of the
improvement in the horizontal equity of per-pupil foundation grants occurred between 1994 and
2002. The narrowing of the per-pupil gap continued during the 2002-2013 period, as indicated,
for instance, by a larger gain in nominal per-pupil foundation grants in formerly low-spending
rural districts (9.2%) than high-income suburban districts (4.8%). For all community types,
however, the growth of per-pupil funding fell substantial shy of inflation, producing average
declines in real per-pupil foundation grants from 2002 to 2013 in excess of 25% in all district
groups.
The (nominal) per-pupil foundation grants of all Michigan districts remained unchanged
for three consecutive years from 2003 to 2005. By contrast, per-pupil funding declined for all
districts for three consecutive years after 2009. The state’s basic foundation allowance in 2013
was $470 below its level in 2009.
However, differential patterns of district enrollment change had a much more dramatic
impact on total foundation revenue available to local decision makers. Over a span of 11 years,
6 We define a five-way classification of school district community types. Central city districts are those that the National Center for Education Statistics (NCES) classifies as serving large cities and mid-sized cities. Rural includes districts classified by NCES as outside a metropolitan statistical area (MSA) plus those within an MSA with population density less than 20 people per square mile. Suburban district are those classified by NCES as “serving an MSA but not primarily its central city” and having population density greater than 20 people per square mile. The suburban classification is disaggregated based on median home value (MHV) in the 2000 U.S. Census--Low-income suburb: $32,500 <MHV< $75,000; Middle-income suburb: $75,001≤MHV<$170,000; High-income suburb: MHV≥$170,000. Low-income suburban districts are very similar to Michigan’s central cities in racial composition and student poverty rates.

9
Michigan’s central city districts on average lost a third of their enrollment, producing an average
decline of 21.6% in total foundation revenue, or a striking 46.5% revenue decline in real terms.
Meanwhile, enrollment growth mitigated the funding squeeze in high-income suburbs, despite
their slow growth in per-pupil funding. As indicated in the final column of Table 1, however,
average total real foundation revenue declined substantially over the last decade in all
community type groups.
[Table 1 about here]
One key indicator of the much tighter budgetary conditions faced by Michigan’s public
schools is the statewide decline in fund balances. As noted, negative or low fund balances are a
trigger for state intervention in local districts’ financial affairs under Michigan law. As indicated
in Figure 2, the aggregate fund balances for all Michigan districts and charter schools, adjusted
for inflation, have declined by over half since 2002, from $2.7 billion in 2002 to $1.0 billion in
2013. It is noteworthy that the shape of the aggregate fund balance trend in Figure 2 broadly
corresponds to the shape of the aggregate real per pupil funding trend in Figure 1.
[Figure 2 about here]
Although most Michigan districts have faced very tight budgetary circumstances over the
last decade, the increase in fiscal stress appears to vary by district characteristic. Figure 3, for
example, shows that the decline in fund balances is especially large and striking in districts with
high concentrations of African-American students. Since 2009, the average fund balance has
been negative (i.e. in deficit) for districts in which at least 40 percent of the students are African-
American. Remarkably, by 2012, the average fund balance as a percent of general fund revenues
in these districts was -15%.7
7 The trends for fund balance per pupil for districts grouped by student racial composition are very similar to those depicted in Figure 3.

10
[Figure 3 about here]
Another indicator of growing fiscal stress in Michigan school districts comes from
national credit rating agencies. Moody’s Investor Service noted that “[S]chool districts in the
State of Michigan have faced unprecedented fiscal stress over the past few years stemming from
direct funding cuts, enrollment declines and limited revenue and expenditure flexibility” (Butler,
2012, 1). It reported ratings downgrades in a quarter of Michigan school districts between 2009
and 2012, three times the rate for school districts nationwide, as well as multi-notch downgrades
during the same period at a rate six times the rate for districts nationwide. The report concluded
that “The outlook for the Michigan school district sector remains negative going forward.
Additional downgrades are likely to occur in the near term.” Indeed Moody’s has continued to
cut credit ratings for scores of Michigan districts during the current year of this writing (Lewis,
2015).
Even if most Michigan districts have faced tighter fiscal circumstances in recent years
requiring many to cut spending and draw down their fund balances, it does not necessarily follow
that instances of acute financial stress have dramatically increased in recent years. After all,
districts could implement expenditure reductions in a variety of ways to avoid deficits even as
real revenues decline. There has been a clear increase in the number of deficit districts over
time, however. Over each of the four years 1996 to 1999, eight Michigan districts on average
had end-of-fiscal-year general fund balance deficits, while from 2000 to 2013 an average of 42
districts were in deficit.
Table 2 offers further perspective on this uptick in district fiscal stress, by documenting
instances of districts with deficits in their general fund balances over the entire post-Proposal A
period. The table breaks the 19-year span into two sub-periods (1995-2004 and 2005-2013). If

11
the rate at which districts fall into deficit is constant between the two sub-periods, then the third
column in Table 2 should indicate that 48% of the district-by-year deficits occurred in the second
period. Yet Table 2 shows that the rate of districts falling into deficit for one, two, three or four
years has increased dramatically in the second period relative to the first. Likewise, as revealed
in the bottom panel of Table 2, there was a sharp increase during the latter period in the number
of districts with large deficits relative to their general fund revenues.
[Table 2 about here]
Given the relative frequency with which Michigan school districts have fallen into and
remained in deficit in recent years, it is perhaps worth noting that Michigan law specifies that “A
district or intermediate district receiving money under this act shall not adopt or operate under a
deficit budget, and district or intermediate district shall not incur an operating deficit in a fund
during a school year.” (MCL 388.1702(1)) Even though the law proscribes district administrators
and school boards from adopting deficit budgets, it also details how districts are to create deficit
elimination plans. These plans are submitted to and monitored by the state department of
education.
RESEARCH QUESTIONS
We set out to address the following research questions.
1. Which Michigan school districts get into financial trouble and why?
a. What is the relative role of districts’ resource allocation decisions versus factors
largely outside districts’ control?
2. Among districts that fall into sustained deficits, how do those in which the state
intervenes differ, in terms of their demographic and financial characteristics, from those
in which it does not?

12
METHODS AND DATA
Our empirical work to address Research Question 1 takes the form of explaining
variations in district fund balances, since under Michigan law, low fund balances and deficits are
the key triggers for state intervention. We focus on the districts’ general fund which includes all
financial transactions related to districts’ operations, except those required by law to be entered
in other funds, such as capital projects, long-term debt and food service. General fund revenues
and expenditure encompass the elements of district fiscal health in which we are interested. All
Michigan districts in which the state has staged emergency intervention have had serious
problems (deficits) in their general funds.
The balance on district i’s general fund in year t, FBit, is given by:
FBit = Revenueit – Expendituresit + FBit-1
Conceptually, therefore, we seek to model influences on district revenues, on the one hand, and
expenditures on the other. For revenues, we focus on districts’ per-pupil foundation funding and
other non-foundation funding which is comprised mostly of state and federal categorical
revenues. We also consider changes in enrollment which affects districts’ total revenue directly
through state funding formulas, but also may influence the relationship between district revenues
and expenditures. In Michigan, when a student leaves a district all funding associated with that
student is lost, but certain costs may be fixed in the short run so expenditures decline more
slowly than revenues. So revenues are likely to decline more rapidly than costs in declining-
enrollment districts.8 Consequently, declining-enrollment districts would be forced to reduce
8 The state’s pupil count for the allocation of state aid is based on a weighted average of enrollment on the second Wednesday in the previous February (10%) and first Wednesday in October in the current school year (90%). Districts losing a student any time between the previous February count day and the first October Wednesday of the current academic year will lose 90% of funding for that student in the current year.

13
services on remaining students or draw down their fund balances.9 In addition, we isolate the
influence of school choice policies on enrollment, since these enrollment shifts may impact
district finances differently than those associated with residential population change.
For expenditures, we focus on the density of high-cost students in districts. We also
examine a set of local district resource allocation decisions that directly influence expenditures
and possibly fund balances.
We utilize fixed effects models to estimate the influence of different factors on the fund
balances of Michigan school districts. The basic model takes the following form:
FBit = Revenueit B1 + β2 Enrollmentit + Choiceit B3 + StudentCharacteristicsit B4 +
ResourceAllocationit B5 + θi + uit (1)
In which FBit is the fund balance per pupil in district i in year t. Revenueit is a vector of two
variables reflecting revenues received by district i in year t, including Foundation revenue per
pupil10 and Nonfoundation revenue per pupil from local, state and federal sources. We expect
district fund balances to increase with increases in both types of revenue, although foundation
funding may have a stronger positive influence than nonfoundation funding. Whereas the use of
foundation funding is entirely discretionary to local districts, most nonfoundation funding is
categorical with conditions attached to how it must be spent.
We expect district fund balances to be a positive function of Enrollmentit, defined as full-
time equivalent student enrollment. This implies that the marginal revenue associated with
gaining an additional student exceeds the marginal cost of additional service provision. Choiceit
9 Conversely, so long as they have excess capacity (a nearly universal condition in Michigan school districts), in growing-enrollment districts, the additional revenue associated with gaining a student is likely to exceed the increased cost and tend to increase fund balances. 10 In a few years covered in this study, districts did not receive the full amount of their authorized foundation funding, due to unanticipated short-falls in state revenue collections. Our Foundation variable is adjusted to incorporate this “pro-rationing” of funding.

14
is a vector of two variables reflecting the share of a district’s resident students who participate in
each of Michigan’s two choice policies. It includes %Charter--the percent of students residing
in district i who attend charter schools--and %Net_IDC, the net gain or loss of students to inter-
district school choice as a percentage of students residing in district i.11 We expect increases in
charter penetration to decrease district fund balances, and a net inflow of out-of-district students
to increase fund balances. (Conversely, net outflows of students through inter-district choice are
expected, like the loss of students to charter schools, to decrease fund balances.)
StudentCharacteristicsit captures the net influence of a vector of student attributes that
are associated with added categorical funding, as well as additional costs of service provision.
Within the model specified by Equation 1, these variables can be interpreted as the extent to
which the added funding covers the service provision costs for high-cost students.
StudentCharacteristicsit includes the percent of students who receive special education
services, %SpecEd, and the percent of students eligible for free and reduced-priced
lunch, %FRL.12 For both variables, a negative sign on their estimated coefficient implies that the
additional revenue associated with these special-need students is less than the additional
expenditures for services they receive, whereas a positive implies additional revenues exceed
additional expenditures.
ResourceAllocationit is a vector of five variables reflecting key local resource allocation
decisions by district i in year t. Unlike the other variables in Equation 1, which are entirely or
largely outside local districts’ control, the resource allocation variables fall squarely within the
domain of local district decision makers. We expect increases in average teacher salary,
11 Specifically, %Net_IDC = (incoming out-of-district students minus resident students enrolling in other districts) as a percentage of students residing in district i. 12 Special education enrollment is measured by individual education plans (IEPs).

15
Teacher_Salary, to have a negative impact on fund balances. Increases in class size represent an
important option to reduce spending. We consequently expect increases in a district’s average
pupil-teacher ratio, P-T ratio, to have a positive impact on fund balances. High levels of
administrative spending are often taken as indicators of inefficiency in school operations,
although empirical support for this view is limited (Brewer, 1996). We test the hypothesis that
administrative “bloat” is associated with declines in district fund balances with %Admin, the
percent of spending devoted to administration.
The rising cost of employee health insurance has squeezed school district budgets across
the nation in recent years and prompted a variety of local strategies to curtail these costs through
changes in coverage and payments. We include the percent of spending devoted to employee
health insurance, %Health, with the expectation that it is negatively related to district fund
balances. Finally, private contracting of services, especially support services such as
transportation, custodial, food service, has been advocated as a promising strategy for local
districts to lower costs and diminish fiscal stress (LaFaive, 2007). Private contracting by
Michigan school districts has increased over the past decade (Holman & Fryzelka, 2014). We
test this hypothesis with %Purchases, the share of spending devoted to purchased services, with
the expectation that it is positively related to fund balances.
θi is the time-constant district fixed effect, which picks up all unobserved characteristics
of a school district that are stable over time, including historical differences in local cost of living
or other geographical or structural influences on district revenues or spending that influence fund
balances. The idiosyncratic error that changes across time for each district is uit. All Equation 1
variables which are expressed in monetary units (FB, Foundation, Nonfoundation, and

16
Teacher_Salary) are converted to real 2012 dollars using the U.S. Department of Commerce’s
GDP price deflator for state and local government purchases.
Our panel dataset covers the years 1995 to 2012, with the exception of the two school
choice variables (%Charter and %Net_IDC) which are only available for the years 2001 to 2012.
We estimate our models that do not include the choice variables over the entire 1995-2012
period, and those that include the choice variables over 2001 to 2012. We estimate Equation 1
for all Michigan school districts with enrollment of at least 100 students.
The data were assembled from two main sources: the Michigan Department of Education
(MDE) and the State of Michigan’s Center for Educational Performance and Information (CEPI).
MDE was the source for data on district foundations, fund balances (Bulletin 1011), and district
enrollment, average salaries and pupil-teacher ratios (Bulletin 1014). All other district financial
data came from CEPI’s Financial Information Database. CEPI was also source for the school
choice and student demographic variables.
RESULTS
Table 4 presents the estimates of the district fund balance models. Models 1-5 in Table 4
introduce the variables specified in Equation 1 sequentially. Model 5 is the full model.
In all specifications, both revenue variables have highly significant positive impacts on
district fund balances. As districts receive more revenue, their fund balances increase.
Moreover, the estimated coefficients indicate that an additional dollar of discretionary foundation
revenue is equivalent to roughly two dollars of non-foundation revenue. This is intuitively
plausible since non-foundation revenue is primarily categorical funding which comes with
corresponding expenditure requirements.
[Table 4 about here]

17
Model 1 in Table 4 indicates that a one dollar increase in foundation revenue and non-
foundation revenue lead to $.376 and $.283 increase in FB, respectively. The influence of
foundation revenue on fund balances intensifies, after controlling for the enrollment and resource
allocation variables, as shown in Model 5.
As expected, district enrollment growth also consistently exerts a significant positive
impact on district fund balances. Gaining one student increases fund balances by $.03 per total
district pupil. This implies that for growing districts the marginal revenue gain associated with
an additional student exceeds the marginal cost. Conversely, for declining enrollment districts,
revenues decline faster than costs, causing district fund balances to decline.
The results for the school choice variables are interesting. In all specifications, as
expected, a net inflow of inter-district student transfers significantly increases district fund
balances, and correspondingly net out-flows of students lower fund balances. By comparison,
the results for districts’ loss of students to charter schools are more tentative. While significant in
the parsimonious models (Models 3 and 4 in Table 4), %Charter is only significant at the 90%
level in the full model, after the resource allocation variables are introduced (Model 5). Below
we test for the possibility that very high and sustained levels of charter penetration have
differential impacts on district finances that are not captured in our linear specification of
%Charter.
It is noteworthy that the point estimate on Enrollment falls by 44 percent when the
charter school and inter-district choice variables are added in Model 3. This implies that 44
percent of the enrollment effect is explained by charters and inter-district choice. It also implies
that since Enrollment is included with the school choice variables, the point estimates on

18
%Charter and %Net_IDC do not reflect their full impact on district fund balances since much
their effects pass through enrollment.
Student characteristics also influence district fund balances. As expected, the percent of a
district’s students who are eligible for special education service is strongly related to district fund
balances. A one percentage increase in a district’s students receiving special education services
in Model 5 generates roughly a $43 decline in district fund balance per student. As noted above
(footnote 2), under Michigan’s special education funding arrangements, special education
students typically represent a financial burden to local districts, and the more costly a student’s
disability, the larger the burden.13
Meanwhile, increases in the percent of students who are poor (%FRL) do not have a
similar negative impact on district fund balances. The percent of students who are eligible for
free and reduced priced lunch is positively related to district fund balances, although this
relationship is only marginally significant.14 This implies that for Michigan districts as a whole,
the additional revenue they receive to serve low-income students roughly corresponds to their
additional spending for these students, producing no significant residual impact on fund
balances.
In Model 5, three of the five district resource allocation variables are significant (P-T
ratio, Teacher_Salary, and %Admin) each with the expected signs. An increase in a district’s
pupil-teacher ratio by one student increases its fund balance by $80 per pupil. Meanwhile, a
13 The portion of special education costs that are borne by local districts and charter schools varies across intermediate school districts (mostly county-level agencies) in Michigan, because ISDs differ in the extent to which they provide supplemental special education funding to the local units. 14 We explored the possibility that the impact of student poverty on fund balances is nonlinear, including specifications testing for the possibility of differential budget impacts in districts with very high thresholds of student poverty (e.g., %FRL = 70%, 80% or 90%). In none of these specifications was the measure of student poverty statistically significant.

19
$1000 increase in average teacher salaries decreases fund balances by $29 per pupil. A one
percentage point increase in the administrative spending (as a share of total general fund
spending) lowers district fund balances by $112 per pupil.
Two of the district resource allocation variables, %Health and %Purchases, are not
significantly related to district fund balances. These results are noteworthy in view of the fact
that within the Michigan policy context both are associated with steps (cutting expenditures on
employee health benefits and contracting service provision to private vendors, respectively) that
have been widely advocated for local districts in fiscal distress (e.g.,Washburne & Jahr, 2007;
LaFaive, 2007 ). Whatever the merits of these strategies as emergency measures for district in
fiscal distress, our results fail to indicate that they are systematically related to districts’ fiscal
health as measured by their fund balances.15
Whereas a simple correlation suggests that districts with high concentrations of African
Americans are more likely to be in financial distress, as indicated by Figure 3, our results in
Table 4 suggest a more nuanced relationship. Districts with high concentrations of African
American students are much more likely to be subject to intense charter school penetration, to
lose students to inter-district choice, and to have higher concentrations of students with
disabilities.16 Once these and other factors are controlled, however, districts’ level of financial
distress is not significantly related to their racial composition as indicated by the %Black variable
in Model 6 of Table 4. Moreover the results for other variables are highly stable with the
inclusion of %Black in the model. 15 We also tested districts’ contribution rate to the Michigan Public School Employee Retirement System in our models. MPSERS is a state defined-benefit pension system. The system’s eligibility and benefit provisions are established at the state level, and it is funded by local districts through a uniform statewide contribution rate set annually by the state and assessed against districts’ payroll spending. MPSERS contributions were not significant in any of our models and its inclusion did not change the results for any other variables in the model. 16 The correlations between %Black and these variables in 2012 were: %Charter (0.654), %Net_IDC (-.092), and %SpecEd (0.222). The correlations over the entire 1995-2012 period were: %Charter (0.601), %Net_IDC (-.052), and %SpecEd (0.193). %Black is measured by head count data.

20
In assessing factors that determine local districts’ fiscal health, Table 4 provide insight
into the relative contribution of local districts’ budgetary decision-making versus factors entirely
or largely outside their control. Model 4 in Table 4 omits the resource allocation variables that
fall within local districts’ control (P-T ratio, Teacher_Salary, and %Admin, %Health and
%Purchases). The R-square of Model 4, including the variables that are outside local districts’
control (Foundation, Nonfoundation, Enrollment, %CS, %Net_IDC, %SpecEd and %FRL) is
0.21. The R-square of Model 5 increases to 0.26 with the addition of the resource allocation
variables. Consequently, local districts’ resource allocation decisions account for only 20% of
the explained variation in district fund balances, while factors outside districts control accounted
for the remaining 80%.
Districts with High Levels of Charter Penetration
We next consider the possibility that the impact of the loss of students to charter schools
on district financial health is not linear, but rather intensifies in situations where charter
penetration reaches high and sustained levels. Such a nonlinear relationship is suggested by Ni
(2009) who found an adverse impact of Michigan charter schools on district efficiency at high
and sustained levels of charter penetration, but not low levels. Arsen & Ni (2011) also found
that high levels of charter penetration produce greater declines in Michigan districts’ revenues
than expenditures.
Table 5 displays the results for our full model in which %Charter is replaced by variables
that count the number of consecutive years that a district has reached alternative thresholds (5%,
10%, 15%, 20% and 25%) of charter penetration. Under this specification, the loss of resident
students to charter schools has strong negative impact on district fund balances. Moreover the
adverse impact on district finances increases progressively as the charter threshold increases

21
from 5% to 25% of resident students. The results indicate that in the relatively small number of
Michigan districts in which charter penetration reaches very high and sustained levels, the loss of
students to charters causes district fund balances to sharply deteriorate.17
[Table 5 about here]
Finally we examine the possibility that charter schools have an indirect impact on district
fund balances by changing the share of students who remain in district schools and receive
special education services. Charter school enrollment would cause an increase in the share of
special education students in district schools, for instance, if a disproportionately low share of
students enrolling in charter schools received special education services. Table 6 shows estimates
of fixed-effect regressions in which special education students as a percent of district enrollment
(%SpecEd) is the dependent variable and charter school penetration (%Charter) is a predictor.
In each specification, increases in the share of a district’s resident students attending charter
schools increase the percentage of special education students among students who remain in
district schools.
To test whether the share of special education students mediates the relationship between
charter enrollment and the district fund balance, we estimated a fixed-effects regression that is
identical to Model 5 in Table 4, except excluding the %SpecEd variable. The coefficient on
%Charter becomes -52.627 (p<0.05), suggesting that one percentage increase in charter school
enrollment has an indirect effect of decreasing district fund balance by $4.9 (-52.627 + 47.684 =
-4.9) through increasing the share of special education students in district schools.
[Table 6 about here]
17 In 2012, %Charter was greater than 25% in 13 districts. Four of those districts had surpassed this charter penetration threshold for at least five years; one district for ten years.

22
Patterns of State Intervention
We turn now to address Research Question 2: among districts that fall into sustained
deficits, which ones does the state take over? Michigan’s emergency manager law affords the
state considerable discretion in the determination of when a financial emergency exists in a local
school district or municipality. There are no well-defined triggers for state intervention (Arsen
& Mason, 2013).
Thus far, the state has appointed emergency managers in three school districts (Detroit,
Muskegon Heights, Highland Park), has dissolved two school districts (Inkster and Saginaw
Buena Vista) and established consent decrees in one (Pontiac).18 As the top panel of Table 7
shows, students in all of these districts are predominantly poor and African American. All except
Inkster experienced large declines in enrollment between 2002 and 2012. Compared to districts
statewide, all six of these districts experienced much higher loss of resident students to charter
schools and higher shares of special education students.
[Table 7 about here]
We set out to determine whether district demographic or financial characteristics were
related to in which of the fiscally distressed districts the state intervened. To do so we examined
all Michigan school districts that were in deficit for at least two consecutive years in 2012.
Under the emergency manager law, this condition would permit emergency state intervention. In
2012 there were 34 Michigan districts that satisfied this condition. We ask whether the six
districts in which the state intervened differed significantly from the deficit district in which it
did not in terms of their demographic or financial characteristics.19
18 The state intervened in yet another predominantly poor and African-American school district, Benton Harbor, too recently to include in the analysis. Benton Harbor is currently operating under a consent decree. 19 The state intervened in two districts in 2012 and three in 2013. The state declared a financial emergency in Detroit Public Schools in 2009.

23
We measured district demographics by the percent of student who are black and the
percent that are eligible for free- and reduced-priced lunch. We also include the percent of
resident students enrolled in charter schools. We measured district financial status in three ways:
• number of consecutive years in deficit (in 2012),
• 3-year trend in deficit relative to general fund revenues (2009 to 2012),20 and
• fund balance as a percentage of general fund revenue.
As indicated in Table 8, the deficit districts in which the state intervened were
significantly different from deficit districts in which it did not intervene on each of the
demographic characteristics examined. They had significantly higher shares of African-
American students (86% versus 40%), and significantly higher shares of low-income students
(85% versus 67%). Districts in which the state intervened also had significantly higher charter
penetration (29% versus 11% of resident students).
[Table 8 about here]
On two of the three measures of district financial status (fund balance as a percentage of
general fund revenues and the 3-year deficit trend), the six districts in which the state intervened
were in significantly worse shape than those in which it did not.
On one measure of district financial status, the number of consecutive years in deficit in
2012, there was no significant difference between the districts in which the state did and did not
undertake emergency intervention.21
Clearly the districts in which the state has undertaken various forms of emergency
intervention are significantly blacker and poorer than other financially troubled districts in
20 We measure this as (FB/General fund revenue)i
2012* 100 - (FB/General fund revenue)i2009* 100
21 The tests reported in Table 8 were also conducted for the same set of school districts for 2011. The pattern of significant and insignificant differences between the intervention and non-intervention groups was unchanged for all district characteristics.

24
Michigan. The question of whether these districts are also in significantly worse financial shape
yields mixed results depending on the measure of financial status. But by at least two important
measures, the intervention districts were indeed significantly worse off.
DISCUSSION AND CONCLUSION
Given states’ constitutional obligation to provide education services to all students, it is
appropriate for them to oversee and support local district operations and to intervene when
serious problems arise. In recent years, the State of Michigan has taken over and suspended
traditional democratic governance arrangements in, or dissolved, several predominantly African-
American and poor school districts. Such actions have been implemented only in poor, African-
American districts. Although these districts were not performing well on academic metrics, the
grounds for this emergency intervention under state law are strictly financial. State policy
presumes that local district fiscal distress is caused by local officials’ poor decision-making and
management, and therefore it seeks to shift administrative authority to other parties.
Our findings, however, indicate that state school finance and choice policies significantly
contribute to the financial problems of Michigan’s most hard-pressed districts. Most of the
explained variation in district fund balances is due to changes in districts’ state funding,
enrollment changes including those associated with school choice policies, and special education
students whose required services are inadequately reimbursed by the state.
Michigan participated in one of the most important transformations in American K-12
education over the last half century by shifting most funding responsibility from local districts to
the state government. The conventional wisdom holds that a larger revenue raising role for states
renders funding less stable (since state revenue sources are more cyclically sensitive than local

25
property taxes), but an expansion of the state’s funding role is generally viewed as increasing
school funding equity (Ladd & Hansen, 1999).
After 20 years, Michigan’s centralized funding system is generating outcomes at odds
with standard conceptions of improved equity. Between 1994 and 2002, Proposal A did indeed
narrow (but not eliminate) funding inequities among districts, thus improving horizontal equity.
The system, however, took slight account of local cost variations, especially for high-cost special
needs students, so it fares less well against the standard of vertical equity. Moreover, after rising
steadily for eight years following Proposal A’s passage, total real per-pupil funding has declined
sharply since 2002, increasing fiscal stress in districts statewide as a growing number of districts
fell into deficit.
During this period of statewide fiscal retrenchment, differences in district enrollment
trajectories have generated large variations in revenue growth or decline and fiscal stress.
Michigan’s declining-enrollment districts have faced the greatest fiscal pressures. Our results
show that the state’s school choice policies powerfully exacerbate the financial pressures of
declining-enrollment districts, particularly those with sustained high levels of charter school
penetration. Despite the long-term decline of school-age children in Michigan cities, charter
schools now represent a large and growing parallel system of schools that operate alongside
traditional public schools. With no coordination of the total supply of schools, some urban areas
are characterized by a chaotic excess supply of public schools (Coalition for the Future of Detroit
Schoolchildren, 2015).
While most variation in district fiscal stress is explained by factors largely outside local
decision-makers’ control, local decision-making does matter. Our results indicate several ways
in which local resource allocation decisions (larger class size, lower teacher salaries, lower

26
administrative spending) increase district fund balances and thereby reduce fiscal stress. We do
not, however, attempt to assess the impact of such measures on the quality of education services.
By failing to account for the budgetary consequences of rapid enrollment loss and local
cost differences, Michigan’s school finance and choice policies reinforce a fierce downward
spiral in the state’s urban districts. Indeed rather than rectify the mismatch between state
revenues and local costs in declining-enrollment districts, state policy changes have made them
worse. In 1994, district pupil counts for state funding were a 50-50 weighted average of district
enrollment in the previous spring and fall of the current academic year. Since then, the state has
progressively decreased the weight of past enrollment, so that by 2015 previous-year enrollment
is weighted only 10%.22
By comparison to their counterparts in more affluent districts, school boards and
administrators in urban districts have been forced to enact more substantial cuts to programs,
services and employee compensation. These budgetary changes, in turn, influence households’
perceptions of local school conditions. In settings with high levels of school choice
participation, school closures and teacher layoffs can create negative perceptions that enhance
the prospect that additional families will leave, creating a self-reinforcing cycle. This process
has triggered financial emergencies in a small but vital subset of Michigan districts and
established grounds for state intervention, but state policies were in large part responsible for the
underlying financial problems.
We recognize the limits to the external validity of these results. They are conditional on
specific features of state policy design in Michigan. By the same token, changes in state policy
could improve matters and help stabilize district finances.
22 The current pupil-count weighting means that districts must establish their budgets each year based on enrollment estimates, but do not know their actual funding until over a month after the start of the academic year. It also dramatically heightens the stakes of school choice competition.

27
One indication that state policies are implicated in the precarious finances of hard-pressed
Michigan districts is that emergency managers with complete powers to determine all aspects of
district operations have thus far--after six years in Detroit and three years in Muskegon Heights
and Highland Park—been unable to eliminate budget deficits. Although they have reduced
staffing and employee compensation, closed schools and privatized service delivery, they have
been unable to increase student enrollment (and thus revenues) sufficiently to balance district
budgets. The analysis of why emergency state-appointed financial management is apparently
less successful in Michigan than elsewhere remains a subject for future research.

28
REFERENCES
Addonizio, M. & Kearney, C.P. (2012). Education reform and the limits of policy. Kalamazoo,
MI: Upjohn Institute for Employment Research.
Ammar, S., Duncombe, W., Jump, B. & Wright, R. (2005). A financial condition indicator
system for school districts: A case study of New York. Journal of Education Finance,
30(3), 231-258.
Anderson, M. (2012). Democratic dissolution: Radical experimentation in state takeovers of
local governments. Fordham Urban Law Journal, 39.
Arsen, D. & Davis, T. (2006) Taj Mahals or decaying shacks: Patterns in local school capital
stock and unmet capital need. Peabody Journal of Education, 81(4), 1-22.
Arsen, D. & Mason, M. (2013). Seeking accountability through state-appointed emergency
district management. Educational Policy, 27(2), 248-278.
Arsen, D. & Ni, Y. (2012). Effects of charter school competition on school district resource
allocation. Education Administration Quarterly, 48(1), 3-38.
Berny, C. (1982). Selected variables as discriminators between financially troubled and non-
troubled rural Ohio school districts. Journal of Education Finance, 7, 473-483.

29
Bowman, K. (2013). State takeovers of school districts and related litigation: Michigan as a case
study, The Urban Lawyer, 45(1), 1-20.
Bowman, K. (2011). Before school districts go broke: A proposal for federal reform. University
of Cincinnati Law Review, 79, 895-957.
Butler, M. (2012,). Michigan school districts under pressure: Outlook remains negative. Moody’s
Investor Service. Report Number 147479. (November, 20).
Brewer, D. (1996). Does more school district administration lower educational productivity?
Some evidence on the “administrative blob” in New York public schools. Economics of
Education Review, 15(2), 111-124.
Citizens Research Council of Michigan (2012). Financing special education: Analyses and
challenges, Report 378. Livonia, MI.
http://crcmich.org/PUBLICAT/2010s/2012/rpt378.pdf
Citizen’s Research Council (2013). School district dissolution: Another approach to address local
school districts fiscal distress. CRC Memorandum No. 1125. Livonia, MI.
http://www.crcmich.org/PUBLICAT/2010s/2013/memo1125.pdf
Coalition for the Future of Detroit Schoolchildren (2015). The choice is ours: Road to excellence
for troubled Michigan schools begins in Detroit. Detroit: Author.
http://choiceisoursdetroit.tumblr.com/report

30
Deluca, B. (2006). Models for predicting school district fiscal stress: One size doesn’t not fit all.
Journal of Education Finance, 31(4), 420-432.
Detroit Free Press (2014). State of Charter Schools Special Report: How Michigan spends $1
billion, but fails to hold charter schools accountable. http://www.freep.com/charters.
Education Trust-Midwest (2015). Accountability for all: The need for real charter school
authorizer accountability in Michigan. Royal Oak, MI: Author.
http://midwest.edtrust.org/resource/accountability-for-all/
Holman, J. & Fryzelka, E. (2014). Michigan school privatization survey, 2013. Midland, MI:
Mackinac Center for Public Policy. http://www.mackinac.org/19590
Kloha, P. Weissert, C. & Kleine, R. (2005). Developing and testing a composite model to predict
local fiscal distress. Public Administration Review, 65(3), 313-323.
Ladd, H. & Hansen, J. (Eds.). (1999). Making money matter: Financing America’s schools.
Washington, DC: National Academy Press.
LaFaive, M. (2007). A School privatization primer: For Michigan school officials, media and
residents. Midland, MI: Mackinac Center for Public Policy.
http://www.mackinac.org/article.aspx?ID=8691

31
Lewis, S. (2015). 43 Michigan school districts’ credit ratings cut. Detroit News. (August, 31)
http://www.detroitnews.com/story/news/education/2015/08/30/school-credit/71442824/
McDermott, K. (2007). “Expanding the moral community” or “blaming the victim”? The politics
of state education accountability policy. American Education Research Journal, 44 (1),
77-111.
Michigan State Board of Education. (2014). Recommendations for change to Michigan school
organization and finance. December. Lansing, MI: Author.
http://www.michigan.gov/documents/mde/Item_D_School_Org_Context_for_Change_FI
NAL__474852_7.pdf
National Alliance for Pubic Charter Schools. (2013). A growing movement: American’s largest
charter school communities. Washington, DC: Author.
http://www.publiccharters.org/wp-content/uploads/2013/12/Market-Share-Report-
2013.pdf
National Alliance for Public Charter Schools. (2014). The health of the public charter school
movement: A state-by-state analysis. Washington, DC: Author.
http://www.publiccharters.org/wp-content/uploads/2014/09/health-of-the-movement-
2014.pdf
Ni, Y. (2009). Do traditional public school benefit from charter school competition? Evidence
from Michigan. Economics of Education Review, 28(5), 571-584.

32
Oluwole, J. & Greene, P. (2009). State takeovers of school districts: Race and the equal
protection clause. Indiana Law Review, 42, 363-394.
Smith, C. (1986). Forecasting school district fiscal health. Journal of Education Finance, 12(1),
140-153.
Summers, K. (2015). Financially distressed schools: HB 4325 (S-5) & 4326-4330 Concurrence
Summary, Bill Analysis. Michigan Senate Fiscal Agency. Lansing, MI.
http://www.legislature.mi.gov/documents/2015-2016/billanalysis/Senate/pdf/2015-SFA-
4325-C.pdf
Trussel, J. & Patrick, A. (2009). A predictive model of fiscal distress in local governments.
Journal of Public Budgeting, Accounting & Management, 21(4), 578-616.
Washburne, T. & Jahr, M. (2007). Employee salaries and benefits. In A collective bargaining
primer for Michigan school board members. Midland, MI: Mackinac Center for Public
Policy. http://www.mackinac.org/archives/2007/s2007-01.pdf
33
Figure 1. Michigan Real Total General Fund Revenue per Pupil (2012$)
Sources: Michigan Department of Education, Bulletin 140; U.S. Department of Commerce, GDP price deflator for state and local government purchases.
6,000
7,000
8,000
9,000
10,000
11,000
12,00019
95
1996
1997
1998
1999
2000
2001
2002
2003
2004
2005
2006
2007
2008
2009
2010
2011
2012
2013
Local-State Revenue Total Revenue

34
Table 1. Change in Foundation Grants and Enrollment by School District Type, 2002-2013 School district type % change
enrollment
% change nominal per-
pupil foundation
grant
% change real per-pupil
foundation grant
% change nominal total foundation
revenue
% change real total
foundation revenue
Central city -26.6 6.7 -27.2 -21.6 -46.5 Low-income suburb -7.9 6.8 -27.1 -1.2 -32.6 Mid-income suburb 0.1 7.6 -26.6 7.7 -26.5 High-income suburb 5.8 4.8 -28.5 10.8 -24.4 Rural -14.7 9.2 -25.5 -6.9 -36.5

35
Figure 2. Aggregate Fund Balance for All Michigan School Districts (2012$)
Sources: Michigan Center for Education Performance and Information; U.S. Department of Commerce, GDP price deflator for state and local government purchases.
$0
$500
$1,000
$1,500
$2,000
$2,500
$3,000
1995
1996
1997
1998
1999
2000
2001
2002
2003
2004
2005
2006
2007
2008
2009
2010
2011
2012
2013
x $1
,000
,000

36
Figure 3. Fund Balance as Percent of General Fund Revenues by School District Racial
Composition, % Black.
Note: Composition of district groups is fixed over time period displayed in figure. District racial composition is derived by %Black in (1995 + 2004 + 2013) /3.
9%
17%
12% 11% 10%
9% 6%
5% 2%
-4%
-9%
-12%
-15%
-20%
-15%
-10%
-5%
0%
5%
10%
15%
20%
25%
1995
1996
1997
1998
1999
2000
2001
2002
2003
2004
2005
2006
2007
2008
2009
2010
2011
2012
0-.9%
1-4.9%
5-19.9%
20-39.9%
40-100%

37
Table 2. Michigan School Districts with Deficit General Fund Balances, 1995-2013
Number of Districts
1995-2004
2005-2013
% of total after 2005
In deficit at least: (need not be consecutive years)
1 year 33 77 70.0% 2 years 22 56 71.8% 3 years 14 40 74.0% 4 years 9 31 77.5% >4 years 6 27 79.4% With deficits at least: 5% of general fund revenue 41 157 79.3% 10% of general fund revenue 17 102 85.7% 20% of general fund revenue 5 41 89.1%
Source: Michigan Center for Education Performance and Information http://www.michigan.gov/cepi/0,4546,7-113-21423_35782_49874---,00.html Districts with deficits for more years or higher percentages of revenue are included in the prior (smaller) amounts. So districts in deficit for 2 years are also included among districts in deficit for 1 year.

38
Table 3. Description of Variables
Variable Description Obs. Mean Std. Dev. FB Fund balance per pupil 10484 1618 4383 Foundation Per-pupil foundation 11049 6753 1179 Nonfoundation Nonfoundation revenue per pupil 10489 862 2134
Enrollment Full-time equivalent student enrollment 10489 2901 6781
% Charter % of students residing in a district who attend charter schools 6576 2.39 4.60
% Net_IDC Net gain or loss of students to Inter-district school choice as % of students residing in a district
6576 2.56 43.36
% Black % of students who are black 10483 6.13 15.39
% FRL % of students eligible for free and reduced-priced lunch 9937 35.79 19.75
% Spec Ed % of students who receive special education services 9939 12.05 4.22
Teacher_Salary Average teacher salary ($) 10485 50164 9946
% Health % of spending devoted to employee health insurance 9905 10.86 2.98
P/T ratio Average pupil-teacher ratio 10485 20.82 3.76
% Admin % of spending devoted to administration 9850 5.79 3.14
% Purchases % of spending devoted to contracted or purchased services 9935 6.35 4.22
Note: The descriptive statistics are based on data from year 1995 to 2012, with the exception of the two school choice variables (% Charter and % Net_IDC), which are only available for the years 2001 to 2012.

39
Table 4. Fixed Effects Estimates of School District Fund Balances
Model 1 Model 2 Model 3 Model 4 Model 5 Model 6
Foundation .376** (.03)
.37** (.03)
.363** (.032)
.4** (.044)
.63** (.071)
.628** (.071)
Nonfoundation .283** (.091)
.285** (.092)
.266* (.107)
.209+ (.107)
.3** (.104)
.298** (.105)
Enrollment .034** (.011)
.019* (.008)
.027** (.009)
.03** (.008)
.031** (.008)
% Charter -60.329* (24.068)
-50.571* (25.275)
-47.684+ (25.265)
-43.35+ (24.475)
% Net_IDC 15.297** (5.633)
11.559* (5.575)
10.451* (5.134)
10.195* (5.039)
% FRL 6.368+ (3.422)
6.091+ (3.643)
6.828+ (3.583)
% SpecEd -45.881** (15.262)
-43.055** (14.992)
-43.51** (14.934)
Teachere_Salary -.029** (.006)
-.029** (.006)
% Health -36.141+ (19.051)
-36.494+ (19.11)
P/T ratio 79.335** (15.496)
80.978** (15.646)
% Admin -111.557**
(34.058) -112.996**
(33.801)
% Purchases 6.388
(7.144) 5.851
(7.256)
% Black -9.975
(11.706)
Constant -2077.45** (286.051)
-2139.45** (287.007)
-1847.13** (342.147)
-1790.56** (579.059)
-2734.32** (781.056)
-2684.51** (784.111)
N 9856 9856 6217 5702 5695 5695 R-squared 0.14 0.15 0.2 0.21 0.26 0.26
Huber-White robust standard errors are in parentheses. +p <0.10, *p <0.05, **p <0.01

40
Table 5. Fixed Effects Models: District Fund Balance Models with Alternative Charter Penetration Thresholds
% Charter
>5% >10% >15% >20% >25%
Model 1 Model 2 Model 3 Model 4 Model 5
Foundation .624** (.067)
.613** (.066)
.609** (.066)
.592** (.065)
.606** (.066)
Nonfoundation .292** (.103)
.287** (.103)
.289** (.103)
.292** (.103)
.293** (.103)
Enrollment .034** (.007)
.021** (.008)
.011 (.01)
-.006 (.011)
-.001 (.012)
% Charter -77.167** (29.163)
-182.479** (66.496)
-306.114** (104.901)
-538.472** (119.386)
-676.429** (180.463)
% Net_IDC 9.737* (4.738)
10.067* (4.501)
11.552** (4.358)
12.936** (4.208)
13.267** (4.111)
% FRL 6.191+ (3.615)
4.569 (3.437)
3.415 (3.391)
2.347 (3.448)
2.794 (3.466)
% Spec Ed -48.956** (16.674)
-49.483** (16.433)
-50.138** (16.068)
-49.663** (14.738)
-49.081** (14.291)
Teacher_Salary -.03** (.006)
-.029** (.006)
-.028** (.006)
-.026** (.005)
-.027** (.005)
% Health -38.791* (18.871)
-38.5* (18.045)
-34.011+ (18.694)
-33.105+ (18.874)
-38.034* (18.805)
P/T ratio 81.33** (16.231)
79.993** (15.908)
78.348** (15.556)
74.233** (14.505)
75.931** (14.329)
% Admin -114.6** (33.807)
-110.443** (33.828)
-106.317** (34.162)
-100.657** (34.624)
-108.078** (33.988)
% Purchases 7.345 (7.126)
7.922 (6.836)
8.483 (6.727)
8.995 (6.711)
7.77 (6.732)
Constant -2598.77** (692.254)
-2463.74** (664.068)
-2467.46** (697.082)
-2337.54** (713.286)
-2391.54** (736.379)
n 5695 5695 5695 5695 5695 R-squared 0.255 0.268 0.277 0.295 0.289 Huber-White robust standard errors are in parentheses. +p <0.10, *p <0.05, **p <0.01

41
Table 6. Fixed Effects Estimates of Determinants of Special Education Enrollment as % of District Enrollment
Model 1 Model 2 Model 3 Model 4 Model 5
% Charter .119** (.02)
.115** (.021)
.114** (.022)
.114** (.022)
.107** (.023)
% FRL
.003 (.005)
.003 (.006)
.003 (.006)
.003 (.006)
% Black
.002 (.015)
.002 (.014)
.003 (.015)
% Net_IDC
-.009 (.009)
-.009 (.009)
Enrollment
-0.000** (0.000)
Constant 13.099** (.048)
12.978** (.205)
12.972** (.208)
12.981** (.207)
13.081** (.212)
n 5702 5702 5702 5702 5702 R-squared 0.02 0.02 0.02 0.02 0.02
Huber-White robust standard errors are in parentheses. +p <0.10, *p <0.05, **p <0.01

42
Table 7. School Districts with State Intervention
Detroit Highland Park
Muskegon Heights Inkster Buena
Vista Pontiac State
Intervention year 2009 2012 2012 2013 2013 2013
Intervention type EM EM
(EMO managed
EM (EMO
managed) Dissolved Dissolved Consent
agreement
Demographics (2012) % Black 84.0 94.6 89.9 96.9 90.5 59.7 15.4 % FRL 81.6 81.8 88.2 88.3 95.0 75.6 46.3 % Spec Ed 16.9 19.0 18.5 12.1 24.8 16.7 13.6 Enrollment 67,969 1,024 1,425 2,680 637 5,685 1,440,995 % Change enrollment 2002-2012
-58.3 -76.8% -40.6 64.8 -55.5 -51.7 -13.5
% Charter 38.7 49.1 13.1 27.6 11.8 32.0 8.3
Financial (2002-2012) % Change GF revenue (nominal) -17.4 -56.6 -33.9 67.2 -36.5 -33.3 4.7
% Change GF revenue (real) -44.1 -69.6 -54.8 15.4 -55.8 -53.5 -27.5
FB as % of GF Revenue in intervention year
-11.8 -75.2 -51.5 -4.5 -10.7 -86.7
Consecutive years in deficit at time of intervention
1 4 7 7 2 5
Sources: Michigan Department of Treasury (http://www.michigan.gov/treasury/0,1607,7-121-1751_51556-201116--,00.html);

43
Table 8. Comparison of Financially Troubled Districts in Which the State Did and Did Not Intervene
Districts in which state intervened
Districts with FB < 0 for 2
consecutive years, but no intervention
Variable Mean SD Mean SD t-value
Demographics % Black 85.95 13.60 39.96 6.18 -3.41 ** % FRL 85.09 6.80 66.95 19.72 -2.20 * % Charter 28.73 14.52 11.22 10.37 -3.50 ** Financial % FB/Revenue -40.46 26.78 -14.36 9.83 4.33 *** Years in deficit 4.67 .72 4.25 .37 -.48 3-year deficit trend
-26.79 11.60 -9.86 11.43 2.45 *
Observations 6 28 *p <0.05, **p <0.01, ***p <0.001