where america goes to work - building owners and … · where america goes to work: ... cassidy...
TRANSCRIPT

where america goes to work:The ConTribuTion of
offiCe building operaTions To The eConomy, 2012
Prepared for the Building Owners and Managers Association (BOMA) International
by Stephen S. Fuller, PhDDwight Schar Faculty Chair and University Professor,
Director, Center for Regional Analysis, George Mason University


Copyright © 2012 by boMA internAtionAl . All rights reserved.
where america goes to work: The ConTribuTion of offiCe building operaTions To The eConomy, 2012
1
table of contents
Executive Summary . . . . . . . . . . . . . . . . . . . . . . . . . . . . . . . . . . . . . . . . . . . . . . . . . . . . . . . . . . . . . . . . . . . . . . . . . . . . . . . . . . . . . . . . . . . . . . . . . . . . . . . . . . . . . . . . . . . . . . . . . . . . . . . . . . . . . . . . . . . . . . . . . . . . . . . . . . . . . . . . . . . . . . . . . . . . . . . . . . . . . . . . . . . . . . . 4
Introduction . . . . . . . . . . . . . . . . . . . . . . . . . . . . . . . . . . . . . . . . . . . . . . . . . . . . . . . . . . . . . . . . . . . . . . . . . . . . . . . . . . . . . . . . . . . . . . . . . . . . . . . . . . . . . . . . . . . . . . . . . . . . . . . . . . . . . . . . . . . . . . . . . . . . . . . . . . . . . . . . . . . . . . . . . . . . . . . . . . . . . . . . . . . . . . . . . . . . . . . . . . . . . . . 6
National Economic Impacts . . . . . . . . . . . . . . . . . . . . . . . . . . . . . . . . . . . . . . . . . . . . . . . . . . . . . . . . . . . . . . . . . . . . . . . . . . . . . . . . . . . . . . . . . . . . . . . . . . . . . . . . . . . . . . . . . . . . . . . . . . . . . . . . . . . . . . . . . . . . . . . . . . . . . . . . . . . . . . . . . . . . . . . . . . . . . . . 7
Research Approach . . . . . . . . . . . . . . . . . . . . . . . . . . . . . . . . . . . . . . . . . . . . . . . . . . . . . . . . . . . . . . . . . . . . . . . . . . . . . . . . . . . . . . . . . . . . . . . . . . . . . . . . . . . . . . . . . . . . . . . . . . . . . . . . . . . . . . . . . . . . . . . . . . . . . . . . . . . . . . . . . . . . . . . . . . . . . . . . . . . . . . . . . . . . . . . . . 9
Economic Impacts of Operating Expenditures in 94 Office Markets Served by BOMA Local Associations . . . . .10
Metropolitan-Level Impact of Office Operating Expenditures in Selected Areas, 2012 . . . . . . . . . . . . . . . . . . . . . . . . . . . . . . . . . . . . . . . . . . . . . . . .15
Direct and Indirect Jobs Impacts of Office Building Operations in 2011. . . . . . . . . . . . . . . . . . . . . . . . . . . . . . . . . . . . . . . . . . . . . . . . . . . . . . . . . . . . . . . . . . . . . . . . . . . . . . .16
Additional Economic Impacts . . . . . . . . . . . . . . . . . . . . . . . . . . . . . . . . . . . . . . . . . . . . . . . . . . . . . . . . . . . . . . . . . . . . . . . . . . . . . . . . . . . . . . . . . . . . . . . . . . . . . . . . . . . . . . . . . . . . . . . . . . . . . . . . . . . . . . . . . . . . . . . . . . . . . . . . . . . . . . . . . . . . . . . .17
Conclusions . . . . . . . . . . . . . . . . . . . . . . . . . . . . . . . . . . . . . . . . . . . . . . . . . . . . . . . . . . . . . . . . . . . . . . . . . . . . . . . . . . . . . . . . . . . . . . . . . . . . . . . . . . . . . . . . . . . . . . . . . . . . . . . . . . . . . . . . . . . . . . . . . . . . . . . . . . . . . . . . . . . . . . . . . . . . . . . . . . . . . . . . . . . . . . . . . . . . . . . . . . . . . . .18
Appendix A: Glossary of Terms . . . . . . . . . . . . . . . . . . . . . . . . . . . . . . . . . . . . . . . . . . . . . . . . . . . . . . . . . . . . . . . . . . . . . . . . . . . . . . . . . . . . . . . . . . . . . . . . . . . . . . . . . . . . . . . . . . . . . . . . . . . . . . . . . . . . . . . . . . . . . . . . . . . . . . . . . . . . . . . . . . . . . .19
Appendix B: Office Market Inventory & Annual Operating Costs by State & Metropolitan Area for 93 BOMA Local Associations, 2011 . . . . . . . . . . . . . . . . . . . . . . . . . . . . . . . . . . . . . . . . . . . . . . . . . . . . . . . . . . . . . . . . . . . . . . . . . . . . . . . . . . . .20
Appendix C: Direct and Indirect Jobs Associated with Operation Expenditures for Office Buildings in 2011 . . . . . . . . . . . . . . . . . . . . . . . . . . . . . . . . . . . . . . . . . . . . . . . . . . . . . . . . . . . . . . . . . . . . . . . . . . . . . . . . . . . . . . . . . . . . . . . . . . . . . . . . . . . . . . . . . . . . . . . . . . . . . . . . . . . . . . . . . . . . . . . . . . . . . . . . . . . . . . . . . . . . . . . . . . .24
Appendix D: Economic Multipliers and Impact Calculations . . . . . . . . . . . . . . . . . . . . . . . . . . . . . . . . . . . . . . . . . . . . . . . . . . . . . . . . . . . . . . . . . . . . . . . . . . . . . . . . . . . . . . . . . . . . . . . . . . . . . . .28
Appendix E: Aggregate Economic Impact Multipliers for Building Operations . . . . . . . . . . . . . . . . . . . . . . . . . . . . . . . . . . . . . . . . . . . . . . . . . . . . . . . . . . . . . . . . .29
Appendix F: BOMA Local Association Territories Defined . . . . . . . . . . . . . . . . . . . . . . . . . . . . . . . . . . . . . . . . . . . . . . . . . . . . . . . . . . . . . . . . . . . . . . . . . . . . . . . . . . . . . . . . . . . . . . . . . . . . . . . . . . . .33
ISBN# 978-0-9840153-4-4 Copyright © 2012 by Building Owners and Managers Association (BOMA) International. All rights reserved. No portion of this document may be reproduced without permission.
BOMA International 1101 15th Street, NW Suite 800 Washington, DC 20005
202.408.2662
www.boma.org

Copyright © 2012 by boMA internAtionAl . All rights reserved.
acknowledgements
legal notice
where america goes to work: The ConTribuTion of offiCe building operaTions To The eConomy, 2012
2
BOMA International wishes to extend its appreciation to those companies and individuals who contributed to the development of Where America Goes to Work: The Contribution of Office Building Operations to the Economy, 2012.
Building Owners and Managers Association International (“BOMA”) is a nonprofit corporation, incorporated in the State of Illinois, which is exempt from federal taxation under Section 501(c)(6) of the Internal Revenue Code, whose purposes include to actively and responsibly represent and promote the interests of the commercial real estate industry and disseminate education programs on the commercial real estate industry. This document was prepared by Dr. Stephen S. Fuller of George Mason University for BOMA to provide information to those in the commercial real estate industry and other interested parties about the economic impact of office building operations (including management, maintenance and repair, servicing, and utilities) in the ninety-three office markets served by BOMA local associations. Because the market boundaries of BOMA local associations are not always coterminous with the metro areas that they represent, the data presented in this document may differ according to the geographic areas in question.
BOMA publications are intended to provide current and accurate information, and are designed to assist readers in becoming more familiar with the subject matter covered. BOMA published this document for a general audience in accordance with all applicable laws, including the antitrust laws. Such publications are distributed with the understanding that BOMA does not render any legal, accounting, or professional advice. Use of this publication is voluntary and reliance on this document should be undertaken based on an independent review by the user. Infor-mation provided in this document is “as is” without warranty of any kind, either express or implied, including but not limited to the implied warranties of merchantability, fitness for a particular purpose, or freedom from infringe-ment. BOMA hereby disclaims all liability for any claims, losses, or damages in connection with use or application of this document.
This document is the sole and exclusive property of BOMA. Reproduction or redistribution in whole or in part without the express written consent of BOMA is prohibited.
CB Richard Ellis CoStar Group Inc. Joseph W. Markling Chair Elect, BOMA International CBRE Los Angeles, California

Copyright © 2012 by boMA internAtionAl . All rights reserved.
about the author
Professor Stephen S. Fuller, Ph.D joined the faculty at George Mason University in 1994 as Professor of Public Policy and Regional Development. In 2001, he was appointed University Professor and in 2002 he was named to the Dwight Schar Faculty Chair. He also serves as Director of the Center for Regional Analysis.
Prior to joining the George Mason University faculty, he served on the faculty at George Washington University for twenty-five years, including nine as Chairman of the Department of Urban Planning and Real Estate Development. Dr. Fuller received a B.A. in Economics from Rutgers University and his Doctorate in Regional Planning and Economic Development from Cornell University. He has authored more than 800 articles, papers, and reports in the field of urban and regional economic development
where america goes to work: The ConTribuTion of offiCe building operaTions To The eConomy, 2012
3
about boma international
The Building Owners and Managers Association (BOMA) International is an international federation of more than 100 local associations and affiliated organizations. Founded in 1907, its 16,500-plus members own or manage more than nine billion square feet of commercial properties. BOMA International’s mission is to enhance the human, intellectual and physical assets of the commercial real estate industry through advocacy, education, research, standards and information. On the Web at www.boma.org.
boma inTernaTional offiCers
Boyd R. ZoccolaChair & Chief Elected OfficerExecutive Vice PresidentHokanson Companies, Inc.
Joseph W. MarklingChair-ElectManaging Director, Strategic Accounts GroupCBRE
Richard W. Greninger, CPMVice ChairManaging PartnerCarr Properties
Rebecca B. Hanner, CPM, RPASecretary/TreasurerSenior Vice President/PrincipalCassidy Turley
Henry H. Chamberlain, APR, FASAE, CAEPresident & Chief Operating OfficerBOMA International

Copyright © 2012 by boMA internAtionAl . All rights reserved.
where america goes to work: The ConTribuTion of offiCe building operaTions To The eConomy, 2012
4
executive summary
The commercial real estate industry plays a significant role in the U.S. economy. Perhaps this is most obvious during the construction phase, as cranes dot the horizon, workers scramble across scaffolding and trucks deliver a seemingly endless stream of equipment and supplies. But the far larger—and longer lasting—impact actually comes after the ribbon cutting, when the significant annual operating expenses associated with office buildings help support the local economy’s vitality, create new jobs, generate personal income and contribute to the local tax base year after year.
Without question, the value of office buildings within their local markets—and as aggregated at the state and national levels—starts with development and construction expenditures. The economic impacts of these expendi-tures are substantial, but their duration is limited, lasting only from planning to groundbreaking to the ribbon cutting. But once completed, these office buildings represent a continuing and accumulating stream of expenditures to support their operations, with ongoing expenditures for management, maintenance and repair, building services and utilities. Combined, these continuing expenditures have a huge, positive effect on the many local businesses that provide contract-building services and, in turn, generate demand for a wide range of workers with differing educational levels and job skills.
Just how big is its impact? Consider the 9.9 billion square feet of commercial and government-owned office space located within the 94 markets served by the Building Owners and Managers Association (BOMA) International’s 93 local associations1 : combined, the space generated $79.7 billion in direct operating expenditures in 2011 to the benefit of workers and businesses within their host jurisdictions— enough to build One World Trade Center 20 times over.
How is this possible? Keep in mind that this annual spending is largely a function of the inventory of office space that continues to grow in dynamic markets in response to the economy’s continuing shift away from goods-producing jobs (steel, lumber, electronics) and into services-producing jobs (professional and business services such as health-care, education, financial, and legal). Inventory and expenditures also grow with the economy’s general expansion. And, even in a weak economy or during recessions, the expenditures associated with office building operations are not as cyclically sensitive as other segments of the economy, such as manufacturing, construction and retail trade.
The result is significant: BOMA’s 9.9 billion square feet of locally represented office space, and the $79.7 billion of direct operating expenditures generates additional economic impacts:
• For each dollar spent on office building operations, the national economy gained $2.57, with the result that $79.7 billion in annual operating expenditures contributed a total of $205.1 billion to the gross domestic product (GDP) in 2011—equivalent to the state of California’s annual budget;
• For each dollar spent on office building operations, workers in the United States realized an increase of $0.76 in personal earnings, generating a total of $61.0 billion in new earnings for workers residing within these 94 office market areas and respective state economies in 2011;
• For each $1 million in expenditures for office building operations, 19.6 jobs were supported nationwide. As a result, $79.7 billion in annual operating expenditures supported a total of 1,561,517 indirect jobs across all sectors of the national economy in 2011—about the same number employed by McDonald’s worldwide—in addition to an estimated 2.2 million more jobs directly related to the on-site management and operations of these office buildings; and
• The 9.9 billion square feet of commercial and government-owned office space located in the 94 markets served by BOMA’s 93 local associations provided workspace for an estimated 44.3 million office jobs. Their $116,200 per office worker contribution to GDP occurs in this office space and is supported by building and management services and paid for by these operating expenditures. Additionally, their presence within these office buildings’ host jurisdictions has their own significant annual economic and fiscal benefits accruing locally, at the state level and nationwide.
1 BOMA Local Association Carolinas/West Virginia encompasses two distinct metropolitan markets, both worth mentioning in this report: “Charlotte, Greensboro, Winston Salem (Triad)” and the rest of “Carolinas/West Virginia”. Additionally, BOMA/Raleigh-Durham is its own distinct market and BOMA Local Association.

Copyright © 2012 by boMA internAtionAl . All rights reserved.
where america goes to work: The ConTribuTion of offiCe building operaTions To The eConomy, 2012
5
The eConomiC impaCTs of offiCe building operaTing expendiTures in 94 markeTs served by boma loCal assoCiaTions, 2009
Total Office Space (SF) 9,908,990,533 Average Annual Operating Cost (SF) $8.05Total Building Operating Expenditures $79,738,709,975Impacts on US Economy Contribution to GDP $205,058,622,205 New Personal Earnings $60,976,280,704 Direct Jobs Supported 2,229,523 Indirect Jobs Supported 1,561,517
Sources: BOMA International, CoStar Group Inc., GMU Center for Regional Analysis
The benefits to local jurisdictions from office building operating expenditures don’t stop there: one must also add in secondary benefits resulting from how the money generated by building operations is spent—and re-spent—through the local, state and national economies. Whether that means supporting an in-building dry cleaner, hailing a taxi at the curb, hiring an attorney from the law firm located on the top floor, taking business associates out to lunch at a nearby restaurant, or grabbing a soda from a sidewalk vendor, it all goes toward supporting significant job growth directly and indirectly, and helping generate new personal earnings that further stimulates the economy.
These direct and indirect economic impacts are important because of their magnitude, dependability and long-term growth pattern.

Copyright © 2012 by boMA internAtionAl . All rights reserved.
where america goes to work: The ConTribuTion of offiCe building operaTions To The eConomy, 2012
6
introduction
In 2011, there were an estimated 42.9 billion square feet of office, industrial and retail building space in the United States (CoStar Group Inc.). While commercial building construction generates important economic activity and job growth, the annual operating expenditures to manage and maintain the occupied office building inventory represents a significant and continuous contribution to the nation’s economic vitality. Consider for a moment the continuing impact that 42.9 billion square feet of space can generate in just one year via annual operating expenditures, and then multiply that over the course of the buildings’ lifetimes. Then take into account the impact that recurring annual spending can have on the economies within which these buildings are located.
In order to better document the magnitude and significance of these annual operating expenditures, BOMA International commissioned an analysis of the expenditures for office building operations in the 94 markets served by its 93 local associations. This analysis included all office buildings—inclusive of tenant-occupied buildings, buildings owned by their occupants and government-owned office buildings. The findings of this research clearly demonstrate the importance of office building operations as a source of income and employment, which benefits the respective buildings’ local and state economies.

Copyright © 2012 by boMA internAtionAl . All rights reserved.
where america goes to work: The ConTribuTion of offiCe building operaTions To The eConomy, 2012
7
national economic impacts
In 2011, the 9.9 billion square feet of commercial office space existing in the 94 market areas encompassing BOMA’s 93 local associations generated annual expenditures totaling $79.7 billion. This spending supported local employment and business activities associated directly with these buildings in four broad categories and average proportions: utilities (30%), repairs and maintenance (23%), management (26%), and building services (21%). These operating expenditures averaged $8.05 per square foot across all 94 office markets, reflecting a wide range of costs among smaller and larger markets. While operating expenses also include taxes, fees, insurance and other fixed expenditures, these are not included in this analysis, as they do not generate direct local economic benefits. Total office building operating expenditures and their contribution to the national economy are summarized in Table 1.
Table 1:
The eConomiC impaCTs of offiCe building operaTing expendiTures in 94 markeTs served by boma’s 93 loCal assoCiaTions, 2011
Total Office Space (SF) 9,908,990,533Average Annual Operating Cost (SF) $8.05Total Building Operating Expenditures $79,738,709,975Impacts on US Economy contribution to gdp $205,058,622,205 New Personal Earnings $60,976,280,704 direct Jobs supported 2,229,523 Indirect Jobs Supported 1,561,517
Sources: BOMA International, GMU Center for Regional Analysis
Payroll Spending Helps Bring National Impact to $205 Billion
The payroll and non-payroll spending associated with these expenditures for office building operations generated additional spending within the local and state economies, as payroll dollars were re-spent for consumer goods and services, and as non-payroll expenditures ultimately supported additional payroll and business spending.
The $79.7 billion in direct office building operating expenditures in 2011 contributed a total of $205.1 billion to the U.S. economy (GDP), which reflects the initial $79.9 billion in direct expenditures and their indirect economic impacts, for a total of $125.3 billion.
So just how much is $205 billion? About the same worth as Google or twice that of Facebook.
Said another way, it means that for each $1 in building operating expenditures, on average a total of $2.57 was generated to the benefit of the U.S. economy. This contribution to GDP reflected an aggregate multiplier (calculated from data provided by the U.S. Bureau of Economic Analysis) of 2.5716.

where america goes to work: The ConTribuTion of offiCe building operaTions To The eConomy, 2012
8
$61 Billion in New Personal Earnings
Benefits can be found for the workers residing near the commercial buildings, as direct office building operating expenditures were re-spent within the local, state and national economies, they generated new personal earnings (wages and salaries) for workers residing within the host jurisdictions and therefore benefiting from increased business and consumer sales.
In 2011, the $79.7 billion in direct office building operating expenditures generated a total of $61.0 billion in new personal earnings as a result of the jobs supported directly by this spending and the re-spending of these dollars for consumer goods and services. These new personal earnings will directly expand the tax bases in the local and state jurisdictions served by these office markets. At the national level, where these annual office building operating expenditures have their greatest cumulative impact, for each $1 in direct operating expenditures, $0.765 of new personal earnings were generated.
3.8 Million Jobs Supported
This annual spending for office-building operations in the 94 markets served by BOMA’s 93 local associations supported a workforce ranging from 2.0 to 2.5 million workers (estimated to range around 20 to 25 full-time equivalent jobs per 100,000 gross square feet of office building). While this “ jobs requirement” provides an important source of local employment—totaling an estimated 2.2 million jobs—the direct and indirect spending associated with office building operations (including the payroll spending of these direct, on-site workers) was found to support an additional 1,561,517 jobs ranging across the local and state economies. The jobs were concen-trated in consumer goods and services (retail sales and services supporting local residents, health and education, and housing). At the national level, the aggregate jobs multiplier for office building operations is 19.6 jobs per $1 million in expenditures for building operations.
Copyright © 2012 by boMA internAtionAl . All rights reserved.

Copyright © 2012 by boMA internAtionAl . All rights reserved.
where america goes to work: The ConTribuTion of offiCe building operaTions To The eConomy, 2012
9
research approach
The CoStar Group Inc. which provided the office building inventory data used in this economic impact analysis, reflects the office market at the end of 2011. Office market inventory data were developed for all 93 BOMA local associations reflecting all office buildings without limitation as to ownership or size.
The operating cost data for these office buildings were developed from 2010 data from BOMA International’s Experience Exchange Report for private and government-owned office buildings and converted to 2011 equivalent dollar values by the application of the annual CPI inflation rate (3.0%) for 2011. For office markets where operating cost data were not collected, estimates were made based on markets having similar characteristics in the same state where these were available or for markets in adjacent states. Average operating cost data were used and these averages were averaged and weighted in markets including multiple sub-markets.
In 26 market areas, metropolitan area-level office market data were collected and are reported separately. In 25 cases, these metropolitan area data are reported within their principal host state (e.g., New York for NYC metro area). For the Washington, D.C., metropolitan area, spanning the District of Columbia and portions of Maryland and Virginia, the metropolitan area data are reported alphabetically under the District of Columbia and not within the two separate states. Minneapolis and St. Paul, Minn., are reported as separate market areas although the multipliers used were for the combined metropolitan area.
The economic impacts of the direct spending for building operations in 2011 are calculated using multipliers (Regional Input-Output Modeling System, RIMS II) purchased from the Bureau of Economic Analysis of the U.S. Department of Commerce. State multipliers were used to calculate the statewide impacts of local office building operating expenditures, and metropolitan area level multipliers were used to calculate the economic impacts for the 26 metropolitan areas reported separately. The state-level economic impacts for 25 of these metropolitan areas (the Washington, D.C., metro area is excluded) were also calculated and are reported in Table 2 in a subsequent section of this report.
The economic impact of office building expenditures are a function of what is being purchased, whether it is locally supplied, and how labor intensive these services or products are (i.e., the more labor intensive, the greater the payroll effect, the more likely the benefits will be retained locally and the broader the impact across the retail and consumer services sectors in the local economy). Building operating expenditures were disaggregated into four groups: utilities, management/administrative, maintenance and repair, and building services. The share of total operating expenditures associated with each of these four categories of expenses was calculated across a sample of office markets nationally yielding the following distribution: utilities, 30 percent; maintenance and repairs, 23 percent; building management, 26 percent; and building services, 21 percent. The percentage that each category represented of total expenditures was used to develop aggregate multipliers weighted to reflect this mix of sectors. These aggregate multipliers were used to calculate the economic impacts of office building operating expenditures by state and metropolitan area. (Appendix E).
These multipliers and the economic impact calculations are discussed in Appendix D, and the multipliers are presented by state and metropolitan area in Appendix E. These multipliers will remain valid for several years and can be used to update the 2011 impact calculations as office market data become available for 2012 going forward possibly for several additional years.
The results of these analyses—the economic impacts of office building operating expenditures in 2011 of their host states’ economies, the 26 metropolitan area economies and the nation—are presented and discussed in the following pages.

Copyright © 2012 by boMA internAtionAl . All rights reserved.
where america goes to work: The ConTribuTion of offiCe building operaTions To The eConomy, 2012
10
economic impacts of operating expenditures in 94 office markets served by boma local associations
For an easily comparable view of expenditures, Table 2 presents the total 2011 expenditures for office building operations in the office markets served by all 93 BOMA local associations. It also illustrates the buildings’ impacts on their respective state (and metropolitan area) economies.
Organized by state, the data show the total operating expenditures and associated economic impacts specified for each state’s local associations. Local associations representing metropolitan-wide office markets are identified separately (*). The Washington, D.C., metropolitan area (MSA ) is listed under the District of Columbia, while the other 25 metropolitan areas identified separately are listed under their principal host state. For these metropolitan areas, their statewide economic impacts are also reported in Table 2. There are no data provided for several states due to the absence of a BOMA local association serving their office markets.
The 26 metropolitan areas included in Table 2 also generate metropolitan–level economic impacts that are typically smaller than their statewide impacts due to their more limited geographic boundaries. These metropolitan-level economic impacts are presented in Table 3.
Understanding Table 2
The tables reporting economic impacts for each market area consist of four data columns. The first column—Total Expenditure—is the total annual outlay (or expenditures) for office building operations for all commercial and government office buildings within the market area (statewide or metropolitan area) as identified. The square footage of this office space, provided by the CoStar Group Inc., was multiplied by the average operating cost in its respective market area, as reported by BOMA for these respective office markets in 2010 and adjusted for inflation to 2011, to determine total operating expenditures.
The second column in this table—Total Output—represents the total contribution of the annual expenditures for office building operations in each office market (as reported for each of the 93 local associations) to their respective state’s economy—gross state product. In the cases of the 26 metropolitan areas (*) reported separately, the Total Output value represents the contribution of the office building operating expenditures to their respective state’s economy. These metropolitan area’s metropolitan-level economic impact are calculated separately and presented in Table 3.
The third column in the table—Per Earnings—represents the new personal earnings (wages and salaries) generated as a result of the office building operating expenditures reported in column one for each of BOMA’s 93 local associations. These personal earnings represent new income that accrues to workers residing within the state or metropolitan area in which the local associations are located. This is new income earned by workers in businesses that benefit from the payroll spending of employees involved in the office building operations and the re-spending of these expenditures across all sectors of the respective state or metropolitan area economies.
The fourth column in the table—Jobs—represents the indirect employment impact of the total office building operating expenditures in column one for each of BOMA’s local associations. The jobs supported by expenditures for office building operations include those in the businesses benefiting from payroll spending (these tend to be local and focus on consumer goods and services), as well as jobs involved in producing and transporting the materials used to clean and repair office buildings (these jobs may not be local or even within the state). These jobs are generated as a result of the office building operating expenditures throughout the breadth of the local, state and national econo-mies, and they are in addition to the direct, on-site employment that operates and services these office buildings.

Copyright © 2012 by boMA internAtionAl . All rights reserved.
where america goes to work: The ConTribuTion of offiCe building operaTions To The eConomy, 2012
11
Table 2:
eConomiC impaCTs of offiCe building operaTions by sTaTe and meTropoliTan area for 93 boma loCal assoCiaTions, 2011
sTaTe
ToTal expendiTure
ToTal ouTpuT
per earnings
Jobs
alabama Birmingham
Greater Huntsville 303,432,440
172,148,415
559,889,594
317,646,017
169,770,754
96,317,210
5,187
2,943
alaska
Anchorage
99,721,273 172,844,091 51,282,363 1,339
arizona
Greater Tucson
Greater Phoenix*
146,487,501
959,031,646
268,253,918
1,756,218,070
84,333,147
552,116,437
2,173
14,229
arkansas
Greater Little Rock
Northwest Arkansas
171,760,775
53,729,232
291,355,055
91,140,037
85,727,692
26,816,851
2,647
828
california
Greater Los Angeles*
Inland Empire
Oakland-East Bay
Orange County
Sacramento
San Diego*
San Francisco*
Silicon Valley
3,441,780,374
492,185,788
876,804,371
1,077,093,334
988,341,501
725,279,717
2,019,295,398
1,162,686,157
7,321,138,379
1,046,946,600
1,865,083,020
2,291,125,083
2,102,337,775
1,542,769,321
4,295,317,955
2,473,192,744
2,189,567,746
313,115,309
557,799,267
685,217,698
628,756,177
461,403,373
1,284,621,211
739,669,541
48,737
6,970
12,416
15,252
13,995
10,270
28,594
16,464
colorado
Denver Metro*
Southern Colorado
1,023,019,413
158,804,057
2,190,420,626
340,020,607
662,010,185
102,764,328
16,158
2,508
connecticut
Greater Hartford
Southern Connecticut
786,422,717
1,746,600,677
1,376,182,346
3,056,423,684
409,596,476
909,690,764
9,131
20,279
delaware
district of columbia Washington MSA* 4,220,461,446 7,510,117,001 2,366,104,639 61,923
florida
Ft. Lauderdale and the Palm Beaches
Jacksonville
Miami-Dade*
Orlando*
Southwest Florida
Greater Tampa Bay*
Tallahassee
932,890,589
624,772,733
898,721,230
547,979,885
197,875,965
864,714,252
222,116,701
1,745,441,090
1,168,951,658
1,681,510,118
1,025,272,009
370,226,524
1,617,882,959
415,581,013
554,430,870
371,311,807
534,123,508
325,672,665
117,600,654
513,912,650
132,007,287
15,131
10,133
14,576
8,888
3,209
14,025
3,603

Copyright © 2012 by boMA internAtionAl . All rights reserved.
where america goes to work: The ConTribuTion of offiCe building operaTions To The eConomy, 2012
12
sTaTe
ToTal expendiTure
ToTal ouTpuT
per earnings
Jobs
georgia Atlanta* 1,909,220,336
3,770,360,776
1,144,432,491
31,294
hawaii Hawaii 260,263,775
454,048,114 141,114,238 3,613
idaho Boise 147,405,420 232,207,021
71,866,038
2,155
illinois Chicago*
Peoria
Suburban Chicago
1,703,430,987
102,785,914
1,588,074,053
3,517,087,586
212,222,898
3,278,909,203
1,045,054,911
63,059,158
974,283,432
24,256
1,464
22,614
indiana Indianapolis*
Michiana569,593,447
57,613,935
1,053,774,649
106,588,488
305,124,944
30,863,151
8,592
869
iowa Iowa 574,529,065 893,231,828 264,102,393 7,943
kansas Wichita 186,792,701 326,816,246 89,374,143 2,436
kentucky Louisville 513,365,361
947,619,067
265,405,272 8,045
louisiana New Orleans
Shreveport303,624,705
50,570,072
576,811,034
96,070,495
173,585,280
28,911,416
4,964
827
maine
maryland Baltimore 1,189,296,948 2,125,806,451 614,391,993 15,670
massachusetts Boston* 3,067,189,682
5,550,052,124
1,651,215,431 37,503
michigan Metropolitan Detroit*
Mid-Michigan
West Michigan
1,258,440,207
160,411,001
316,002,522
2,334,674,632
297,596,574
586,251,986
719,866,810
91,760,065
180,763,238
19,098
2,434
4,796
minnesota Duluth
Minneapolis*
St. Paul*
38,331,847
778,519,108
211,874,202
71,569,813
1,453,581,590
395,592,653
21,430,607
435,255,241
118,454,841
556
11,293
3,073
mississippi Mississippi 118,675,516 207,481,947 61,118,603 1,928
missouri Kansas City
St. Louis*784,039,040
840,412,691
1,460,885,046
1,565,925,000
405,091,019
434,217,706
10,691
11,460

Copyright © 2012 by boMA internAtionAl . All rights reserved.
where america goes to work: The ConTribuTion of offiCe building operaTions To The eConomy, 2012
13
sTaTe
ToTal expendiTure
ToTal ouTpuT
per earnings
Jobs
nebraska Omaha 235,080,300 357,066,524 104,700,769 3,125
nevadaNevada 564,802,441 936,594,378 287,294,669 7,036
new Jersey New Jersey 3,455,880,532 6,662,187,739 1,869,731,588 41,826
new mexico New Mexico 308,225,501 551,636,420 166,889,931 4,857
new york Capital Region-Albany
Greater Buffalo
Central New York
New York*
Greater Rochester
Long Island
Westchester
449,817,029
205,465,241
168,913,121
8,649,842,359
331,623,978
965,098,519
565,321,608
761,653,133
347,904,225
286,012,312
14,646,354,225
561,522,633
1,634,154,033
957,231,379
208,825,306
95,386,211
78,417,072
4,015,646,066
153,954,774
448,042,162
262,447,730
4,641
2,120
1,743
89,252
3,422
9,958
5,833
north carolina Raleigh-Durham*
Carolinas-West Virginia
Charlotte,Greensboro, Winston Salem (Triad)
259,270,171
1,298,292,568
2,471,641,062
459,326,146
2,300,070,693
4,378,788,965
139,763,993
699,866,680
1,332,380,132
4,127
20,665
39,341
ohio Akron
Greater Cincinnati
Cleveland*
Columbus
Dayton
Toledo
185,147,096
847,329,391
762,738,143
690,318,126
261,355,248
194,761,466
366,087,649
1,675,407,457
1,508,146,875
1,364,952,224
516,772,504
385,097,951
107,953,717
494,052,348
444,729,729
402,503,790
152,388,404
113,559,568
2,907
13,304
11,976
10,839
4,103
3,058
oklahoma Oklahoma City
Tulsa301,350,944
327,177,978
601,672,474
653,238,315
175,354,306
190,382,902
5,155
5,597
oregonPortland Metropolitan* 913,475,115
1,616,810,761 477,838,833 13,152
pennsylvaniaCentral Pennsylvania
Philadelphia*
Pittsburgh
328,172,525
1,956,719,167
1,117,348,098
672,630,940
4,010,542,480
2,290,145,713
196,800,797
1,173,419,047
670,059,129
4,936
29,428
16,804
tennesseeChattanooga
Knoxville
Memphis
Nashville*
102,823,267
228,481,085
327,570,151
472,255,679
200,053,976
444,535,085
637,323,762
918,825,372
58,619,544
130,257,067
186,747,743
269,232,963
1,548
3,440
4,932
7,111

Copyright © 2012 by boMA internAtionAl . All rights reserved.
where america goes to work: The ConTribuTion of offiCe building operaTions To The eConomy, 2012
14
sTaTe
ToTal expendiTure
ToTal ouTpuT
per earnings
Jobs
texasAustin
Corpus Christi
Dallas*
Fort Worth
Houston*
San Antonio
544,746,962
62,421,565
1,679,155,632
385,026,793
2,103,242,727
395,128,669
1,228,227,901
140,740,405
3,785,951,903
868,110,669
4,742,130,899
890,887,126
363,982,488
41,708,093
1,121,958,060
257,262,582
1,405,319,487
264,012,332
9,487
1,087
29,243
6,705
36,628
6,881
utahUtah
457,884,863 965,720,387 288,512,337 8,668
virginiaVirginia 941,015,475 1,745,633,579 498,493,538 13,510
washingtonSeattle-King County*
Spokane
South Puget Sound
Tri Cities (Kennewick)
1,112,145,025
147,070,841
214,175,317
43,895,549
2,096,848,239
277,288,688
403,808,071
82,761,063
621,934,853
82,245,103
119,771,335
24,547,313
15,817
2,092
3,046
624
wisconsinWisconsin 1,061,882,524 1,896,929,952 580,470,649 16,176
State Total
Spill over
US total
79,738,709,975
–
79,738,709,975
152,236,237,741
52,822,384,464
205,058,622,205
45,033,948,171
15,942,332,533
60,976,280,704
1,125,385
436,132
1,561,517

Copyright © 2012 by boMA internAtionAl . All rights reserved.
where america goes to work: The ConTribuTion of offiCe building operaTions To The eConomy, 2012
15
metropolitan-level economic impact of office operating expenditures in 26 selected metropolitan areas, 2011
The economic impacts of office operating expenditures in 26 metropolitan areas on their respective states’ economies are reported in Table 2. This spending also has economic impacts that are captured within their respective metropolitan area economies. These metropolitan-level economic impacts can be measured by applying metropolitan area-level multipliers to the values of these metropolitan area office-operating expenditures. These exclusive, metropolitan-level impacts are presented in Table 3 for 26 of the metropolitan areas and are a sub-set of the state-level economic impacts reported in Table 2.
Table 3: boma meTropoliTan area offiCe markeTs’ sTaTe-level eConomiC impaCTs, 2011
meTropoliTan area
ToTal expendiTures
ToTal ouTpuT
per earnings
Jobs
Atlanta* 1,909,220,336 3,981,571,841 1,320,105,619 36,050
Boston* 3,067,189,682 5,574,384,671 1,661,031,955 40,291
Chicago* 1,703,430,987 3,653,054,375 1,202,397,808 32,804
Cleveland* 762,738,143 1,499,737,687 434,618,109 12,205
Dallas* 1,679,155,632 3,822,754,330 1,274,765,134 32,831
Denver Metro* 1,023,019,413 2,308,343,429 733,953,857 18,112
Houston* 2,103,242,727 4,529,779,898 1,536,602,688 38,984
Indianapolis* 569,593,447 1,188,747,790 375,123,992 10,845
Greater Los Angeles* 3,441,780,374 7,112,666,257 2,161,013,690 52,236
Metropolitan Detroit* 1,258,440,207 2,535,492,745 804,430,217 21,133
Miami-Dade* 898,721,230 1,714,369,651 582,746,979 16,042
Minneapolis* 778,519,108 1,557,777,624 509,477,489 14,485
Nashville* 472,255,679 1,021,739,802 327,273,186 8,920
New York* 8,649,842,359 16,166,903,215 5,072,478,915 123,732
Orlando* 547,979,885 1,083,459,801 336,883,786 9,297
Philadelphia* 1,956,719,167 4,087,389,426 1,329,217,309 33,229
Greater Phoenix* 959,031,646 1,978,672,174 656,762,134 16,880
Portland Metropolitan* 913,475,115 1,922,786,559 622,249,200 16,470
Raleigh-Durham* 259,270,171 502,338,031 149,986,498 4,506
San Diego* 725,279,717 1,413,353,310 457,386,774 10,388
San Francisco* 2,019,295,398 3,908,517,732 1,147,708,199 26,633
Seattle-King County* 1,112,145,025 1,974,063,399 596,268,895 15,557
St. Louis* 840,412,691 1,807,135,208 588,113,238 14,339
St. Paul* 211,874,202 423,949,634 138,654,447 3,942
Greater Tampa Bay* 864,714,252 1,792,065,809 587,070,070 16,162
Washington MSA* 4,220,461,446 7,510,117,001 2,366,104,639 61,923 Note: calculated using metro multipliers Source: CoStar Group Inc.

Copyright © 2012 by boMA internAtionAl . All rights reserved.
where america goes to work: The ConTribuTion of offiCe building operaTions To The eConomy, 2012
16
the direct and indirect Jobs impacts of office building operations in 2011
One of the most important benefits of office building operations’ annual spending is the 1.6 million jobs that this spending supports. These jobs represent workers who are supported by the re-spending of payroll dollars earned by on-site workers, who manage, maintain and service the office buildings, as well as by their tenants, including workers who may be employed by vendors that service the office buildings. (See also indirect jobs, Table 2.)
Since the number of direct jobs associated with office building operations varies depending on the range of services provided to tenants, the size and complexity of the building, their quality and their location, this analysis is based on an estimated 20 to 25 full-time job equivalents per 100,000 square feet of office space.
As shown in Table 4, the 9.9 billion square feet of office space nationwide would therefore directly support an estimated 2.2 million jobs, in addition to the 1.6 million indirect jobs, for a combined total of 3.8 million jobs dependent on expenditures for office building operations in 2011. The total jobs impact of office building operations for all 93 local associations are presented in Appendix C.
Table 4:
direCT and indireCT Jobs assoCiaTed wiTh expendiTures for offiCe building operaTions in 2011
offiCe direCT indireCT ToTal area invenTory Jobs Jobs Jobs
States* 9,908.99 2,229,523 1,125,385 3,354,908 Spillover** 436,132 436,132 U.S. 2,229,523 1,561,517 3,791,040
Sources: CoStar Group Inc.; GMU Center for Regional Analysis *the sum of 93 BOMA local associations, square feet in millions. ** jobs generated or supported outside of the state in which the
direct expenditures for office building operations are occurring.
Copyright © 2012 by boMA internAtionAl . All rights reserved.
where america goes to work: The ConTribuTion of offiCe building operaTions To The eConomy, 2012
17
additional economic impacts: the effects of in-office workers
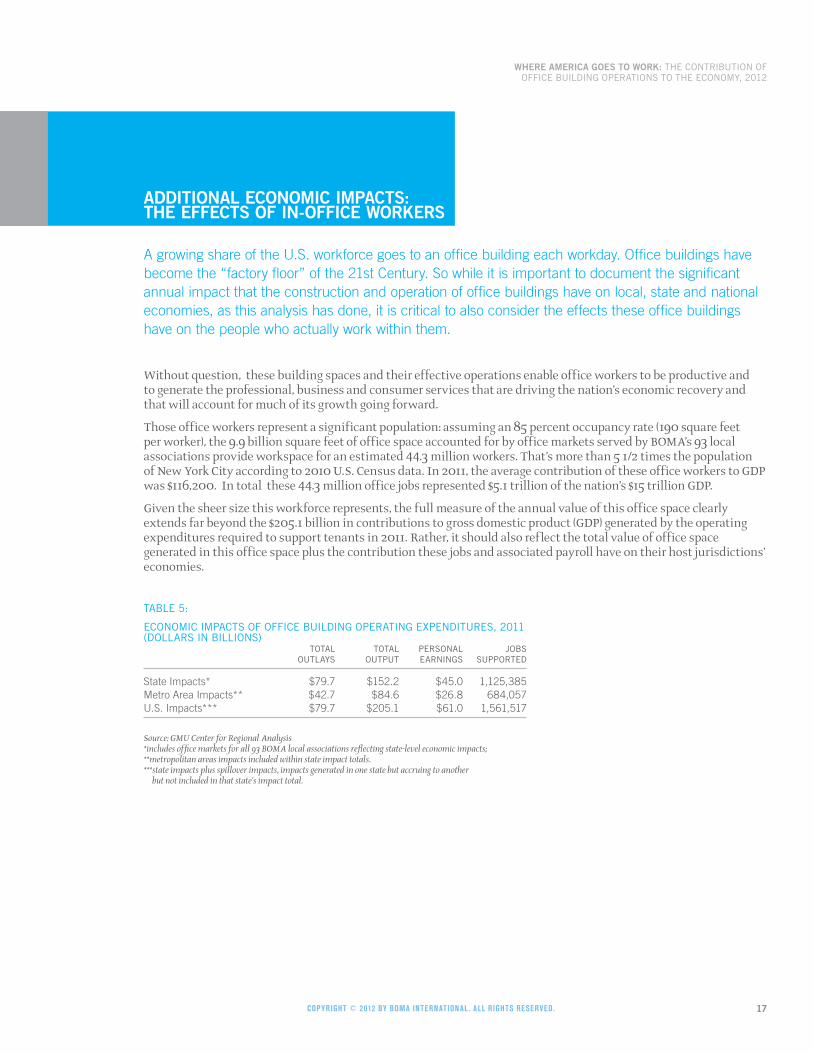
A growing share of the U.S. workforce goes to an office building each workday. Office buildings have become the “factory floor” of the 21st Century. So while it is important to document the significant annual impact that the construction and operation of office buildings have on local, state and national economies, as this analysis has done, it is critical to also consider the effects these office buildings have on the people who actually work within them.
Without question, these building spaces and their effective operations enable office workers to be productive and to generate the professional, business and consumer services that are driving the nation’s economic recovery and that will account for much of its growth going forward.
Those office workers represent a significant population: assuming an 85 percent occupancy rate (190 square feet per worker), the 9.9 billion square feet of office space accounted for by office markets served by BOMA’s 93 local associations provide workspace for an estimated 44.3 million workers. That’s more than 5 1/2 times the population of New York City according to 2010 U.S. Census data. In 2011, the average contribution of these office workers to GDP was $116,200. In total these 44.3 million office jobs represented $5.1 trillion of the nation’s $15 trillion GDP.
Given the sheer size this workforce represents, the full measure of the annual value of this office space clearly extends far beyond the $205.1 billion in contributions to gross domestic product (GDP) generated by the operating expenditures required to support tenants in 2011. Rather, it should also reflect the total value of office space generated in this office space plus the contribution these jobs and associated payroll have on their host jurisdictions’ economies.
Table 5:
eConomiC impaCTs of offiCe building operaTing expendiTures, 2011 (dollars in billions) ToTal ToTal personal Jobs ouTlays ouTpuT earnings supporTed
State Impacts* $79.7 $152.2 $45.0 1,125,385 Metro Area Impacts** $42.7 $84.6 $26.8 684,057 U.S. Impacts*** $79.7 $205.1 $61.0 1,561,517
Source: GMU Center for Regional Analysis *includes office markets for all 93 BOMA local associations reflecting state-level economic impacts; **metropolitan areas impacts included within state impact totals. *** state impacts plus spillover impacts, impacts generated in one state but accruing to another
but not included in that state’s impact total.

Copyright © 2012 by boMA internAtionAl . All rights reserved.
where america goes to work: The ConTribuTion of offiCe building operaTions To The eConomy, 2012
18
conclusions
The commercial real estate industry is a major source of economic activity at the local, state and national levels, creating jobs and expanding personal earnings from the moment the ground is broken for the construction of a new building, through its ribbon cutting, and continuing throughout the lifetime of the building.
Given that the national office market is much larger than the 9.9 billion square feet represented by the 93 BOMA local associations that are included in this analysis, the magnitude of real estate’s impact becomes even more impressive when one considers that the 9.9 billion square feet represented by BOMA:
• Results in $80 billion of direct operating expenditures;
• Contributes $205 billion toward the gross domestic product;
• Creates $61 million in new earnings;
• Supports 3.8 million jobs; and
• Houses 44 million office workers.
Each annually recurring expenditure, in turn, grows each year as the inventory of building space increases, while maintaining a productive work environment for millions of workers and businesses; generating a relatively stable source of jobs and personal income; and contributing to the local tax base year after year, throughout the ups and downs of a business cycle.
A Closer Look
The key findings of this research, summarized in more detail below, are also illustrated in Table 5:
• The operating expenditures for the 9.9 billion square feet of office buildings included in this analysis totaled $79.7 billion in 2011;
• These $79.7 billion in annual expenditures for office building operations added a total of $205.1 billion to the nation’s economy (GDP) in 2011, reflecting a total output multiplier of 2.57;
• These $79.7 billion in annual expenditures for office building operations generated a total of $61.0 billion in new personal earnings, or 76 cents for each dollar spent accruing to workers residing within states served by the 94 office markets represented by BOMA’s local associations; and
• The $79.7 billion in annual expenditures for office building operations supported a significant workforce, both locally and beyond the local labor markets:
– direct employment by office building managers was estimated to total approximately 2.2 million workers (on-site and directly supported);
– the indirect job impact of this spending and re-spending of payroll dollars in the state and national economies is estimated to support 1.6 million jobs (19.6 jobs per $1 million in direct operating expenditures) across all sectors; and
– the 9.9 billion square feet of office space benefiting from these operating expenditures have the capacity to provide a quality working environment to more than 44.3 million office workers.

Copyright © 2012 by boMA internAtionAl . All rights reserved.
where america goes to work: The ConTribuTion of offiCe building operaTions To The eConomy, 2012
19
appendix a
glossary of Terms
Direct Outlays/Expenditures — The annual spending associated with the operations (maintenance and repair, utilities, management, services to buildings) of office buildings.
Economic Impact — The generation of new spending measured in dollars within a jurisdiction as a result of direct expenditures associated with office building operations, including the direct expenditures plus the indirect and induced economic activity these direct expenditures generate as they are re-cycled through the local, state and nation-al economies.
Gross Regional Product (GRP), Gross State Product (GSP), Gross Domestic Product (GDP) — The value of goods and services produced within the economy of the respective geographic area (metropolitan area, state and national).
Indirect Benefit — The additional economic benefits—measured in dollars or jobs—resulting from the accumulated additional value generated by the direct outlays or expenditures, as these dollars are re-spent within the metropoli-tan, state and national economies. Indirect benefits are inclusive of “induced” benefits that are benefits generated by the payroll spending associated with the operations of office buildings. These additional benefits—indirect and induced—generally affect the broad base of the local economy as measured by increased jobs and personal earnings in retail and consumer services, education and health, transportation, housing, utilities, and government.
Multiplier — A number used to calculate the total economic impact of direct spending for office building operations. Types of multipliers include: (1) output multiplier—measures the contribution (impact) of a direct expenditure on the overall economy; (2) personal earnings multiplier—measures the total personal earnings (wages and salaries) gener-ated within the jurisdiction as a result of the direct expenditures and the jobs they support; and (3) employment multiplier—measures the total number of jobs that can be supported by this direct expenditure (per $1 million).
Office Building Inventory — Square feet of office space in buildings within the service areas of BOMA’s 93 local associations inclusive of publicly owned and occupied buildings, owner-occupied buildings and tenant-occupied buildings.
Operating Costs — Costs (expenditures) associated with the day-to-day operation of the office building inventory, including maintenance and repairs, utilities, management/administrative, and services to buildings, including cleaning, security and grounds. Taxes, fixed expenses, direct leasing expenses and parking costs are excluded costs.
Spillover Impacts — Economic impacts that are generated by direct spending for office building operations in a given state or metropolitan area that are realized by another state due to workers commuting across state lines (earning wages in one state and spending these earnings in their home state) and payments to vendors located in another state. These economic impacts are not reflected in the benefitting states’ multipliers but are captured in the U.S. multipliers and reported in the U.S. totals.
Total Output — The sum of the direct and indirect impacts (expenditures) reflecting the combination of the initial expenditures and their subsequent accumulated value as these are cycled through the economy inclusive of benefits generated by the re-spending of personal earnings; contribution to GDP (gross domestic product), GSP (gross state product) or GRP (gross regional product).
Unit of Analysis — The 94 markets represented by BOMA’s 93 local associations are defined by their general office market areas, normally a political unit (state, metropolitan area) for which economic information is reported. In this analysis, the state is the primary unit of analysis, with selected metropolitan areas being reported separately along with an estimate for the nation. Metropolitan area impacts are reported both at the metropolitan area scale and for their respective states, as their impacts extend beyond the metropolitan area boundaries.

Copyright © 2012 by boMA internAtionAl . All rights reserved.
where america goes to work: The ConTribuTion of offiCe building operaTions To The eConomy, 2012
20
appendix b
offiCe markeT invenTory and annual operaTion CosTs, by sTaTe and meTropoliTan areas, 2011
sTaTe sq.fT. CosT/sf
alabama
Birmingham 46,581,430 6.51
Greater Huntsville 19,472,794 8.84
alaska
Anchorage 12,396,514 8.04
arizona
Greater Tucson 23,533,983 6.22
Greater Phoenix* 156,487,174 6.13
arkansas
Greater Little Rock 28,060,386 6.12
Northwest Arkansas 16,038,250 3.35
california
Greater Los Angeles* 399,705,065 8.61
Inland Empire 68,590,024 7.18
Oakland-East Bay 110,994,307 7.90
Orange County 150,318,163 7.17
Sacramento 156,699,840 6.31
San Diego* 112,305,433 6.46
San Francisco* 187,247,466 10.78
Silicon Valley 121,173,006 9.60
colorado Denver Metro* 162,291,296 6.30
Southern Colorado 31,027,569 5.12
connecticut
Greater Hartford 85,844,739 9.16
Southern Connecticut 97,305,023 17.95
delaware
district of columbia
Washington MSA* 445,868,921 9.47
florida
Ft. Lauderdale and the Palm Beaches 123,256,828 7.57
Jacksonville 86,197,646 7.25
Miami-Dade* 99,492,005 9.03
Orlando* 83,914,717 6.53
Southwest Florida 31,632,173 6.26
Greater Tampa Bay* 143,264,232 6.04
Tallahassee 20,114,133 11.04

Copyright © 2012 by boMA internAtionAl . All rights reserved.
where america goes to work: The ConTribuTion of offiCe building operaTions To The eConomy, 2012
21
sTaTe sq.fT. CosT/sf
georgia
Atlanta* 298,488,241 6.40
hawaii
Hawaii 32,353,814 8.04
idaho
Boise 31,401,396 4.69
illinois
Chicago* 213,120,682 7.99
Peoria 15,460,160 6.65
Suburban Chicago 238,864,238 6.65
indiana
Indianapolis* 86,137,593 6.61
Michiana 9,134,590 6.31
iowa
Iowa 89,046,893 6.45
kansas
Wichita 21,055,423 8.87
kentucky
Louisville 90,108,616 5.70
louisiana
New Orleans 47,134,664 6.44
Shreveport 7,812,870 6.47
maine
maryland
Baltimore 126,676,429 9.39
massachusetts
Boston* 310,516,586 9.88
michigan
Metropolitan Detroit* 193,320,666 6.51
Mid-Michigan 22,290,318 7.20
West Michigan 47,902,836 6.60
minnesota
Duluth 5,030,181 7.62
Minneapolis* 106,757,598 7.29
St. Paul* 26,680,040 7.94
mississippi
Mississippi 25,908,887 4.58
missouri
Kansas City 109,104,896 7.19
St. Louis* 131,814,968 6.38

Copyright © 2012 by boMA internAtionAl . All rights reserved.
where america goes to work: The ConTribuTion of offiCe building operaTions To The eConomy, 2012
22
sTaTe sq.fT. CosT/sf
nebraska
Omaha 36,611,371 6.42
nevada
Nevada 77,812,758 7.26
new Jersey New Jersey 391,374,212 8.83
new mexico New Mexico 50,525,185 6.10
new york Capital Region-Albany 58,005,074 7.75
Greater Buffalo 40,972,077 5.01
Central New York 26,264,211 6.43
New York* 618,402,445 13.99
Greater Rochester 42,201,092 7.86
Long Island 83,862,507 11.51
Westchester 49,123,780 11.51
north carolina Raleigh-Durham* 45,354,705 5.72
Carolinas-West Virginia 201,223,796 6.45
Charlotte,Greensboro, Winston Salem (Triad) 368,610,064 6.71
ohio
Akron 27,935,100 6.63
Greater Cincinnati 135,006,580 6.28
Cleveland* 98,212,529 7.77
Columbus 97,750,712 7.06
Dayton 41,573,731 6.29
Toledo 28,155,826 6.92
oklahoma Oklahoma City 48,819,079 6.17
Tulsa 43,168,946 7.58
oregon
Portland Metropolitan* 108,951,971 8.38
pennsylvania
Central Pennsylvania 53,522,807 6.13
Philadelphia* 239,864,564 8.16
Pittsburgh 125,363,926 8.91
tennessee Chattanooga 14,226,746 7.23
Knoxville 33,279,250 6.87
Memphis 48,293,851 6.78
Nashville* 73,126,102 6.46

Copyright © 2012 by boMA internAtionAl . All rights reserved.
where america goes to work: The ConTribuTion of offiCe building operaTions To The eConomy, 2012
23
sTaTe sq.fT. CosT/sf
texas
Austin 73,685,177 7.39
Corpus Christi 9,188,839 6.79
Dallas* 235,584,998 7.13
Fort Worth 47,863,308 8.04
Houston* 280,107,439 7.51
San Antonio 63,797,414 6.19
utah
Utah 86,661,608 5.28
virginia
Virginia 155,042,235 6.07
washington
Seattle-King County* 144,351,932 7.70
Spokane 21,135,030 6.96
South Puget Sound 32,264,560 6.64
Tri Cities (Kennewick) 9,208,967 4.77
wisconsin Wisconsin 136,568,327 7.78
State Total 9,908,990,533 8.05
Source: CoStar Group Inc., BOMA International 2011 Experience Exchange Report®

Copyright © 2012 by boMA internAtionAl . All rights reserved.
where america goes to work: The ConTribuTion of offiCe building operaTions To The eConomy, 2012
24
appendix c
direCT and indireCT Jobs assoCiaTed wiTh operaTing ouTlays/expendiTures for offiCe buildings in 2011
sTaTe offiCe invenTory direCT Jobs indireCT Jobs ToTal Jobs
alabama
Birmingham 46,581,430 10,481 5,187 15,668
Greater Huntsville 19,472,794 4,381 2,943 7,324
alaska
Anchorage 12,396,514 2,789 1,339 4,128
arizona
Greater Tucson 23,533,983 5,295 2,173 7,469
Greater Phoenix* 156,487,174 35,210 14,229 49,439
arkansas
Greater Little Rock 28,060,386 6,314 2,647 8,961
Northwest Arkansas 16,038,250 3,609 828 4,437
california
Greater Los Angeles* 399,705,065 89,934 48,737 138,671
Inland Empire 68,590,024 15,433 6,970 22,402
Oakland-East Bay 110,994,307 24,974 12,416 37,390
Orange County 150,318,163 33,822 15,252 49,074
Sacramento 156,699,840 35,257 13,995 49,253
San Diego* 112,305,433 25,269 10,270 35,539
San Francisco* 187,247,466 42,131 28,594 70,725
Silicon Valley 121,173,006 27,264 16,464 43,728
colorado
Denver Metro* 162,291,296 36,516 16,158 52,673
Southern Colorado 31,027,569 6,981 2,508 9,489
connecticut
Greater Hartford 85,844,739 19,315 9,131 28,446
Southern Connecticut 97,305,023 21,894 20,279 42,173
delaware
district of columbia
Washington MSA* 445,868,921 100,321 61,923 162,244
florida
Ft. Lauderdale and the Palm Beaches 123,256,828 27,733 15,131 42,863
Jacksonville 86,197,646 19,394 10,133 29,528
Miami-Dade* 99,492,005 22,386 14,576 36,962
Orlando* 83,914,717 18,881 8,888 27,769
Southwest Florida 31,632,173 7,117 3,209 10,327
Greater Tampa Bay* 143,264,232 32,234 14,025 46,259
Tallahassee 20,114,133 4,526 3,603 8,128

Copyright © 2012 by boMA internAtionAl . All rights reserved.
where america goes to work: The ConTribuTion of offiCe building operaTions To The eConomy, 2012
25
sTaTe offiCe invenTory direCT Jobs indireCT Jobs ToTal Jobs
georgia
Atlanta* 298,488,241 67,160 31,294 98,454
hawaii
Hawaii 32,353,814 7,280 3,613 10,892
idaho
Boise 31,401,396 7,065 2,155 9,221
illinois
Chicago* 213,120,682 47,952 24,256 72,208
Peoria 15,460,160 3,479 1,464 4,942
Suburban Chicago 238,864,238 53,744 22,614 76,358
indiana
Indianapolis* 86,137,593 19,381 8,592 27,973
Michiana 9,134,590 2,055 869 2,924
iowa
Iowa 89,046,893 20,036 7,943 27,979
kansas
Wichita 21,055,423 4,737 2,436 7,174
kentucky
Louisville 90,108,616 20,274 8,045 28,320
louisiana
New Orleans 47,134,664 10,605 4,964 15,569
Shreveport 7,812,870 1,758 827 2,585
maine
maryland
Baltimore 126,676,429 28,502 15,670 44,173
massachusetts
Boston* 310,516,586 69,866 37,503 107,370
michigan
Metropolitan Detroit* 193,320,666 43,497 19,098 62,595
Mid-Michigan 22,290,318 5,015 2,434 7,450
West Michigan 47,902,836 10,778 4,796 15,574
minnesota
Duluth 5,030,181 1,132 556 1,688
Minneapolis* 106,757,598 24,020 11,293 35,313
St. Paul* 26,680,040 6,003 3,073 9,076
mississippi
Mississippi 25,908,887 5,829 1,928 7,757
missouri
Kansas City 109,104,896 24,549 10,691 35,239
St. Louis* 131,814,968 29,658 11,460 41,118
nebraska
Omaha 36,611,371 8,238 3,125 11,363

Copyright © 2012 by boMA internAtionAl . All rights reserved.
where america goes to work: The ConTribuTion of offiCe building operaTions To The eConomy, 2012
26
sTaTe offiCe invenTory direCT Jobs indireCT Jobs ToTal Jobs
nevada
Nevada 77,812,758 17,508 7,036 24,544
new Jersey New Jersey 391,374,212 88,059 41,826 129,886
new mexico New Mexico 50,525,185 11,368 4,857 16,225
new york Capital Region-Albany 58,005,074 13,051 4,641 17,693
Greater Buffalo 40,972,077 9,219 2,120 11,339
Central New York 26,264,211 5,909 1,743 7,652
New York* 618,402,445 139,141 89,252 228,393
Greater Rochester 42,201,092 9,495 3,422 12,917
Long Island 83,862,507 18,869 9,958 28,827
Westchester 49,123,780 11,053 5,833 16,886
north carolina Raleigh-Durham* 45,354,705 10,205 4,127 14,332
Carolinas-West Virginia 201,223,796 45,275 20,665 65,940
Charlotte,Greensboro, Winston Salem (Triad) 368,610,064 82,937 39,341 122,278
ohio
Akron 27,935,100 6,285 2,907 9,192
Greater Cincinnati 135,006,580 30,376 13,304 43,680
Cleveland* 98,212,529 22,098 11,976 34,073
Columbus 97,750,712 21,994 10,839 32,832
Dayton 41,573,731 9,354 4,103 13,458
Toledo 28,155,826 6,335 3,058 9,393
oklahoma
Oklahoma City 48,819,079 10,984 5,155 16,139
Tulsa 43,168,946 9,713 5,597 15,310
oregon
Portland Metropolitan* 108,951,971 24,514 13,152 37,666
pennsylvania
Central Pennsylvania 53,522,807 12,043 4,936 16,978
Philadelphia* 239,864,564 53,970 29,428 83,398
Pittsburgh 125,363,926 28,207 16,804 45,011
tennessee
Chattanooga 14,226,746 3,201 1,548 4,749
Knoxville 33,279,250 7,488 3,440 10,928
Memphis 48,293,851 10,866 4,932 15,798
Nashville* 73,126,102 16,453 7,111 23,564

Copyright © 2012 by boMA internAtionAl . All rights reserved.
where america goes to work: The ConTribuTion of offiCe building operaTions To The eConomy, 2012
27
sTaTe offiCe invenTory direCT Jobs indireCT Jobs ToTal Jobs
texas
Austin 73,685,177 16,579 9,487 26,066
Corpus Christi 9,188,839 2,067 1,087 3,155
Dallas* 235,584,998 53,007 29,243 82,249
Fort Worth 47,863,308 10,769 6,705 17,475
Houston* 280,107,439 63,024 36,628 99,652
San Antonio 63,797,414 14,354 6,881 21,236
utah
Utah 86,661,608 19,499 8,668 28,167
virginia
Virginia 155,042,235 34,885 13,510 48,395
washington
Seattle-King County* 144,351,932 32,479 15,817 48,296
Spokane 21,135,030 4,755 2,092 6,847
South Puget Sound 32,264,560 7,260 3,046 10,306
Tri Cities (Kennewick) 9,208,967 2,072 624 2,696
wisconsin
Wisconsin 136,568,327 30,728 16,176 46,904
State Total 9,908,990,533 2,229,523 1,125,385 3,354,908
Spill over 436,132 436,132
US total 2,229,523 1,561,517 3,791,040

Copyright © 2012 by boMA internAtionAl . All rights reserved.
where america goes to work: The ConTribuTion of offiCe building operaTions To The eConomy, 2012
28
appendix d
eConomiC mulTipliers and impaCT CalCulaTions
The total economic impacts of annual expenditures for the operation of office buildings reflect the combination of direct expenditures and their subsequent monetary effects as these funds are circulated through the economy; that is, the re-spending of these direct expenditures will generate additional economic activity that otherwise would not have occurred. The total value of these combined direct and indirect values can be estimated by the application of appropriate multipliers that have been calculated for each state and metropolitan area by type of expenditures by the Bureau of Economic Analysis of the U.S. Department of Commerce employing its Regional Input-Output Model System (RIMS II).
For this analysis, state and metropolitan area multipliers were purchased for: construction (maintenance and repair), utilities, management and services to buildings. These multipliers were weighed by their share of operating cost expenditures for office buildings (BOMA’s income and expense data) and combined into a single series of multipliers representing building operations expenditures. These aggregate multipliers, a different set for each state and metropolitan area, see Appendix E, were applied to the market data for each of the 94 markets represented by 93 BOMA local associations (square feet of office space and average operating cost per square foot) to calculate the total economic impacts generated by these direct expenditures for office building operations in 2011.
The results of these calculations are estimates of: (1) output value—total contribution to the U.S., state and metropoli-tan area economies; (2) personal earnings—new earnings realized by residents of the state or metropolitan area in which the spending occurs; and (3) the jobs supported by these expenditures—full-time, year-round jobs throughout the state (or metropolitan area) and nation. The key variables governing the magnitude and significance of these economic impacts are their dollar value, the category of outlay (e.g., maintenance and repair, utilities, management and services to buildings), the direct employment and payroll associated with the direct spending (payroll) for building operations, and the geographic area of analysis and the complexity of the respective state economies. The size and complexity of the states’ or metropolitan areas’ economies determine the extent to which they can provide the inputs and retain the outputs of these economic activities; i.e., how self-sufficient the states or metropolitan areas are. Larger states retain a greater share of this direct spending for building operations than smaller states or their constituent metropolitan areas. At the national level, interstate transfers (spillover impacts) add to the magnitude of these secondary economic impacts. The degree to which the direct expenditures are retained internally by the state is reflected in the respective state economic multipliers. The aggregate multipliers for office building operations are presented in Appendix E.

Copyright © 2012 by boMA internAtionAl . All rights reserved.
where america goes to work: The ConTribuTion of offiCe building operaTions To The eConomy, 2012
29
appendix e
aggregaTe eConomiC impaCT mulTipliers for building operaTions
Jobs Jobs sTaTe ouTpuT earnings (per million) ouTpuT earnings (per million)
alabama
Birmingham 1.845187 0.559501 17.093808
Greater Huntsville 1.845187 0.559501 17.093808
alaska
Anchorage 1.733272 0.514257 13.425086
arizona
Greater Tucson 1.831241 0.575702 14.83728
Greater Phoenix* 1.831241 0.575702 14.83728 2.063198 0.684818 17.60099
arkansas
Greater Little Rock 1.696284 0.499111 15.412062
Northwest Arkansas 1.696284 0.499111 15.412062
california
Greater Los Angeles* 2.127137 0.636173 14.160471 2.066565987 0.627876696 15.17713605
Inland Empire 2.127137 0.636173 14.160471
Oakland-East Bay 2.127137 0.636173 14.160471
Orange County 2.127137 0.636173 14.160471
Sacramento 2.127137 0.636173 14.160471
San Diego* 2.127137 0.636173 14.160471 1.948701 0.630635 14.323194
San Francisco* 2.127137 0.636173 14.160471 1.935584925 0.568370631 13.18935667
Silicon Valley 2.127137 0.636173 14.160471
colorado
Denver Metro* 2.141133 0.647114 15.794342 2.25640237 0.717438836 17.70441849
Southern Colorado 2.141133 0.647114 15.794342
connecticut
Greater Hartford 1.749927 0.520835 11.61072
Southern Connecticut 1.749927 0.520835 11.61072
delaware
district of columbia Washington MSA* 1.779454 0.560627 14.672163 1.779454 0.560627 14.672163
florida
Ft. Lauderdale and the Palm Beaches 1.871003 0.594315 16.219099
Jacksonville 1.871003 0.594315 16.219099
Miami-Dade* 1.871003 0.594315 16.219099 1.907565542 0.648417951 17.84974177
Orlando* 1.871003 0.594315 16.219099 1.977189 0.614774 16.965909
Southwest Florida 1.871003 0.594315 16.219099
Greater Tampa Bay* 1.871003 0.594315 16.219099 2.072437 0.678918 18.690387
Tallahassee 1.871003 0.594315 16.219099

Copyright © 2012 by boMA internAtionAl . All rights reserved.
where america goes to work: The ConTribuTion of offiCe building operaTions To The eConomy, 2012
30
Jobs Jobs sTaTe ouTpuT earnings (per million) ouTpuT earnings (per million)
georgia
Atlanta* 1.974817 0.599424 16.391214 2.085443867 0.69143702 18.88191255
hawaii
Hawaii 1.744569 0.542197 13.880152
idaho
Boise 1.575295 0.48754 14.621593
illinois
Chicago* 2.064708 0.6135 14.239671 2.14452737 0.705868225 19.25774956
Peoria 2.064708 0.6135 14.239671
Suburban Chicago 2.064708 0.6135 14.239671
indiana
Indianapolis* 1.850047 0.535689 15.085162 2.087011 0.658582 19.040424
Michiana 1.850047 0.535689 15.085162
iowa
Iowa 1.55472 0.459685 13.825699
kansas
Wichita 1.74962 0.478467 13.042893
kentucky
Louisville 1.845896 0.516991 15.671616
louisiana
New Orleans 1.89975 0.57171 16.349296
Shreveport 1.89975 0.57171 16.349296
maine
maryland
Baltimore 1.787448 0.516601 13.176244
massachusetts
Boston* 1.809491 0.538348 12.227263 1.817424173 0.541548495 13.13599401
michigan
Metropolitan Detroit* 1.855213 0.572031 15.175917 2.01479 0.639228 16.793332
Mid-Michigan 1.855213 0.572031 15.175917
West Michigan 1.855213 0.572031 15.175917
minnesota
Duluth 1.867111 0.559081 14.505183
Minneapolis* 1.867111 0.559081 14.505183 2.000949763 0.654418735 18.60543816
St. Paul* 1.867111 0.559081 14.505183 2.000949763 0.654418735 18.60543816
mississippi
Mississippi 1.748313 0.515006 16.245492
missouri
Kansas City 1.863281 0.516672 13.635584
St. Louis* 1.863281 0.516672 13.635584 2.150295 0.699791 17.061854

Copyright © 2012 by boMA internAtionAl . All rights reserved.
where america goes to work: The ConTribuTion of offiCe building operaTions To The eConomy, 2012
31
Jobs Jobs sTaTe ouTpuT earnings (per million) ouTpuT earnings (per million)
nebraska
Omaha 1.518913 0.445383 13.293778
nevada
Nevada 1.658269 0.508664 12.457514
new Jersey New Jersey 1.927783 0.541029 12.102962
new mexico New Mexico 1.789717 0.541454 15.757311
new york Capital Region-Albany 1.693251 0.464245 10.318343
Greater Buffalo 1.693251 0.464245 10.318343
Central New York 1.693251 0.464245 10.318343
New York* 1.693251 0.464245 10.318343 1.869040214 0.586424435 14.30454837
Greater Rochester 1.693251 0.464245 10.318343
Long Island 1.693251 0.464245 10.318343
Westchester 1.693251 0.464245 10.318343
north carolina Raleigh-Durham* 1.771612 0.539067 15.916901 1.937508 0.578495 17.379335
Carolinas-West Virginia 1.771612 0.539067 15.916901
Charlotte, Greensboro, Winston Salem (Triad) 1.771612 0.539067 15.916901
ohio Akron 1.97728 0.58307 15.700768
Greater Cincinnati 1.97728 0.58307 15.700768
Cleveland* 1.97728 0.58307 15.700768 1.966255 0.569813 16.002004
Columbus 1.97728 0.58307 15.700768
Dayton 1.97728 0.58307 15.700768
Toledo 1.97728 0.58307 15.700768
oklahoma Oklahoma City 1.996584 0.581894 17.105593
Tulsa 1.996584 0.581894 17.105593
oregon
Portland Metropolitan* 1.769956 0.5231 14.397407 2.104914 0.681189 18.029765
Pennsylvania
Central Pennsylvania 2.049626 0.599687 15.039594
Philadelphia* 2.049626 0.599687 15.039594 2.088899365 0.679309188 16.98222784
Pittsburgh 2.049626 0.599687 15.039594
tennessee
Chattanooga 1.94561 0.5701 15.056689
Knoxville 1.94561 0.5701 15.056689
Memphis 1.94561 0.5701 15.056689
Nashville* 1.94561 0.5701 15.056689 2.163531 0.693 18.88829

Copyright © 2012 by boMA internAtionAl . All rights reserved.
where america goes to work: The ConTribuTion of offiCe building operaTions To The eConomy, 2012
32
Jobs Jobs sTaTe ouTpuT earnings (per million) ouTpuT earnings (per million)
texas
Austin 2.254676 0.668168 17.415071
Corpus Christi 2.254676 0.668168 17.415071
Dallas* 2.254676 0.668168 17.415071 2.276593222 0.759170329 19.5521667
Fort Worth 2.254676 0.668168 17.415071
Houston* 2.254676 0.668168 17.415071 2.153712379 0.730587425 18.5354143
San Antonio 2.254676 0.668168 17.415071
utah
Utah 2.10909 0.630098 18.931278
virginia
Virginia 1.855053 0.52974 14.357285
washington
Seattle-King County* 1.885409 0.559221 14.222342 1.775005377 0.536143112 13.98870181
Spokane 1.885409 0.559221 14.222342
South Puget Sound 1.885409 0.559221 14.222342
Tri Cities (Kennewick) 1.885409 0.559221 14.222342
wisconsin
Wisconsin 1.786384 0.546643 15.233359
US total 2.57163205 0.764701118 19.58292591
Source: CoStar Group Inc.

Copyright © 2012 by boMA internAtionAl . All rights reserved.
where america goes to work: The ConTribuTion of offiCe building operaTions To The eConomy, 2012
33
appendix f
boma loCal assoCiaTion TerriTories defined
boma loCal
markeT
loCal assoCiaTion TerriTory
square feeT/ mulTiplier Type
alabama
BOMA/Birmingham Birmingham Birmingham (includes Blount, Jefferson, Shelby, St. Clair, Walker Counties)
46,581,430/State
BOMA/Greater Huntsville Huntsville AL Counties – Cherokee, Cullman, Colbert, Dekalb, Franklin, Jackson, Lauderdale Lawrence, Limestone, Madison, Marion, Marshall, Morgan, Winston. TN Counties – Franklin, Giles, Lawrence, Lincoln.
19,472,794/State
alaska
BOMA/Anchorage Anchorage Anchorage 12,396,514/State
arizona
BOMA/Greater Phoenix Phoenix Maricopa County 156,487,174/Metro
BOMA/Greater Tucson Tucson Pima County 23,533,983/State
arkansas
BOMA/Greater Little Rock Little Rock Pulaski County – Includes Little Rock, North Little Rock and Jacksonville
28,060,386/State
Northwest Arkansas Bentonville, Northwest Arkansas Counties – Benton, Boone, Carroll, Washington, Madison, Franklin, Crawford, Sebastian
16,038,250/State
california
BOMA/Greater Los Angeles Greater Los Angeles, Mid Counties, Southern California Submarket
Los Angeles County 399,705,065/Metro
BOMA/Inland Empire Inland Empire Counties – Riverside, San Bernardino
68,590,024/State
BOMA/Oakland-East Bay Oakland, I-680 Contra Costa County Submarket
Counties – Alameda, Contra Costa
110,994,307/State
BOMA/Orange County Orange County, Mid Counties, Southern California Submarket
Orange County 150,318,163/State

Copyright © 2012 by boMA internAtionAl . All rights reserved.
where america goes to work: The ConTribuTion of offiCe building operaTions To The eConomy, 2012
34
boma loCal
markeT
loCal assoCiaTion TerriTory
square feeT/ mulTiplier Type
BOMA/Sacramento Sacramento Counties – Alpine, Amador, Butte, Colusa, El Dorado, Fresno, Glenn, Lassen, Madera, Mariposa, Merced, Nevada, Placer, Plumas, Sacramento, San Joaquin, Shasta, Sierra, Stanislaus, Sutter, Tehama, Tuolumne, Yolo, Yuba
156,699,840/State
BOMA/San Diego San Diego San Diego County 112,305,433/Metro
BOMA/San Francisco Marin County, San Francisco County, San Mateo County, Sonoma County
San Francisco City; Counties – San Mateo, Marin, Sonoma, San Francisco
187,247,466/Metro
BOMA/Silicon Valley Silicon Valley Counties – Santa Clara, Santa Cruz, San Benito, Monterrey
121,173,006/State
colorado
BOMA/Denver Metro Denver Counties – Adams, Arapahoe, Boulder, Denver, Douglas, Jefferson
162,291,296/Metro
BOMA/Southern Colorado Colorado Springs Counties – El Paso, Pueblo, Teller, Colorado Springs; Cities – Colorado Springs, Cripple Creek, Divide
31,027,569/State
connecticut
BOMA/Greater Hartford Hartford North of Hartford up to and including Springfield, MA; South to New Haven, CT; East to RI; West to Fairfield County
85,844,739/State
BOMA/Southern Connecticut Fairfield County, New Haven Counties – New Haven, Fairfield NY – 488
CT – 97,304,535
Total – 97,305,023/ State
district of columbia
BOMA/Metropolitan Washington District of Columbia, Northern Virginia, Suburban Maryland
District of Columbia;
Maryland Counties – Calvert, Montgomery, Prince George’s;
Virginia Counties – Arlington, Fairfax, Loudon, Prince William; Virginia Cities – Alexandria, Fairfax, Falls Church
DC – 147,735,477
MD – 95,793,925
NOVA – 202,339,519
Total Metro – 445,868,921

Copyright © 2012 by boMA internAtionAl . All rights reserved.
where america goes to work: The ConTribuTion of offiCe building operaTions To The eConomy, 2012
35
boma loCal
markeT
loCal assoCiaTion TerriTory
square feeT/ mulTiplier Type
florida
BOMA/Ft. Lauderdale and the Palm Beaches
Palm Beach County, Fort Lauderdale
Counties – Broward, Palm Beach 123,256,828/State
BOMA/Jacksonville Jacksonville Counties – Alachua, Baker, Bradford, Clay, Duval, Flagler, Marion, Nassau, Putnam, St. Johns, Union, Volusia
86,197,646/State
BOMA/Miami-Dade Miami Miami-Dade County 99,492,005/Metro
BOMA/Orlando Orlando Counties – Orange, Osceola, Seminole
83,914,717/Metro
BOMA/Southwest Florida Fort Myers, Naples, Port Charlotte Counties – Charlotte, Collier, Lee 31,632,173/State
BOMA/Greater Tampa Bay Tampa Bay Counties – Hillsborough, Polk, Pasco, Pinellas, Manatee, Sarasota
143,264,232/Metro
BOMA/Tallahassee Tallahassee Leon County 20,114,133/State
georgia
BOMA/Georgia Entire State Entire State Atlanta – 298,488,241/ Metro 334,481,603/State
hawaii
BOMA/Hawaii Entire State Entire State 32,353,814/State
idaho
BOMA/Boise Boise 150 mile radius of Boise 31,401,396/State
illinois
BOMA/Chicago Metropolitan Chicago – Central Business District
Chicago City 213,120,682/Metro
BOMA/Peoria Peoria Illinois Cities – Bartonville, Bloom-ington, Champaign, Decator, East Peoria, Galesberg, Kewanne, La Salle, Lincoln, Normal, Ottawa, Pekin, Peoria, Springfield, Urbana;
Iowa Counties – Bettendorf, Davenport
Illinois Counties – 10,095,111
Iowa Counties – 5,365,049
Total – 15,460,160/State
BOMA/Suburban Chicago Chicago – Suburban All communities outside of Chicago which are within a 50 mile radius of Chicago
238,864,238/State

Copyright © 2012 by boMA internAtionAl . All rights reserved.
where america goes to work: The ConTribuTion of offiCe building operaTions To The eConomy, 2012
36
boma loCal
markeT
loCal assoCiaTion TerriTory
square feeT/ mulTiplier Type
indiana
BOMA/Indianapolis Indianapolis – Downtown, Suburban
Cities – Anderson, Carmel, Greenfield, Greenwood, Indianapolis, Zionsville
86,137,593/Metro
BOMA/Michiana South Bend, Mishawaka Northern Indiana;
Southern Michigan
Indiana – 9,056,101
Michigan – 78,489
Total – 9,134,590/State
iowa
BOMA/Iowa Des Moines Metropolitan Area Nebraska Counties – Douglas, Dodge, Washington, Sarpy, Lancaster; Pottawattamie County, Iowa
89,046,893/State
kansas
BOMA/Wichita Wichita Cities – Arkansas, Augusta, Derby, El Dorado, Eureka, Herington, Hutchinson, Lindsborg, Lyons, McPerson, Medicine Lodge, Newton, Wellington, Wichita, Winfield
21,055,423/State
kentucky
BOMA/Kentucky Entire State Entire State 90,108,616/State
louisiana
BOMA/New Orleans New Orleans, Metairie, Kenner Parishes – Jefferson, Plaquemine, St. Bernard, St. Charles, St. John the Baptist, St. Tammany, Tangiphoa, Washington
47,134,664/State
BOMA/Shreveport Shreveport Shreveport City 7,812,870/State
maryland
BOMA/Baltimore Baltimore Counties – Anne Arundel, Baltimore, Carroll, Harford, Howard
126,676,429/State
massachusetts
BOMA/Boston Boston, Suburban Boston, Cambridge, Worcester
Counties – Suffolk, Middlesex, Norfolk, Worcester, Plymouth, Bristol
310,516,586/Metro

Copyright © 2012 by boMA internAtionAl . All rights reserved.
where america goes to work: The ConTribuTion of offiCe building operaTions To The eConomy, 2012
37
boma loCal
markeT
loCal assoCiaTion TerriTory
square feeT/ mulTiplier Type
michigan
BOMA/Metropolitan Detroit Detroit Counties – Lapeer, Livingston, Macomb, Monroe, Oakland, St. Clair, Wayne, Washtenaw
193,320,666/Metro
BOMA/Mid-Michigan Lansing 50 mile radius from Lansing; Counties – Clinton, Eaton, Gratiot, Ingham, Ionia, Mont Calm, Shiawassee
22,290,318/State
BOMA/West Michigan Grand Rapids Allegan, Kalamazoo, Kent, Muskegon, Ottawa
47,902,836/State
minnesota
BOMA/Duluth Duluth Duluth City 5,030,181/State
BOMA/Minneapolis Minneapolis City of Minneapolis; Hennepin County
106,757,598/Metro
BOMA/St. Paul St. Paul City of St. Paul; excludes Minneapolis and Hennepin County
26,680,040/Metro
mississippi
BOMA/Mississippi Entire State Entire State 25,908,887/State
missouri
BOMA/Kansas City Kansas City Missouri Counties – Cass, Clay, Jackson, Platte, Ray;
Kansas Counties – Johnson, Leavenworth, Wyandotte
Missouri – 65,224,848
Kansas – 43,880,048
Total – 109,104,896/State
BOMA/St. Louis St. Louis City of St. Louis – Environs IL – 9,720,878
MO – 122,094,090
Total – 131,814,968/Metro
nebraska
BOMA/Omaha Omaha Omaha – Douglas County 36,611,371/State

Copyright © 2012 by boMA internAtionAl . All rights reserved.
where america goes to work: The ConTribuTion of offiCe building operaTions To The eConomy, 2012
38
boma loCal
markeT
loCal assoCiaTion TerriTory
square feeT/ mulTiplier Type
nevada
BOMA/Nevada Entire State Entire State 77,812,758/State
new Jersey
BOMA/New Jersey Northern/Central/Southern New Jersey
Entire State 391,374,212/State
new mexico
BOMA/New Mexico Entire State Entire State 50,525,185/State
new york
BOMA/Capital Region-Albany Albany Counties – Albany, Columbia, Fulton, Greene, Montgomery, Rensselear, Saratoga, Schenecta-dy, Schoharie, Ulster, Warren, Washington
58,005,074/State
BOMA/Greater Buffalo Buffalo Counties – Allegany, Cattaraugus, Chautauqua, Erie, Niagara, Orleans, Wyoming
40,972,077/State
BOMA/Central New York Syracuse Counties – Cayuga, Cortland, Madison, Onondaga, Oswego, Syracuse, Seneca
26,264,211/State
BOMA/Greater Rochester Rochester Counties – Livingston, Monroe, Ontario
42,201,092/State
BOMA/Long Island Long Island Counties – Nassau, Suffolk 83,862,507/State
BOMA/New York New York City – All Boroughs Boroughs – Bronx, Brooklyn, Kings, Manhattan, Queens, Richmond, Staten Island
618,402,445/Metro
BOMA/Westchester Westchester County Westchester County 49,123,780/State
north carolina
BOMA/Carolinas-West Virginia North Carolina – Charlotte, Greensborough, Winston Salem (Triad)
South Carolina – Charleston, Columbia, Greenville;
North Carolina
South Carolina
West Virginia
North Carolina – 155,869,091
South Carolina – 126,592,786
West Virginia – 40,793,482
Total – 368,610,064/State
BOMA/Raleigh-Durham Raleigh-Durham Cities – Raleigh, Rocky Mount, Fayetteville, Kinston
45,354,705/Metro

Copyright © 2012 by boMA internAtionAl . All rights reserved.
where america goes to work: The ConTribuTion of offiCe building operaTions To The eConomy, 2012
39
boma loCal
markeT
loCal assoCiaTion TerriTory
square feeT/ mulTiplier Type
ohio
BOMA/Akron Akron Summit County 27,935,100/State
BOMA/Greater Cincinnati Cincinnati Cincinnati Metropolitan Area including Hamilton and Clermont Counties and the southern portions of Butler and Warren Counties in Ohio; Boone, Kenton, and Campbell Counties in Kentucky; and Ohio Dearborn, and Franklin Counties in Indiana.
135,006,580/State
BOMA/Greater Cleveland Cleveland Downtown and Suburban
Counties – Cuyahoga, Geauga, Lake, Lorain
98,212,529/Metro
BOMA/Columbus Columbus Downtown and Suburban
Counties – Champion, Delaware, Fairfield, Franklin, Licking, Madison, Pickaway, Union
97,750,712/State
BOMA/Dayton Dayton Downtown and Suburban Counties – Butler (northern portions), Clark, Clinton, Drake, Green, Miami, Montgomery, Preble, Warren (northern portions)
41,573,731/State
BOMA/Toledo Toledo Counties – Hancock, Lucas, Wood
28,155,826/State
oklahoma
BOMA/Oklahoma City Oklahoma City Counties – Cleveland, Oklahoma 48,819,079/State
BOMA/Tulsa Tulsa Counties – Cherokee, Craig, Creek, Delaware, Mayes, Muskogee, Nowata, Okmulgee, Osage, Pawnee, Rogers, Tulsa, Wagoner, Washington
43,168,946/State
oregon
BOMA/Oregon Entire State Entire State Portland – 108,051,971/Metro
Oregon – 115,726,349/State
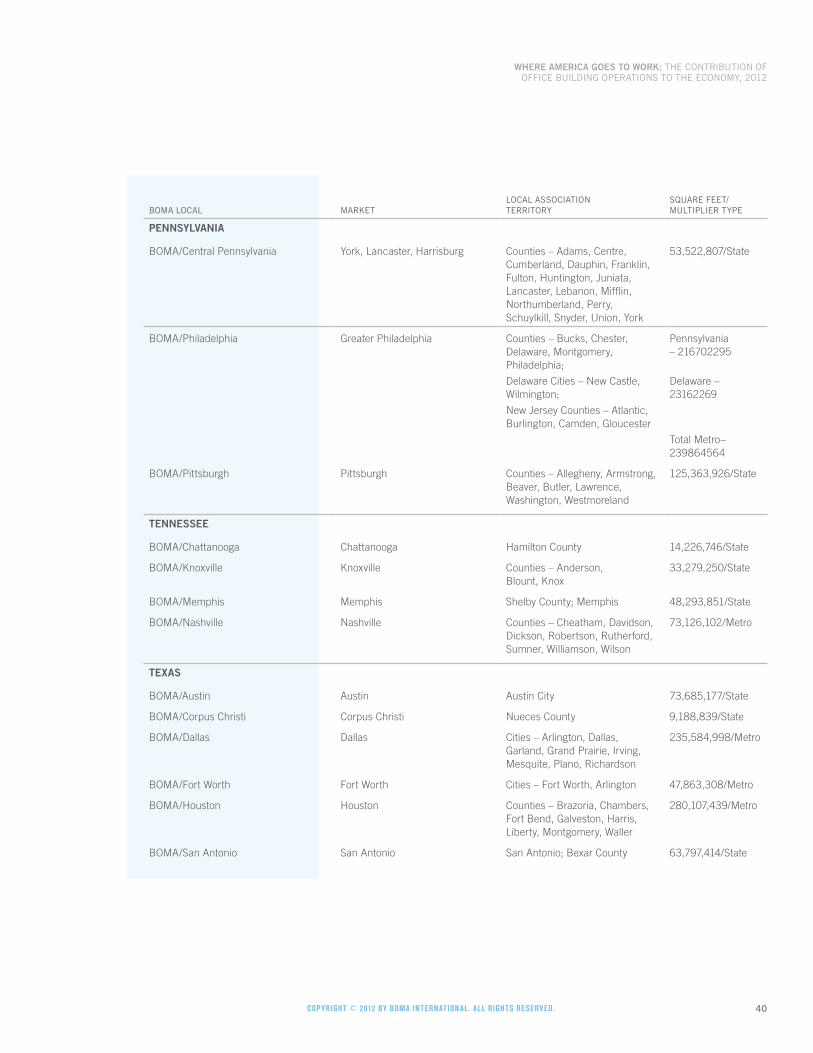
Copyright © 2012 by boMA internAtionAl . All rights reserved.
where america goes to work: The ConTribuTion of offiCe building operaTions To The eConomy, 2012
40
boma loCal
markeT
loCal assoCiaTion TerriTory
square feeT/ mulTiplier Type
pennsylvania
BOMA/Central Pennsylvania York, Lancaster, Harrisburg Counties – Adams, Centre, Cumberland, Dauphin, Franklin, Fulton, Huntington, Juniata, Lancaster, Lebanon, Mifflin, Northumberland, Perry, Schuylkill, Snyder, Union, York
53,522,807/State
BOMA/Philadelphia Greater Philadelphia Counties – Bucks, Chester, Delaware, Montgomery, Philadelphia;
Delaware Cities – New Castle, Wilmington;
New Jersey Counties – Atlantic, Burlington, Camden, Gloucester
Pennsylvania – 216702295
Delaware – 23162269
Total Metro– 239864564
BOMA/Pittsburgh Pittsburgh Counties – Allegheny, Armstrong, Beaver, Butler, Lawrence, Washington, Westmoreland
125,363,926/State
tennessee
BOMA/Chattanooga Chattanooga Hamilton County 14,226,746/State
BOMA/Knoxville Knoxville Counties – Anderson, Blount, Knox
33,279,250/State
BOMA/Memphis Memphis Shelby County; Memphis 48,293,851/State
BOMA/Nashville Nashville Counties – Cheatham, Davidson, Dickson, Robertson, Rutherford, Sumner, Williamson, Wilson
73,126,102/Metro
texas
BOMA/Austin Austin Austin City 73,685,177/State
BOMA/Corpus Christi Corpus Christi Nueces County 9,188,839/State
BOMA/Dallas Dallas Cities – Arlington, Dallas, Garland, Grand Prairie, Irving, Mesquite, Plano, Richardson
235,584,998/Metro
BOMA/Fort Worth Fort Worth Cities – Fort Worth, Arlington 47,863,308/Metro
BOMA/Houston Houston Counties – Brazoria, Chambers, Fort Bend, Galveston, Harris, Liberty, Montgomery, Waller
280,107,439/Metro
BOMA/San Antonio San Antonio San Antonio; Bexar County 63,797,414/State

Copyright © 2012 by boMA internAtionAl . All rights reserved. 41
boma loCal
markeT
loCal assoCiaTion TerriTory
square feeT/ mulTiplier Type
utah
BOMA/Utah Entire State Entire State 86,661,608/State
virginia
BOMA/Virginia Richmond; Hampton Roads State excluding Arlington, Fairfax, Loudon, and Prince William counties
155,042,235/State
washington
BOMA/Seattle-King County Puget Sound King County 144,351,932/Metro
BOMA/Spokane Spokane Spokane County 21,135,030/State
BOMA/South Puget Sound Puget Sound Tacoma, Olympia, Bremerton 32,264,560/State
BOMA/Tri Cities (Kennewick) Yakima; Benton County; Franklin County
Benton, Franklin, Yakima 9,208,967/State
wisconsin
BOMA/Wisconsin Milwaukee Entire State 136,568,327/ State
where america goes to work: The ConTribuTion of offiCe building operaTions To The eConomy, 2012

boma international suite 800 1101 15th street, nw washington, dC 20005 www.boma.org