when to start. data presentation dhhs and ias-usa: recommendations for initiation of art in naïve...
TRANSCRIPT

When to StartWhen to Start

When to StartWhen to StartData PresentationData Presentation

DHHS and IAS-USA: Recommendations for Initiation of ART in Naïve Patients
Available at: http://www.aidsinfo.nih.gov/ContentFiles/AdultandAdolescentGL.pdf. Revision November 3, 2008; Hammer SM, et al. JAMA 2008;300:555-570.
Clinical CategoryCD4 Cell
Count (cells/mm3)
Viral Load(copies/mL)
2008 DHHSGuidelines
2008 IAS-USA
Guidelines
AIDS-defining illness or severe symptoms
Any value Any value Treat
Asymptomatic <200 Any value Treat
200 to 350 Any value Treat
>350 >100,000Generally defer
treatment
>350 <100,000Generally defer
treatment
Pregnant women Any value Any value TreatHIV-associated
nephropathy Any value Any value Treat
HIV/HBV coinfection when HBV treatment is indicated
Any value Any value TreatConsider treatmen
t

ACTG 5164: Early vs. Deferred ART with Acute OIs
• Assessment of optimal timing of ART in pts with acute OI (N=285)• 92% Tx-naïve; median CD4+ 29 cells/mm3 and HIV RNA 5.07 log10 c/ml
• OIs with effective antimicrobial therapy only• PCP (63%), bacterial infections, cryptococcal disease, MAC, toxoplasmosis• TB excluded
Zolopa A, et al. 15th CROI; Boston, MA (2008); Abst. 142.
-14
Study day
0 2 28 42 84 224
48wks
48wks
Enrollment
Deferred ArmStart ART
Opportunistic Infection
TreatmentStarts
ImmediateArm
Start ART
RecommendedStart window

A5164: Results Through 48 Weeks
Number of Patients with Death or AIDS Progression By Time of ART Start
• At 48 weeks, no difference in virologic suppression, IRIS (7.6%) or need for ART changes
Zolopa A, et al. 15th CROI; Boston, MA (2008); Abst. 142; Grant P, et al. 16th CROI; Montreal, Canada; February 8-11, 2009. Abst. 775.
20
34
DeferredImmediate
P=0.035

The SAPiT Trial: Starting Antiretroviral Therapy in TB
• Open-Label Randomized Trial; HIV+ pts with active TB (N=642)
• Randomized to one of 3 arms:• Arm 1: ART initiated during intensive phase of TB treatment• Arm 2: ART initiated after intensive phase of TB treatment• Arm 3: ART initiated after TB treatment completed - Sequential Tx
• IRIS: Integrated 12.1% vs. Sequential 3.8%
• Sept 2008: DSMB stopped sequential arm
Integrated Tx
Abdool Karim S, et al. 16th CROI; Montreal, Canada; February 8-11, 2009. Abst. 36a.
Months After Randomization
Su
rviv
alS
urv
ival
1.001.00
0.900.90
0.700.70
0.800.80
0.950.95
0.850.85
0.750.75
00 11 22 33 44 55 66 77 88 99 1010 1111 1212 1313 1414 1515 1616 1717 1818 1919 2020 2121 2222 2323 2424
Post –TB TreatmentContinuation Phase of TB treatment
IntensivePhaseof TBtreatment
Sequential Arm
Integrated Arm
Kaplan-Meier Survival Curve
P=0.003

Cautionary Note: ART and Cryptococcal Meningitis (Zimbabwe)
• Immediate vs. delayed (10 weeks) ART in Cryptococcal Meningitis (N=54)
• Tx: Fluconazole 800 mg daily and d4T/3TC/NVP
• No use of amphotericin nor management of raised intracranial pressure
• Mortality: 87% immediate vs. 37% delayed (P=0.002)
• Most deaths in immediate ART group occurred within the first month, possibly due to IRIS
• Fluconazole-NVP drug interaction postulated
Comparison of Kaplan-Meier Survival Estimatesby Treatment Group
Comparison of Kaplan-Meier Survival Estimatesby Treatment Group
1.00
1.00
0.75
0.75
0.00
0.00
0.25
0.25
00 200200 400400 600600 800800
0.50
0.50
Time to Death (days)Time to Death (days)
P=0.028P=0.028
Delayed
Early
Su
rviv
alS
urv
ival
Makadzange A, et al. 16th CROI; Montreal, Canada; February 8-11, 2009. Abst. 36cLB.

NA-ACCORD: Improved Survival When ART is Started with ≥350 CD4
• North American AIDS Cohort Collaboration on Research and Design (NA-ACCORD)
• Regional collaboration of 22 HIV research cohorts from United States and Canada
• Study of HIV+ patients with: • CD4 count 351-500 cells/mm3 • Active follow-up between 1996 and 2006
• Outcome: All-cause mortality
• Groups compared from same CD4 count level:• Immediate treatment: Initiate ART within 1.5 yrs after 1st CD4 count
between 351-500 cells/mm3
• Deferred treatment: Do not initiate ART in this time frame
• Patient data censored if treatment not initiated within the 1.5 year interval after the target CD4 count for ART initiation
Kitahata M, et al. 48th ICAAC/46th IDSA; Washington, DC; October 25-28. Abst. H-896b

NA-ACCORD: Baseline Characteristics
Initiate HAART (n=2,473)
Defer HAART (n=5,901)
Follow up person-years 8,358 16,636
Males (%) 83 75
Median Age (years) 40 38
White (%) 39 38
Median CD4 count cells/mm3 421 432
Median log10 HIV RNA copies/mL 4.3 4.1
Hepatitis C virus infection (%) 27 34
History of Injection Drug Use (%) 16 21
Kitahata M, et al. 48th ICAAC/46th IDSA; Washington, DC; October 25-28. Abst. H-896b

NA-ACCORD: Results
Relative Hazard (RH)*
95% Confidence
IntervalP-value
Deferral of HAART at 351-500 cells/mm3 1.7 1.4, 2.1 <0.001
Female Sex 1.1 0.9, 1.5 0.290
Older Age (per 10 years) 1.6 1.5, 1.8 <0.001
Baseline CD4 count (per 100 cells/mm3) 0.9 0.7, 1.0 0.083
• HIV RNA was not an independent predictor of mortality• Rate of virologic suppression (<500 c/ml) similar between groups
Kitahata M, et al. 48th ICAAC/46th IDSA; Washington, DC; October 25-28. Abst. H-896b
* Stratified by Cohort and Year

NA-ACCORD: Improved Survival When ART is Started When CD4 Count ≥500 cells/mm3
• ARV-naïve; CD4 count >500 cells/mm3, no prior H/O AIDS-defining illness, follow-up between 1996 and 2006
• All-cause mortality compared between immediate vs. deferred ART• Immediate Group: Start ART with > 500 cells/mm3
• Deferred Group: Start ART within 1.5 years of CD4 <500
• Statistical analysis adjusted for baseline population differences
Kitahata M, et al. 16th CROI, Montreal, Canada, 2009. Abst. 71.
0.00
0.05
0.10
0.15
0.20
0 2 4 6 8 10Years after 1996
Relative Hazard of Deferral 1.6 (1.3,1.9; p<0.001)
Defer HAART > 500 CD4 cells (N=6,539)Initiate HAART > 500 CD4 cells (N= 2,616)
Mo
rtal
ity

SMART Naïve/Off Treatment Sub-study:Clinical Outcomes of (re-)Starting ARVs
Emery S, et al. JID 2008; 197: 1133–1144.
Serious non-AIDS
Hazard Ratio = 7.05 (95% CI: 1.58-31.5) p=0.01
Months
Cum
. Pro
babi
lity
(X10
0)
No. at RiskDeferred ART
Immediate ART
25
20
15
10
5
00 4 8 12 16 20 24 28 32 36
228249
189210
159180
128145
96125
73106
5980
3658
2744
2436
Opportunistic disease (fatal and non-fatal)
Hazard Ratio = 4.40 (95%.CI: 1.23-15.8) p=0.02
MonthsNo. at Risk
25
20
15
10
5
00 4 8 12 16 20 24 28 32 36
228249
192210
162179
130144
95124
73104
5880
3758
2644
2135
Opportunistic disease and death
Deferred ARTImmediate ART
Hazard Ratio = 4.38 (95%.CI: 1.45-13.2) p=0.009
Months
Cum
. Pro
babi
lity
(X10
0)
No. at RiskDeferred ART
Immediate ART
25
20
15
10
5
00 4 8 12 16 20 24 28 32 36
228249
192210
162179
130144
95124
73104
5880
3758
2644
2135
MonthsNo. at Risk
25
20
15
10
5
00 4 8 12 16 20 24 28 32 36
228249
188210
157179
125144
90124
69104
5579
3357
2443
2035
Hazard Ratio = 5.08 (95% CI: 1.91-13.5) p=0.001
Composite endpoint

SMART: Influence of CD4+ Count and Treatment on Clinical Event Rate
* per 100 person years
Last CD4+ cell count (cells/mL)
< 250 250-349 350-499 > 500 Overall
Continuous ART
Event Rate* 10.4 6.7 1.8 0.0 1.3
Intermittent ART
Event Rate* 16.0 9.2 7.6 3.1 7.0
Emery S, et al. JID 2008; 197: 1133–1144.
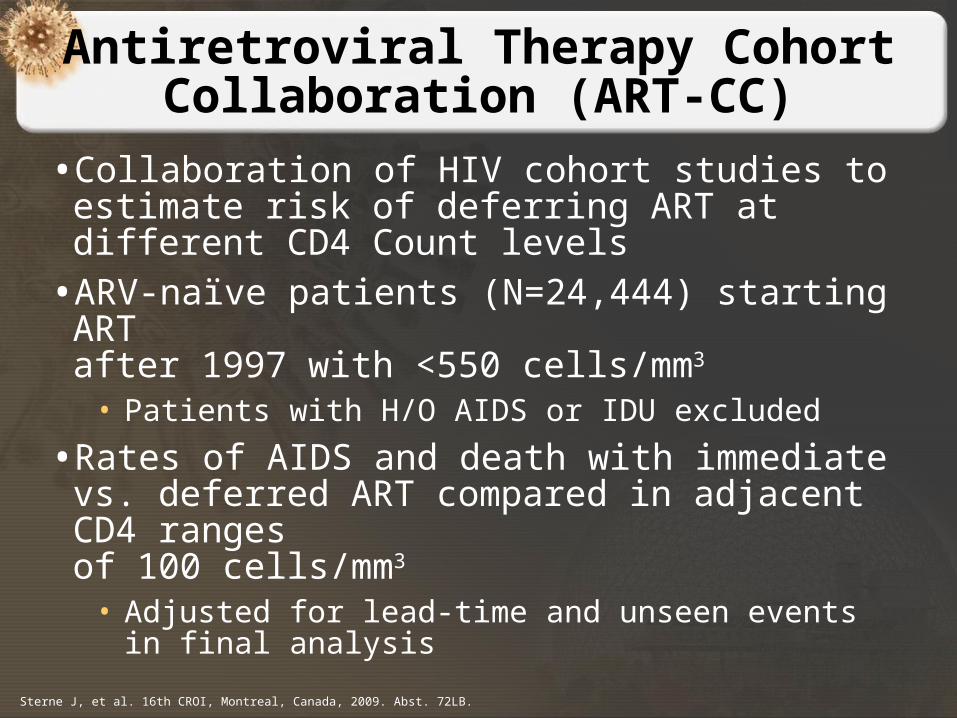
Antiretroviral Therapy Cohort Collaboration (ART-CC)
• Collaboration of HIV cohort studies to estimate risk of deferring ART at different CD4 Count levels
• ARV-naïve patients (N=24,444) starting ART after 1997 with <550 cells/mm3
• Patients with H/O AIDS or IDU excluded
• Rates of AIDS and death with immediate vs. deferred ART compared in adjacent CD4 ranges of 100 cells/mm3
• Adjusted for lead-time and unseen events in final analysis
Sterne J, et al. 16th CROI, Montreal, Canada, 2009. Abst. 72LB.

ART-CC: When Should ART be Started?
Hazard ratios for AIDS or death, adjusted for lead time/unseen events
• Delaying ART to <350 (but not <375) cells/mm3 is associated with an increased risk of AIDS or death
Comparison Hazard Ratio (95% CI)
276-375 vs 376-475 1.19 (0.96 to 1.47)
251-350 vs 351-450 1.28 (1.04 to 1.57)
226-325 vs 326-425 1.21 (1.01 to 1.46)
Sterne J, et al. 16th CROI, Montreal, Canada, 2009. Abst. 72LB.
44
Haz
ard
Rat
io f
or
AID
S o
r D
eath
Haz
ard
Rat
io f
or
AID
S o
r D
eath
22.5.5
11
500500 400400 300300 200200 100100 00CD4 Threshold (cells/mm3)CD4 Threshold (cells/mm3)

Observational Studies Can Be Wrong
• Numerous epidemiological studies demonstrated women on hormone replacement therapy (HRT) had decrease in risk of coronary heart disease (CHD)
• These studies led HCPs to recommend HRT as protection against CHD
• Controlled trials demonstrated HRT caused small, but significant, increase in CHD risk
• Re-analysis of epidemiological studies showed women on HRT more likely to be from socio-economic groups with better than average diet and exercise
• HRT use and decreased CHD risk were coincident effects of a common cause, rather than cause and effect1
Lawlor DA, et al. Intl J Epidemiol 2004;33:464-467.

Improved CD4 Recovery When Starting with Higher CD4 Count
• CD4-count increases on sustained suppressive (<400 c/mL) ARV treatment (n=655) by baseline count
• >350 cells/mm3: CD4 counts return to near-normal levels
• ≤350 cells/mm3: CD4 counts significantly increased but plateau after 4 years below normal range
• Differences in CD4 counts associated with differences in morbidity and mortality
Median CD4 Counts Over 6 YearsStratified by Baseline CD4 Count
Moore RD, Keruly JC. Clin Infect Dis 2007;44:441-446.
900
800
700
600
500
400
300
200
100
00 1 2 3 4 5 6
Years After Starting HAART
CD
4 C
ou
nt
(cel
ls/m
m3 )
<200 201–350 >350

Lower Risk of Triple-Class Failure when Starting at Higher CD4
• Large collaborative European cohort assessed risk factors for triple-class virologic failure (TCVF):
• All pts starting ART with 2 NRTIs + NNRTI or boosted PI (N=45,977)• 980 developed TCVF
• Risk factors for TCVF:• Non-MSM• Younger age• Higher HIV RNA • Lower CD4
*Adjusted for all factors in the model
Lodwick R, et al. 16th CROI; Montreal, Canada; February 8-11, 2009. Abst. 585.
Adjusted* hazard ratios for TCVF by baseline CD4 and VL after starting ART Adjusted* hazard ratios for TCVF by baseline CD4 and VL after starting ART
0.10.1 11
Lower risk of TCVF Greater risk of TCVFLower risk of TCVF Greater risk of TCVF
Baseline CD4 count(cells/mm3)Baseline CD4 count(cells/mm3)
Baseline viral load(log10 copies/ml)Baseline viral load(log10 copies/ml)
0-4950-199200-349350-499500-Unknown
0-3.94.0-4.44.5-4.95.0-5.45.5-5.96.0-Unknown
0-4950-199200-349350-499500-Unknown
0-3.94.0-4.44.5-4.95.0-5.45.5-5.96.0-Unknown

Treatment as Prevention: Rwanda
• Study to evaluate effect of ART on HIV transmission among HIV serodiscordant couples (N=2,993)
• ART only if clinically indicated
• Negative partner tested q3 months
• Sexual risk assessed by• Self report• Sperm on vaginal smear• Pregnancy• Combined variable using any of above
Sullivan P, et al. 16th CROI, Montreal, Canada, 2009. Abst. 52bLB.

Treatment as Prevention: Results
• Sexual risk behaviors lower in those on ART (19% vs. 25%, P<0.05)
• Both ART and change in behavior independently reduced HIV transmission
ARV Status CY Observation
No. LinkedInfections
InfectionRate (C-Y)
Infection RateRatio (95% CI)
Not on ARV 5,062 171 3.4/100 ---
On ARV 547 4 0.7/100 0.21 (0.08, 0.59)
On ARV –conservative* 547 6 1.0/100 0.32 (0.14, 0.73)
* Includes 2 partners who seroconverted in the same 3-month interval when the HIV-infected partner initiated ARVs
2,993 couples were followed for a median of 512 days HIV-free Survival of HIV-negative partners,by ARV status of HIV+ Partner
0 500 1000 1500 2000 2500
0.0
0.2
0.4
0.6
0.8
1.0
Su
rviv
al P
rob
ab
ilit
y
Days
Off ARV On ARV
CensoredLogrank P<.0001
Sullivan P, et al. 16th CROI, Montreal, Canada, 2009. Abst. 52bLB.

Starting Earlier isCost-Effective
• Markov modeling using Johns Hopkins HIV database
• Beginning ARV treatment at CD4+ >350 cells/mm3 vs. 200-350 cells/mm3 results in an incremental cost per QALY gained of $31,226
• Starting ARV therapy at >350 cells/mm3 is more cost-effective than:
• Coronary bypass• Hemodialysis• Screening mammograms
Mauskopf J, et al. JAIDS. 2005;39:562-569.
HAART Initiation (cells/mm3)
Incremental Lifetime Cost
Cost per Life-year gained
Cost per QALY Gained
>350 vs. 200-350 $19,074 $25,567 $31,226
200-350 vs. <200 $28,066 $22,064 $25,806
QALY=Quality Adjusted Life Year

When to StartWhen to StartDebate/DiscussionDebate/Discussion