whelk scoping meeting presentation - mass.gov
TRANSCRIPT

Whelk Fishery Scoping MeetingsSeptember 12 &14, 2016
Daniel McKiernan, Deputy DirectorBob Glenn – Assessment and Survey ProgramSteve Wilcox – Whelk BiologistErin Burke – Protected Species Specialist

Background• One of few fisheries MA manages unilaterally
– Occurs almost exclusively in state waters– No ASMFC or NEFMC plan that we have to comply with
• Fishery is now within the Top 10 in ex-vessel value in the Commonwealth
• Very important source of income for our small vessel fleet (especially in light of the decline of the SNE lobster fishery).
March 19, 2019 © 2010 Division of Marine Fisheries Slide 2

March 19, 2019 © 2010 Division of Marine Fisheries Slide 3
Emerging Issues
• Fishery Profile: – Status of Whelk Resource – Fishery Performance
• Trap Losses & In-season Trap Tag Replacement• Size at Maturity and Minimum Size • Compliance with minimum size and gauge use• Sea-turtle interactions

March 19, 2019 © 2010 Division of Marine Fisheries Slide 4
Fishery Profile

March 19, 2019 © 2010 Division of Marine Fisheries Slide 5
Fishery Profile

March 19, 2019 © 2010 Division of Marine Fisheries Slide 6
Fishery Profile
March 19, 2019 © 2010 Division of Marine Fisheries Slide 7
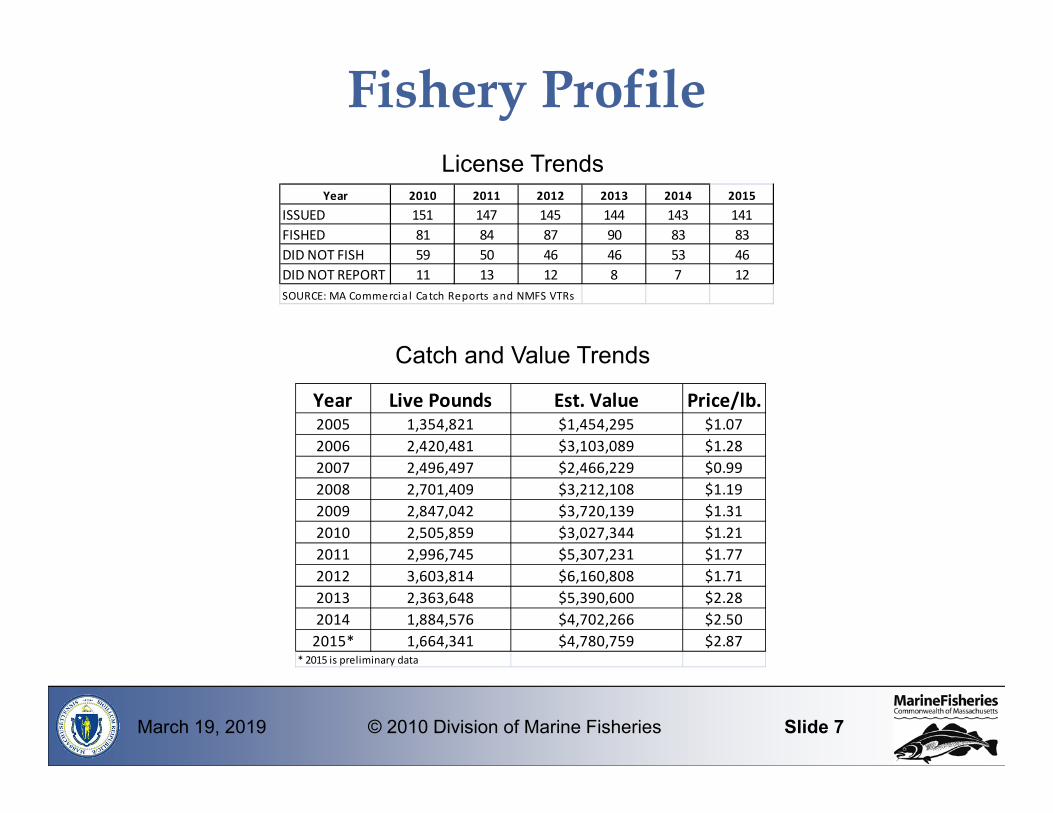
Fishery Profile
Year Live Pounds Est. Value Price/lb.2005 1,354,821 $1,454,295 $1.07 2006 2,420,481 $3,103,089 $1.28 2007 2,496,497 $2,466,229 $0.99 2008 2,701,409 $3,212,108 $1.19 2009 2,847,042 $3,720,139 $1.31 2010 2,505,859 $3,027,344 $1.21 2011 2,996,745 $5,307,231 $1.77 2012 3,603,814 $6,160,808 $1.71 2013 2,363,648 $5,390,600 $2.28 2014 1,884,576 $4,702,266 $2.50 2015* 1,664,341 $4,780,759 $2.87
* 2015 is preliminary data
License Trends
Catch and Value Trends
Year 2010 2011 2012 2013 2014 2015ISSUED 151 147 145 144 143 141FISHED 81 84 87 90 83 83DID NOT FISH 59 50 46 46 53 46DID NOT REPORT 11 13 12 8 7 12SOURCE: MA Commercia l Catch Reports and NMFS VTRs
March 19, 2019 © 2010 Division of Marine Fisheries Slide 8
Fishery Profile

March 19, 2019 © 2010 Division of Marine Fisheries Slide 9
Fishery Profile
•Truncation in size of commercial channeled whelk catch observed in sea sampling data
•Less larger whelk
Sea Sampling Data

March 19, 2019 © 2010 Division of Marine Fisheries Slide 10
Fishery Profile
2 ¾” minimum legal size
2 ¾” minimum legal size
3” minimum legal size
Female 50% Maturity
2013 – Standard Chute Gauge 2 ¾”2014 – 2 7/8” 2015 – 3”
March 19, 2019 © 2010 Division of Marine Fisheries Slide 11
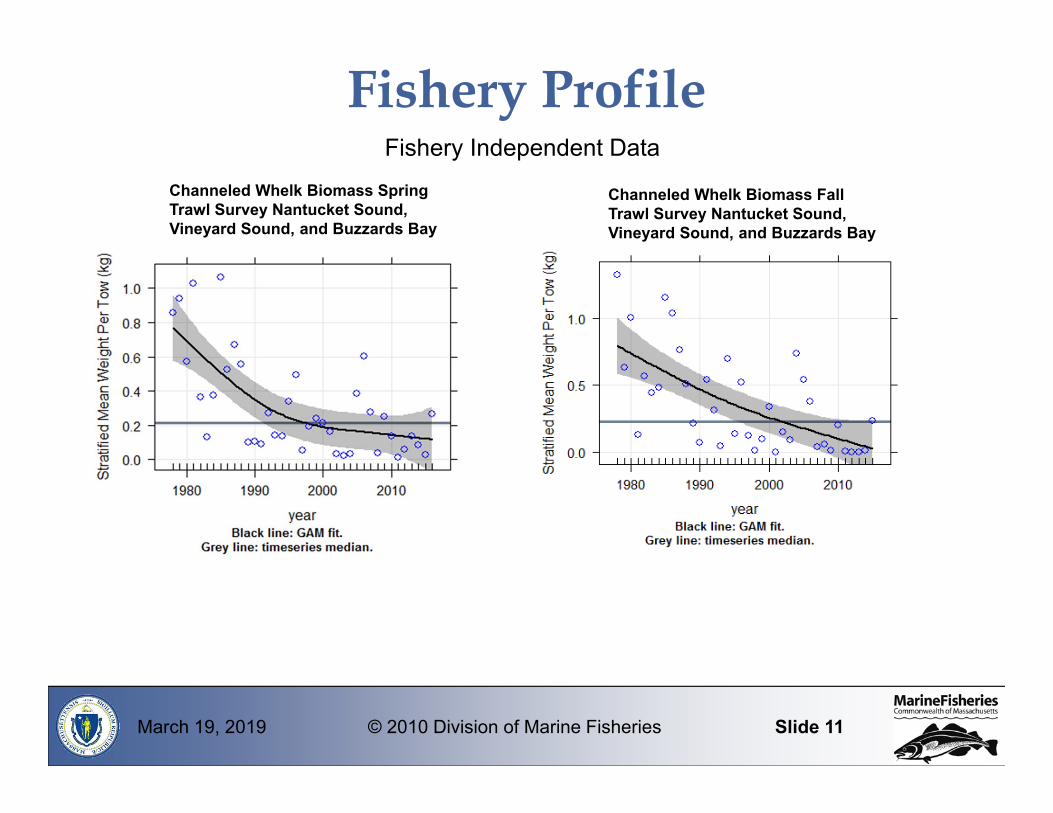
Fishery ProfileFishery Independent Data
Channeled Whelk Biomass Spring Trawl Survey Nantucket Sound, Vineyard Sound, and Buzzards Bay
Channeled Whelk Biomass Fall Trawl Survey Nantucket Sound, Vineyard Sound, and Buzzards Bay
March 19, 2019 © 2010 Division of Marine Fisheries Slide 12
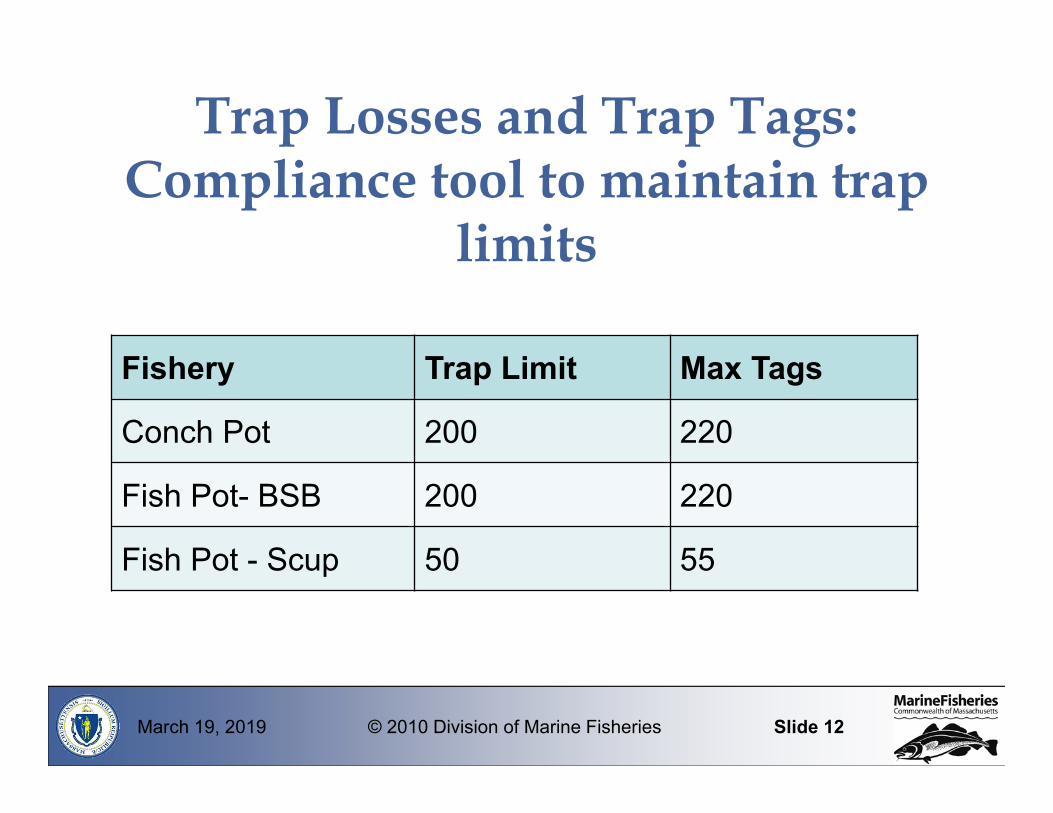
Trap Losses and Trap Tags: Compliance tool to maintain trap
limits
Fishery Trap Limit Max Tags
Conch Pot 200 220
Fish Pot- BSB 200 220
Fish Pot - Scup 50 55

Trap Losses & Trap Tag Replacement• Trap Tag Program modeled after interstate Lobster
Management Plan• Reasons: vessel traffic, gear conflict (draggers, theft• What is Typical Trap Loss?
– Surveys show: Loss rates were about 20% for singles and 5% for trawls. Singles lost at roughly 4X the rate of trawls. (Marine Debris Issues?)
• MFAC Approved 20% additional tags for 2017• (Lack of) Verifiability of trap loss• DMF has received individual requests for replacement tags in
excess of 100 tags; typical range of 40-60 tags.
March 19, 2019 © 2010 Division of Marine Fisheries Slide 13

Replacement Trap Tag Policies and Procedures
• Permit holder submits information on Gear Conflict/Catastrophic Gear Loss Report
• DMF reviews and issues “replacement trap tags”– Very few denials
• Longstanding regulations require report and review by OLE and possible hearing– Originally designed for Lobster fishery (generous trap
limits, 800) to address massive gear loss due to draggers and storms
March 19, 2019 © 2010 Division of Marine Fisheries Slide 14

Non-compliance with Trap Tag Rules• Untagged traps observed by OLE during routine
boardings• Conch Traps bearing wrong tags
– e.g., Scup pot tags & Black sea bass pot tags• Are the fish pot limits too high?
• Expect increased OLE random patrols and compliance checks and increased penalties– Possible suspensions or revocations for non-
compliance
March 19, 2019 © 2010 Division of Marine Fisheries Slide 15

Trap Losses & Trap Tag ReplacementWhat is “Catastrophic Gear Loss”? • Interstate Lobster Plan defines “Catastrophic Tag
Loss” and has requirement that an all new set of tags be obtained.
• Catastrophic loss = losses that exceed the initial allocation (10%) for routine loss.
• Plan for 2017: No replacement tags will be issued by DMF. Instead, fishermen can request approval to order an entire new set of replacement tags -distinguished from original tags (i.e. color).
March 19, 2019 © 2010 Division of Marine Fisheries Slide 16

March 19, 2019 © 2010 Division of Marine Fisheries Slide 17
Size at Maturity& Minimum Size
•2010-2011 Nantucket Sound Half of all females that reach 3 7/8” are capable of reproducing for the first time, the other half are still immature
•2015 preliminary results show no significant changes
•Still no female mature at minimum legal size

March 19, 2019 © 2010 Division of Marine Fisheries Slide 18
Concerns:
•At current minimum legal size no female whelk are mature
•Life history traits make them especially prone to depletion
•Trawl survey trends – declining
•Rapid escalation of catch and effort
•Truncation of size of commercial catch
•Fishermen reports of areas now devoid of whelk
•World wide trends of rapid escalation of the fishery followed by stock collapse
Size at Maturity& Minimum Size
March 19, 2019 © 2010 Division of Marine Fisheries Slide 19
How to Measure WhelkMinimum legal size is the primary tool for whelk management in Massachusetts
Critical to have an accurate and consistent form of measurement for everyone
Legal Definition CMR 6.21 - require whelks be measured as flat as possible on the gauge in an orientation where a straight line drawn from the shell’s apex to its siphonal canal is parallel to the gauge sides.
Size at Maturity& Minimum Size

March 19, 2019 © 2010 Division of Marine Fisheries Slide 20
6”
3”
1.5”
Gauge Standards
Compliance and Gauge UseSize at Maturity& Minimum Size

March 19, 2019 © 2010 Division of Marine Fisheries Slide 21
Compliance and Gauge Use
Opercular opening
Siphonal canal
• Legal minimum size = 3” width • Measure width with
opercular opening downand flush on the gauge
• Line from apex to siphonal canal parallel to center line and sides of gauge
• Passes through = short
Apex
Size at Maturity& Minimum Size

March 19, 2019 © 2010 Division of Marine Fisheries Slide 22
Compliance and Gauge Use
• Opercular opening down and on the gauge
• Line from apex to siphonal canal parallelto center line and sides of gauge
• Does not pass through = keeper
CORRECT USE

March 19, 2019 © 2010 Division of Marine Fisheries Slide 23
Compliance and Gauge Use
• Opercular opening down and on the gauge
• Line from apex to siphonal canal parallelto center line and sides of gauge
• Passes through = short
CORRECT USE
March 19, 2019 © 2010 Division of Marine Fisheries Slide 24
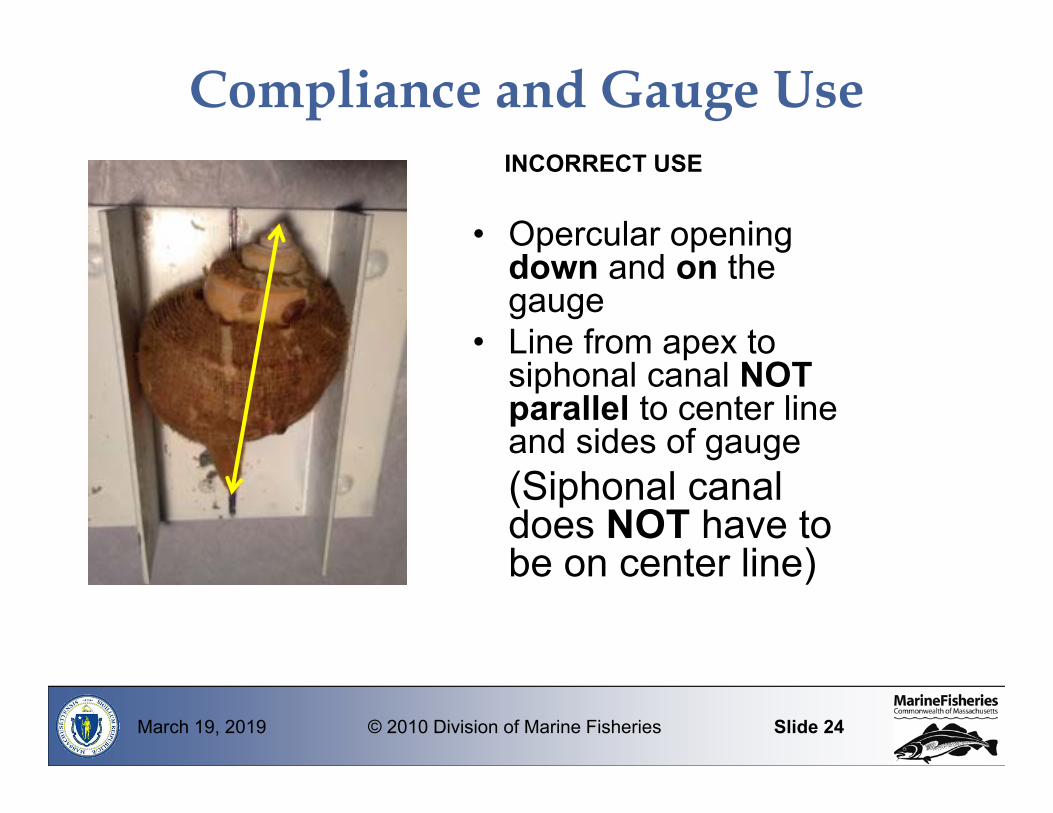
Compliance and Gauge Use
• Opercular opening down and on the gauge
• Line from apex to siphonal canal NOT parallel to center line and sides of gauge(Siphonal canal does NOT have to be on center line)
INCORRECT USE
March 19, 2019 © 2010 Division of Marine Fisheries Slide 25
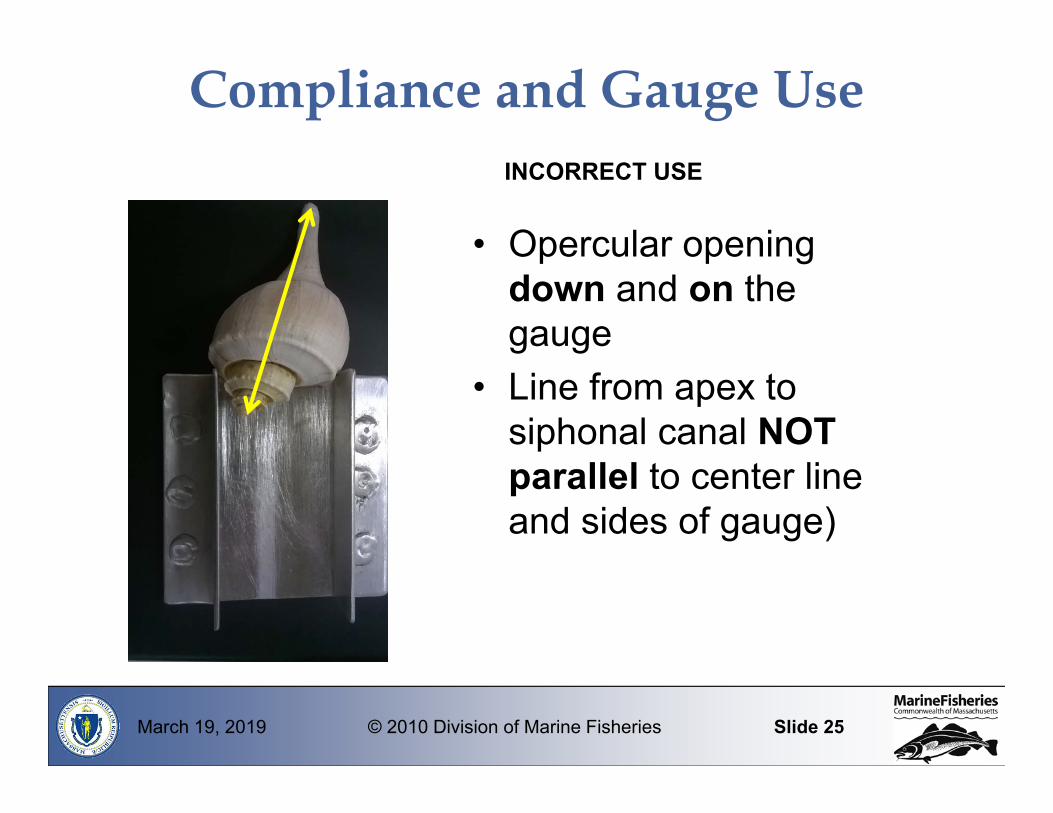
Compliance and Gauge Use
• Opercular opening down and on the gauge
• Line from apex to siphonal canal NOT parallel to center line and sides of gauge)
INCORRECT USE

March 19, 2019 © 2010 Division of Marine Fisheries Slide 26
Compliance and Gauge Use
• No gauge modification
• Still a gap present between gauge and shell = short
INCORRECT USE

March 19, 2019 © 2010 Division of Marine Fisheries Slide 27
Compliance and Gauge Use
• With the opercular opening facing down and on the gauge
• If the whelk passes through in any vertical orientation it is short
• Quicker and more consistent between users
• Would result in approximate 3/16” increase in width using 3” gauge
• Approximate 30% decrease in catch by weight based 2013-2015 LF data
• Grow ¼” per year
Potential Alternative Use

Leatherback Entanglements and Fixed Gear in Massachusetts

Background• Leatherback sea turtles are an endangered
species• Section 10 of the ESA authorizes NMFS to
issue incidental take permits to non-federal entities
• Not having an incidental take permit for the state-waters conch fishery exposes fishermen (and DMF) to litigation for leatherback entanglements
March 19, 2019 © 2010 Division of Marine Fisheries Slide 29

Background• NMFS strongly urges DMF to apply for a
Section 10 permit, which would include a “habitat conservation plan.”
• The plan must specify actions to minimize negative impacts to the endangered species
• Fishermen and federal regulators have raised the possibility of a seasonal closure in August as a mitigation measure for the Section 10 permit.
March 19, 2019 © 2010 Division of Marine Fisheries Slide 30

Sea Turtle Entanglements• The vast majority (97%) of sea turtle
entanglements in Massachusetts involve leatherbacks
• Entanglements occur in buoy lines associated with pot gear - the predominant gear type in state waters
• Primarily anchored and in single pots

Marine Animal Entanglement ResponseThe Provincetown Center for Coastal Studies and the Massachusetts Division of Marine Fisheries operate an
entanglement response program.
• 24-hour Hotline• Trained on-water responders• Remove gear from animal and reduce injury• Gather information to prevent future entanglements
PCCS image. NOAA permit 932‐1905
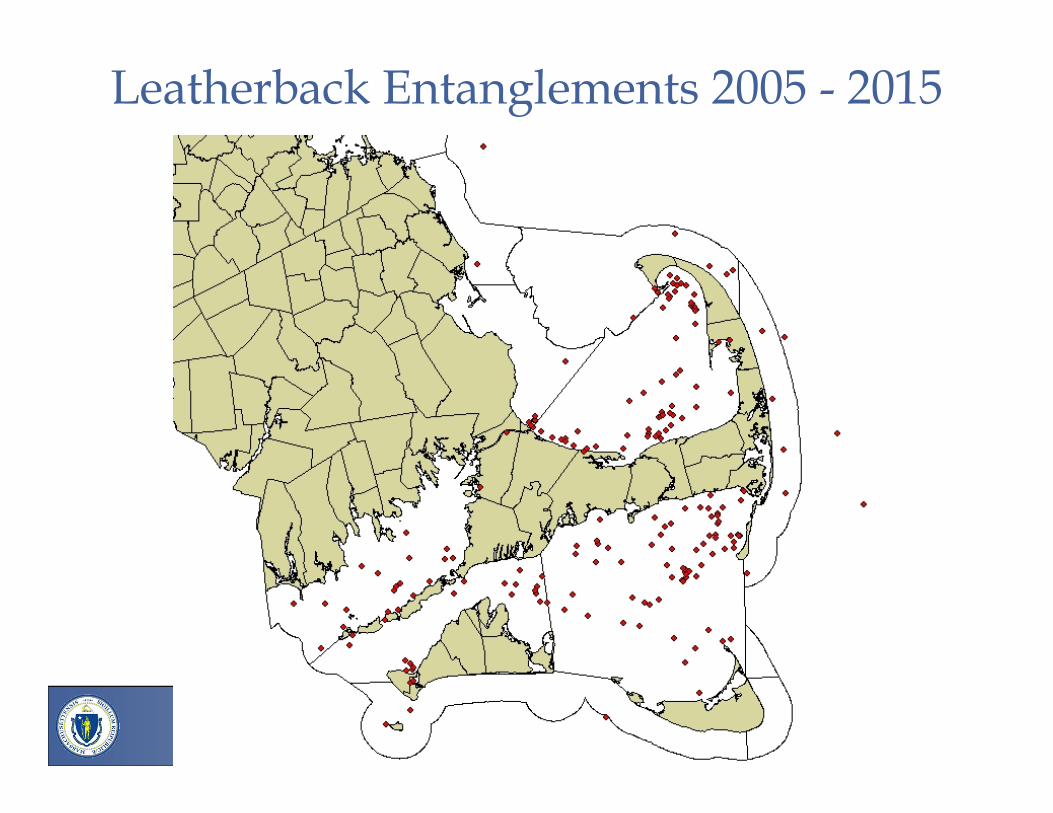
Leatherback Entanglements 2005 - 2015
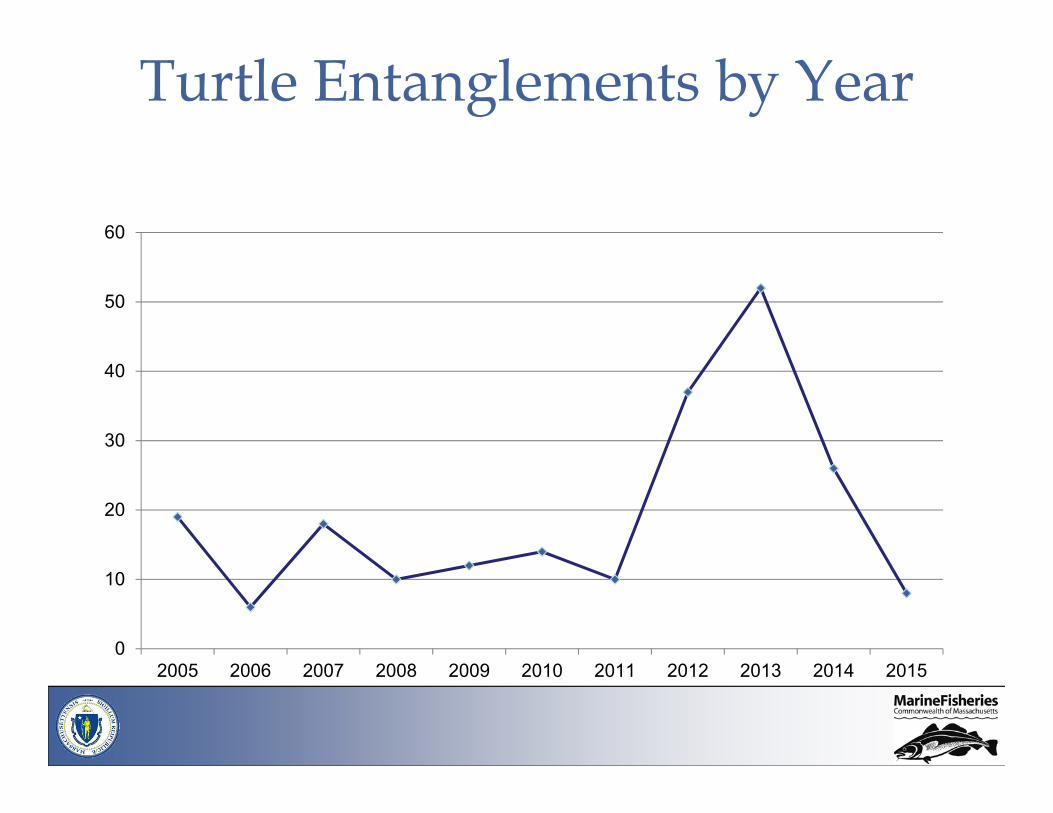
0
10
20
30
40
50
60
2005 2006 2007 2008 2009 2010 2011 2012 2013 2014 2015
Turtle Entanglements by Year

Entanglements By Month, 2005-2015
0
10
20
30
40
50
60
70
80
90
May June July August September October November

Entanglements by SRA, 2005-2015
March 19, 2019 © 2010 Division of Marine Fisheries Slide 36
0
10
20
30
40
50
60
70
80
2 5 6 7 8 9 10 12 13 14 16 18
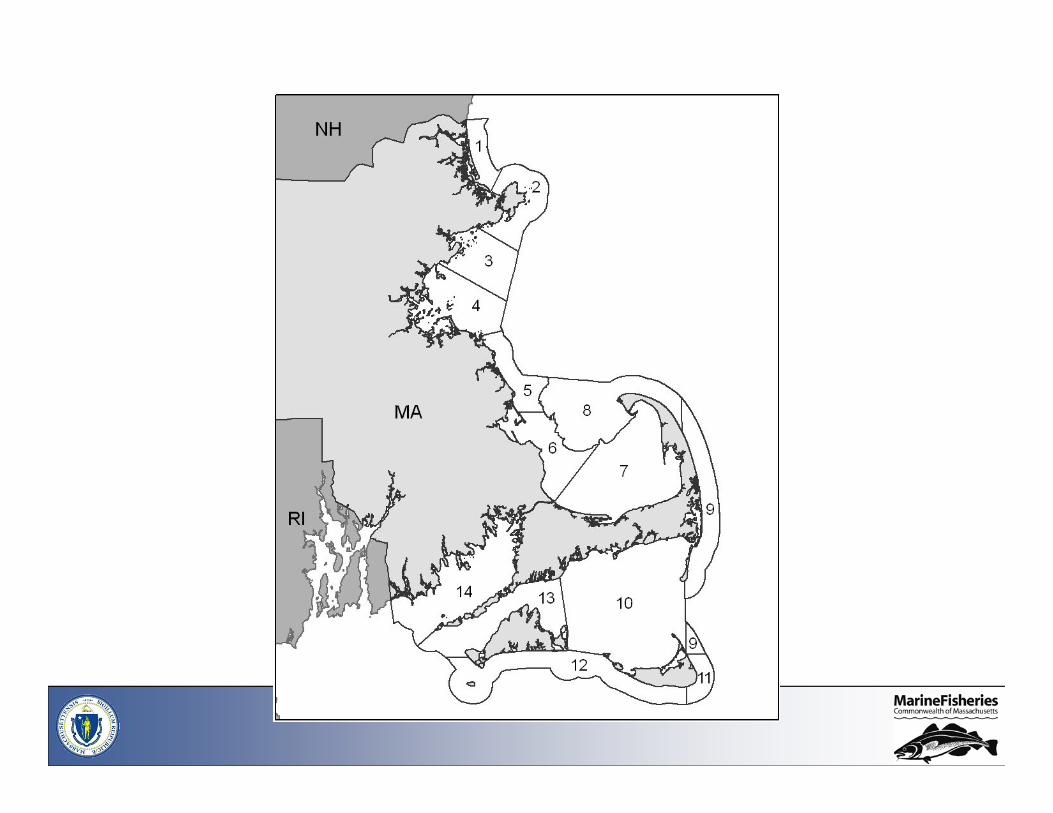
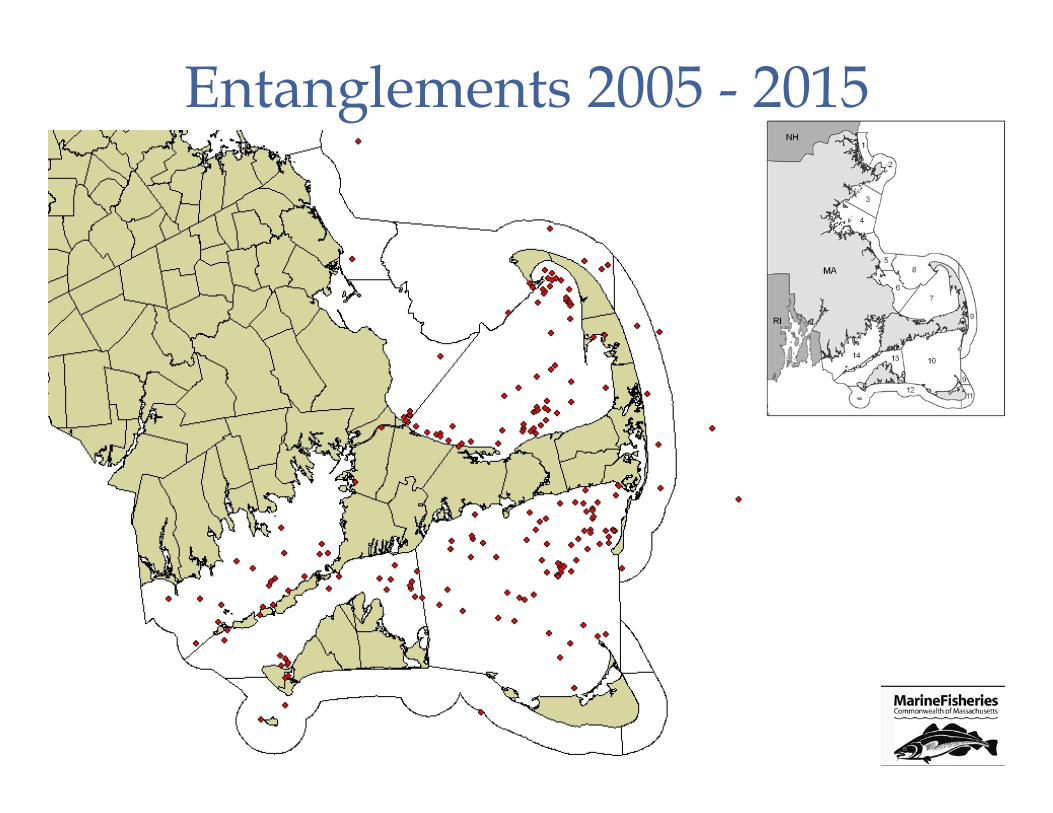
Entanglements 2005 - 2015
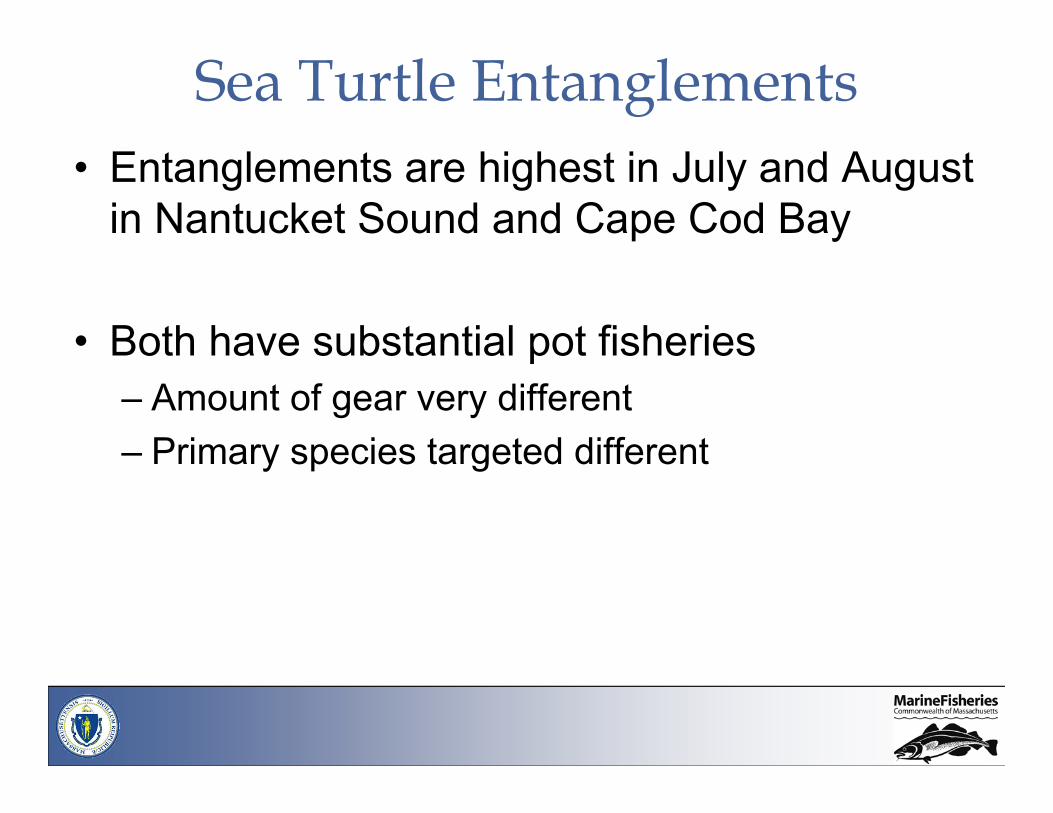
• Entanglements are highest in July and August in Nantucket Sound and Cape Cod Bay
• Both have substantial pot fisheries– Amount of gear very different– Primary species targeted different
Sea Turtle Entanglements

Number of Total Vertical Lines 2013
0
2000
4000
6000
8000
10000
12000
14000
16000
June July August September October
Nantucket SoundCape Cod Bay

Vertical lines in SRA 7 (Cape Cod Bay) 2013
0
2,000
4,000
6,000
8,000
10,000
12,000
14,000
16,000
Jan Feb Mar Apr May Jun Jul Aug Sep Oct Nov Dec
ConchLobsterFish

Vertical lines in SRA 10 (Nantucket Sound) 2013
0
500
1,000
1,500
2,000
2,500
3,000
3,500
4,000
4,500
5,000
Jan Feb Mar Apr May Jun Jul Aug Sep Oct Nov Dec
ConchLobsterFish

• Cape Cod Bay and Nantucket Sound have the most entanglement events
• However their entanglement death rates vary considerably
• 30% of reported entanglements in Nantucket Sound involve dead animals
• Versus only 1.5% in Cape Cod Bay
Sea Turtle Entanglements

Dead Entangled by SRA 2005 - 2015
0
5
10
15
20
25
6 7 8 9 10 13 14
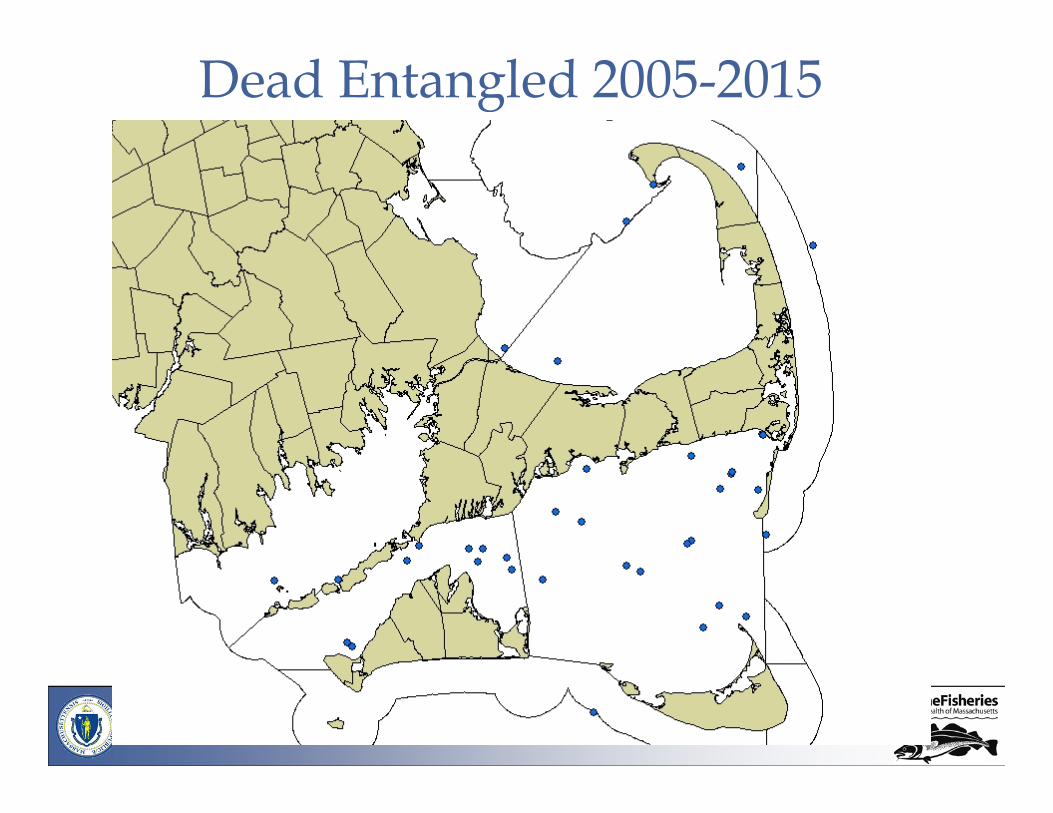
Dead Entangled 2005-2015

Entanglement Deaths in Nantucket Sound 2005-2015
0
2
4
6
8
10
12
14
June July August September October
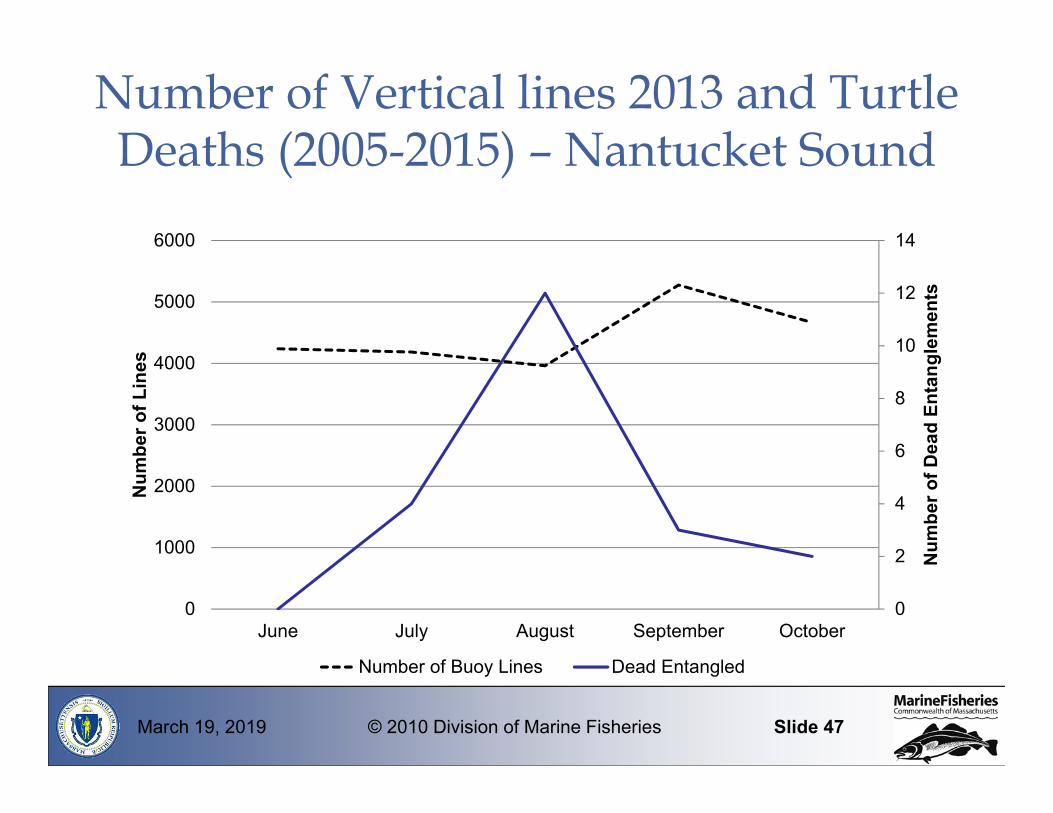
Number of Vertical lines 2013 and Turtle Deaths (2005-2015) – Nantucket Sound
March 19, 2019 © 2010 Division of Marine Fisheries Slide 47
0
2
4
6
8
10
12
14
0
1000
2000
3000
4000
5000
6000
June July August September October
Num
ber o
f Dea
d En
tang
lem
ents
Num
ber o
f Lin
es
Number of Buoy Lines Dead Entangled

Entanglement Deaths (2005-2015) Per Total Buoy Line 2013
March 19, 2019 © 2010 Division of Marine Fisheries Slide 48
0.00000
0.00050
0.00100
0.00150
0.00200
0.00250
0.00300
0.00350Dea
th Rate
Nantucket Sound
Vineyard Sound
Cape Cod Bay

Max Conch Pots Nantucket Sound
0
1,000
2,000
3,000
4,000
5,000
6,000
7,000
16 17 18 19 20 21 22 23 24 25 26 27 28 29 30 31 32 33 34 35 36 37 38 39 40 41 42 43 44 45 46 47 48 49 50
Max
Pot
s
Week #Slow Period 2010 2011 2012 2013 2014 Average
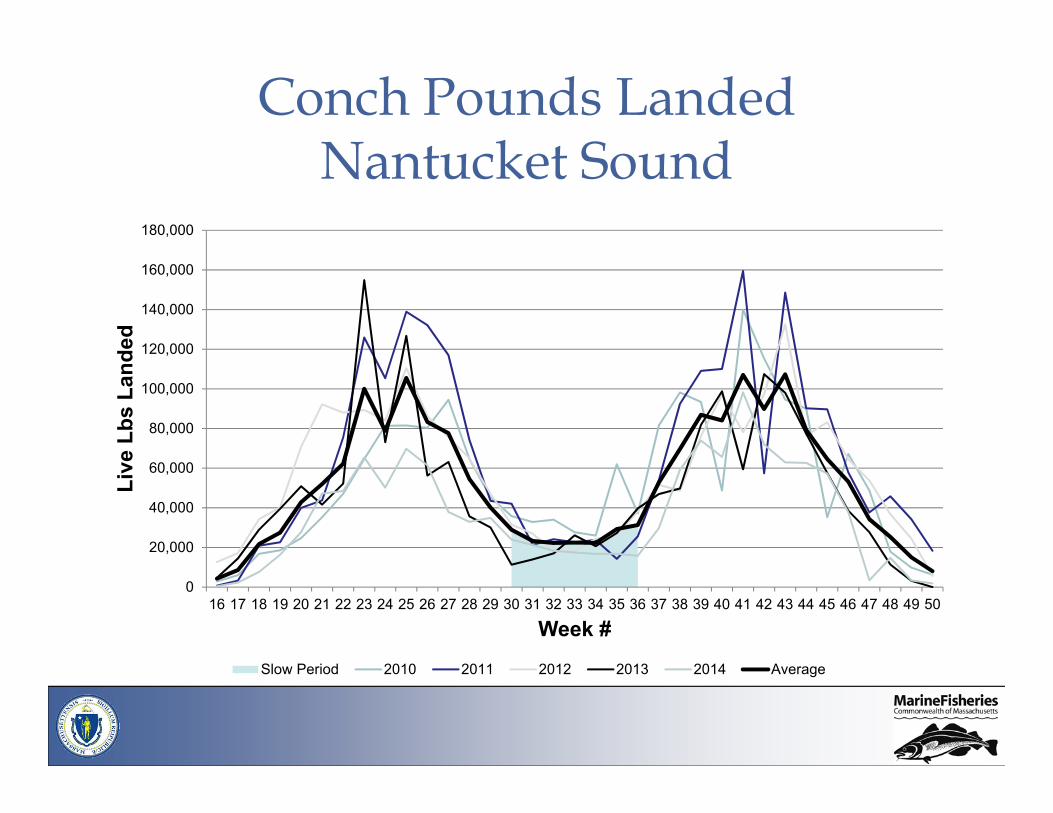
Conch Pounds Landed Nantucket Sound
0
20,000
40,000
60,000
80,000
100,000
120,000
140,000
160,000
180,000
16 17 18 19 20 21 22 23 24 25 26 27 28 29 30 31 32 33 34 35 36 37 38 39 40 41 42 43 44 45 46 47 48 49 50
Live
Lbs
Lan
ded
Week #Slow Period 2010 2011 2012 2013 2014 Average
• August in Nantucket Sound is a dangerous time for leatherbacks
• Although gear is at low levels, entanglements and entanglement deaths are at their highest
• August is also a slow period for the conch fishery
Sea Turtle Entanglements

March 19, 2019 © 2010 Division of Marine Fisheries Slide 52
In Summary: Potential proposals • To improve compliance and consistency:
– Modify gauging technique: any orientation• To enhance spawning stock (reduce landings):
– Modify gauging technique and increase minimum size – Establish or reduce trip limits
• conch potters, mobile gear & clam dredgers– Reduce trip limits for other gears – Enact a mid-summer closure for all gears
• To Reduce Trap Losses – Require multiple pot trawls (ban singles)– Reduce trap limits – esp. if trip limit is enacted

March 19, 2019 © 2010 Division of Marine Fisheries Slide 53
Potential proposals • To reduce impact of lost traps:
– Devise an escape vent and a ghost panel that will degrade to ensure escapement of small whelks and all whelks after some period.
• To improve compliance with min size:– Request Legislature to enact per animal fines as is
done in lobster fishery ($100 per short lobster). Could be less per whelk.
• To further reduce active permits: – Raise the “actively fished” standard from 5,000 lbs.
per year to a higher value…10,000?, 15,000?
March 19, 2019 © 2010 Division of Marine Fisheries Slide 54
Potential proposals • To minimize leatherback sea-turtle interactions:
– Enact a late summer closure: August? Last week of August – first week of Sept?

Questions?
March 19, 2019 © 2010 Division of Marine Fisheries Slide 55