what’s the economy for, anyway? part 3 of 3. life expectancy at birth (2004) rank 1spain...
TRANSCRIPT

WHAT’S THE WHAT’S THE ECONOMY FOR, ECONOMY FOR,
ANYWAY?ANYWAY?
Part 3 of 3
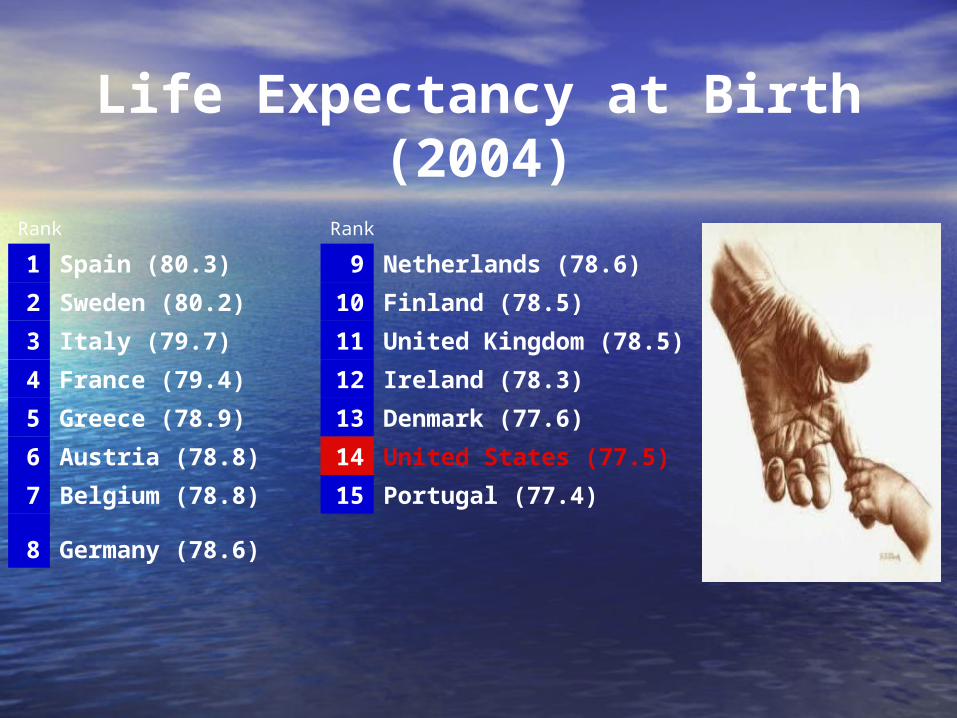
Life Expectancy at Birth (2004)
Rank Rank
1 Spain (80.3) 9 Netherlands (78.6)
2 Sweden (80.2) 10 Finland (78.5)
3 Italy (79.7) 11 United Kingdom (78.5)
4 France (79.4) 12 Ireland (78.3)
5 Greece (78.9) 13 Denmark (77.6)
6 Austria (78.8) 14 United States (77.5)
7 Belgium (78.8) 15 Portugal (77.4)
8 Germany (78.6)

Infant Mortality Deaths Per 1,000 Live Births (2004)
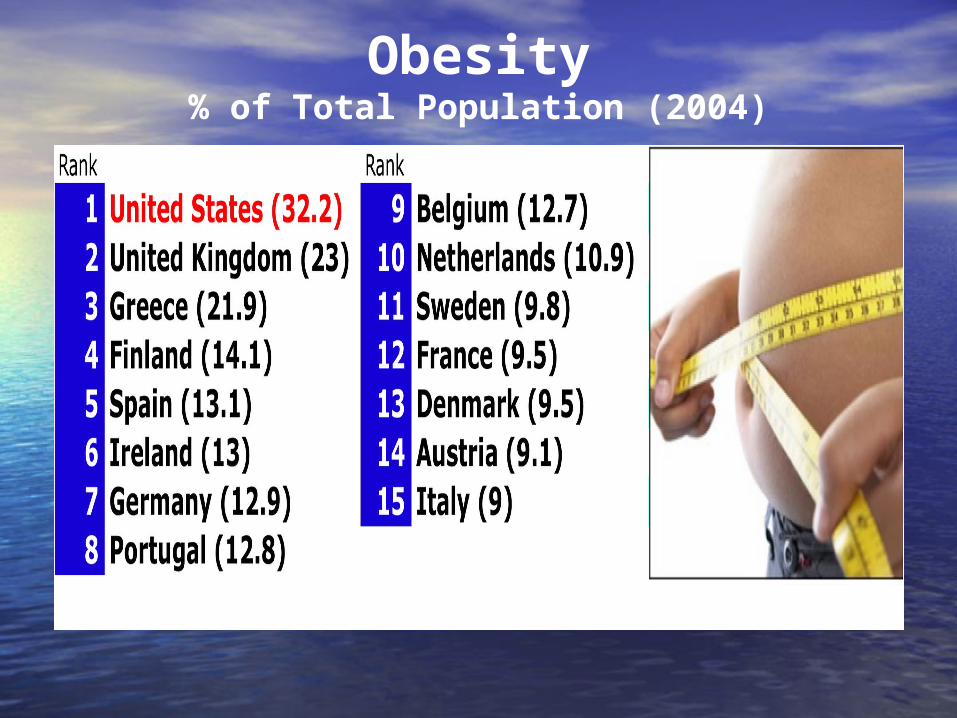
Obesity% of Total Population (2004)

Obesity% of Total Population (2004)
Rank
Rank
1 United States (32.2)
9 Belgium (12.7)
2 United Kingdom (23)
10 Netherlands (10.9)
3 Greece (21.9) 12 Sweden (9.8)
4 Finland (14.1) 13 France (9.5)
5 Spain (13.1) 13 Denmark (9.5)
6 Ireland (13) 14 Austria (9.1)
7 Germany (12.9) 15 Italy (9)
8 Portugal (12.8)
Are Americans Safe and Are Americans Safe and Secure?Secure?
• The U.S. murder rate is about six times the The U.S. murder rate is about six times the European rateEuropean rate
• The U.S. child abuse rate is triple the The U.S. child abuse rate is triple the European rateEuropean rate
• The U.S. incarceration rate is highest in The U.S. incarceration rate is highest in worldworld

Prison Population RateNumber Per 100,000 Population
Prison Population RateNumber Per 100,000 Population
"The degree of civilization in a society can be judged by…its prisons.” -- Dostoyevski
66 70 81 82 85 88 91 96 97 97123 129 138 139
725
0
100
200
300
400
500
600
700
800
But We Have But We Have the Most Stuffthe Most Stuff
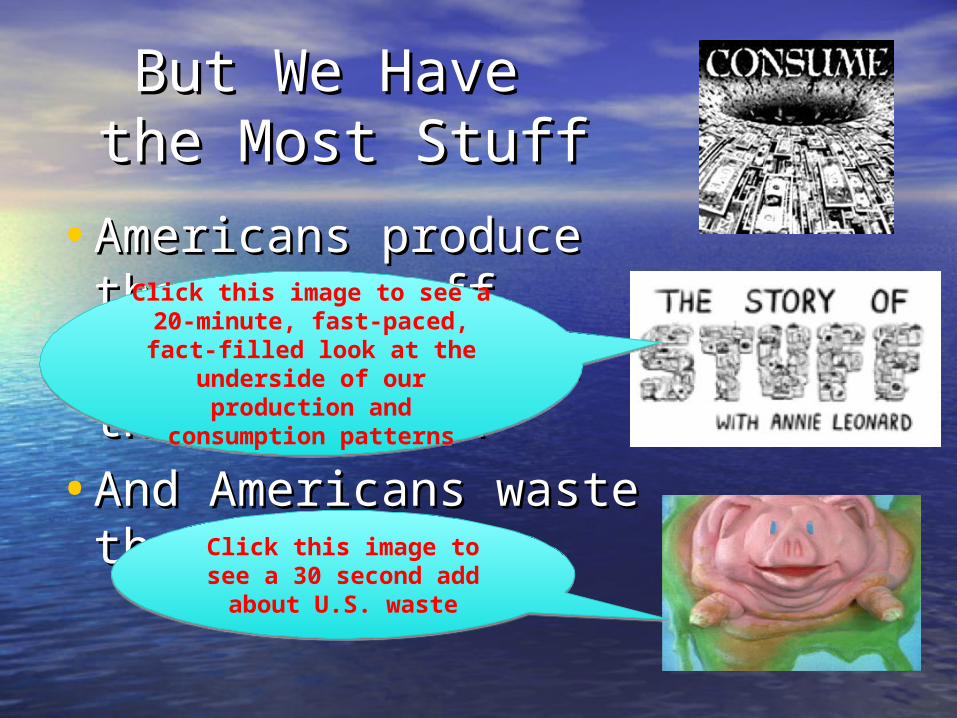
•Americans produce the Americans produce the most stuffmost stuff
•Americans consume Americans consume the most stuffthe most stuff
•And Americans waste And Americans waste the most stuffthe most stuff
Click this image to see a 20-minute, fast-paced, fact-filled look at the
underside of our production and
consumption patterns
Click this image to see a 20-minute, fast-paced, fact-filled look at the
underside of our production and
consumption patterns
Click this image to see a 30 second add about
U.S. waste
Click this image to see a 30 second add about
U.S. waste
So Americans Have More Stuff and So Americans Have More Stuff and Pay Lower Taxes, But…Pay Lower Taxes, But…
• We work much longerWe work much longer• We’re not as healthyWe’re not as healthy• We have less time for family and We have less time for family and
friends and leisurefriends and leisure• We are less safeWe are less safe• And we’re more stressed outAnd we’re more stressed out
Is this the greatest good?Is this the greatest good?

What about Economic What about Economic Opportunity?Opportunity?
• A child born poor in the US has A child born poor in the US has lessless chance to end chance to end up wealthy than in any European country except up wealthy than in any European country except the UK.the UK.
• Danes have 3 times as much chance to move up Danes have 3 times as much chance to move up the income ladder; Swedes, Finns and French 2.5 the income ladder; Swedes, Finns and French 2.5 times as much chancetimes as much chance
• Almost every European country has a larger Almost every European country has a larger percentage of self-employed workers than the USpercentage of self-employed workers than the US
Economic Opportunity (cont)Economic Opportunity (cont)
• The US poverty rate is over 12%; average The US poverty rate is over 12%; average rate in Europe is 7%rate in Europe is 7%
• The US child poverty rate is 21%; average The US child poverty rate is 21%; average in Europe is 7%in Europe is 7%
• The percentage of poor Americans living in The percentage of poor Americans living in severe poverty reached a 32-year high in severe poverty reached a 32-year high in 20072007
• Gap between rich and poor in US is widest Gap between rich and poor in US is widest in industrial worldin industrial world
Is this the greatest number?

American InequalityAmerican Inequality
There’s More . . .There’s More . . .• Americans now have net personal savings rate of Americans now have net personal savings rate of
-1%, lower than any European country except -1%, lower than any European country except GreeceGreece
• In 1970 Americans saved more of their incomes In 1970 Americans saved more of their incomes than Europeansthan Europeans
• Since 1996, more Americans have declared Since 1996, more Americans have declared personal bankruptcy each year than graduated personal bankruptcy each year than graduated from collegefrom college
• Americans rank near last among OECD countries Americans rank near last among OECD countries in income and pension securityin income and pension security
What about Ecological What about Ecological Sustainability?Sustainability?
Compared to the EU-15 countriesCompared to the EU-15 countries• The US has the largest Ecological The US has the largest Ecological
Footprint (negative impact on planet) Footprint (negative impact on planet) according to Global Footprint networkaccording to Global Footprint network
• The US is the least sustainable The US is the least sustainable according to UN Environment programaccording to UN Environment program
Is this the longest run?
In Conclusion…In Conclusion…• Is the U.S. economic model working well? Is the U.S. economic model working well? • By what measures?By what measures?• For whom?For whom?
• What questions do you have? Discuss What questions do you have? Discuss them!them!
• Research and study the issues. Create Research and study the issues. Create your own study group. your own study group.
• Ask your elected representatives, What’s Ask your elected representatives, What’s the Economy for Anyway?the Economy for Anyway?
• What might YOU do to help change our What might YOU do to help change our priorities?priorities?

What’s the Economy For, Anyway?
A Project of the Center for Communication and Civic Engagement, in association with the Forum on Social Wealth, the Political Economy Research
Institute, the Center for Popular Economics, and with support from the University of Washington and
The Rockefeller Brother's Fund
This slide show was created by Tim Jones, John de Graaf, and Lloyd Jansen