what’s new in system center 2012 operations manager 01, 2013 · network node state: ......
TRANSCRIPT
What’s New in System Center 2012 – Operations Manager
Microsoft Corporation
Published: November 1, 2013
Authors
Byron Ricks
Applies To
System Center 2012 – Operations Manager
System Center 2012 Service Pack 1 (SP1) – Operations Manager
System Center 2012 R2 Operations Manager
Feedback
Send suggestions and comments about this document to [email protected].
Copyright
This document is provided "as-is". Information and views expressed in this document, including
URL and other Internet website references, may change without notice.
Some examples depicted herein are provided for illustration only and are fictitious. No real
association or connection is intended or should be inferred.
This document does not provide you with any legal rights to any intellectual property in any
Microsoft product. You may copy and use this document for your internal, reference purposes.
You may modify this document for your internal, reference purposes.
© 2013 Microsoft Corporation. All rights reserved.
Microsoft, Active Directory, Bing, Internet Explorer, JScript, SharePoint, Silverlight, SQL Server,
Visio, Visual Basic, Visual Studio, Win32, Windows, Windows Intune, Windows PowerShell, and
Windows Vista are trademarks of the Microsoft group of companies. Portions of this
documentation related to network monitoring are provided by EMC, and for those portions the
following copyright notice applies 2010 © EMC Corporation. All rights reserved. All other
trademarks are property of their respective owners.
Revision History
Release Date Changes
October 17, 2013 Original release of this guide.
November 1, 2013 Minor updates for this guide.
Contents
What's New in System Center 2012 for Operations Manager ......................................................... 4
What's New in System Center 2012 R2 Operations Manager ..................................................... 4
What's New in System Center 2012 SP1 - Operations Manager ................................................ 7
What's New in System Center 2012 - Operations Manager ...................................................... 14

4
What's New in System Center 2012 for Operations Manager
System Center 2012 – Operations Manager, System Center 2012 Service Pack 1 (SP1) –
Operations Manager, and System Center 2012 R2 Operations Manager have a number of new
capabilities and changes outlined in this document. Each version of Operations Manager has its
own section covering what is new.
What’s New What's New in System Center 2012 R2 Operations Manager
What's New in System Center 2012 SP1 - Operations Manager
What's New in System Center 2012 - Operations Manager
What's New in System Center 2012 R2 Operations Manager System Center 2012 R2 Operations Manager has new capabilities and changes, which are
outlined here. For details about known issues, read the Release Notes for Operations Manager in
System Center 2012 R2
Fabric Monitoring
A close integration between System Center 2012 R2 Virtual Machine Manager and System
Center 2012 R2 Operations Manager introduces System Center cloud monitoring of virtual layers
for private cloud environments. To get this new functionality, use the System Center 2012
Management Pack for System Center 2012 R2 Virtual Machine Manager Dashboard, which is
imported automatically when you integrate Operations Manager and Virtual Machine Manager.
For information about how to integrate Operations Manager and Virtual Machine Manager, see
Configuring Operations Manager Integration with VMM.
Fabric Health Dashboard – Monitoring the Health of Private Clouds
The Fabric Health Dashboard shows a detailed overview of the health of your private clouds and
the fabric that services those clouds. The dashboard helps you answer questions like “What is the
health of my clouds and the fabric serving those clouds?”
To view the Fabric Health Dashboard, click Monitoring, and in Cloud Health Dashboard, click
Cloud Health. Select the cloud you want to investigate, and then, in the Tasks pane, click Fabric
Health Dashboard.
For each cloud, the Fabric Health Dashboard displays these aspects of the fabric:
5
Host State: monitors the health state of the hosting groups or the computing aspects of the
cloud, such as CPU, memory, disks, and network adapters
Storage Pools State File Share and LUN State: monitors the health state of the storage
aspect of fabric for issues, such as disk space capacity and allocation
Network Node State: utilizes network monitoring in Operations Manager and displays the
health state of network nodes (devices) that are relevant for the cloud you selected. Only
physical network devices within one hop from the hosts are shown. To see the physical
network devices, you must enable the Network Monitoring feature of Operations Manager
and monitor the physical network devices connected to the hosts. Virtual networks are not
shown in the dashboard.
The Active Alerts and Number of VMs fields on this dashboard help indicate which issues are
having the greatest impact on your cloud and can help you prioritize your work.
Fabric Monitoring Diagram View – Displays Health States of Cloud and On-Premise Environments
The Diagram view gives you a diagram of the entire infrastructure and shows the health state of
each part of the fabric. The Diagram view helps you answer questions, such as “What is the
health of my entire fabric?” Improvements to the diagram ensure that health rolls up and that the
relevant fabric components are part of the Diagram View.
To Open Diagram View, click Monitoring, and in Microsoft System Center Virtual Machine
Manager Views, click Diagram View for the environment you want to see displayed as a
diagram.
Microsoft Monitoring Agent
Microsoft Monitoring Agent is a new agent that replaces the Operations Manager Agent and
combines .NET Application Performance Monitoring (APM) in System Center with the full
functionality of Visual Studio IntelliTrace Collector for gathering full application profiling traces.
Microsoft Monitoring Agent can collect traces on demand or can be left running, which monitors
applications and collects traces continuously.
Microsoft Monitoring Agent can be used together with Operations Manager or can be used as a
standalone tool for monitoring web applications written with Microsoft .NET Framework. In both
cases, the operator can direct the agent to save application traces in an IntelliTrace log format
that can be opened in Visual Studio Ultimate. The log contains detailed information about
application failures and performance issues.
You can use Windows PowerShell commands to start and stop monitoring and collect IntelliTrace
logs from web applications that are running on Internet Information Services (IIS). To open
IntelliTrace logs generated from APM exceptions and APM performance events, you can use
Visual Studio. For more information, see Monitoring with Microsoft Monitoring Agent.

6
Integrating Operations Manager with Development Processes (DevOps)
Here are two important changes to the DevOps functionality in System Center 2012 R2
Operations Manager:
New Alert Fields of TFS Work Item ID and TFS Work Item Owner
In System Center 2012 R2 Operations Manager, you can synchronize Operations Manager alerts
and Team Foundation Server (TFS) work items. When synchronization is enabled, IT operations
can then assign alerts to the engineering team. Assigning an alert to engineering creates a new
work item in TFS. The workflow will track and synchronize any changes that are made to TFS
work items and any associated Operations Manager alerts.
Integration between System Center 2012 Service Pack 1 (SP1) and TFS used the Ticket ID and
Owner fields of the Operations Manager alert to store and display which work item is associated
with an alert and who it is assigned to. Beginning in System Center 2012 R2 Operations
Manager, two new alert fields, TFS Work Item ID and TFS Work Item Owner, hold these values.
These fields are read-only in the Operations Manager console to prevent accidental changes of
the values that are controlled in TFS.
If you previously personalized any standard alert views or created your own alert views in System
Center 2012 SP1 using Ticket ID and Owner fields to display TFS information, you must replace
those fields with the TFS Work Item ID and TFS Work Item Owner fields to continue displaying
the same information. The previous Ticket ID and Owner fields are still used for synchronization
of alerts with incidents in Service Manager Alert Connector.
You can now use Operations Manager integration with TFS in the same environment with
the Service Manager Alert Connector.
Conversion of Application Performance Monitoring (APM) Performance Events to IntelliTrace format
This monitoring capability now allows the opening of APM performance events from Visual Studio
IDE as if the performance event was captured during the IntelliTrace historical debugging
session. Tightly integrated with TFS Work Item Synchronization Management Pack, this
capability instantaneously brings generated IntelliTrace logs to TFS work items assigned to
engineering. This can result in streamlining communications between IT Operations and
Development and enriching the development experience with analysis of root causes of the
application failure, reducing the mean time to recovery (MTTR) for the problems detected by
APM.
Support for IPv6
In System Center 2012 R2 Operations Manager the Operations console can take IPv6 addresses
as input for Network Discovery and display IPv6 addresses in the network-related views.
Note

7
Java Application Performance Monitoring
The System Center 2012 Management Pack for Java Application Performance Monitoring lets
you monitor Java application performance and exception events by using Operations Manager
Application Advisor. You can set method and resource timing for performance events, stack
traces for exception events, and set Java specific counters (such as Average Request Time and
Requests Per Second) for events. Additionally, you get Operations Manager level alerting on
Java application server counters. You can download the management pack from the Microsoft
Download Center.
System Center Advisor
System Center Advisor is an online service that analyzes installations of Microsoft server
software. With the latest preview version of Advisor, you can now view Advisor alerts in the
Operations Manager Operations console.
Advisor collects data from your installations, analyzes it, and generates alerts that identify
potential issues (such as missing security patches) or deviations from identified best practices
with regard to configuration and usage. Advisor also provides both current and historical views of
the configuration of servers in your environment. Ultimately, Advisor recommendations help you
proactively avoid configuration problems, reduce downtime, improve performance, and resolve
issues faster. For more information about Advisor, see Viewing System Center Advisor Alerts and
Advisor online help
UNIX and Linux Monitoring
UNIX and Linux agents for Operations Manager are now based on the Open Management
Infrastructure (OMI) open-source CIM Object Manager.
Debian GNU/Linux 7 is now supported by the Universal Linux agents and Management Packs.
What's New in System Center 2012 SP1 - Operations Manager System Center 2012 Service Pack 1 (SP1), Operations Manager has a number of new
capabilities and changes outlines in this document. We urge you to read the Release Notes:
System Center 2012 SP1 - Operations Manager for details about known issues.
New capabilities include improvements to .NET Application Performance Monitoring (APM), Audit
Collection Service (ACS), and UNIX and Linux monitoring.
New Monitoring Capabilities
Monitoring Windows Services Built on the .NET Framework
One of the most commonly requested features that was present in AVIcode, but not yet re-
implemented in System Center 2012 – Operations Manager was the ability to monitor Windows

8
Services, not just IIS-hosted applications. This is now possible again, and integrated into the APM
template.
Automatic Discovery of ASP.NET MVC3 and MVC4 Applications
If the application contains “System.Web.Mvc.dll” in the /bin subfolder, it is now automatically
discovered as an ASP.NET Web Application without the need to use the overrides that were
documented in the APM.WEB.IIS7.mp Guide. For more information, see Configuring the
Management Pack for Operations Manager APM Web IIS 7.
New Transaction Types: MVC Pages and WCF Methods
New transaction types have been introduced for MVC pages and for MVC methods. This
augments the capability to specify more detailed settings for a given feature of your application.
How to use this feature is documented in the APM template documentation.
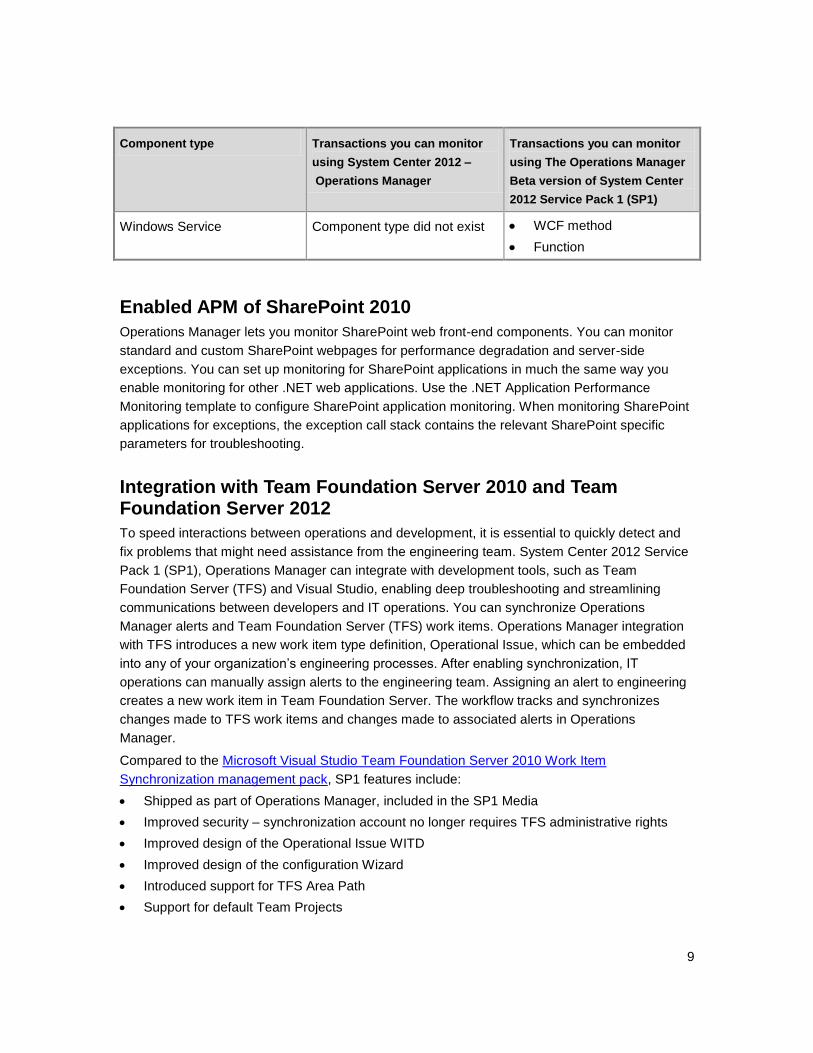
Comparing Transaction Monitoring
Here is a comparison of the transactions you can monitor using System Center 2012 –
Operations Manager and those you can monitor using the Operations Manager Beta version of
System Center 2012 Service Pack 1 (SP1).
Component type Transactions you can monitor
using System Center 2012 –
Operations Manager
Transactions you can monitor
using The Operations Manager
Beta version of System Center
2012 Service Pack 1 (SP1)
ASP.NET web application ASP.NET webpage
ASP.NET web service
Function
ASP.NET webpage
ASP.NET MVC page
ASP.NET web service
WCF method
Function
ASP.NET web service ASP.NET webpage
ASP.NET web service
Function
ASP.NET webpage
ASP.NET MVC page
ASP.NET web service
WCF method
Function
WCF service No transactions allowed ASP.NET webpage
ASP.NET MVC page
ASP.NET web service
WCF method
Function
9
Component type Transactions you can monitor
using System Center 2012 –
Operations Manager
Transactions you can monitor
using The Operations Manager
Beta version of System Center
2012 Service Pack 1 (SP1)
Windows Service Component type did not exist WCF method
Function
Enabled APM of SharePoint 2010
Operations Manager lets you monitor SharePoint web front-end components. You can monitor
standard and custom SharePoint webpages for performance degradation and server-side
exceptions. You can set up monitoring for SharePoint applications in much the same way you
enable monitoring for other .NET web applications. Use the .NET Application Performance
Monitoring template to configure SharePoint application monitoring. When monitoring SharePoint
applications for exceptions, the exception call stack contains the relevant SharePoint specific
parameters for troubleshooting.
Integration with Team Foundation Server 2010 and Team Foundation Server 2012
To speed interactions between operations and development, it is essential to quickly detect and
fix problems that might need assistance from the engineering team. System Center 2012 Service
Pack 1 (SP1), Operations Manager can integrate with development tools, such as Team
Foundation Server (TFS) and Visual Studio, enabling deep troubleshooting and streamlining
communications between developers and IT operations. You can synchronize Operations
Manager alerts and Team Foundation Server (TFS) work items. Operations Manager integration
with TFS introduces a new work item type definition, Operational Issue, which can be embedded
into any of your organization’s engineering processes. After enabling synchronization, IT
operations can manually assign alerts to the engineering team. Assigning an alert to engineering
creates a new work item in Team Foundation Server. The workflow tracks and synchronizes
changes made to TFS work items and changes made to associated alerts in Operations
Manager.
Compared to the Microsoft Visual Studio Team Foundation Server 2010 Work Item
Synchronization management pack, SP1 features include:
Shipped as part of Operations Manager, included in the SP1 Media
Improved security – synchronization account no longer requires TFS administrative rights
Improved design of the Operational Issue WITD
Improved design of the configuration Wizard
Introduced support for TFS Area Path
Support for default Team Projects

10
Synchronization for new APM alert types from IIS8 web applications, WCF, Windows
Services, and also for non-APM alerts
Localization of Wizard UI and MP elements, and compatibility with localized versions of TFS
Synchronize file attachments that can reside on a network file share or appended to TFS
work items.
Automatically route and close alerts to TFS
IT operations can open TFS work items directly from the Operations Manager console using
built-in integration with TFS web UI.
Conversion of Application Performance Monitoring events to IntelliTrace format
This new monitoring capability allows for opening of APM exception events from Visual Studio
IDE as if the exception was captured during the IntelliTrace historical debugging session.
Developers can stay within their familiar environment to examine complete exception call stack,
for example: method parameters captured at the time of exception, and can navigate between the
source code modules that participated in the exception call chain. Tightly integrated with TFS
Work Item Synchronization Management Pack, this capability instantaneously brings generated
IntelliTrace logs to TFS work items assigned to engineering. This can result in streamlining
communications between IT Operations and Development and enriching the development
experience with analysis of root causes of the application failure, reducing the mean time to
recovery (MTTR) for the problems detected by APM.
Features include:
APM exception events can be saved in IntelliTrace file format directly from Application
Diagnostics
Debug Symbols can be late-bound in Visual Studio 2012 allowing developers to navigate
through source code, even when the production environment has no symbols loaded
Developers can see one level of parameters that are converted and visible in the Visual
Studio 2012 Ultimate Locals window, and displayed in the context of the selected call stack
frame
Developers can see additional method specific information (i.e. a connection string for
ExecuteReader() method) in the Visual Studio 2012 Locals window in the context of the
selected call stack frame
Traces are automatically attached to APM exception events and can be automatically added
to TFS work items or stored on a network file share. Developers can open traces using Visual
Studio 2012 Ultimate and troubleshoot application problems while staying in their
development environment.
Collecting Historical Traces Using IntelliTrace Profiling Management Pack
System Center 2012 SP1 – Operations Manager includes IntelliTrace Profiling Management
Pack. This management pack lets you capturing historical traces directly from the Operations

11
Manager console. These traces can help developers investigate problems by giving them visibility
to application execution history without the developers needing access to the servers where the
applications ran. Developers can use Visual Studio 2012 Ultimate to open collected traces.
IntelliTrace Profiling Management Pack automatically deploys the necessary infrastructure,
IntelliTrace Collector, to the designated servers. When traces are collected, they are uploaded to
a network file share and attached to Operations Manager alerts. Traces are uploaded to the
management server using the same secure Operations Manager channel that agents use to
communicate with the management servers. By configuring Team Foundation Server (TFS)
synchronization, traces can be automatically added or linked to TFS work items.
New Management Packs and Support for Windows Server 2012 and IIS 8
To use APM with Windows Server 2012, you must import the following management packs:
Microsoft.Windows.Server.Library version 6.0.6989.0 or newer
Microsoft.Windows.Server.2012.Discovery version 6.0.6989.0 or newer
Microsoft.Windows.InternetInformationServices.CommonLibrary version 7.0.8862.0 or newer
Microsoft.Windows.InternetInformationServices.2012 version 7.0.8862.0 or newer
If you had previously imported the
Microsoft.Windows.InternetInformationServices.6.2 management pack, which was
part of the Windows 8 Beta management pack release, it should be removed first.
Also, from the /ManagementPacks folder of the System Center 2012 – Operations Manager
media, you should import Microsoft.SystemCenter.Apm.Web.IIS8. This is the equivalent of the
Microsoft.SystemCenter.Apm.Web.IIS7 management pack, which was previously (and still is)
used for IIS7.
These management pack versions to be used are specific to System Center 2012 Service Pack 1
(SP1) - Operations Manager. Other than these specific prerequisites, how to use this feature is
documented in the APM template documentation and the experience is identical to configuring
APM for an IIS7-hosted application.
360 .NET Application Monitoring Dashboards
System Center 2012 Service Pack 1 (SP1) - Operations Manager can show you different
perspectives of application health in one place—360 .NET Application Monitoring Dashboards.
The 360 .NET Application Monitoring Dashboards display information from Global Service
Monitor, .NET Application Performance Monitoring, and Web Application Availability Monitoring to
provide a summary of health and key metrics for 3-tier applications in a single view. The 360
.NET Application Monitoring Dashboards show where an application is unhealthy and provide a
launch point for detail dashboards that highlight component-level issues.
The 360 .NET Application Monitoring Dashboards display data from powerful monitoring tools.
.NET Application Performance Monitoring looks deep into the application to get details that can
Important

12
help you pinpoint solutions from server-side and client-side perspectives. Web Application
Availability monitoring in Operations Manager monitors internal synthetic transactions. Global
Service Monitor monitors the availability of applications from an outside location, measuring
availability from where the user is.
The 360 .NET Application Monitoring Dashboards show the following:
Key application metric or action Type of monitoring used
Availability Web Application Availability Monitoring and
Global Service Monitor
Reliability .NET Application Performance Monitoring
Performance .NET Application Performance Monitoring and
Global Service Monitor
Diagnostics .NET Application Performance Monitoring
Resolution The Team Foundation Server (TFS) Connector
management pack takes an alert, assigns it to
development in TFS with all appropriate detail.
ACS support for Dynamic Access Control
Windows Server 2012 enables business data owners to easily classify and label data allowing
access policies to be defined for data classes that are critical to business. Compliance
management in Windows Server 2012 becomes more efficient and flexible because access and
audit policies can be based not only on user and group information but a richer set of user,
resource and environmental claims, and properties from Active Directory and other sources. User
claims such as roles, projects, organization, resource properties such as secrecy, and device
claims such as health can be used in defining access and audit policies.
Windows Server 2012 enhances the existing Windows ACL model to support Dynamic Access
Control where customers can define an expression based authorization access policy that
includes conditions using user and machine claims, as well as resource (for example, file)
properties. The following illustration is descriptive, and not an actual representation of an
expression:
Allow Read and Write access if User.Clearance >= Resource.Secrecy and Device. Healthy
Allow Read and Write access if User.Project any_of Resource.Project
System Center 2012 Service Pack 1 (SP1) contributes to the fulfilling these scenarios by
providing enterprise-wide visibility into the use of the Dynamic Access Control, leveraging
Operations Manager’s Audit Collection Services to collect events from the relevant machines (file
servers, domain controllers) and providing reporting to enable auditors and compliance officers to
report on the use of Dynamic Access Control – for example, audit changes in policies, object

13
access (success and failure), and “what-if” assessment of what would happen if a certain policy
were applied.
Additional UNIX and Linux Monitoring Capabilities
Support for CentOS, Debian, Oracle, and Ubuntu Linux
System Center 2012 Service Pack 1 (SP1) - Operations Manager has added support for
monitoring of the following Linux operating systems:
CentOS 5 (x86/x64)
CentOS 6 (x86/x64)
Debian GNU/Linux 5 (x86/x64)
Debian GNU/Linux 6 (x86/x64)
Oracle Linux 5 (x86/x64)
Oracle Linux 6 (x86/x64)
Ubuntu Server 10.04 (x86/x64)
Ubuntu Server 12.04 (x86/x64)
Support for these operating systems is implemented with the “Universal Linux” monitoring
packs. Import the following MP files to enable monitoring of the new Linux operating systems:
Microsoft.Linux.Universal.Library.mp
Microsoft.Linux.Universal.Monitoring.mp
Microsoft.Linux.UniversalD.1.mpb (to support Debian and Ubuntu Linux agents)
Microsoft.Linux.UniversalR.1.mpb (to support CentOS Linux agents)
Improved Heartbeat Monitoring
Heartbeat monitors for Operations Manager UNIX and Linux agents now support configurable
“MissedHeartbeats” – allowing for a defined number of failed heartbeats to occur before
generating an alert. Failed heartbeats will now cause Operations Manager to unload rules and
monitors for UNIX and Linux agents until the heartbeat is restored. This makes it very easy to
identify UNIX and Linux computers with failed heartbeats in the Operations Manager console.
See Also
.NET Application Performance Monitoring Template
Before You Begin Monitoring .NET Applications

14
What's New in System Center 2012 - Operations Manager System Center 2012 – Operations Manager has a number of new capabilities and changes
outlines in this document. We urge you to read the System Center 2012 – Operations Manager
Release Candidate Release Notes for details about known issues.
Setup and Upgrade
Setup
Operations Manager has a new Setup wizard. For important instructions about how to install
Operations Manager, see the Deployment Guide for System Center 2012 – Operations Manager.
Upgrading to System Center 2012 – Operations Manager
Operations Manager provides an upgrade wizard to help you upgrade your System Center
Operations Manager 2007 R2 environment to System Center 2012 – Operations Manager
Release Candidate. For more information, see Upgrading to System Center 2012 – Operations
Manager.
New process flow diagrams help you determine your upgrade path from System Center
Operations Manager 2007 R2 to System Center 2012 – Operations Manager Release Candidate
and map your upgrade process. To open and view content for any step in the process, just click a
process box.
Upgrade process flow diagram

15
Upgrade process flow diagram
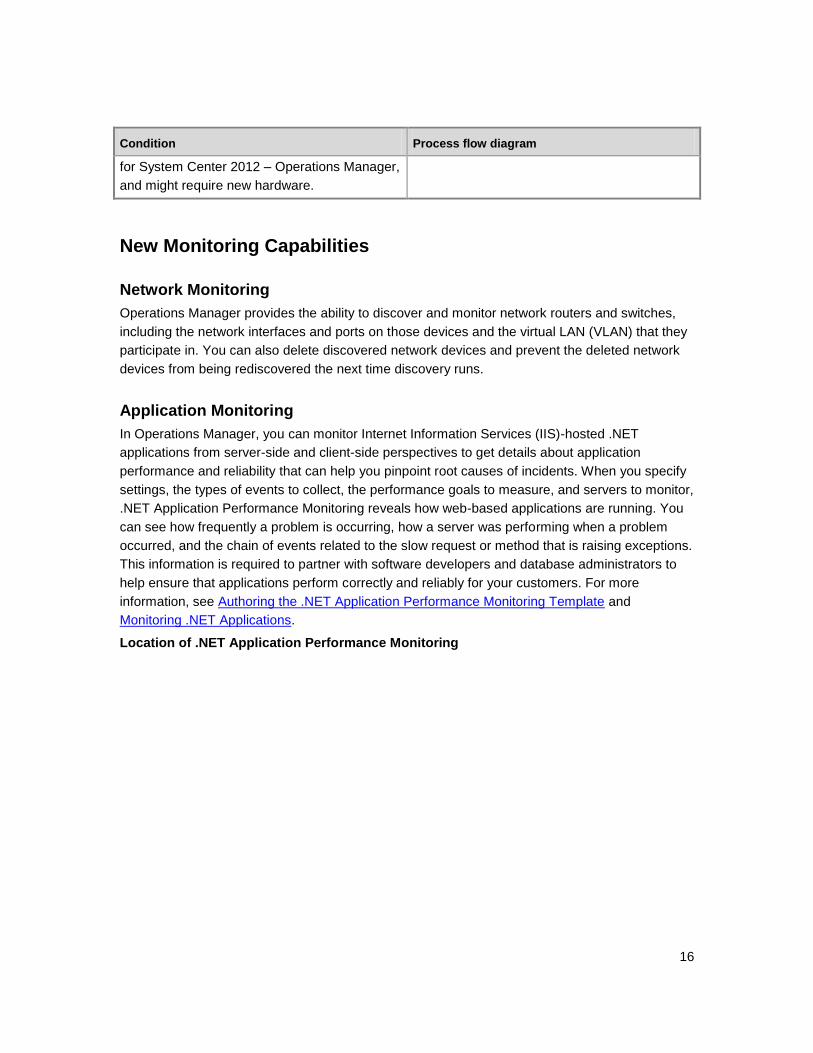
The following table lists the process flow diagrams and descriptions of when each upgrade path
should be used.
Condition Process flow diagram
When you have a single-server or distributed
management group that already meets the
minimum supported configuration requirements
for System Center 2012 – Operations Manager.
Single-Server and Distributed Upgrade
(Simple) Process Flow Diagram
When your single-server management group
does not yet meet the minimum supported
configuration requirements for System
Center 2012 – Operations Manager, and
requires new hardware.
Single-Server Upgrade (Complex) Process
Flow Diagram
When your distributed management group has
one or more servers that do not meet the
minimum supported configuration requirements
Distributed Upgrade (Complex) Process Flow
Diagram
16
Condition Process flow diagram
for System Center 2012 – Operations Manager,
and might require new hardware.
New Monitoring Capabilities
Network Monitoring
Operations Manager provides the ability to discover and monitor network routers and switches,
including the network interfaces and ports on those devices and the virtual LAN (VLAN) that they
participate in. You can also delete discovered network devices and prevent the deleted network
devices from being rediscovered the next time discovery runs.
Application Monitoring
In Operations Manager, you can monitor Internet Information Services (IIS)-hosted .NET
applications from server-side and client-side perspectives to get details about application
performance and reliability that can help you pinpoint root causes of incidents. When you specify
settings, the types of events to collect, the performance goals to measure, and servers to monitor,
.NET Application Performance Monitoring reveals how web-based applications are running. You
can see how frequently a problem is occurring, how a server was performing when a problem
occurred, and the chain of events related to the slow request or method that is raising exceptions.
This information is required to partner with software developers and database administrators to
help ensure that applications perform correctly and reliably for your customers. For more
information, see Authoring the .NET Application Performance Monitoring Template and
Monitoring .NET Applications.
Location of .NET Application Performance Monitoring

17
Performance and Scale
Resource Pools
A resource pool contains only management servers and provides the ability to distribute
workloads across multiple management servers, such as availability, network device monitoring,
distributed monitor health rollup, and group calculation. For more information, see How to Create
a Resource Pool.
Removal of Root Management Server
In Operations Manager, all management servers are peers; there is no root management server.
The workload is split among all management servers in a management group, which provides
high availability without requiring a cluster.
18
Improved Experience
Web Console
Operations Manager introduces a new web console that is optimized for faster load times and
provides you with access to the new IT pro dashboards.
Dashboard Views
Operations Manager includes new comprehensive dashboard views that combine multiple panels
of information into a single view. In Operations Manager, you can add the new dashboard views
to My Workspace and the Monitoring workspace.
Creating Dashboard Views
Dashboard views have been significantly upgraded in Operations Manager from their capabilities
in System Center Operations Manager 2007 R2, including custom layouts and nested dashboard
views.
Display Dashboard Views in SharePoint
The Operations Manager web part displays specified dashboard views and can be added to
Microsoft SharePoint 2010 sites. For more information, see Add a Dashboard to a SharePoint
Site.
System Center 2012 - Orchestrator Replaces Microsoft-Developed Connector Functionality
Connectors developed by Microsoft have been discontinued for System Center 2012 –
Operations Manager and their functionality has been replaced by System Center 2012 -
Orchestrator.
Orchestrator is not required to create and test non-Microsoft-developed connectors
against System Center 2012.
Orchestrator provides the ability to create and run automated workflows, called runbooks, made
of multiple activities that each performs a distinct function. The connector functionality of enabling
System Center Operations Manager 2007 R2 to synchronize alerts with remote systems is
achieved by creating runbooks, using activities that interact with Operations Manager and one or
more other products. Because runbooks can include sophisticated logic and activities from any
number of Integration Packs, you can implement scenarios that cannot be easily achieved with
connectors. Integration Packs will be delivered for each System Center component and provide
additional activities specific to a particular component.
Note

19
Operations Manager Module for Windows PowerShell
Operations Manager provides a Windows PowerShell 2.0 module containing a full set of new
cmdlets. The cmdlets in this module are only compatible with Operations Manager. You can
recognize the Operations Manager cmdlets by the "SC" preceding the noun. For additional
information about the Operations Manager cmdlets, open the Operations Manager command
shell and type Get-Help about_OpsMgr_WhatsNew. For information about how the Operations
Manager 2007 cmdlets map to the Operations Manager cmdlets, type Get-Help
about_OpsMgr_Cmdlet_Names.
To use the Operations Manager cmdlets, you must establish a connection to an Operations
Manager management group. You can establish either a persistent connection in which you can
run multiple cmdlets, or a temporary connection when running a single cmdlet. For more
information about connections, open the Operations Manager Shell and type Get-Help
about_OpsMgr_Connections.
UNIX- and Linux-Based Computers
In Operations Manager, you can perform privileged operations on UNIX-based and Linux-based
computers using unprivileged Run As accounts by combining with “sudo” elevation on the target
UNIX-based and Linux-based computers. This capability avoids the need for UNIX or Linux root
passwords to be known on the management server, and keeps the privilege control entirely within
the domain of the UNIX or Linux administrator. Operations Manager also includes new Windows
PowerShell cmdlets for performing agent maintenance functions on UNIX-based and Linux-based
computers, allowing for scripting and background operations. In addition, the resource pool
feature supports computers running UNIX and Linux. If a management server fails, another
management server in the resource pool can take over the monitoring, providing high availability.
For more information, see Monitoring UNIX- and Linux-Based Computers
Operations Console
You will notice some subtle changes to the Operations console. The Actions pane is now the
Tasks pane, and includes a new section called Navigation Tasks that makes it easy for you to
open views for a selected object. The Tasks pane offers two tabs: one for actions and one for
resources and Help links. The Navigation and Tasks panes can be minimized or expanded
instantly by clicking the arrow in the title bar of the pane.
See Also
Operations Guide for System Center 2012 – Operations Manager
Authoring Guide for System Center 2012 – Operations Manager