what’s in a diagram? - philosophy in a diagram... · what’s in a diagram? on the...
TRANSCRIPT
What’s in a Diagram?
On the Classification of Symbols, Figuresand Diagrams
Mikkel Willum Johansen
Abstract In this paper I analyze the cognitive function of symbols, figures anddiagrams. The analysis shows that although all three representational forms serveto externalize mental content, they do so in radically different ways, and conse-quently they have qualitatively different functions in mathematical cognition.Symbols represent by convention and allow mental computations to be replaced byepistemic actions. Figures and diagrams both serve as material anchors for con-ceptual structures. However, figures do so by having a direct likeness to the objectsthey represent, whereas diagrams have a metaphorical likeness. Thus, I claim thatdiagrams can be seen as material anchors for conceptual mappings. This classi-fication of diagrams is of theoretical importance as it sheds light on the functionalrole played by conceptual mappings in the production of new mathematicalknowledge.
1 Introduction
After the formalistic ban on figures, a renewed interest in the visual representationused in mathematics has grown during the last few decades (see e.g. [11–13, 24,27, 28, 31]). It is clear that modern mathematics relies heavily on the use of severaldifferent types of representations. Using a rough classification, modern mathe-maticians use: written words, symbols, figures and diagrams. But why do math-ematicians use different representational forms and not only, say, symbols orwritten words? In this paper I will try to answer this question by analyzing thecognitive function of the different representational forms used in mathematics.Especially, I will focus on the somewhat mysterious category of diagrams and
M. W. Johansen (&)Københavns Universitet, Copenhagen, Denmarke-mail: [email protected]
L. Magnani (ed.), Model-Based Reasoning in Science and Technology,Studies in Applied Philosophy, Epistemology and Rational Ethics 8,DOI: 10.1007/978-3-642-37428-9_6, � Springer-Verlag Berlin Heidelberg 2014
89
explain why diagrams can be seen as material anchors for conceptual metaphorsand blends. However, in order to identify what is special about diagrams, we willhave to analyze the other representational forms as well. Thus, I will begin byexplaining the cognitive significance of symbols and figures, and conclude withthe analysis of diagrams.
2 The General Function of External Representations
In modern cognitive science there is a growing understanding of the fact thathuman cognition cannot be understood only by looking at the processes going oninside the human brain. As it is, our cognitive life seems to involve the externalenvironment in several important ways.
From this point of view, external representations have several different cog-nitive functions. They obviously serve communicative purposes and reducedemands on internal memory. Furthermore, as noticed by Andy Clark [5], whenthoughts are represented in an external media they are in non-trivial ways turnedinto objects. This objectification of thoughts allows us—and others—to inspectand criticize the thoughts. We can carefully scrutinize each step of a complicatedargument and even form meta-thoughts about our own thinking. It seems that theuse of external representations of mental content is a prerequisite for the formationof high-level cognitive processes. This function is clearly relevant in the case ofmathematics, both in regard to the everyday practice of working mathematiciansand in regard to the formation of meta-mathematics; in fact, meta-mathematics isexactly the kind of high-level cognitive processes that depends crucially on ourability to represent mathematical thoughts in an external media.
The last general function of external representations I will go through here istheir ability to serve as material anchors for complex thoughts. As noticed byEdwin Hutchins [15], our ability to perform reasoning involving complex con-ceptual structures depends on our ability to represent such structures in anappropriate way. When we reason with a complex structure, we manipulate partsof the structure while the rest is kept stable. Unfortunately, our ability to do thismentally is limited. Consequently, human reasoning can be facilitated by the useof external representations that allow us to anchor some of the elements of theconceptual structure in physical representations that are globally stable, but locallymanipulable. The combination of stability and manipulability of some externalrepresentations allows us to focus on the part of the structure manipulated on,while the rest of the structure is kept stable by the external media. Consequently,we might be able to work on more complex conceptual structures and performmore complex manipulations if we use an appropriate external representation. Aswe shall see, this anchoring property plays an important part in the function of bothfigures and diagrams.
It should be noted that external representations have several other importantcognitive functions, see e.g. [20] for an overview.
90 M. W. Johansen
3 Symbols and Words
3.1 Symbols as Semantic and Syntactic Objects
It is a well-known fact that mathematical symbols can be treated as both semanticand syntactic objects (see e.g. [7, 8]). As semantic objects, symbols carry math-ematical content or meaning. With a few rare exceptions modern mathematicalsymbols carry meaning only by convention; the symbols are abstract and have nolikeness with their referents. The symbol ‘‘�’’ for instance, does not resemble thearithmetic operation of multiplication, and the Hindu-Arabic numeral ‘‘8’’ does nothave any likeness with the quantity eight (such as for instance the Egyptian symbol‘‘IIIIIIII’’, where the token ‘‘I’’ is repeated eight times).
As syntactic objects, symbols are objects of formal transformations. Whensymbols are treated as syntactic objects, the meaning of the symbols is suspended,and the problem at hand is solved by manipulating the symbols following purelyformal rules. As an example, consider how the points of intersection between acircle and a straight line are found using analytic geometry. If we are to find theintersection points between a straight line l with slope �1/2 going through (0;10)and a circle C with center (4;3) and radius 5, we will at first have to find the
equations of the two objects (y ¼ �1=2xþ 10 and ðx� 4Þ2 þ ðy� 3Þ2 ¼ 52,respectively). Then we must substitute the y in C’s equation with the expression�1=2xþ 10, simplify and solve the resulting quadratic equation. During thesolution process, we are not interested in—and we do not use—the geometricinterpretation of the symbols. We are only concerned with the actual symbols onthe paper before us. There is no reference to the meaning or content of the sym-bols, only to the symbolic forms and the transformations we make on them; wetalk about ‘‘substituting’’ one symbolic form with another and ‘‘simplifying‘‘ otherexpressions. The meaning of the symbols is only restored when the solution isfound and given a geometric interpretation in the form of intersection points.
Arguably, this is a simple example taken from high-school mathematics, but thesame dialectic between the use of symbols as semantic and syntactic objects can befound in more advanced mathematical texts as well (for analysis of more elaborateexamples see [18, p. 139]).
In this case the symbols are in cognitive terms used as cognitive artifactsallowing computations to be performed as epistemic actions (cf. [7, 18, 21]). Forthose not familiar with distributed cognition, this might call for some explanation.An epistemic action is an actions taken in order to get information or solvecomputational tasks, and not in order to reach a pragmatic goal. The use ofepistemic actions is a well-known cognitive strategy. When, for instance, we solvea jigsaw puzzle, we rotate and manipulate the external, physical pieces of thepuzzle in order to see where they fit. In other words, we solve a computationalproblem by performing motor actions and perceiving the results of those actions.In theory we could solve the problem mentally by make internal models of thepieces and think out a solution, but we rarely do that. The reason is simple.
What’s in a Diagram? 91

As David Kirsh has put it: ‘‘Cognitive processes flow to wherever it is cheaper toperform them [20, p. 442]’’, and for humans it is cognitively cheaper, faster andmore reliable to solve jigsaw puzzles by performing epistemic actions on theexternal puzzle pieces rather than thinking out a solution.1
In other cases, however, our physical environment does not support theexternalization of a problem. For this reason we sometimes produce special arti-facts—cognitive artifacts—that allow us to externalize the problem and solve it byperforming epistemic actions. When treated as syntactic objects, mathematicalsymbols are exactly such cognitive artifacts: They allow us to substitute mentalcomputations with epistemic actions, and that is the cognitively cheapest way ofsolving some mathematical problems.
3.2 Symbols as Physical Objects
As mentioned above, it is well-known that symbols can be used as semantic andsyntactic objects. I would, however, like to point out that symbols can also play athird and qualitatively different role in mathematical cognition, and that is the roleas plain physical objects. This use of symbols is often manifested in pen-and-papercalculations. When for instance we multiply two numbers using pen and paper, theresults of the sub-calculations are carefully arranged in columns and rows, and weuse the previously written results as visual cues as to where we should write thenext sub-result. In other words, the physical layout of the symbols is used as a wayto guide the (epistemic) actions we perform on them (see [18, p. 125] for moreelaborate examples).
The use of symbols as objects is also clear in the case of matrix multiplication.Here, the usual arrangement of the elements of matrices in columns and rows is aconsiderable help when we have to locate the elements we are about to operate onin a particular step in the process (cf. [11, p. 242]) . Notice, that the algebraicstructure of matrix multiplication is completely independent of the usual physicallayout of the symbols; the product of an m� n matrix A ¼ ½aij� with an n� pmatrix B ¼ ½bjk� can simply be defined as the m� p matrix, whose ik-entry is thesum:
Xn
j¼1
aijbjk
(see e.g. [29, p. 178]). So in theory, it would be possible to perform matrixmultiplication on two unsorted lists A and B of indexed elements. In that case, it
1 It should be noted that there is an interesting parallelism between the concept of epistemicactions developed in [21], and the concept of manipulative abduction developed by LorenzoMagnani (e.g. [25, 26]). Magnani’s concept is however developed in a slightly differenttheoretical framework, and it would take us too far astray to explore the parallelism further.
92 M. W. Johansen
would however pose a considerable task to find the right elements to operate on.By arranging the elements of the matrices in columns and rows in the usual way,the cost of this task is markedly reduced: The sum given above is simply the dotproduct of the ith row of A and the kth column of B, and if you know that, it is easyto find the elements you need. Thus, the multiplication process is clearly guided bythe physical layout of the matrices.
It has also been suggested that the actual physical, or rather: typographicallayout of symbolic representation of mathematical content has in some casesinspired new theorems and theoretical developments. Leibniz’ derivation of thegeneral product formula for differentiation is a case in point. Using the standardsymbolism, the formula can be stated as:
dnðxyÞ ¼ dnxd0yþ n
1dn�1xd1yþ nðn� 1Þ
1 � 2 dn�2xd2y etc: ð1Þ
It has been suggested that Leibniz’ derived the formula by making a few, inspiredsubstitutions in Newton’s binominal formula:
nðxþ yÞ ¼ xny0 þ n
1xn�1y1 þ nðn� 1Þ
1 � 2 xn�2y2 etc: ð2Þ
(see [18, 24, p. 155] for further elaboration and more examples).
3.3 Words as Abstract Symbols
Finally, we might compare the use of abstract mathematical symbols with the useof written words. It should be noted that words are also abstract symbols (at leastin alphabetic systems). In general, the physical appearance of a word has nolikeness with the object, the word is supposed to represent; The word-picture‘‘point’’, say, does not look like a point, and the word-picture ‘‘eight’’ does nothave any more likeness with eight units than the abstract number-symbol ‘‘8’’.
Furthermore, words can carry mathematical content just as well as mathemat-ical symbols. Of course, in general symbols allow a much shorter and morecompact representation of a given content, but that is, in my view, only a super-ficial difference between the two representational forms. The important differencebetween written words and symbols is the fact that mathematical symbols, besidestheir role as bearers of content, can also be treated as syntactic and physicalobjects. With a few rare exceptions (such as avant-garde poetry), written words arenever used as more than semantic objects; they cannot be used for purely syntactictransformations or as purely physical objects. For this reason, there are qualitativedifferences between written words and written mathematical symbols. We cansimply do more with symbols than we can do with written words (cf. [18, p. 136]) .
What’s in a Diagram? 93
4 Figures
4.1 Figures as Anchors of Conceptual Structures
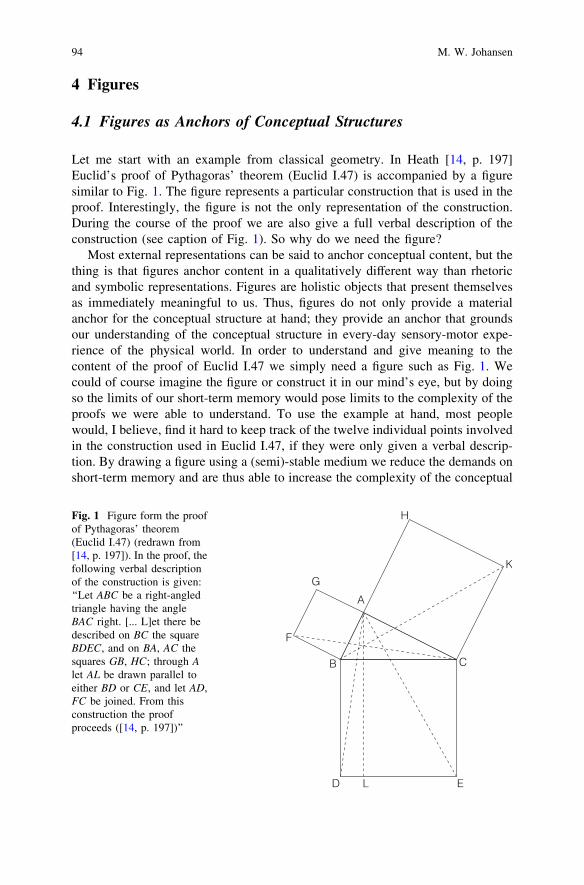
Let me start with an example from classical geometry. In Heath [14, p. 197]Euclid’s proof of Pythagoras’ theorem (Euclid I.47) is accompanied by a figuresimilar to Fig. 1. The figure represents a particular construction that is used in theproof. Interestingly, the figure is not the only representation of the construction.During the course of the proof we are also give a full verbal description of theconstruction (see caption of Fig. 1). So why do we need the figure?
Most external representations can be said to anchor conceptual content, but thething is that figures anchor content in a qualitatively different way than rhetoricand symbolic representations. Figures are holistic objects that present themselvesas immediately meaningful to us. Thus, figures do not only provide a materialanchor for the conceptual structure at hand; they provide an anchor that groundsour understanding of the conceptual structure in every-day sensory-motor expe-rience of the physical world. In order to understand and give meaning to thecontent of the proof of Euclid I.47 we simply need a figure such as Fig. 1. Wecould of course imagine the figure or construct it in our mind’s eye, but by doingso the limits of our short-term memory would pose limits to the complexity of theproofs we were able to understand. To use the example at hand, most peoplewould, I believe, find it hard to keep track of the twelve individual points involvedin the construction used in Euclid I.47, if they were only given a verbal descrip-tion. By drawing a figure using a (semi)-stable medium we reduce the demands onshort-term memory and are thus able to increase the complexity of the conceptual
Fig. 1 Figure form the proofof Pythagoras’ theorem(Euclid I.47) (redrawn from[14, p. 197]). In the proof, thefollowing verbal descriptionof the construction is given:‘‘Let ABC be a right-angledtriangle having the angleBAC right. [... L]et there bedescribed on BC the squareBDEC, and on BA, AC thesquares GB, HC; through Alet AL be drawn parallel toeither BD or CE, and let AD,FC be joined. From thisconstruction the proofproceeds ([14, p. 197])’’
94 M. W. Johansen
structures we are able to handle. That is one of the reasons why we use figures as amaterial anchor for complex conceptual structure, such as the structure involved inEuclid I.47.
4.2 Knowledge Deduced from Figures
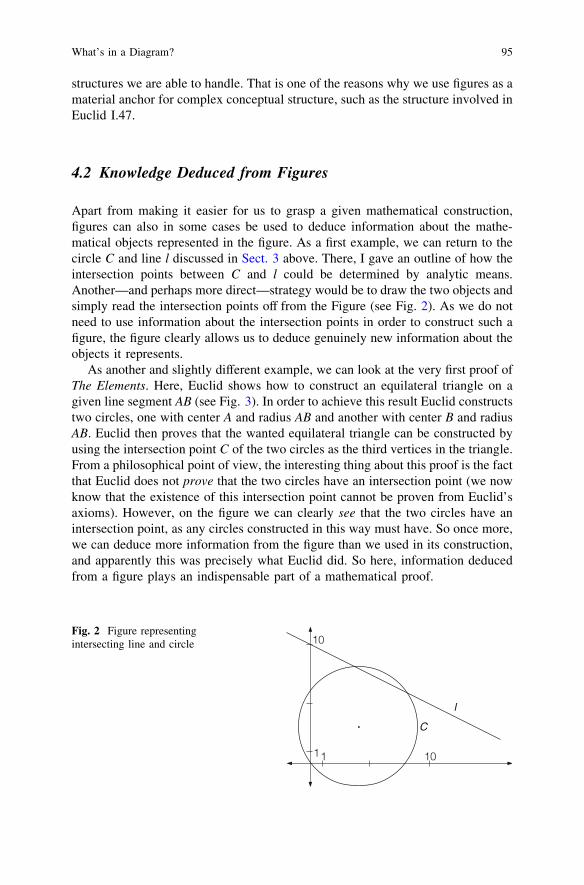
Apart from making it easier for us to grasp a given mathematical construction,figures can also in some cases be used to deduce information about the mathe-matical objects represented in the figure. As a first example, we can return to thecircle C and line l discussed in Sect. 3 above. There, I gave an outline of how theintersection points between C and l could be determined by analytic means.Another—and perhaps more direct—strategy would be to draw the two objects andsimply read the intersection points off from the Figure (see Fig. 2). As we do notneed to use information about the intersection points in order to construct such afigure, the figure clearly allows us to deduce genuinely new information about theobjects it represents.
As another and slightly different example, we can look at the very first proof ofThe Elements. Here, Euclid shows how to construct an equilateral triangle on agiven line segment AB (see Fig. 3). In order to achieve this result Euclid constructstwo circles, one with center A and radius AB and another with center B and radiusAB. Euclid then proves that the wanted equilateral triangle can be constructed byusing the intersection point C of the two circles as the third vertices in the triangle.From a philosophical point of view, the interesting thing about this proof is the factthat Euclid does not prove that the two circles have an intersection point (we nowknow that the existence of this intersection point cannot be proven from Euclid’saxioms). However, on the figure we can clearly see that the two circles have anintersection point, as any circles constructed in this way must have. So once more,we can deduce more information from the figure than we used in its construction,and apparently this was precisely what Euclid did. So here, information deducedfrom a figure plays an indispensable part of a mathematical proof.
Fig. 2 Figure representingintersecting line and circle
What’s in a Diagram? 95

The use of figures in mathematical reasoning is hotly debated, and there areseveral things to discuss in connection to the three examples given above. At first,it should be noted that the use of figures as an aid to grasp mathematical content(such as the figure accompanying Euclid I.47) is largely recognized and supported,even by formalistically inclined mathematicians. Moritz Pasch for instance readilyadmits that figures ‘‘can substantially facilitate the grasp of the relations stated in atheorem and the constructions used in a proof [30, p. 43], my translation.’’ So,even by the standards of Pasch it is legitimate to use a figure to anchor theconceptual content of a mathematical construction.
The controversy only begins when we move to Figs. 2 and 3 above. Here, thefigures are used not only to illustrate, but also to infer new mathematical knowl-edge. The question is whether we can trust this knowledge. What is the epistemicstatus of knowledge deduced from a figure?
Let us begin by discussing the quality of the knowledge deduced from Fig. 2.If we compare the analytic and the pictorial method of determining intersectionpoints, it is clear that the information deduced from the figure is not as precise asthe information obtained by analytic means. Consequently, this use of figures ismainly considered a heuristic tool, and any information deduced from a figureshould be tested by more reliable (i.e. analytic) means. So for instance, in theDanish high-school system a figure such as Fig. 2 is considered a valid method offinding intersection points between two curves, but the solutions read off from thefigure should be tested (by means of the analytic expressions of the curves inquestion) if the solution is to count as a satisfying answer to the problem.
If we move to Fig. 3, the negative evaluation of the knowledge deduced fromthe figure is even stronger. Here, the knowledge deduced from the figure is used asan essential step in a mathematical proof, and that is—by several parties—considered an illegitimate use of pictorial knowledge. Pasch for instance continuesthe quote given above by stating that:
If you are not afraid to spend some time and effort, you can always omit the figure in theproof of any theorem, indeed, a theorem is only really proved if the proof is completelyindependent of the figure. [...] A theorem cannot be justified by figure considerations, onlyby a proof; any inference that appears in the proof must have its counterpart in the figure,but the theorem can only be justified by reference to a specific previously shown theorem(or definition), and not by reference to the figure ([30, p. 43], my translation).
So Pasch would not accept Euclid’s proof of Euclid I.1 as legitimate because avital step in the proof depends on knowledge deduced from a figure. Pasch was notalone in this assessment of figures. It is well-known that David Hilbert shared
Fig. 3 Euclid I.1: How toconstruct an equilateraltriangle on a given linesegment AB
96 M. W. Johansen

Pasch’s viewpoint on this matter (see e.g. [27]), and in the formalist movement aproof is in general considered ‘‘a syntactic object consisting only of sentencesarranged in a finite and inspectable array [34, p. 304]’’. It goes without saying thatfigures do not have a place in such an array.
In recent years this negative evaluation of knowledge deduced from figures hasbeen challenged by amongst others by Marcus Giaquinto [11, 12], Brown [4] andDavis [6]. Thus, Giaquinto accepts Euclid’s use of a figure in the proof of EuclidI.1 on the ground that: 1) the inferences drawn from the figure does not depend onexact properties of the figure and 2) the subject matter of the proof is a homog-enous class of mathematical objects (circles) that have a close relationship to aperceptual concept (perceptual circles, as the ones seen in the figure). Brown andDavis are both even more liberal in their use of figures. Brown [4, p. 25] considersFig. 4 an adequate proof of the intermediate zero theorem (something explicitlyrejected by Giaquinto), and Davis considers Fig. 5 to constitute a valid proof of thetheorem that you cannot cover a circle with a finite number of smaller, non-overlapping circles [6, p. 338].
4.3 Figures and Objects
There are a number of well-known problems connected to the use of figures inmathematical deductions. As noted above, figures might not have the necessaryprecision, and consequently proofs based on figures can be misleading (as Rouse
Fig. 4 Picture proof of theintermediate zero theorem.The theorem states that if acontinuous function f ðxÞdefined on the interval ½a; b�takes both positive andnegative values on theinterval, then there exists ac 2 ½a; b� such that f ðcÞ ¼ 0
Fig. 5 Picture proof that youcannot cover a circle with afinite number of smaller, non-overlapping circles (redrawnfrom [6, p. 338])
What’s in a Diagram? 97

Ball’s famous proof that all triangles are isosceles potently illustrates [2, p. 38]).Furthermore, figures are in some cases over-specified (i.e. you cannot draw ageneral triangle, only a specific one) and in others they lack generality (see [11,p. 137] for more). However, none of these problems can, in my view, justify acomplete ban on the use of knowledge deduced from figures. They merely imposelimitations that should be observed (see also [3]).
To my mind, the main problem concerning the use of figures is connected toanother and cognitively more interesting question: Why can we apparently usefigures to deduce knowledge about mathematical objects at all?
The simple and straightforward answer is that figures somehow resembles themathematical objects they represent; the circles drawn in Fig. 3 simply have alikeness with mathematical circles. Unfortunately, this intuitive idea is faced withseveral problems. Firstly, it seem to presuppose the existence of mathematicalobjects, or in other words Platonism, and secondly even if this presupposition isgranted, it is not clear what it would mean for a physical drawing to resemble aplatonic object. As a way to avoid these problems, I suggest that we see thingsslightly differently. Some mathematical entities such as circles and triangles arenot pre-existing objects, but rather concepts created by us. They are not created atrandom, but are rather abstractions from and idealizations of classes of perceptualobjects and shapes (see [18, p. 163]. See also [12] for a cognitively realisticaccount of how such an abstraction process might in fact be carried out).
Seen in this light, the longer and more correct way of explaining the rela-tionship between a figure and the mathematical objects it represents, is thefollowing: The figure has a direct likeness with the members of the general class ofperceptual objects that provide the abstraction basis for the mathematical objects,the figure represents. Or better still: One could say that some mathematical objectssuch as circles and triangles are attempts to model certain aspects of physicalreality, and that the shapes we see on the figures above have a direct likeness withthe physical objects, the mathematical concepts are used to model. Of course notall mathematical objects have such a direct connection to sense perception, butthen again: not all mathematical objects are naturally represented using figures.
If we see the relationship between perceptual figures and mathematical objectsas suggested above, the real epistemological problem connected to the use offigures becomes clear. If I use information deduced from a perceptual figure inorder to prove a theorem, I have proved the theorem for the wrong kind of objects.I have proven that the theorem holds good for perceptual objects, but not for thecorresponding mathematical ones. Although the mathematical objects are sup-posed to model the perceptual objects, they might not do so perfectly; there mightbe a mistake in the model. In the cases above, we might accidentally have definedmathematical circles and functions in ways that would allow them to have holeswhere the corresponding perceptual figures have intersection points—a functionsuch as f ðxÞ ¼ x2 � 2 defined only on the rational numbers is a very potentexample of such an object (as also pointed out by [12]). The function changes sign
98 M. W. Johansen
on the interval ½0; 2�, but there is no rational number c 2 ½0; 2� such that f ðcÞ ¼ 0.So the intermediate zero theorem does not hold good for this particular function.So it seems that we should be careful when we draw conclusions about mathe-matical objects on the basis of a perceptual figure. At least, we should make surethat the mathematical objects model the relevant properties of the figure in theright way.
This observation on the other hand does not show purely deductive proof to beepistemologically primary to proofs relying on figures. In my view, a figure canprovide ample proof that a theorem holds good for a class of perceptual figures,and consequently the theorem ought to hold good for the mathematical objectsmodeling the class of figures as well. One can to a certain extend see the rigori-zation and axiomatization of mathematics during the 19th century as an attempt tomake this come true. Thus, Hilbert’s and Pasch’s work on geometry was not anattempt to overthrow Euclid, but rather an attempt to make explicit all of theaxioms needed in order to give rigorous proofs of all of the theorems of Euclidiangeometry. Furthermore, as pointed out by Brown [4, p. 25] , something similar canbe said about the proof of the intermediate zero theorem. As it is, the rigorous,formal proof accepted today presupposes the completeness of the real numbersystem (amongst other things). However, this property of the real number systemwas not simply discovered or chosen at random. When the real number system wasrigorously constructed during the 19th century, it was given the property ofcompleteness exactly in order to make it possible to give deductive proofs of theintermediate zero theorem and other theorems presupposing the ‘gaplessness’ ofreal numbered function. Thus, proofs about perceptual figures do not only serve asa heuristic tool helping mathematicians to identify theorems they subsequently cangive deductive proofs. Proofs about figures can serve—or at least have historicallyserved as—a way to point out some of the properties we want our mathematicalobjects and deductive systems to have.
5 Diagrams
Before we begin, it should be realized that the word ‘diagram’ is used to describe amultitude of different external representations. This class of representations is nothomogenous, in part because the terms ‘diagram’ and ‘figure’ are often treated assynonymous. As I see it, there are qualitative differences between figuresdiagrams, and part of my goal with the following analysis is to explain thesedifference in order to introduce a classification of mathematical representationsthat is more in line with their cognitive function.
It should also be noted that a lot of the work previously done on the use ofdiagrams in mathematics has focused on the logically soundness of diagram basedreasoning. This line of work goes back at least to C. S. Peirce (1839–1914), andwas revived in the mid 1990’s, in part by researchers connected to the develop-ment of artificial intelligence (see e.g. [1, 13, 32]. See also [33] for a historical
What’s in a Diagram? 99
overview). The main goal of this program is to create a diagrammatic calculus,that is: a diagram based system of representations and formal transformation rulesthat allows for logically valid reasoning. Judged by its own standards, this programhas been a great success. Several logically valid diagram based reasoning systemshave been produced and some even implemented in computer based reasoningsystems. The success however, has come at a price. Most mathematicians usediagrams as a heuristic tool, but instead of describing and understanding howdiagrams fulfill this role, the program has focused on creating a new and differentrole for diagrams by turning them into a tool for logically valid, formal reasoning.To use the terminology of Sect. 3, the program wants to use diagrams as syntacticobjects, similar to the way symbols are (in part) used. Although valuable in itself,this largely leaves the heuristic power of diagrams unexplained. In my view, thereare qualitative differences between diagrams and symbols, just as there arebetween diagrams and figures, and if we want to understand the role diagrams playin human reasoning, we should acknowledge these differences and not shapediagrammatic reasoning into the paradigm case of logically valid, formaldeduction.
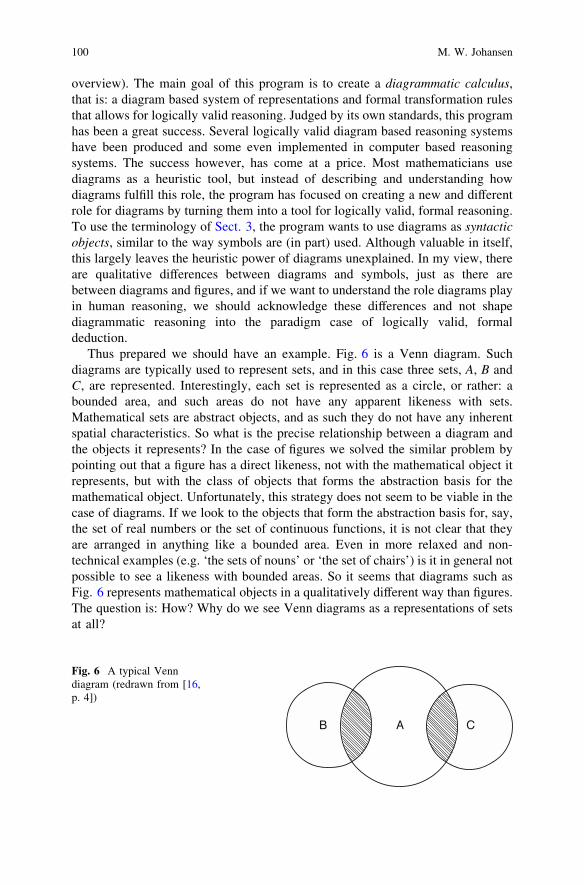
Thus prepared we should have an example. Fig. 6 is a Venn diagram. Suchdiagrams are typically used to represent sets, and in this case three sets, A, B andC, are represented. Interestingly, each set is represented as a circle, or rather: abounded area, and such areas do not have any apparent likeness with sets.Mathematical sets are abstract objects, and as such they do not have any inherentspatial characteristics. So what is the precise relationship between a diagram andthe objects it represents? In the case of figures we solved the similar problem bypointing out that a figure has a direct likeness, not with the mathematical object itrepresents, but with the class of objects that forms the abstraction basis for themathematical object. Unfortunately, this strategy does not seem to be viable in thecase of diagrams. If we look to the objects that form the abstraction basis for, say,the set of real numbers or the set of continuous functions, it is not clear that theyare arranged in anything like a bounded area. Even in more relaxed and non-technical examples (e.g. ‘the sets of nouns’ or ‘the set of chairs’) is it in general notpossible to see a likeness with bounded areas. So it seems that diagrams such asFig. 6 represents mathematical objects in a qualitatively different way than figures.The question is: How? Why do we see Venn diagrams as a representations of setsat all?
Fig. 6 A typical Venndiagram (redrawn from [16,p. 4])
100 M. W. Johansen

In the diagrammatic calculus-program mentioned above it has been suggestedthat there is (or rather: ought to be) a homomorphism between a diagram and theobjects it represents (e.g. [3]). The main function of this description is to explorethe validity of diagrammatic reasoning, not to explore its cognitive nature. Con-sequently, the description does not explain why we effortlessly see certain dia-grams as representations of certain mathematical objects, nor does it explain theheuristic power of diagrams. If we want to understand how diagrams representobjects, we must in my view explore the cognitive function of diagrams.
As I see it, we combine two different cognitive strategies when we use dia-grams. Diagrams are external representations, and as such they can be seen as anexpression of the general cognitive strategy of externalization of mental content,described above. All of the representational forms considered in this paper areexpressions of this strategy. In other words, it is the second strategy that setsdiagrams apart, and that strategy is conceptual mapping.
Conceptual mapping is a general cognitive mechanism where either one con-ceptual domain is mapped onto another, or a third, fictive domain is created byintegrating two different conceptual domains. The first mechanism is usuallyreferred to as ‘conceptual metaphor’ and the second as ‘conceptual blending’. Bothmechanisms are well described in the literature (see e.g. [10, 22]), and theircognitive function in mathematics has been discussed (e.g. [18, 23]), althoughfocus has mainly been on linguistic expressions of such mappings. The main focusand contribution here will be to expand the analysis to cover non-linguisticexpressions of conceptual mappings. I will do this by analyzing the role played byconceptual metaphors in our use of diagrams.
5.1 Elements of the Container Metaphor
In modern mathematics a multitude of different conceptual metaphors are in use.One of these is the SETS ARE CONTAINERS-metaphor, where sets are conceptualizedas containers. It is not hard to find linguistic expressions of the metaphor; mostintroductions to set theory will one way or the other conceptualize sets as con-tainers. As an example, we can look at the textbook Basic Algebra by NathanJacobson. Here, sets are introduced as arbitrary collections of elements, and thebasic properties of and relations between sets are described in the following way:
If A and B 2 PðSÞ (that is, A and B are subsets of S) we say that A is contained in B or is asubset of B (or that B contains A) and denote this as A � B (or B � A) if every element a inA is also an element in B. [...] If A and B are subsets of S, the subset of S of elements c suchthat c 2 A and c 2 B is called the intersection of A and B. We denote this subset as A \ B.If there are no elements of S contained in both A and B, that is, A \ B ¼ ;, then A and Bare said to be disjoint (or non-overlapping) ([16, pp. 3–4]. All emphasis form the original).
Here, sets are clearly described as containers: A set B can contain another set A,and both sets can contain elements etc. However, as sets are arbitrary collections
What’s in a Diagram? 101

of objects, they cannot literally contain anything. Thus, the description of sets ascontainers must be metaphorical. To be more precise, it is an example of acommon conceptual metaphor, where properties from one domain—containers—are mapped onto another domain—sets: in more detail, sets are understood ascontainers, subsets as containers located inside a container, and the elements of aset as objects contained in a container (see [18, p. 174] for further details).
From a cognitive point of view, the main function of this conceptual mapping isto allow us to ground our understanding of sets in our experience of containers. Asit is, most humans have constant experiences with containers. We use containerssuch as bottles and boxes an a daily basis, we move containers around and containthem in other containers (as when we put a bottle in a bag or a Tupperware in therefrigerator). We are ourselves contained in clothes and buildings and contain thefood and liquid we consume. So in sum, we know a lot about containers fromdirect experience (cf. [19, p. 21]).
Mathematical sets on the other hand are abstract objects. We cannot experiencesets directly in any way, but the conceptualizing of sets as containers allows us tomap our experiences with containers onto the domain of sets. This move gives usan intuitive grasp of sets and—more importantly—allows us to recruit ourknowledge about containers when we reason about sets. Conceptual metaphors areinference preserving, so if we know something to be true about containers fromdirect experience, we can simply activate the metaphor and map the conclusiononto the domain of sets. When sets are understood as containers, it is for instanceeasy to see that if a set A is enclosed in another set B, all the elements of A will alsobe elements of B, because we know this to be true of the content of a container Aenclosed in another container B.
5.2 Diagrams as Material Anchors for Conceptual Mappings
It is now time to return to Fig. 6, were three sets were represented as boundedareas. As noted above, bounded areas do not have any direct likeness with sets.Consequently, the circles making up the bounded areas could be seen as abstract orconventional representations, similar to abstract symbols. There is howeversomething more at play in the diagram. Circles, or rather: bounded areas constitutea special type of containers. Unlike some containers, bounded areas can overlap,but otherwise they are encompassed by the same basic logic as containers ingeneral. Now, if we use the SETS ARE CONTAINERS-metaphor to conceptualizemathematical sets as containers, we can see that the circles making up the boundedareas of Fig. 6 are more than arbitrary representations. The circles might not have adirect likeness with mathematical sets, but they do have a direct likeness withcontainers, and when we conceptualize sets as containers, the diagram gets anindirect or metaphorical likeness with mathematical sets as well.
In order to understand and use the diagram we must in other words concep-tualized the mathematical objects, the diagram represents, using a particular
102 M. W. Johansen

conceptual mapping. This, in my view, marks the principal qualitative differencebetween diagrams and the other representational forms discussed above: In con-trast to symbols, diagrams are not abstract representations, and in contrast tofigures, diagrams only have an indirect likeness with the objects, they represent.
Furthermore, we should be aware that Fig. 6 is not only a representation of threesets. It is in fact a diagrammatic proof of the distributive law for set operationsA \ ðB [ CÞ ¼ ðA \ BÞ [ ðA \ CÞ (cf. [16, p. 4]). It can easily be seen that theshaded areas of the diagram corresponds to both A \ ðB [ CÞ andðA \ BÞ [ ðA \ CÞ. Thus, the identity holds good for bounded areas of the plane,and by using the SETS ARE CONTAINERS-metaphor, we can map this inference ontothe domain of sets to get the corresponding set-theoretical identity.
The use of a diagram to support this kind of picture proof draws attention to thedouble nature of diagrams. Diagrams are an expression of our use of conceptualmaps, but they are also external representations, and as such shares some of theproperties of figures and symbols. In particular, diagrams are, similar to figures,able to function as material anchors for conceptual structures. In a diagram, aconceptual structure established via a metaphor or conceptual blend is mappedonto an external, physical structure, whose individual elements serve as proxies forelements of the conceptual structure. Furthermore, the physical structure is glob-ally stable, but locally manipulable. When a diagram is drawn, we can for instanceadd new bounded areas to it or, as it is the case in Fig. 6, shade certain areaswithout altering the overall structure of the diagram. By manipulating andinspecting a diagram we can, due to the underlying conceptual mapping, drawinferences about the objects represented by the diagram (or rather: about theobjects as they are conceptualized under the given metaphor or blend). In the caseabove, the distributive law was for instance verified simply by drawing andinspecting Fig. 6. As in the case of figures, this anchoring property allows us toincrease the complexity of the conceptual structures we are able to work on. So togive the full cognitive characterization, diagrams are material anchors for con-ceptual mappings. In this way, diagrams are—from a cognitive point of view—highly complicated cognitive tools, and they are clearly qualitatively differentfrom both figures and symbols.
As noted above, inferences based on the inspection of a figure can for severalreasons lead to false conclusions. When we turn to inferences based on diagrams,we must add a new entry to the list of possible errors, and that is: inadequacy of themetaphor. When we use a diagram to draw inferences, we reason about themathematical objects taken under a particular metaphorical conception, butunfortunately metaphors can be misleading (in fact, some authors claim theyalways are (see e.g. [17]). In the case of Venn diagrams, the underlying containermetaphor is clearly inadequate in several respects. Firstly, the metaphor does notcapture the mathematically important difference between a set A being a subset ofanother set B and A being an element of B. Secondly, the metaphor might lead tofalse conclusions about the relative size of infinitely large sets. If for instance thenatural numbers and the integers are represented in a Venn style diagram it wouldseem from the diagram that the set of integers is larger than the set of natural
What’s in a Diagram? 103
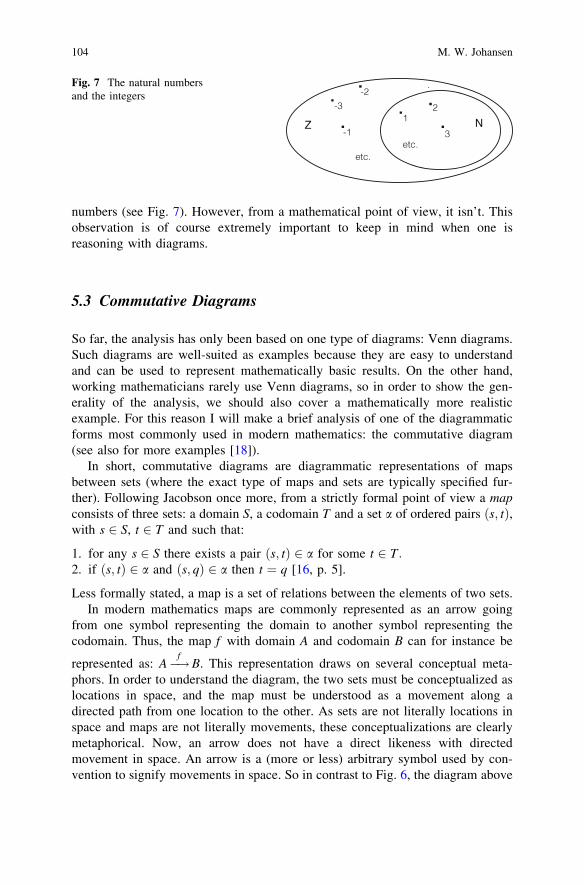
numbers (see Fig. 7). However, from a mathematical point of view, it isn’t. Thisobservation is of course extremely important to keep in mind when one isreasoning with diagrams.
5.3 Commutative Diagrams
So far, the analysis has only been based on one type of diagrams: Venn diagrams.Such diagrams are well-suited as examples because they are easy to understandand can be used to represent mathematically basic results. On the other hand,working mathematicians rarely use Venn diagrams, so in order to show the gen-erality of the analysis, we should also cover a mathematically more realisticexample. For this reason I will make a brief analysis of one of the diagrammaticforms most commonly used in modern mathematics: the commutative diagram(see also for more examples [18]).
In short, commutative diagrams are diagrammatic representations of mapsbetween sets (where the exact type of maps and sets are typically specified fur-ther). Following Jacobson once more, from a strictly formal point of view a mapconsists of three sets: a domain S, a codomain T and a set a of ordered pairs ðs; tÞ,with s 2 S, t 2 T and such that:
1. for any s 2 S there exists a pair ðs; tÞ 2 a for some t 2 T:2. if ðs; tÞ 2 a and ðs; qÞ 2 a then t ¼ q [16, p. 5].
Less formally stated, a map is a set of relations between the elements of two sets.In modern mathematics maps are commonly represented as an arrow going
from one symbol representing the domain to another symbol representing thecodomain. Thus, the map f with domain A and codomain B can for instance be
represented as: A�!f B. This representation draws on several conceptual meta-phors. In order to understand the diagram, the two sets must be conceptualized aslocations in space, and the map must be understood as a movement along adirected path from one location to the other. As sets are not literally locations inspace and maps are not literally movements, these conceptualizations are clearlymetaphorical. Now, an arrow does not have a direct likeness with directedmovement in space. An arrow is a (more or less) arbitrary symbol used by con-vention to signify movements in space. So in contrast to Fig. 6, the diagram above
Fig. 7 The natural numbersand the integers
104 M. W. Johansen

contains both conventional symbols and figural elements that have a direct likenessto the corresponding elements of the metaphor. Consequently, it is what I will calla mixed anchor.
The representation of maps as arrows between sets is especially useful whenseveral maps between several sets are involved. So, three maps between three setscan be represented by the triangle displayed in Fig. 8.
Clearly, Fig. 8 is also a mixed anchor containing both conventional symbolsand figural elements. Notice also that the symbols A, B and C are used not only assemantic objects designating the three sets, but also as purely physical objectsmarking the metaphorical location of the sets in the diagram.
An interesting aspect of this kind of diagrams is the fact that the conceptualmetaphor embodied in the diagram is inadequate in an important respect. In thediagram, a map is represented as a movement between two sets, but from a formalpoint of view, a map is not a relation between two sets, but between the elementsof two sets. This inadequacy has important consequences. According to Fig. 8,I can get from A to C in two ways: I can either go by the f —and then by theh-arrow, or I can go directly by taking the g-arrow. From this, it seems that thecomposition h � f of f and h is equal to g. However, this might not hold good.From a mathematical point of view the composition of f and h is only equal to g ifthe composition, for any elements in A, will take me to the same element in C as g(i.e. 8x 2 A : ðh � f ÞðxÞ ¼ gðxÞ). If this is the case, the diagram is said to commute.
In order to complete the cognitive analysis, we should also notice thatcommutative diagrams are locally manipulable, but globally stable. We can easilyadd new locations (i.e. sets) or new arrows (i.e. maps) to the diagram withoutdisturbing the overall stability of the representation.
Furthermore, commutative diagrams can be used to infer new knowledge aboutthe objects, they represent. If we know, say, that both square ABDE and squareBCEF in Fig. 9 commutes (i.e. j � f ¼ m � h and k � g ¼ n � j), then from thediagram we can easily infer that the whole square commutes as well (intuitively,that you can go form A to F by any route you want).
Finally, commutative diagrams can also be used to anchor very complicatedconceptual structures. A good example is the so-called five lemma. I will not gointo the mathematical details, as they are inconsequential for our purposes (see e.g.[9]). The lemma states that for a certain types of sets (such as abelian groups), themap n is of a particular type, if a number of conditions are met (the rows must beexact and the maps k;m; p and q must be of particular types). The content of thislemma is often illustrated with a commutative diagram similar to Fig. 10.
Fig. 8 Representation ofthree maps between three sets
What’s in a Diagram? 105
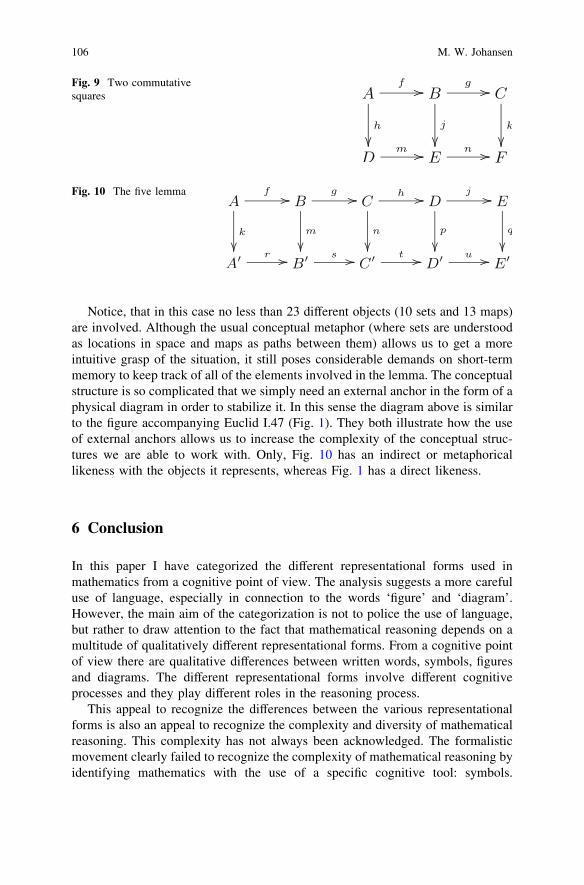
Notice, that in this case no less than 23 different objects (10 sets and 13 maps)are involved. Although the usual conceptual metaphor (where sets are understoodas locations in space and maps as paths between them) allows us to get a moreintuitive grasp of the situation, it still poses considerable demands on short-termmemory to keep track of all of the elements involved in the lemma. The conceptualstructure is so complicated that we simply need an external anchor in the form of aphysical diagram in order to stabilize it. In this sense the diagram above is similarto the figure accompanying Euclid I.47 (Fig. 1). They both illustrate how the useof external anchors allows us to increase the complexity of the conceptual struc-tures we are able to work with. Only, Fig. 10 has an indirect or metaphoricallikeness with the objects it represents, whereas Fig. 1 has a direct likeness.
6 Conclusion
In this paper I have categorized the different representational forms used inmathematics from a cognitive point of view. The analysis suggests a more carefuluse of language, especially in connection to the words ‘figure’ and ‘diagram’.However, the main aim of the categorization is not to police the use of language,but rather to draw attention to the fact that mathematical reasoning depends on amultitude of qualitatively different representational forms. From a cognitive pointof view there are qualitative differences between written words, symbols, figuresand diagrams. The different representational forms involve different cognitiveprocesses and they play different roles in the reasoning process.
This appeal to recognize the differences between the various representationalforms is also an appeal to recognize the complexity and diversity of mathematicalreasoning. This complexity has not always been acknowledged. The formalisticmovement clearly failed to recognize the complexity of mathematical reasoning byidentifying mathematics with the use of a specific cognitive tool: symbols.
Fig. 9 Two commutativesquares
Fig. 10 The five lemma
106 M. W. Johansen
Although the formalistic movement has been challenged in recent decades, theexact quality of and difference between the various representational forms used inmathematics is still not well understood. From this paper it should be clear thatthere are several important differences between written words, symbols, figuresand diagrams, and the main attraction of the cognitive perspective applied here isexactly the fact that it makes it possible for us to see and understand thesedifferences.
References
1. Allwein, G., Barwise, J. (eds.): Logical Reasoning with Diagrams. Oxford University Press,Oxford (1996)
2. Ball, W.W.R.: Mathematical Recreations and Essays, 4th edn. Maxmillan and Co, London(1905)
3. Barwise, J., Etchemendy, J.: Heterogeneous logic. In: Glasgow, J., Narayanan, N.H.,Chandrasekaran, B. (eds.) Diagrammatic Reasoning: Cognitive and ComputationalPerspectives, pp. 211–234. MIT Press, Cambridge (1995)
4. Brown, J.R.: Philosophy of Mathematics: An Introduction to a World of Proofs and Pictures.Routledge, London (1999)
5. Clark, A. Magic words: how language augments human computation. In: Carruthers, P.,Boucher, J. (eds.) Language and Thought: Interdisciplinary Themes, PP. 162–183.Cambridge University Press, Cambridge (1998)
6. Davis, P.J.: Visual theorems. Educ. Stud. Math. 24(4), 333–344 (1993)7. De Cruz, H.: Mathematical symbols as epistemic actions—an extended mind perspective.
Unpublished on-line working paper (2005)8. de Cruz, H.: Innate Ideas as a Naturalistic Source of Mathematical Knowledge. Vrije
Universiteit Brussel, Brussel (2007)9. Eilenberg, S., Steenrod, N.: Foundations of Algebraic Topology. Princeton University Press,
Princeton (1952)10. Fauconnier, G., Turner, M.: The Way We Think: Conceptual Bending and the Mind’s Hidden
Complexities. Basic Books, New York (2003)11. Giaquinto, M.: Visual Thinking in Mathematics:an Epistemological Study. Oxford University
Press, Oxford (2007)12. Giaquinto, M.: Crossing curves: a limit to the use of diagrams in proofs. Philosophia.
Mathematica. 19(3), 281–307 (2011)13. Glasgow, J., Narayanan, N.H., Chandrasekaran, B.: Diagrammatic Reasoning: Cognitive and
Computational Perspectives. AAAI Press, Cambridge (1995)14. Heath, T.L.: The Thirteen Books of Euclid’s Elements. Barnes & Nobel, Inc., New York
(2006)15. Hutchins, E.: Material anchors for conceptual blends. J. Pragmatics 37(10), 1555–1577
(2005)16. Jacobson, N.: Basic Algebra, 2nd edn. W.H. Freeman and Company, New York (1985)17. Jensen, A.F.: Metaforens magt. Fantasiens fostre og fornuftens fødsler. Modtryk, Aarhus C
(2001)18. Johansen, M.W.: Naturalism in the Philosophy of Mathematics. Ph.D. thesis, University of
Copenhagen, Faculty of Science, Copenhagen (2010)19. Johnson, M.: The Body in the Mind: The Bodily Basis of Meaning, Imagination, and Reason.
University of Chicago Press, Chicago (1990)20. Kirsh, D.: Thinking with external representations. AI & Soc. 25(4), 441–454 (2010)
What’s in a Diagram? 107

21. Kirsh, D., Maglio, P.: On distinguishing epistemic from pragmatic action. Cogn. Sci. 18(4),513–549 (1994)
22. Lakoff, G., Johnson, M.: Metaphors We Live By. University of Chicago Press, Chicago(1980)
23. Lakoff, G., Núñez, R.: Where Mathematics comes from: How the Embodied Mind BringsMathematics into Being. Basic Books, New York (2000)
24. Larvor, B.: Syntactic analogies and impossible extensions. In: Löve, B., & Müller, T. (eds.)PhiMSAMP. Philosophy of Mathematics: Sociological Aspects and Mathematical Practice.Texts in Philosophy, vol. 11, pp. 197–208. College Publications, London (2010)
25. Magnani, L.: Conjectures and manipulations: external representations in scientific reasoning.Mind Soc. 3(1), 9–31 (2002)
26. Magnani, L.: External diagrammatization and iconic brain co-evolution. Semiotica 186,213–238 (2011)
27. Mancosu, P.: Visualization in logic and mathematics. In: Mancosu, P., Jørgensen, K.F.,Pedersen, S.A. (eds.) Visualization, Explanation and Reasoning Styles in Mathematics,pp. 13–30. Springer, Dordrecht (2005)
28. Manders, K.: Diagram based geometric practice. In: Mancosu, P. (ed.) The Philosophy ofMathematical Practice, pp. 65–79. Oxford University Press, Oxford (2010)
29. Messer, R.: Linear Algebra: Gateway to Mathematics. HarperCollins College Publishers,New York (1994)
30. Pasch, M., ehn, M.: Vorlesungen über neuere Geometrie. Die Grundlehren dermathematischen Wissenschaften, vol. 23. Springer, Berlin (1882/1926)
31. Reviel, N.: The Shaping of Deduction in Greek Mathematics: a Study in Cognitive History.Ideas in Context. Cambridge University Press, Cambridge (1999)
32. Shin, S.J.: The Logical Status of Diagrams. Cambridge University Press, Cambridge (1994)33. Shin, S.J., Lemon, O.: Diagrams. In: Zalta, Edward N. (ed.) The Stanford Encyclopedia of
Philosophy, winter 2008 edn. http://plato.stanford.edu/archives/win2008/entries/diagrams/(2008)
34. Tennant, N.: The withering away of formal semantics? Mind & Lang. 1(4), 302–318 (1986)
108 M. W. Johansen