what shakespeare taught us about (visual) data science
TRANSCRIPT

What Shakespeare Taught Us About Visualizationand Data Science
Michael GleicherDepartment of Computer SciencesUniversity of Wisconsin Madison

Acknowledgements
Visualizing English Print ProjectCo-PisMichael Witmore (Folger Library)Jonathan Hope (Strathclyde University)Robin Valenza (UW English)
VEP Students and StaffEric Alexander, Deidre Stuffer, Erin Winter, Hao Fu, Joe Kohlmann, …Jonathan’s students (Heather, Beth, …)Robin’s students (Mattie, Cathy, …)
Other Vis Collaborators
My Students (past and present)Danielle Szafir, Michael Correll, Alper Sarikaya, …
Perception and HCI CollaboratorsSteve Franconeri, Bilge Mutlu, Chuck Hansen, and their students
Other Domain CollaboratorsGeorge Phillips, Dave O’Connor, Colin Dewey, …

It’s a team effortLesson 1
I’m not the Shakespeare ExpertLesson 1b

So… why am I here?

Michael GleicherVisual Computing Group
Human Graphics Interactionauthoring pictures, videos, animations
Human Robot Interactionrobots!
Human Data Interactionvisualization, visual analytics, interactive learning
`

Data Visualization
Visual Analytics
Human Data Interaction

Visualization is not ( just) about making pictures
Data Science is not ( just) about doing statistics
They are (also) about Human-Data Interaction
Lesson 2

What Shakespeare Taught Us About Visualizationand Data Science
Michael GleicherDepartment of Computer SciencesUniversity of Wisconsin Madison

Caveats

This is not a talk about Shakespeare
But he makes for a catchy title
It is a talk about a collaboration with literary scholars
With the goal of getting beyond Shakespeare(Early Modern Period 1470-1700)(Or is that 1470-1660? Or 1800?)
https://commons.wikimedia.org/wiki/File:Shakespeare_engraving_1787cropped.jpg

This is not a talk about Digital Humanities
This is about a collaboration with literature scholars.
What can the rest of us learn?
Why experience with Literary Scholarship?
Why not experience with Biochemistry, Virology, Robotics, … ?

Rakita, Mutlu and Gleicher. Motion Synopsis for Robot Arm Trajectories,IEEE ROMAN 2016.

Sarikaya, Albers, Mitchel and Gleicher. Visualizing Validation of Protein Surface Classifiers.Computer Graphics Forum. Proceedings EuroVis 2014

It’s nice to have an application that people are interested in
Lesson 3
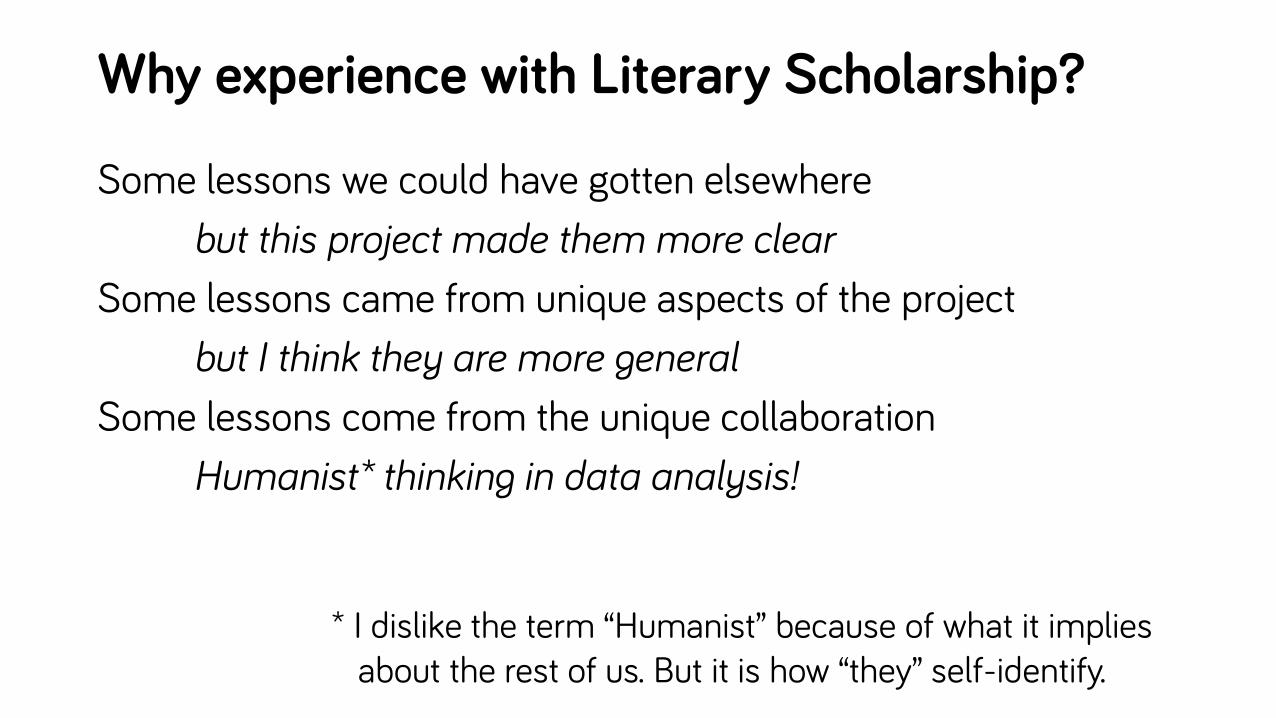
Why experience with Literary Scholarship?
Some lessons we could have gotten elsewherebut this project made them more clear
Some lessons came from unique aspects of the projectbut I think they are more general
Some lessons come from the unique collaborationHumanist* thinking in data analysis!
* I dislike the term “Humanist” because of what it impliesabout the rest of us. But it is how “they” self-identify.

Mike’s Mantra
Until we take the time to learn about how the other side thinks, we can’t really work together.
Once we learn how each other thinks, our ways of thinking can infuse each other’s.
This is not just building tools for our friends.It’s a lot more fun and interesting

Working with Literary Scholars
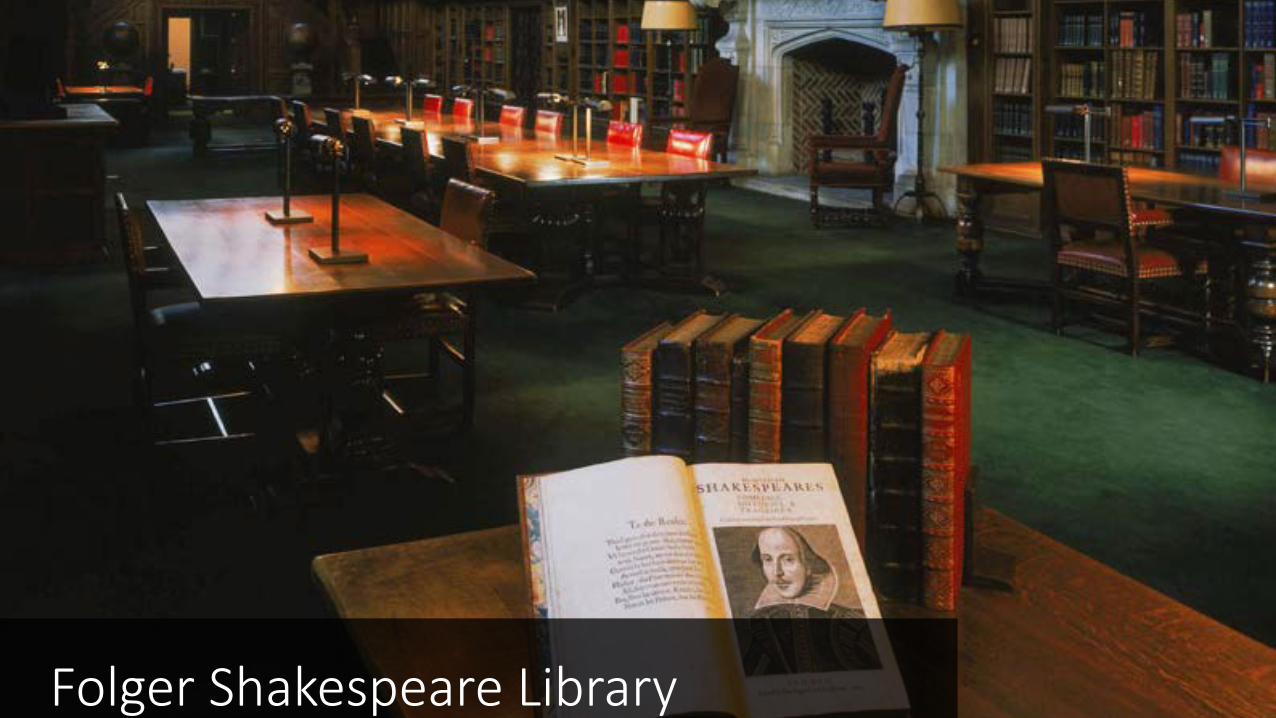
Folger Shakespeare Library


When shall we three meet againe?In Thunder, Lightning, or in Raine?

Some Lessons from “Humanist” Thinking
They got along fine before “data-centric” thinking
Importance of exemplars and outliersImportance of going back to the source (specific passages)Value of multiple points of viewContextualized arguments with lots of backgroundEditing and curation are scholarly activities
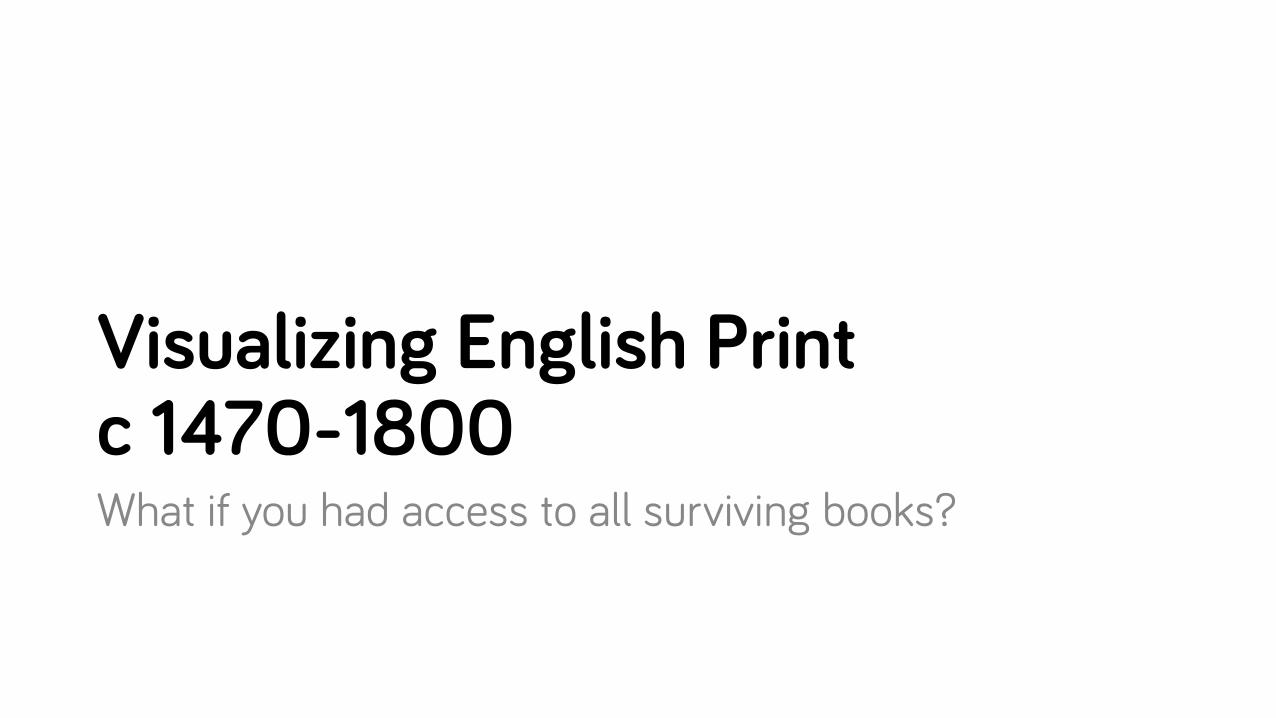
Visualizing English Printc 1470-1800What if you had access to all surviving books?

Visualizing English print (VEP)
Large collections of texts becoming available to scholarsHow to enable (traditional) literary scholars to use it?
Problem Factory:What questions should/could one ask?How do you ask those questions?What tools to provide to help?What can we learn about Visualization / Data Science?

Why? (what is in it for literature)
Consider larger collections of booksbeyond the “canon”
See language develop (independent of content)
See developments over decades
See patterns too subtle for people to pick up


One journal cover imageleads to (at least) three challenges
The axes are meaningless!Explainers – crafted projectionsVAST 2013
Can people interpret this?Perception of average value in scatterplotsInfoVis 2013
The scatterplot has too many points!Splatterplots – scalable scatterplotsTVCG 2013

Vis research success stories
Text ViewerCorrell et al, EuroVis 2011
TextDNASzafir et al, EuroVis 2016
SerendipAlexander et al, VAST 2014 Explainers
Gleicher, VAST 2013
Topic Model ComparisonAlexander et al, VAST 2015
Sketch-based searchCorrell et al, VAST 2016
SplatterplotsMayorga & Gleicher 2013Sarikaya & Gleicher 2015
And others…

What is visualization reseach?

Perceptual Studies Technique Designs
Systems Explorations of Principles

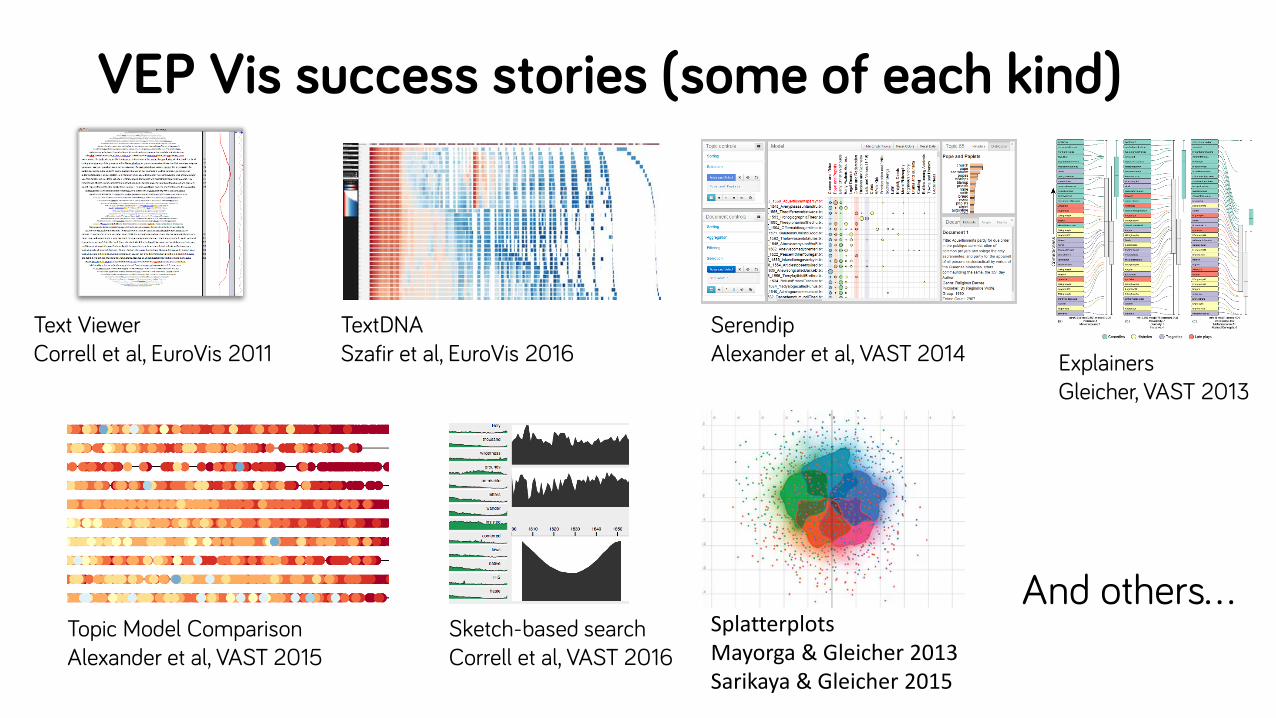
VEP Vis success stories (some of each kind)
Text ViewerCorrell et al, EuroVis 2011
TextDNASzafir et al, EuroVis 2016
SerendipAlexander et al, VAST 2014 Explainers
Gleicher, VAST 2013
Topic Model ComparisonAlexander et al, VAST 2015
Sketch-based searchCorrell et al, VAST 2016
SplatterplotsMayorga & Gleicher 2013Sarikaya & Gleicher 2015
And others…

What can you do with too many points?

Which Color Point is Higher on Average?
Gleicher, M., Correll, M., Nothelfer, C. and Franconeri, C. “Perception of Average Value in Multiclass Scatterplots.” InfoVis 2013

How did you do that?

Visual Aggregation
People can extract summary statistics
Which Ones?Efficiently?Accurately?How?
What can we do with it?Why should we use it?

Visual Aggregation
Empirical UnderstandingAverages in Time Series
Correll, et al. CHI 2012
Tagged TextCorrell, et al. CHI 2013
Scatterplot AveragesGleicher, et al. InfoVis 2013
Other statistics in Time SeriesAlbers, et al. CHI 2014
Practical ApplicationSequence Surveyor (Genetics)
Albers, et al. InfoVis 2011
LayerCake (Virus mutations)Correll, et al. BioVis 2011
Molecular Surface ExperimentsSarikaya, et al. EuroVis 2014
Decision MakingCorrell, et al. (submitted)

Problem: Scatterplot with way too many points!
Mayorga and Gleicher. Splatterplots : Overcoming Overdraw in Scatter Plots. IEEE Trans Visualization and CG, 19:9, 2013

Solution: Splatterplot
Mayorga and Gleicher. Splatterplots : Overcoming Overdraw in Scatter Plots. IEEE Trans Visualization and CG, 19:9, 2013


This is pretty!But when should we use it?
Lots of choicesNeed actionable advice

Scatterplots are commonLots of designsHow do we choose? Task oriented analysis
Ask Dr. Scatterplot!Alper Sarikaya dissertation defense tomorrow
Sarikaya and Gleicher. Scatterplots: Tasks, Data, and Designs. IEEE Trans Vis and CG, 2018. (accepted to InfoVis, to appear)
VEP Vis success stories (some of each kind)
Text ViewerCorrell et al, EuroVis 2011
TextDNASzafir et al, EuroVis 2016
SerendipAlexander et al, VAST 2014 Explainers
Gleicher, VAST 2013
Topic Model ComparisonAlexander et al, VAST 2015
Sketch-based searchCorrell et al, VAST 2016
SplatterplotsMayorga & Gleicher 2013Sarikaya & Gleicher 2015
And others…

But are there bigger lessons?
I learned a lot from this

Three interesting aspects of VEP
Literary scholarship – and ways of thinkingLiterary scholars – with their needs and abilities300 years of old books – variety and quality

300+ years of books
A period of intense changes:cultural, historical, intellectual, political, …
How does the printed record reflect this?The language changed a lotPrinting changed a lotThe book business changed a lotLibraries changed a lot
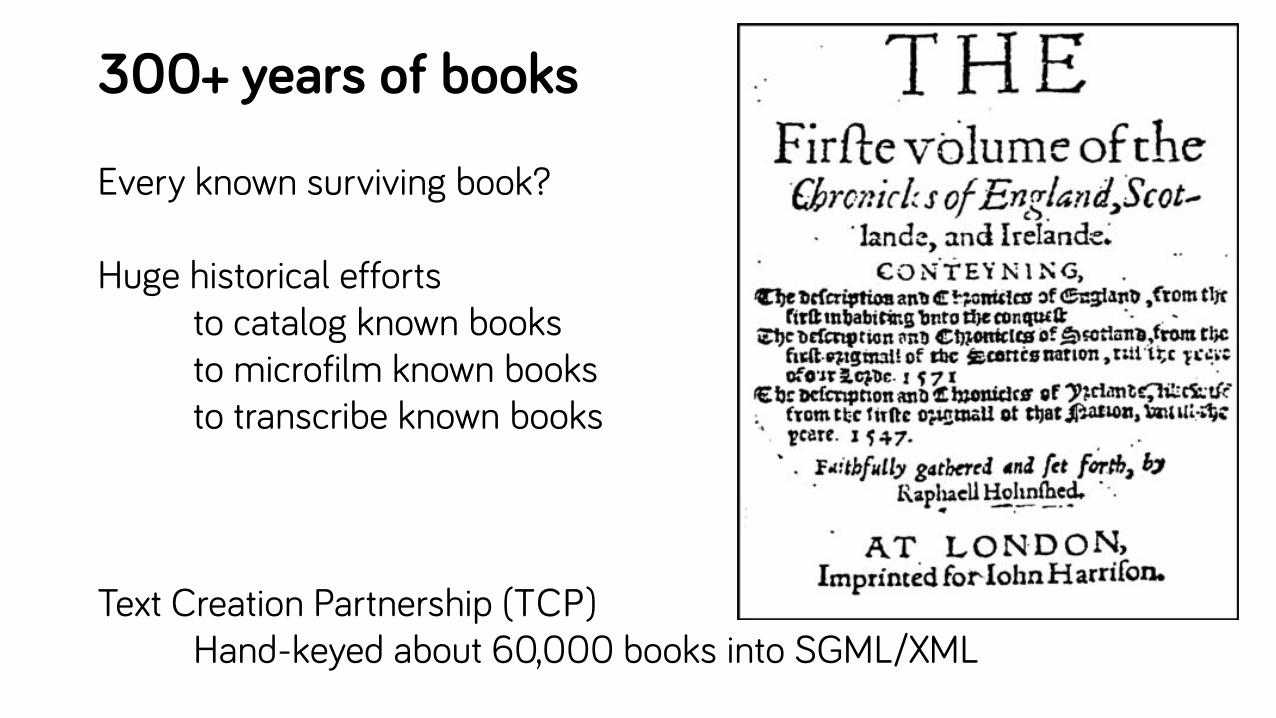
300+ years of books
Every known surviving book?
Huge historical efforts to catalog known booksto microfilm known booksto transcribe known books
Text Creation Partnership (TCP)Hand-keyed about 60,000 books into SGML/XML


Sources of variation
Variety of topicsAuthors’ thoughts and ideasAuthors’ wordsPrinters’ practicalityLibrarians’ taking care of booksTranscribers translating books
Modern processing tools handling things correctly

It’s naïve to spell naïve with an i
Did the author use an ï ?Did the printer have it?Did the dots get smudged?Did the microfilming make it look like a dust mark?Did the transcriber see it?Did they encode it weirdly that year?Did our Unicode pipeline mess it up?Did our spelling standardizer get it wrong?

One form of variation can obscure anotherBut…
One person’s noise is another’s data
spelling obscures ideasor
observe the development of spelling
rotting pages obscure contentor
preserved books tell us what was valued
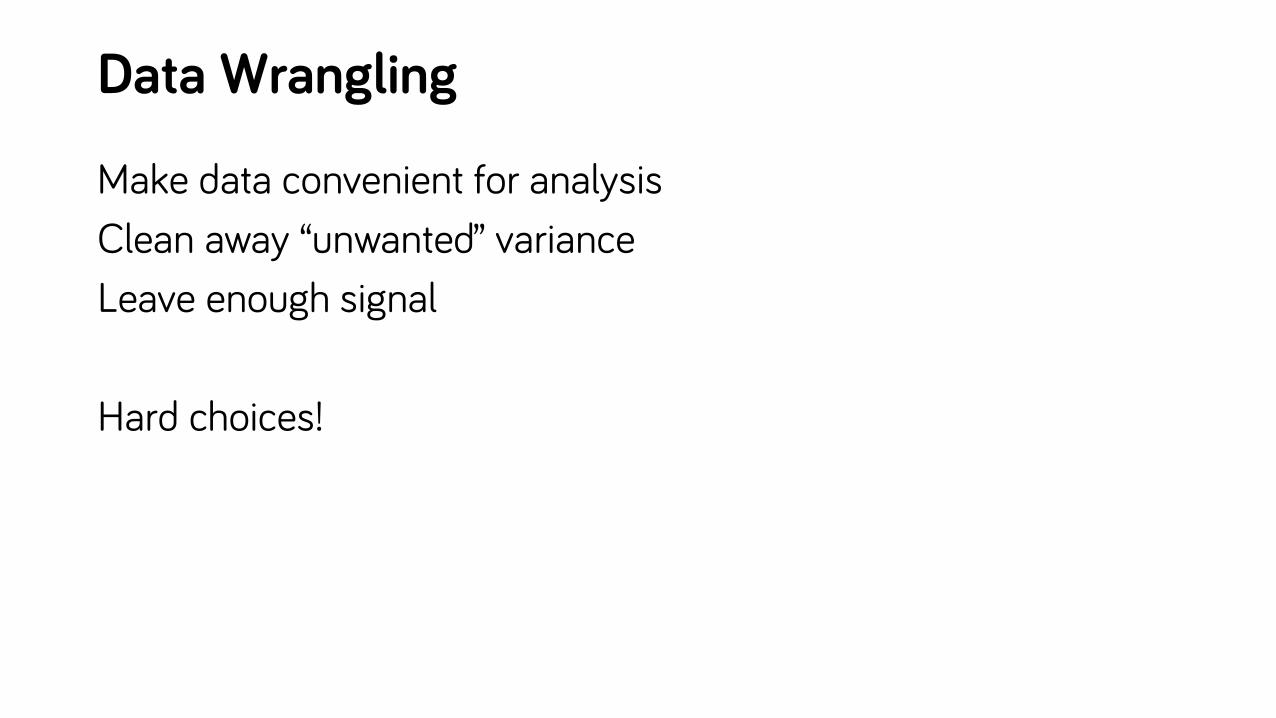
Data Wrangling
Make data convenient for analysisClean away “unwanted” varianceLeave enough signal
Hard choices!
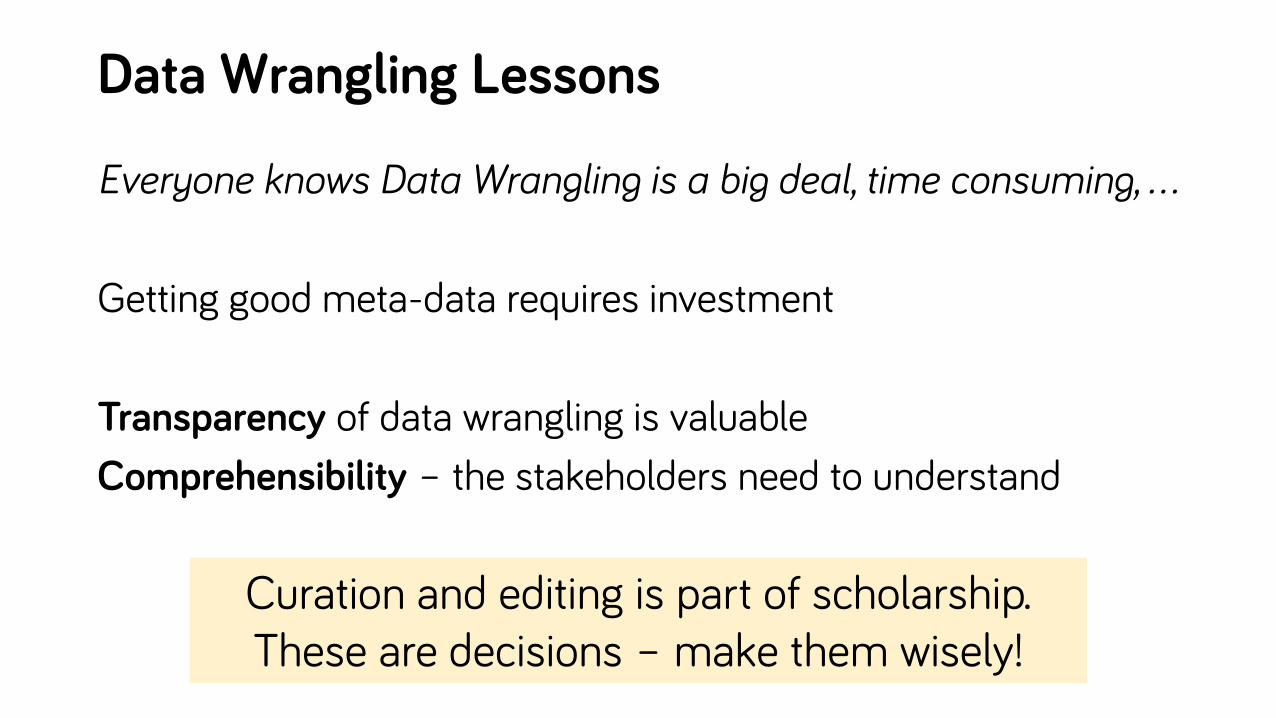
Data Wrangling Lessons
Everyone knows Data Wrangling is a big deal, time consuming, …
Getting good meta-data requires investment
Transparency of data wrangling is valuableComprehensibility – the stakeholders need to understand
Curation and editing is part of scholarship.These are decisions – make them wisely!

A view of Data Wrangling (or cleanup)
It’s about variation:variation is what we’re interested in
in order to expose the variation you care aboutyou need to clean away the variation you don’t
Curation and editing are part of scholarship.These are decisions – make them wisely!

A case study…

Counting “the”
It is interesting at scaleLook for correlations across huge amounts of literature!
It is transparentwe can explain – and check – every step
It’s still hard to get right…Just because counting is easy – doesn’t mean anything else is

Some literature theory…
Writing about things in the world (Extra-Subjective)vs.
Writing about abstract things (Intra-Subjective)
How does this play out over 300 years, 60,000 documents, … ?
How does this play out over plays?about 1500 documents- that we have lots of meta-data on

Extra-Subjective vs. Intra-Subjective
Is there an easy way to measure it?
Statistical analysis:The primary variance in the collection is correlated with labels (science, plays)
The main source of this variance is the most common word

Count “the” ?Use definite articles to refer to objects in the world
Science uses it more than Plays
We only have (extensive) labels for science and playsMost things are unlabeled

Count “the” ?

23% “the” – really?
A plain and easy rule to riggeany ship by the length of his masts, and yards, without any further trouble
23% “the” ?

51% “the” if you count differently
AN EXACT LIST OF THE FRENCH Fleet and Commanders For this Present YEAR
51% of “words” – only counting things we recognize as words

Why is this hard?
We need to carefully treat each book in a uniform wayWhich words do we extract off the pages?
We need to carefully treat each word in a uniform wayHow to deal with bad characters and spelling variation?
We need to analyze in a uniform and transparent wayWe need good meta-data
The scholars (and their audience) must understand each step!We need to get back to the sources!

Data Science is a processChallenges are everywhere!
Big lesson:
We must help all users understand all phases of the process
Big lesson:

We must help all users understandall phases of the process
Big lesson:

Towards Comprehensibility in ModelingThe other title for this talk

Data Science is a Process
There are lots of steps
Many provide challengesMany provide opportunities
Identify ProblemGather DataClean DataAbstractDesignBuildEvaluate/ValidateInterpretActDisseminate

Comprehensibility across the ProcessWho?Stakeholders
DevelopersData ScientistsDomain ExpertsAudienceSubjects
Where?Phase of the Process
Identify ProblemGather DataClean DataAbstractDesignBuildEvaluateInterpretDisseminate
Why?Reason for Wanting
Improve PerformanceBuild TheoryExtend/CharacterizeBuild TrustActionabilityConvince
Gleicher, M. A Framework for Comprehensibility in Modeling. Big Data, January 2016.

Who? Why? Where?(for How? and What? See the paper)Who?Stakeholders
DevelopersData ScientistsDomain ExpertsAudienceSubjects
Where?Phase of the Process
Identify ProblemGather DataClean DataAbstractDesignBuildEvaluateInterpretDisseminate
Why?Reason for Wanting
Improve PerformanceBuild TheoryExtend/CharacterizeBuild TrustActionabilityConvince
Gleicher, M. A Framework for Comprehensibility in Modeling. Big Data, January 2016.

Some phases for comprehensibility
Data Wranglingunderstand what data the data is and what it can do
Model Buildingunderstand classifiers to build theory / identify items
Validation Experimentsunderstand experiments to identify items / build trust

Towards Comprehensibility in ModelingThis is not just comprehensible models

genre
Comedy Tragedy History
Late Plays
Categorization given by Shakespeare’s contemporaries
Category for plays written after that

data
Count words
Count kinds of words – using dictionariesDocuscope (Igarashi and Kaufer)Lists of phrases for each “Language Action Type”Simple and Transparent dictionary matching
(once the dictionaries are made)
Fancier methods (Topic Models, Machine Learning, …)

Is “the” good enough?
Histories and Tragedies are more externalComedies are more internal
The second most common word, “I”, might be better (it is for internal)
600 plays of Shakespeare’s era

Neither is great, maybe try combining them?
The I

Mathematical Models
“the” – “I” --- pretty good(“the” + “to”) – (“I” + “a”) --- very good
How do we come up with such equations?What do we do with them?
Machine Learning Classification:Make up these function so that one “class” is highThe other classes are low

Comprehensibility in modeling?
They may never understand Support Vector Machines(or choose your favorite buzzword)
But they might understand what it does…

Use Models for Insight
We know the answers!Teaching the machine can help us:
Can you pick apart known groups?
Does the data capture the concepts?Language features vs. genre
Can we quantify and organize? (comedic-ness)

Comedicness
A measure of how much of a comedy something is
It’s the “stuff” comedies have more ofWhere “stuff” has to be in the data
Organization:What is most/least comedic? Explanation:How is the word usage (measured stuff) different in comedies?
Comedy
Tragedy
History
Late Plays
<

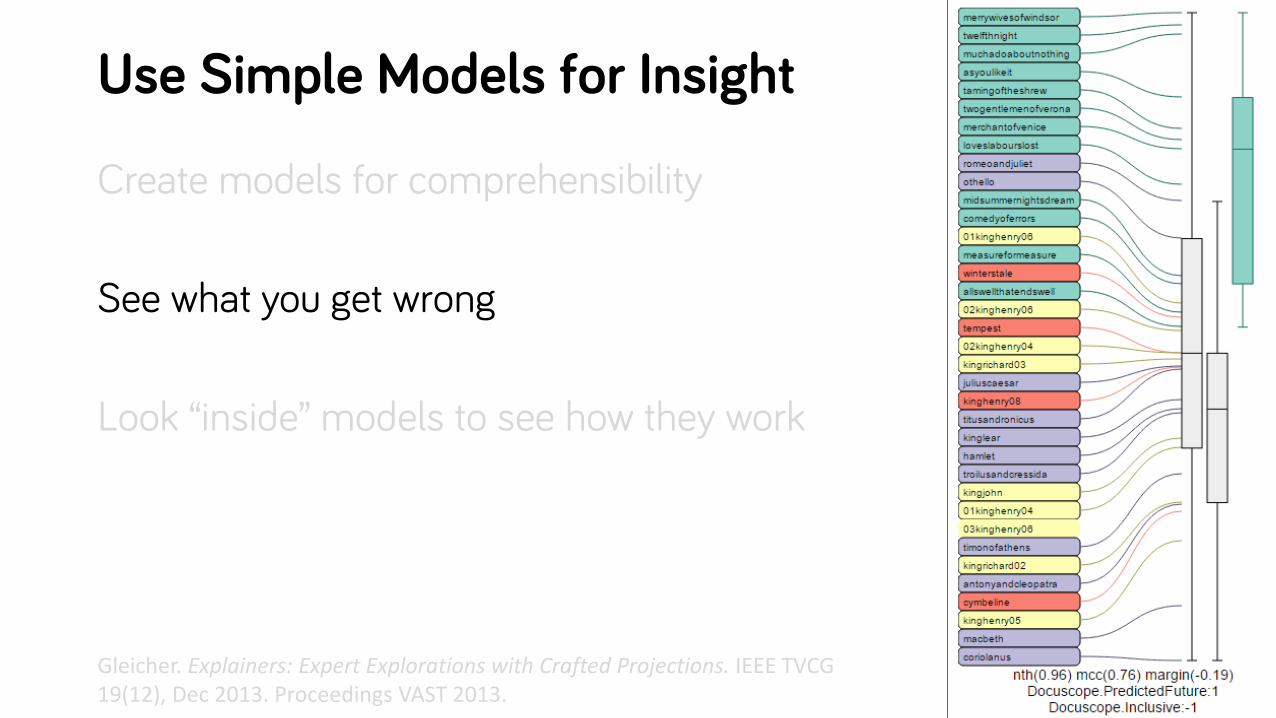
Use Simple Models for Insight
Create models for comprehensibility
See what you get wrong
Look “inside” models to see how they work
Gleicher. Explainers: Expert Explorations with Crafted Projections. IEEE TVCG 19(12), Dec 2013. Proceedings VAST 2013.

comedicness = M – If(V) = V[39] – V[42]
M = Predicted FutureI = Inclusiveness
36 plays of Shakespeare, Docuscope Features
twelfthnight
muchadoaboutnothing
twogentlemenofverona
asyoulikeit
merrywivesofwindsor
tamingoftheshrew
merchantofvenice
loveslabourslost
romeoandjuliet
othello
measureformeasure
tempest
comedyoferrors
winterstale
midsummernightsdream
kinghenry08
02kinghenry06
allswellthatendswell
kinglear
02kinghenry04
hamlet
kingrichard03
titusandronicus
timonofathens
troilusandcressida
01kinghenry06
kingjohn
juliuscaesar
cymbeline
03kinghenry06
kingrichard02
01kinghenry04
anthonyandcleopatra
macbeth
kinghenry05
coriolanus


M – I (5 wrong)C – B – I (4 wrong)C – I – 10 M (1 wrong)31 D – 100 M – 3 A (none wrong)
“standard” L1 SVM (none wrong, reasonable margin)25.3698 Q + 11.8823 U + 6.9492 F + 5.4897 A + 4.1489 P -3.3765 N + 2.6392 D + 2.0172 F - 1.5404 I + 1.1864 R - 0.7958 C + 0.7272 D

Simpler Functions
Easier to Understand
More likelyto lead to Theory
Less Expressive
Less Likely to be Accurate
(but more likely to overfit)
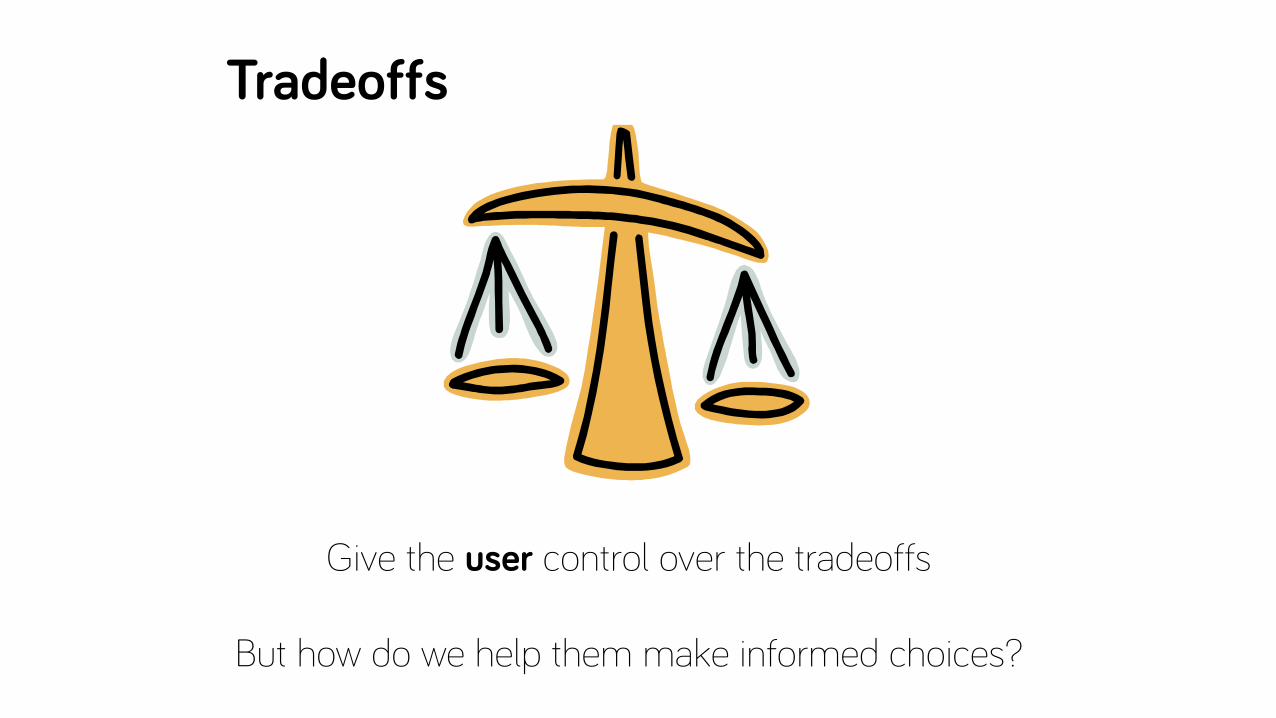
Tradeoffs
Give the user control over the tradeoffs
But how do we help them make informed choices?

Wrong?
Interesting Outliers“Romeo and Juliet” is pretty comedic
Ambiguous ClassificationsLate Plays are called Tragi-Comedies
Near-MissesA tiny shift, and this would be different
twelfthnight
muchadoaboutnothing
twogentlemenofverona
asyoulikeit
merrywivesofwindsor
tamingoftheshrew
merchantofvenice
loveslabourslost
romeoandjuliet
othello
measureformeasure
tempest
comedyoferrors
winterstale
midsummernightsdream
kinghenry08
02kinghenry06
allswellthatendswell
kinglear
02kinghenry04
hamlet
kingrichard03
titusandronicus
timonofathens
troilusandcressida
01kinghenry06
kingjohn
juliuscaesar
cymbeline
03kinghenry06
kingrichard02
01kinghenry04
anthonyandcleopatra
macbeth
kinghenry05
coriolanus
Use Simple Models for Insight
Create models for comprehensibility
See what you get wrong
Look “inside” models to see how they work
Gleicher. Explainers: Expert Explorations with Crafted Projections. IEEE TVCG 19(12), Dec 2013. Proceedings VAST 2013.

Good tools for exploring your results are useful.
Lesson

Is literature unique?Large library has evolvedUnderstanding different kinds of variationBringing in other knowledgeLook at specific examples and outliersDrill into detailsLearn from validation experiments
Get stakeholders involved inall data science phases by helping them understand
Some Lessons from “Humanist” Thinking
They got along fine before “data-centric” thinking
Importance of exemplars and outliersImportance of going back to the source (specific passages)Value of multiple points of viewContextualized arguments with lots of backgroundEditing and curation are scholarly activities

DiversityF + Q – IC – M – IP + N + D
Same:CorrectnessSimplicity
Different:ExplanationsOrderings

Maybe Literature Scholars aren’t so weird?
They got along fine before “data-centric” thinking
Importance of exemplars and outliersImportance of going back to the source (specific passages)Value of multiple points of viewContextualized arguments with lots of backgroundEditing and curation are scholarly activities

OK, some things are weird

But, this might be a lesson …
Don’t just give “them” your methods
If you listen carefully, they might have things to teach you

What Shakespeare taught us about (Visual) Data Science
Michael GleicherUniversity of Wisconsin [email protected]
Thanks!To you for listening.To my students and collaborators.To the NSF, NIH and Mellon Foundation for funding.